Information Representation Need to break representations into component forms, for analysis and for...
53
Information Representation • Need to break representations into component forms, for analysis and for design • Establish a common language for discussion • Few frameworks available
-
Upload
payton-small -
Category
Documents
-
view
219 -
download
5
Transcript of Information Representation Need to break representations into component forms, for analysis and for...
Information Representation
• Need to break representations into component forms, for analysis and for design
• Establish a common language for discussion
• Few frameworks available
Wood’s levels of Representation
• Workspace
• Views
• Graphic Forms
• Graphic Fragments
• The Graphic Atom
Workspace
• A coordinated set of view and the global relationships between them.
• Design decisions: salience of process views, organisation and arrangement of process views, positioning of viewports, size and background
• overall display issues, navigation
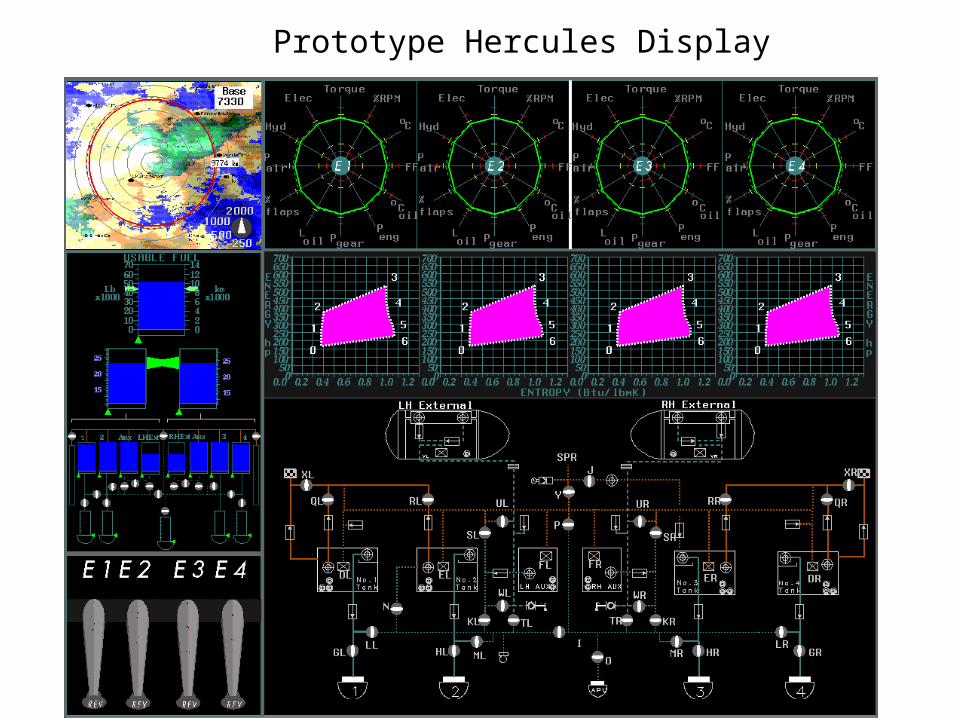
Prototype Hercules Display
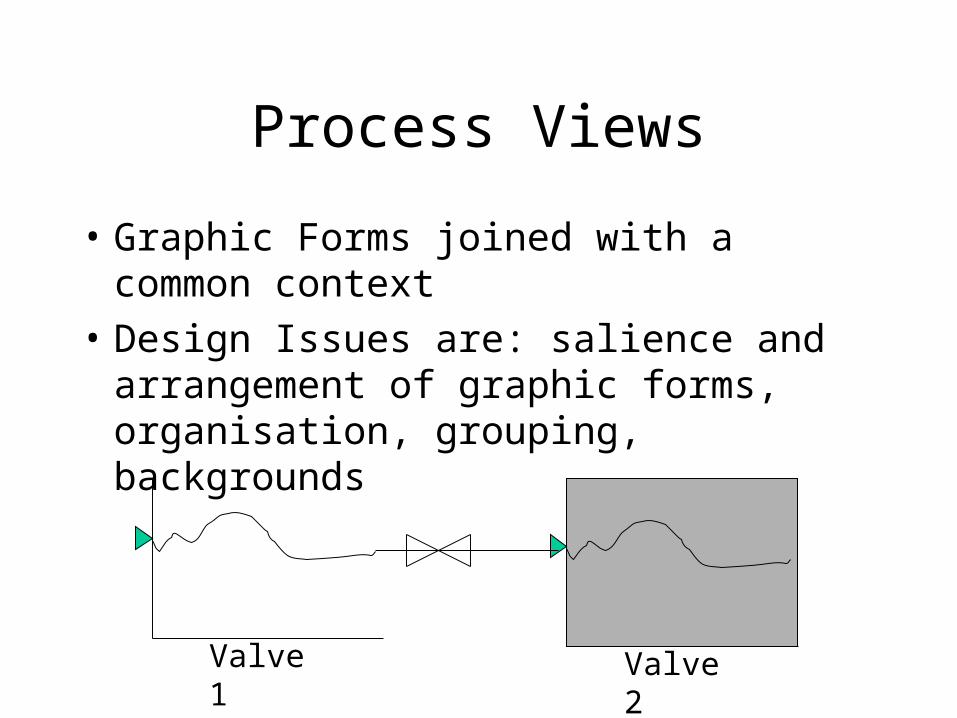
Process Views
• Graphic Forms joined with a common context
• Design Issues are: salience and arrangement of graphic forms, organisation, grouping, backgrounds
Valve 1 Valve 2

Graphic Forms• A more meaningful unit
• shows changes and anomolies
• Design issues are how to convey context, and salience
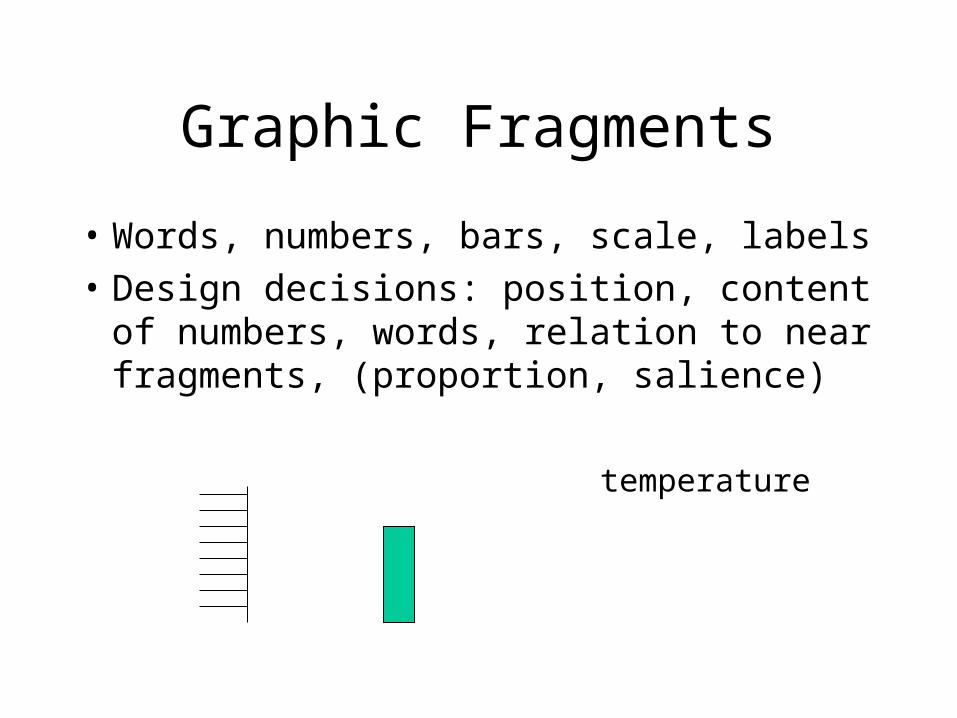
Graphic Fragments
• Words, numbers, bars, scale, labels
• Design decisions: position, content of numbers, words, relation to near fragments, (proportion, salience)
temperature

Graphic Atom
• Smallest unit
• a letter, digit, line, colour block
• Design decisions: colour, size, shape, length, thickness, angle, etc.
A
3
Forms of Reference
• 3 kinds
• Propositional
• Iconic
• Analogical
• Describe how the visual token relates between the user and the world

Propositional Form
• Token tells the observer about the world• Relation between the token and the world is
arbitrary• Typically words, numbers, some graphics• Relies on stored knowledge such as language,
numbers• Gives current state but little more
Observer Token World“tells” arbitrary

Iconic Reference
• Relies on observer experience with the world
• depends on quality of visual form to look like the world
• should evoke recognition
• typical “icons”
Observer Token Worldrecognizes looks like
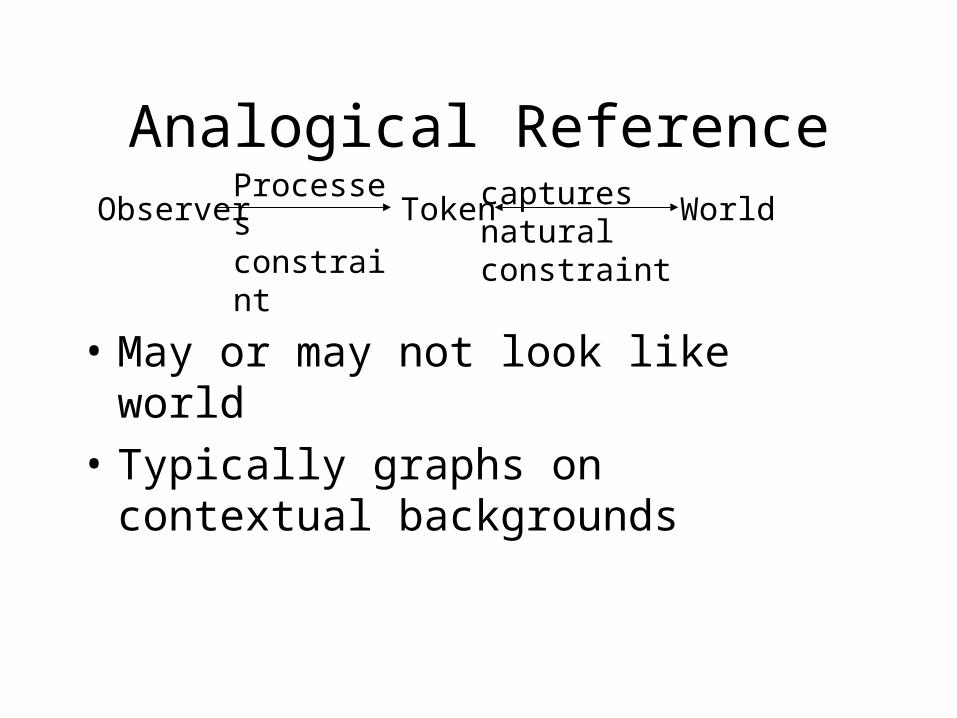
Analogical Reference
• May or may not look like world
• Typically graphs on contextual backgrounds
Observer Token WorldProcesses constraint
captures natural constraint

Examples
• Stop lightpropositional

Airline departure and arrival signs
iconic

Stop Sign
STOP propositional

Stove Labels
“REAR”
“FRONT”
propositional
iconic

Can you have too many icons?
• Early trend of using icons as “user-friendly”
• A good idea taken too far?
• Examples:
• Iconization of non-visual things
• (is that still iconic reference?)
• Poorly drawn or obscure icons
• Aiding with words an indicator

Mixed Forms of Reference
• Windows Recycle Bin– Recycle Bin iconic– darkens/lightens propositional– fills/empties propositional

Map
• Words propositional
• Symbols propositional
• landmark images iconic
• spacing and scale analogical


Final Notes
• Propositional and Iconic usually give 1 piece of information
• Analogical usually gives many pieces
• Representation is not right or wrong but changes the work of the observer

Work involved in processing representations
• Analogical perceptual
• Propositional memory
• Iconic recognition memory
• (Propositional and Iconic both rely to some degree on knowledge in the head. Analogical leaves knowledge in the world.)

Graphic FormsAnalog vs. Digital
• DIGITAL:– uses propositional reference– set of numerical strings that describe the
referent e.g. 100.91– observer reads the information
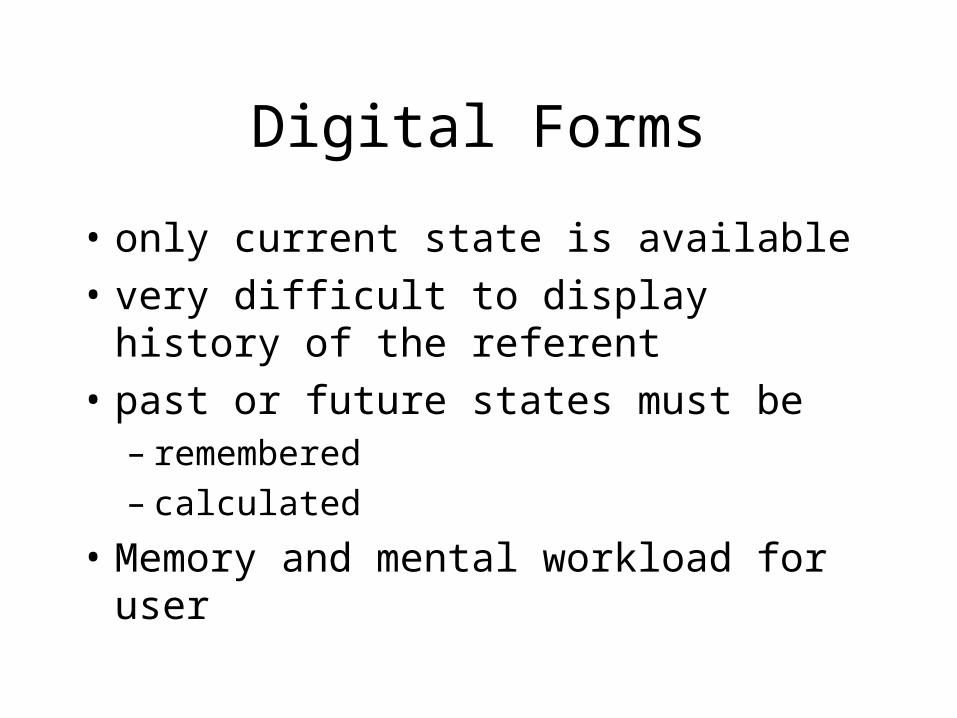
Digital Forms
• only current state is available
• very difficult to display history of the referent
• past or future states must be – remembered– calculated
• Memory and mental workload for user

Analog
• Uses analogical reference
• data is represented by a relationship between visual tokens on the screen
• representation is not as direct as digital
• requires the interpretation of a position in space
Analog
• Relationship is typically between an indicator and a reference scale
• Reference scale = Frame of reference.

Frames of Reference
1-dimensional frame of reference
indicator
scale
2-dimensional frame of reference
scales
indicator
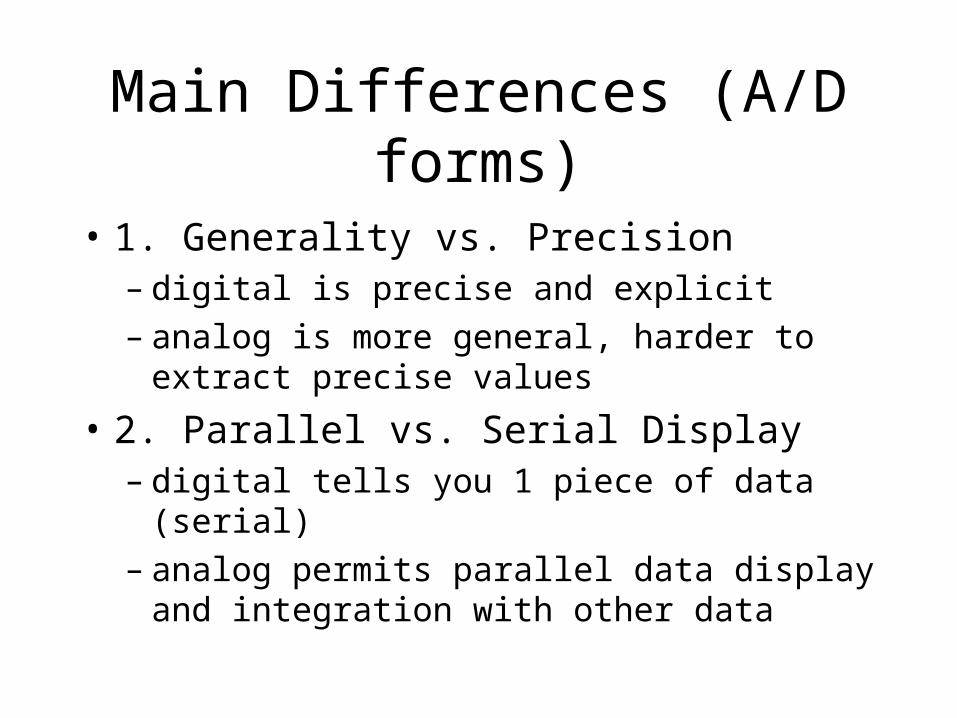
Main Differences (A/D forms)
• 1. Generality vs. Precision– digital is precise and explicit– analog is more general, harder to extract precise
values
• 2. Parallel vs. Serial Display– digital tells you 1 piece of data (serial)– analog permits parallel data display and
integration with other data
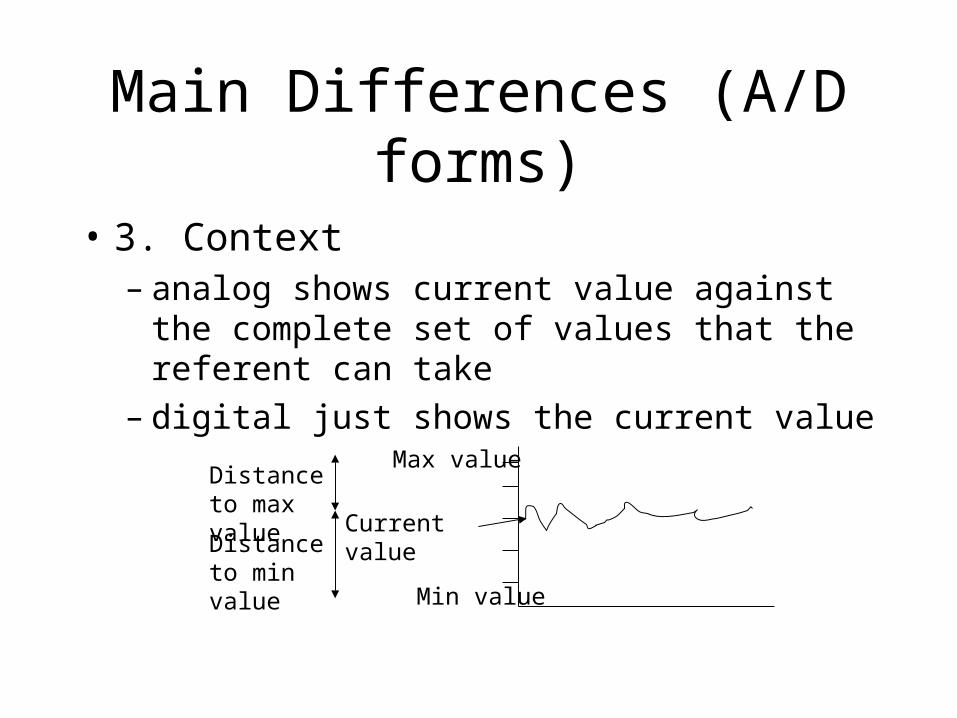
Main Differences (A/D forms)
• 3. Context– analog shows current value against the
complete set of values that the referent can take– digital just shows the current value
Max value
Min value
Current value
Distance to max value
Distance to min value

In terms of Workload
• Analog is generally easier because it is processed perceptually
• Digital requires mental comparisons and memory
• The Principle of the Primacy of Perception: Whenever you can offload a mental task to a perceptual task you take advantage of human capabilities and make work easier.
Using Digital Forms
• Digital Forms typically consist of two parts– 1. An identifier or label
• tells you what the referent is
– 2. A dynamic description of the referent• the value
• The visual form is typically a string of alphanumeric characters but could be icons.

Design Issues with Digital Forms
• 1. Precision– how much precision (# of significant digits)
should you have– 100.2379 vs. 100
Design Issues with Digital Forms
• 2. Context– how will you show context?
• When the referent hits its max value?
• When the referent hits its min value?
• On/off a desired value?
– People often change colour (propositional ref)
Design Issues with Digital Forms
• 3. How will you handle change and rate of change information? Change over time? Direction of change?
• 4. Digital is best choice when precise reading is required
• 5. Digital makes the most efficient use of screen space.
• 6. Digital forms are overused.

Showing Context with Digital Forms
123.45 Change the colour of the numbers for meaning e.g. red for alarms
150.55
123.45 Arrows to show rate and direction of change
123.45 Ratios to show performance relative to a target value
123.45
123.45C Units also add context.
Design Issues with Analog Forms
• 1. You need to show all the values that the referent could take– maximum– minimum– offscale– failed sensor
Design Issues with Analog Forms
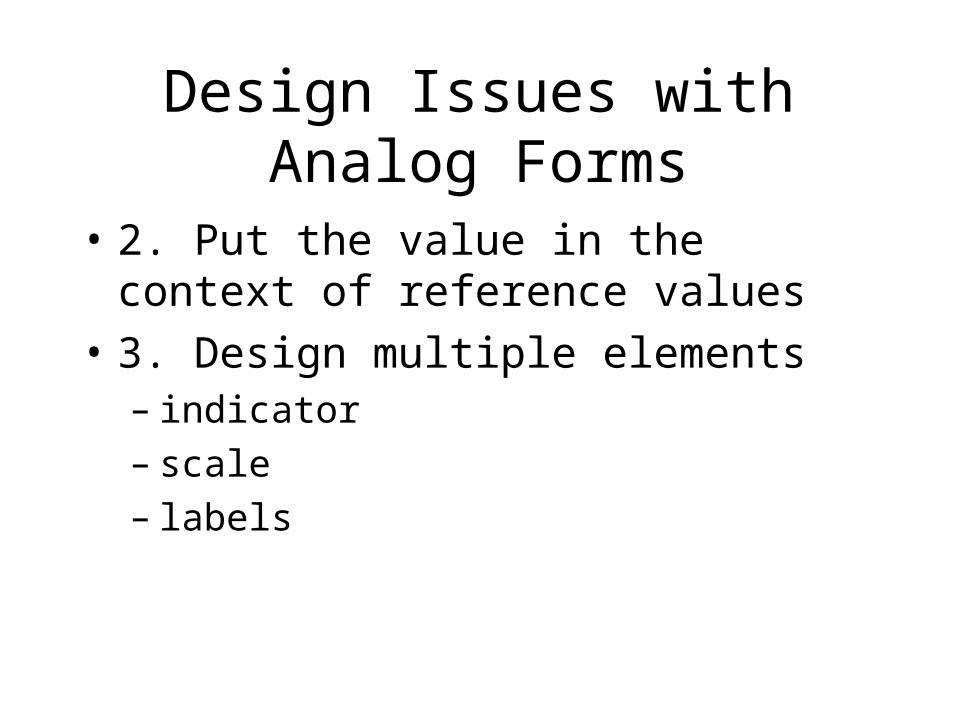
• 2. Put the value in the context of reference values
• 3. Design multiple elements– indicator– scale– labels

Possible Reference Values
• 1. Value vs. its past values– changes over time, rate of change
• 2. Value vs. its future values– predicted values
• 3. Value vs its target value (or range)– setpoints

Possible Reference Values
• 4. Value vs. its alarm limits– is it approaching a dangerous value?
• 5. Value vs. its max/min values
• 6. Value vs. decision points that affect operation.– Eg. Automatic system activations.

Graphical Techniques
• “Trend plot”– plot variable against time – gives current value (x), history, rate of change
(dx/dt), rate of rate of change (d2x/dt2)
x
time

Graphical Techniques
• “Trend plot”– shade regions to show target values or alarm
limits
x
time
Alarm region
Target region
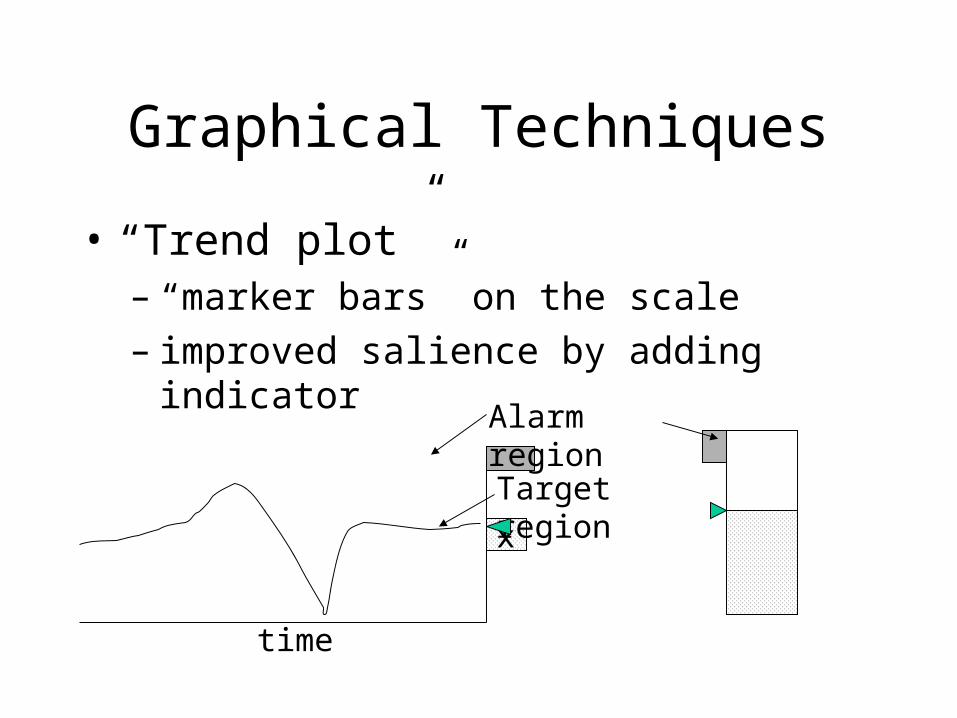
Graphical Techniques
• “Trend plot”– “marker bars” on the scale– improved salience by adding indicator
x
time
Alarm region
Target region
Hercules display
• Mostly analog forms
• Polar star - several scales put together
• Trends - used a combination of analog and digital forms to get context and precision.
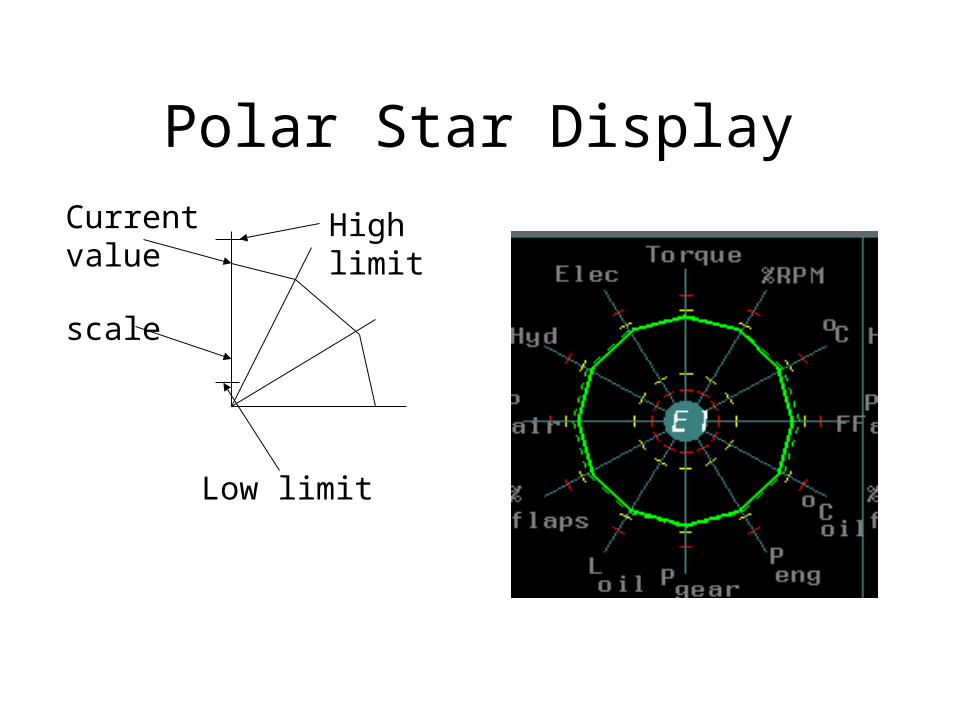
Polar Star Display
scale
Current value
High limit
Low limit
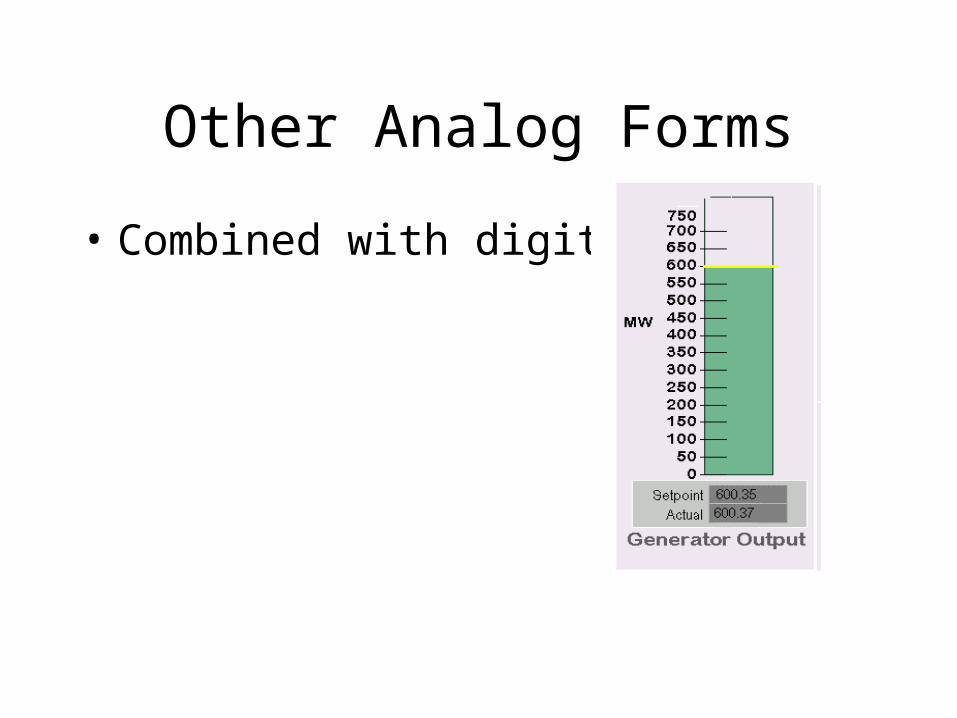
Other Analog Forms
• Combined with digital

Stacked Bar Graphs
- multiple analog forms
v1
v2
v3
v4
Height=v1+v2+v3+v4
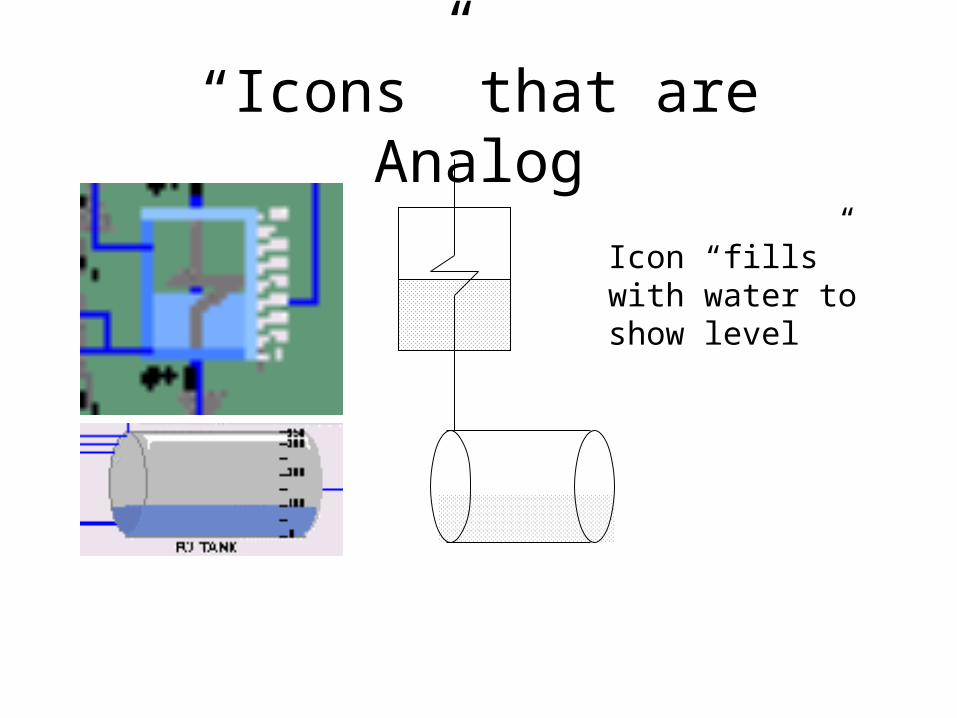
“Icons” that are Analog
Icon “fills” with water to show level

More analog forms
Degree of rotation shows degree valve is open.
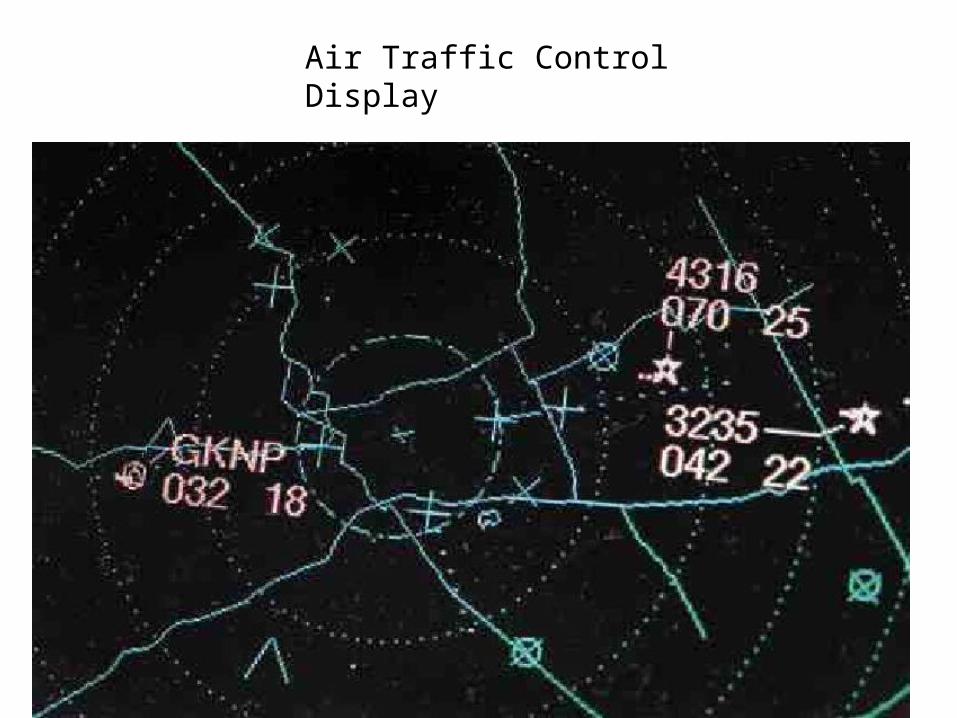
Air Traffic Control Display
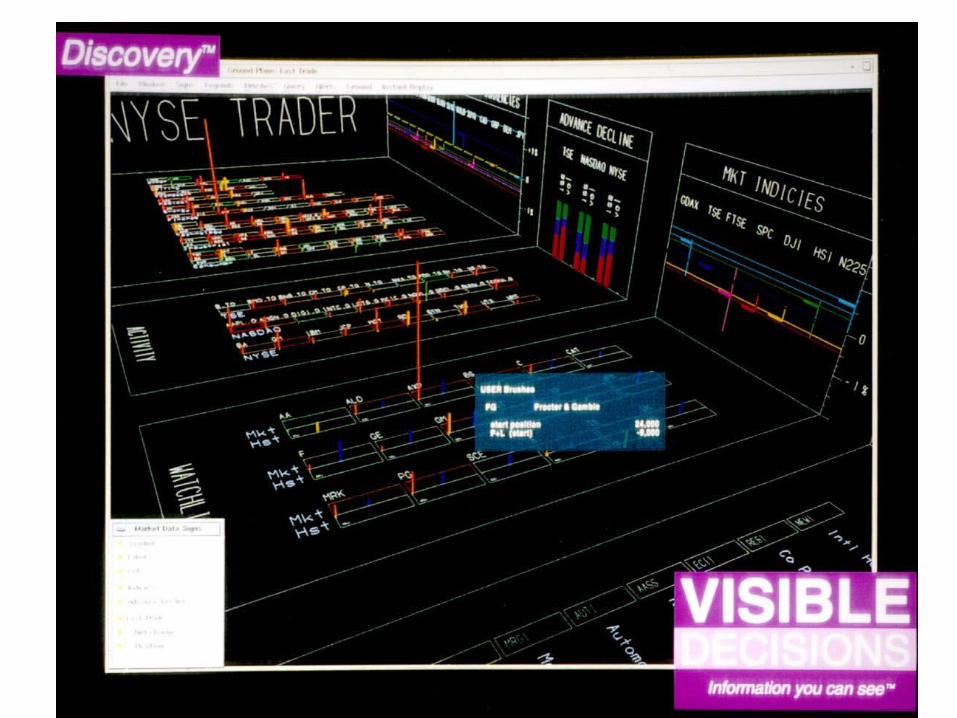

www.smartmoney.com/marketmap
Design ExerciseYou have been hired as an interface designer to work for Mrs. Field’s cookies.
Mrs. Fields needs to know when the oven isn’t working correctly. Sometimes it overheats and sometimes the burners break and don’t come on. Sometimes it heats up too slowly and the first few batches of cookies are ruined, being either burned or not baked through. Mrs. Fields wants to monitor her oven performance so that she can replace the burners before they break by knowing when they are not heating up properly anymore. In general, the oven thermometer has a range of 0 to 500 degrees F. Because of the different kinds of cookies, the oven is set to a new temperature with each new batch. Mrs. Fields needs to set her oven temperature to within 25 degrees. The cookie temperature can only range 25 degrees higher or lower from the setpoint temperature before the cookies are ruined.
• Design a display for the cookie oven. Identify the appropriate frame of reference, boundary conditions, reference values, and make decisions about what events to highlight.

Topics Summary
• Cognitive Ergonomics– Salience
– Alarms
• Memory & Attention• Display Representations
– Information Representation (decomposition)
– Forms of Reference (propositional, iconic, analogical)
– Analog vs. digital