Information Paper - NTC - National Transport CommissionDF694ECD-E... · The National Transport...
38
Carbon Dioxide Emissions from New Australian Vehicles 2010 Information Paper May 2011
Transcript of Information Paper - NTC - National Transport CommissionDF694ECD-E... · The National Transport...
Carbon Dioxide Emissions from New Australian Vehicles 2010
Information PaperMay 2011

Carbon Dioxide Emissions from New Australian Vehicles 2010 Information Paper
National Transport Commission May 2011
ISBN: 978-1-921604-13-3
© National Transport Commission 2011
Page ii
Carbon Dioxide Emissions from New Australian Vehicles 2010 Information Paper
ForewordThe National Transport Commission (NTC) is an independent body tasked by the Australian Transport Council to provide independent advice to transport ministers on transport regulatory and operational reforms. The NTC undertakes these reforms across road, rail and intermodal transport to improve safety, productivity and environmental outcomes.
In November 2009, NTC published an information paper that provided for the first time detailed data about the carbon dioxide emissions of new vehicles sold in Australia. This paper provides new information about the carbon dioxide emissions of new vehicles during 2010.
Cars and light commercial vehicles were responsible for nine per cent of Australia’s carbon emissions in 2009. To help reduce these emissions, the Australian government is introducing carbon dioxide standards for new light vehicles. We see this paper as informing the development of the target and of mechanisms to implement carbon dioxide standards for new vehicles.
The Federal Chamber of Automotive Industries provided the data that underpins this paper. I kindly thank the Chamber for providing this data.
I also acknowledge the work of NTC staff in developing this report, in particular Neil Wong and Jane Murray.
Ian Johnston Deputy Chairman

Page iii
Carbon Dioxide Emissions from New Australian Vehicles 2010 Information Paper
Executive Summary This report provides detailed information on average emissions from new passenger and light commercial vehicles in Australia. The units for carbon dioxide emissions from vehicles are grams of carbon dioxide per kilometre (g/km).
The Australian government has announced that it will introduce mandatory carbon dioxide standards for new passenger and light commercial vehicles by 2015 (Australian Labor Party 2010). The government is currently assessing how these standards might be implemented. The data in this paper is presented as additional information that might inform this assessment.
The paper provides a benchmark for carbon dioxide emissions for new passenger and light commercial vehicles. It includes detailed emissions breakdown by make, vehicle segment and buyer type. New-vehicle emissions depend on many factors including consumer preference, the emissions performance of high volume selling vehicles, vehicle price and fuel price.
Fast facts
• In 2010, the national average carbon emissions from new passenger and light commercial vehicles was 212.6 g/km. This is a 2.7% reduction from 2009.
• If Australians had purchased new vehicles with best-in-class emissions during 2010, the national average would be 135 g/km (36% lower).
• In Australia during 2010, new private vehicles had the lowest average emissions (202 g/km), followed by new business vehicles (222 g/km) and then new government vehicles (225 g/km).
• In 2010, fifteen manufacturers sold 94% of new vehicles in Australia. Of these manufacturers, Volkswagen had the lowest average emissions (175 g/km) and Ford the highest average emissions (237 g/km).
• In 2010, the average emissions from Australian-made vehicles was 247 g/km. This is a 4.7% reduction from 2009.
• In 2009, Australia’s carbon emissions from new passenger vehicles were 44% higher than in the European Union (210 g/km compared to 146 g/km). This is due to factors such as fuel prices and consumer preferences.
• Using the Swedish government’s definition of “green” car (a vehicle that does not exceed 120g/km), 0.6% of total car sales in Australia were “green” cars during 2010. This proportion is slightly lower than the 0.7% recorded in 2009.
Page iv
Carbon Dioxide Emissions from New Australian Vehicles 2010 Information Paper
Table of contentsForeword ii
Executive Summary iii
Table of contents iv
List of abbreviations v
1. Introduction 1
2. Methodology 1
3. Australian emmissions 3
Vehicle manufacturer 3
Australian-made vehicles 5
Segment type 8
Buyer type 10
Fuel type 15
4. Comparison of Australian and International data 16
Passenger vehicles: emissions by country 16
Passenger vehicles: proportion of “green” cars 17
Passenger vehicles: emissions by manufacturer 17
Discussion 18
References 20
Appendix A 21

Page v
Carbon Dioxide Emissions from New Australian Vehicles 2010 Information Paper
List of abbreviations ACT Australian Capital Territory
ATC Australian Transport Council
AWD All All-wheel drive
CO2 Carbon dioxide
CYL Cylinder
EU European Union
FCAI Federal Chamber of Automotive Industries
GVM Gross vehicle mass
LPG Liquid petroleum gas
NSW New South Wales
NT Northern Territory
NTC National Transport Commission
QLD Queensland
SA South Australia
SUV Sports utility vehicle
TAS Tasmania
VIC Victoria
WA Western Australia
Page vi
Carbon Dioxide Emissions from New Australian Vehicles 2010 Information Paper
1. IntroductionThis paper provides up-to-date information about the carbon dioxide emissions of new cars in Australia during 2010. It updates the information provided by NTC in 2009 (NTC 2009).
The next section describes the methodology used. The results of the analysis are presented in Section 3. Section 4 compares the Australian data with international data.
2. MethodologyThe data supplied by the Federal Chamber of Automotive Industries was entered into a database and analysed. The data contained the full records of annual sales for the years 2005 to 2010. In all, there were over 470,000 records. These records consisted of:
• vehicle attributes: make, model, vehicle generation, body style, engine capacity, number of cylinders, engine power, transmission type, gears, number of seats, gross vehicle mass, driven wheels, country of origin, fuel type, carbon dioxide emissions and fuel economy
• vehicle category: consistent with the classifications in Table 1 and
• sales data: sales by state and region, and by type of buyer: government, business or private.
The carbon dioxide emissions for vehicles are calculated using the method described in the Australian design rule “fuel consumption labelling for light vehicles” (also known as ADR 81/02) and expressed in grams of carbon dioxide per kilometre: g/km.
NTC calculated the sales-weighted average for vehicle emissions for different vehicle attributes, categories and buyer types. A weighted-average calculation is similar to an arithmetic average (the most common type of average), but instead of each data point contributing equally to the final average, some data points contribute more than others.1 In this case, the average was weighted to vehicle sales.
In the data provided, there were records with missing information (NTC 2009). These records were not included in the analysis. For 2009 and 2010, missing information made up 0.21% and 0.06% of yearly sales respectively.
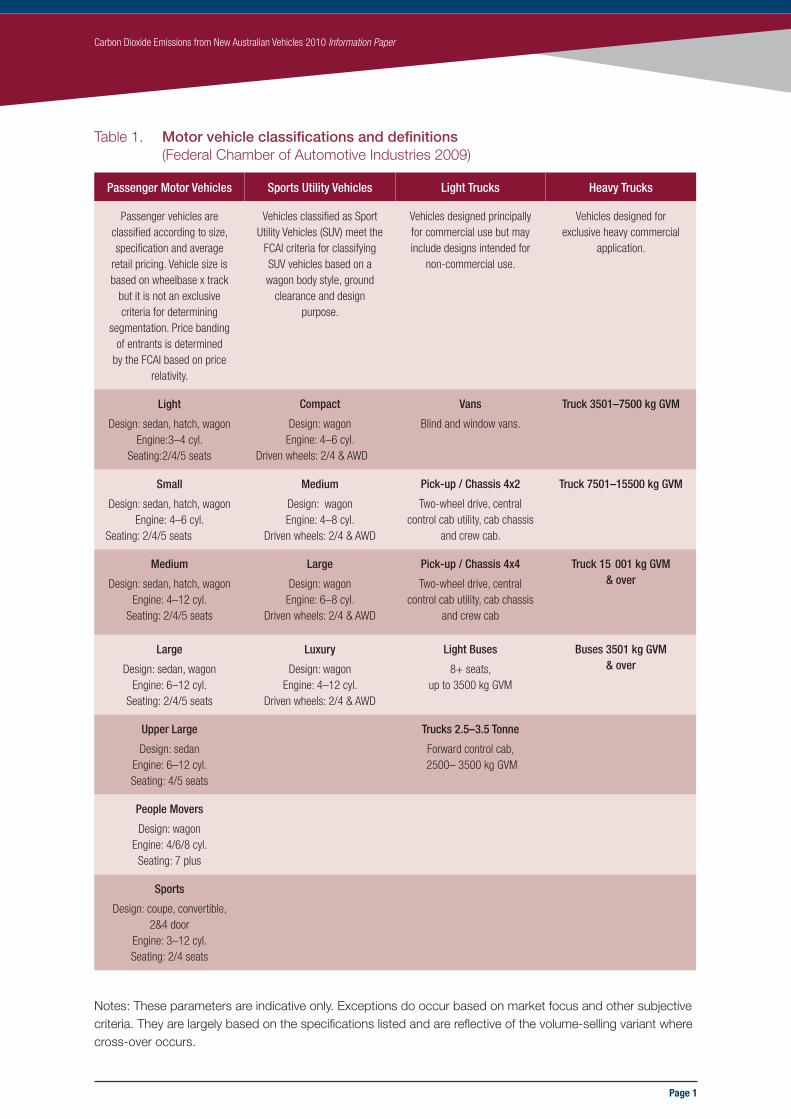
The Federal Chamber of Automotive Industries classifies motor vehicles into four main classes: passenger motor vehicles, sports utility vehicles (SUV), light trucks and heavy trucks. These four classes are then broken down into sub-classes; for example, the sub-classes of sports utility vehicles are compact, medium, large and luxury. The motor vehicle classifications and definitions are presented in Table 1.
The following definitions are used in this report:
• “passenger vehicles” are passenger motor vehicles and sports utility vehicles and
• “light commercial vehicles” are light trucks.
1. This description is from http://en.wikipedia.org/wiki/Weighted_mean.
Page 1
Carbon Dioxide Emissions from New Australian Vehicles 2010 Information Paper
Table 1. Motor vehicle classifications and definitions (Federal Chamber of Automotive Industries 2009)
Passenger Motor Vehicles Sports Utility Vehicles Light Trucks Heavy Trucks
Passenger vehicles are classified according to size, specification and average
retail pricing. Vehicle size is based on wheelbase x track
but it is not an exclusive criteria for determining
segmentation. Price banding of entrants is determined
by the FCAI based on price relativity.
Vehicles classified as Sport Utility Vehicles (SUV) meet the
FCAI criteria for classifying SUV vehicles based on a wagon body style, ground
clearance and design purpose.
Vehicles designed principally for commercial use but may include designs intended for
non-commercial use.
Vehicles designed for exclusive heavy commercial
application.
Light
Design: sedan, hatch, wagon Engine:3–4 cyl.
Seating:2/4/5 seats
Compact
Design: wagon Engine: 4–6 cyl.
Driven wheels: 2/4 & AWD
Vans
Blind and window vans.
Truck 3501–7500 kg GVM
Small
Design: sedan, hatch, wagon Engine: 4–6 cyl.
Seating: 2/4/5 seats
Medium
Design: wagon Engine: 4–8 cyl.
Driven wheels: 2/4 & AWD
Pick-up / Chassis 4x2
Two-wheel drive, central control cab utility, cab chassis
and crew cab.
Truck 7501–15500 kg GVM
Medium
Design: sedan, hatch, wagon Engine: 4–12 cyl.
Seating: 2/4/5 seats
Large
Design: wagon Engine: 6–8 cyl.
Driven wheels: 2/4 & AWD
Pick-up / Chassis 4x4
Two-wheel drive, central control cab utility, cab chassis
and crew cab
Truck 15 001 kg GVM & over
Large
Design: sedan, wagon Engine: 6–12 cyl.
Seating: 2/4/5 seats
Luxury
Design: wagon Engine: 4–12 cyl.
Driven wheels: 2/4 & AWD
Light Buses
8+ seats, up to 3500 kg GVM
Buses 3501 kg GVM & over
Upper Large
Design: sedan Engine: 6–12 cyl. Seating: 4/5 seats
Trucks 2.5–3.5 Tonne
Forward control cab, 2500– 3500 kg GVM
People Movers
Design: wagon Engine: 4/6/8 cyl. Seating: 7 plus
Sports
Design: coupe, convertible, 2&4 door
Engine: 3–12 cyl. Seating: 2/4 seats
Notes: These parameters are indicative only. Exceptions do occur based on market focus and other subjective criteria. They are largely based on the specifications listed and are reflective of the volume-selling variant where cross-over occurs.
Page 2
Carbon Dioxide Emissions from New Australian Vehicles 2010 Information Paper
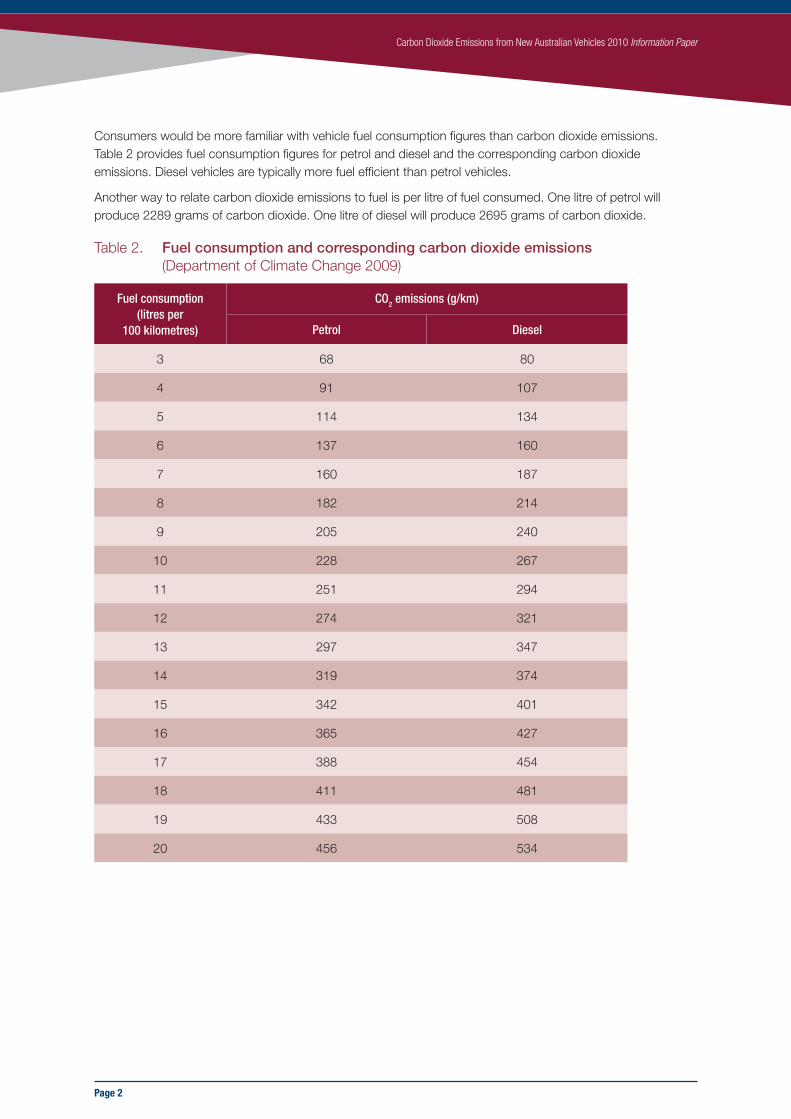
Consumers would be more familiar with vehicle fuel consumption figures than carbon dioxide emissions. Table 2 provides fuel consumption figures for petrol and diesel and the corresponding carbon dioxide emissions. Diesel vehicles are typically more fuel efficient than petrol vehicles.
Another way to relate carbon dioxide emissions to fuel is per litre of fuel consumed. One litre of petrol will produce 2289 grams of carbon dioxide. One litre of diesel will produce 2695 grams of carbon dioxide.
Table 2. Fuel consumption and corresponding carbon dioxide emissions (Department of Climate Change 2009)
Fuel consumption (litres per
100 kilometres)
CO2 emissions (g/km)
Petrol Diesel
3 68 80
4 91 107
5 114 134
6 137 160
7 160 187
8 182 214
9 205 240
10 228 267
11 251 294
12 274 321
13 297 347
14 319 374
15 342 401
16 365 427
17 388 454
18 411 481
19 433 508
20 456 534

Page 3
Carbon Dioxide Emissions from New Australian Vehicles 2010 Information Paper
3. Australian EmissionsThe national average carbon dioxide emissions for new passenger and light commercial vehicles for 2010 was 212.6 g/km (see Table 3). This was a 2.7 per cent improvement from 2009. The highest year-to-year improvement in national average emissions was 4.2 per cent between 2005 and 2006.
Table 3. National average CO2 emissions for passenger and light commercial vehicles
Year Average CO2 emissions (g/km) Annual change
2002a 252.4 n/a
2003a 249.5 –1.1%
2004a 246.5 –1.2%
2005 240.5 –2.4%
2006 230.3 –4.2%
2007 226.4 –1.7%
2008 222.4 –1.8%
2009 218.6 –1.7%
2010 212.6 –2.7%
a. Federal Chamber of Automotive Industries (2011).
Vehicle Manufacturer
In 2010, there were 45 makes of new vehicles available to Australian consumers. Fifteen makes made up about 94 per cent of all new-vehicle sales. The corporate average emissions of these market-leading makes dictates the national average emissions for new passenger and light commercial vehicles. Toyota is the highest volume selling make in Australia, selling one in five cars during 2010.
Figure 1 shows the corporate average carbon emissions for the top 15 makes 2010. Of these 15 makes, Volkswagen has the lowest corporate average emissions (175 g/km) and Ford has the highest (237 g/km).
Figure 2 shows the change in corporate average emissions between 2009 and 2010. BMW made the most progress with a 9.1% improvement. Honda made the least progress with a 0.2% increase in emissions.

Page 4
Carbon Dioxide Emissions from New Australian Vehicles 2010 Information Paper
Figure 1. Corporate average CO2 emissions for new passenger and light commercial vehicles for the top 15 makes by volume for 2010
Figure 2. Change in corporate average CO2 emissions between 2009 and 2010 for new passenger and light commercial vehicles for the top 15 makes by volume
Cor
por
ate
aver
age
CO
2 em
issi
ons
(g/k
m)
Volk
swag
en
Suz
uki
Aud
i
Hyu
ndai
Hon
da
BM
W Kia
Maz
da
Mer
cede
s-B
enz
Sub
aru
Mits
ubis
hi
Toyo
ta
Hol
den
Nis
san
Ford
175 177 182 182189 191
199 204 209215 215 217
229 230237
0
50
100
150
200
250
Per
cen
t
BM
W
Suz
uki
Volk
swag
en
Hol
den
Aud
i
Mits
ubis
hi
Mer
cede
s-B
enz
Sub
aru
Toyo
ta
Ford
Nis
san
Kia
Maz
da
Hyu
ndai
Hon
da
-9.1
-6.5 -6.4
-5.2-4.7
-3.7 -3.5-3.2
-2.1-1.6
-1.0 -0.8-0.5
0.1 0.2
-10
-8
-6
-4
-2
0
2
Page 5
Carbon Dioxide Emissions from New Australian Vehicles 2010 Information Paper
Australian-made vehicles
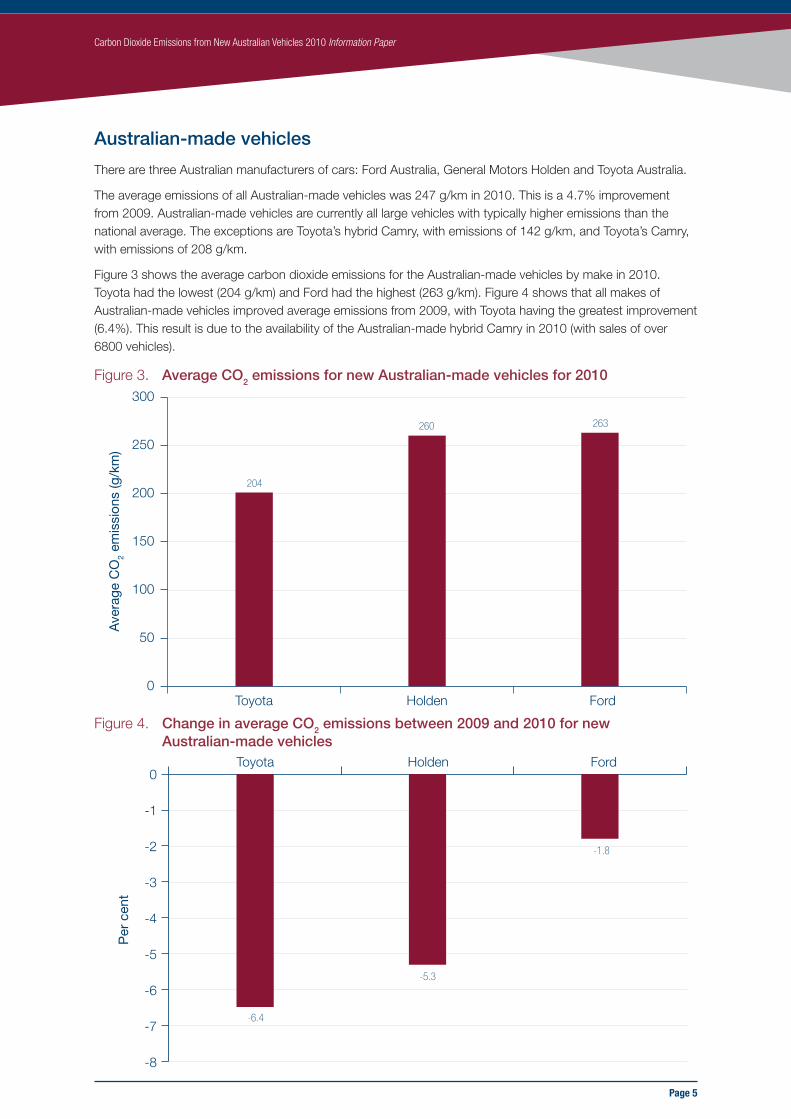
There are three Australian manufacturers of cars: Ford Australia, General Motors Holden and Toyota Australia.
The average emissions of all Australian-made vehicles was 247 g/km in 2010. This is a 4.7% improvement from 2009. Australian-made vehicles are currently all large vehicles with typically higher emissions than the national average. The exceptions are Toyota’s hybrid Camry, with emissions of 142 g/km, and Toyota’s Camry, with emissions of 208 g/km.
Figure 3 shows the average carbon dioxide emissions for the Australian-made vehicles by make in 2010. Toyota had the lowest (204 g/km) and Ford had the highest (263 g/km). Figure 4 shows that all makes of Australian-made vehicles improved average emissions from 2009, with Toyota having the greatest improvement (6.4%). This result is due to the availability of the Australian-made hybrid Camry in 2010 (with sales of over 6800 vehicles).
Figure 3. Average CO2 emissions for new Australian-made vehicles for 2010
Figure 4. Change in average CO2 emissions between 2009 and 2010 for new Australian-made vehicles
Ave
rage
CO
2 em
issi
ons
(g/k
m)
Toyota Holden Ford0
50
100
150
200
250
300
204
260 263
Per
cen
t
Toyota Holden Ford
-6.4
-5.3
-1.8
-8
-7
-6
-5
-4
-3
-2
-1
0
Page 6
Carbon Dioxide Emissions from New Australian Vehicles 2010 Information Paper
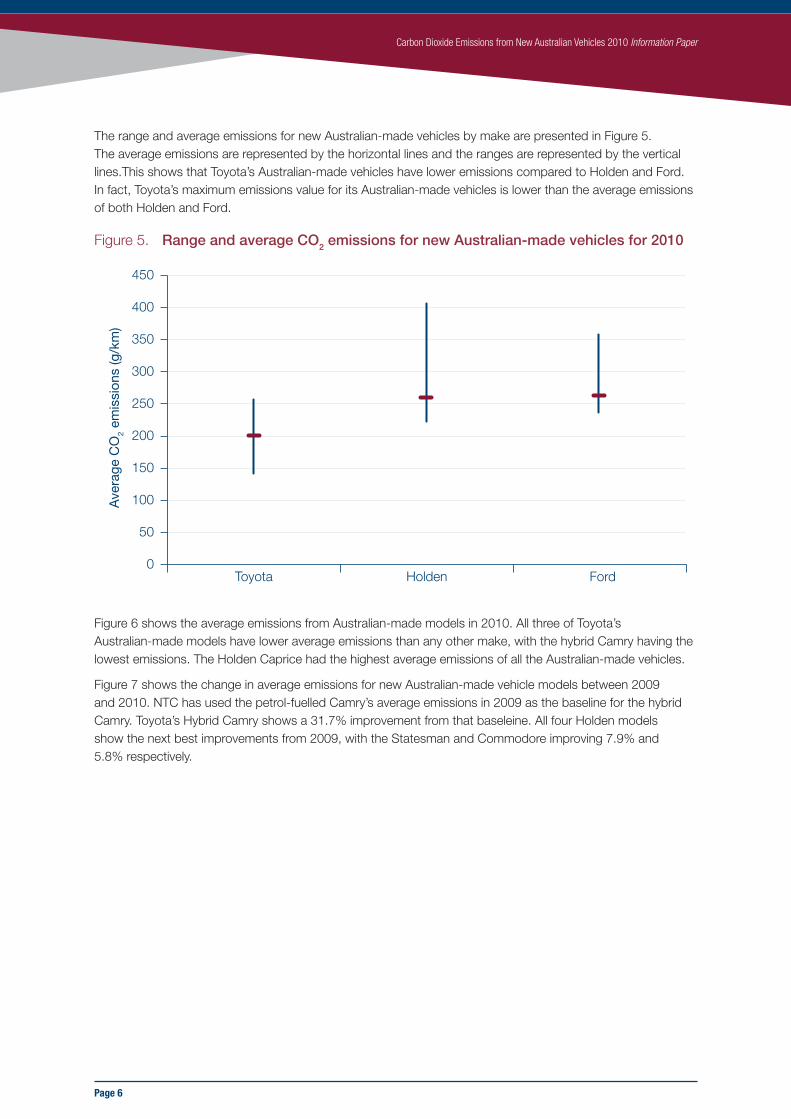
The range and average emissions for new Australian-made vehicles by make are presented in Figure 5. The average emissions are represented by the horizontal lines and the ranges are represented by the vertical lines.This shows that Toyota’s Australian-made vehicles have lower emissions compared to Holden and Ford. In fact, Toyota’s maximum emissions value for its Australian-made vehicles is lower than the average emissions of both Holden and Ford.
Figure 5. Range and average CO2 emissions for new Australian-made vehicles for 2010
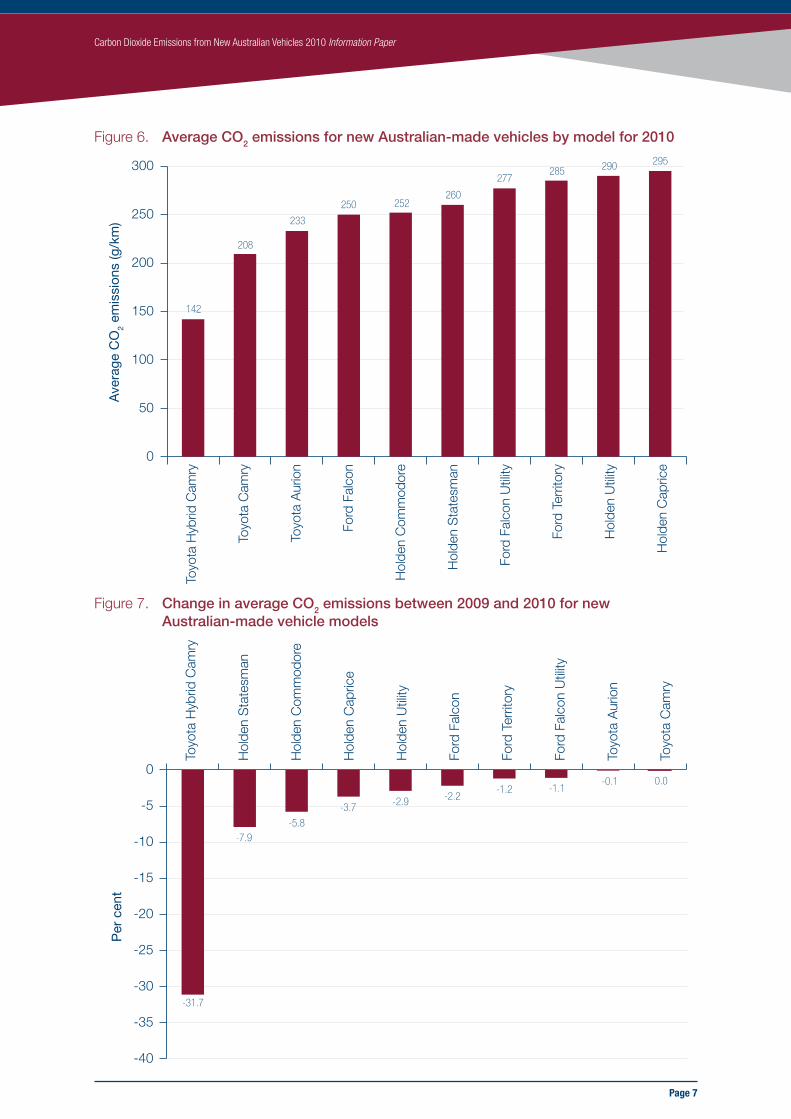
Figure 6 shows the average emissions from Australian-made models in 2010. All three of Toyota’s Australian-made models have lower average emissions than any other make, with the hybrid Camry having the lowest emissions. The Holden Caprice had the highest average emissions of all the Australian-made vehicles.
Figure 7 shows the change in average emissions for new Australian-made vehicle models between 2009 and 2010. NTC has used the petrol-fuelled Camry’s average emissions in 2009 as the baseline for the hybrid Camry. Toyota’s Hybrid Camry shows a 31.7% improvement from that baseleine. All four Holden models show the next best improvements from 2009, with the Statesman and Commodore improving 7.9% and 5.8% respectively.
Ave
rage
CO
2 em
issi
ons
(g/k
m)
Toyota Holden Ford0
50
100
150
200
250
300
350
400
450
Page 7
Carbon Dioxide Emissions from New Australian Vehicles 2010 Information Paper
Figure 6. Average CO2 emissions for new Australian-made vehicles by model for 2010
Figure 7. Change in average CO2 emissions between 2009 and 2010 for new Australian-made vehicle models
Ave
rage
CO
2 em
issi
ons
(g/k
m)
Toyo
ta H
ybrid
Cam
ry
Toyo
ta C
amry
Toyo
ta A
urio
n
Ford
Fal
con
Hol
den
Com
mod
ore
Hol
den
Sta
tesm
an
Ford
Fal
con
Util
ity
Ford
Ter
ritor
y
Hol
den
Util
ity
Hol
den
Cap
rice
0
50
100
150
200
250
300
142
208
233
250 252260
277285 290 295
Per
cen
t
Toyo
ta H
ybrid
Cam
ry
Hol
den
Sta
tesm
an
Hol
den
Com
mod
ore
Hol
den
Cap
rice
Hol
den
Util
ity
Ford
Fal
con
Ford
Ter
ritor
y
Ford
Fal
con
Util
ity
Toyo
ta A
urio
n
Toyo
ta C
amry
-31.7
-7.9-5.8
-3.7 -2.9 -2.2-1.2 -1.1
-0.1 0.0
-40
-35
-30
-25
-20
-15
-10
-5
0
Page 8
Carbon Dioxide Emissions from New Australian Vehicles 2010 Information Paper
Segment type
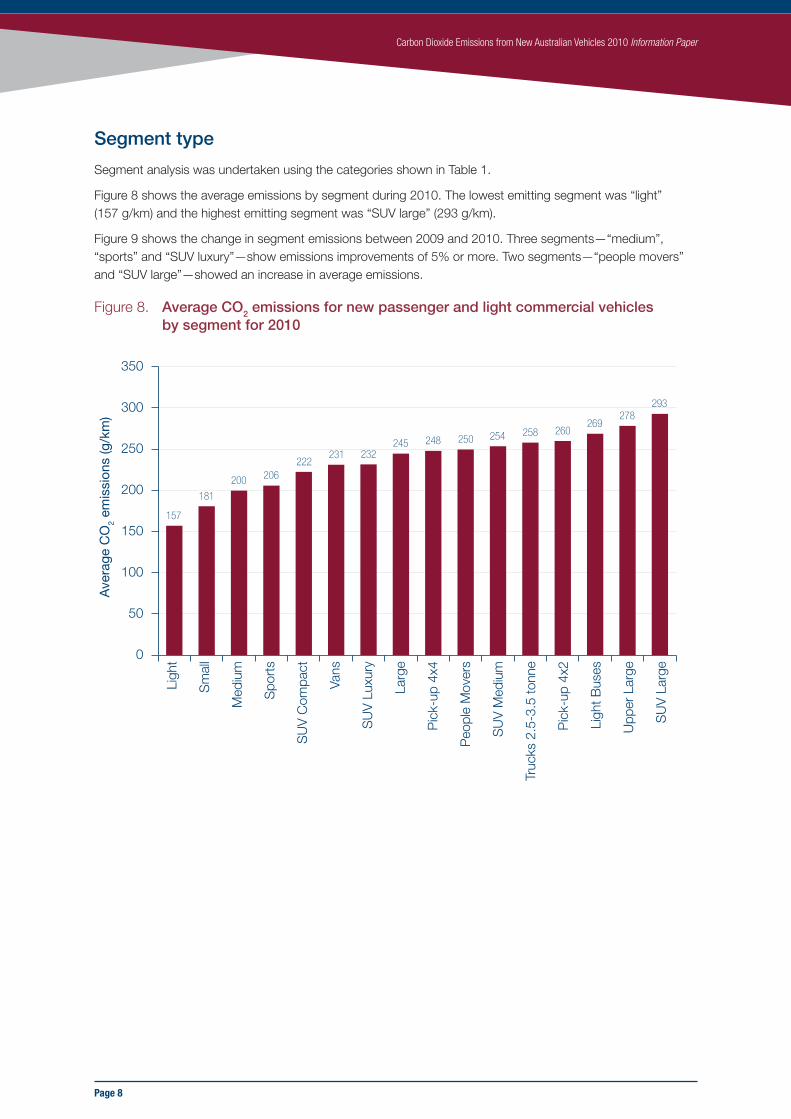
Segment analysis was undertaken using the categories shown in Table 1.
Figure 8 shows the average emissions by segment during 2010. The lowest emitting segment was “light” (157 g/km) and the highest emitting segment was “SUV large” (293 g/km).
Figure 9 shows the change in segment emissions between 2009 and 2010. Three segments—“medium”, “sports” and “SUV luxury”—show emissions improvements of 5% or more. Two segments—“people movers” and “SUV large”—showed an increase in average emissions.
Figure 8. Average CO2 emissions for new passenger and light commercial vehicles by segment for 2010
Ave
rage
CO
2 em
issi
ons
(g/k
m)
Ligh
t
Sm
all
Med
ium
Spo
rts
SU
V C
ompa
ct
Vans
SU
V L
uxur
y
Larg
e
Pic
k-up
4x4
Peo
ple
Mov
ers
SU
V M
ediu
m
Truc
ks 2
.5-3
.5 to
nne
Pic
k-up
4x2
Ligh
t Bus
es
Upp
er L
arge
SU
V L
arge
157
181
200 206222
231 232245 248 250 254 258 260
269278
293
0
50
100
150
200
250
300
350

Page 9
Carbon Dioxide Emissions from New Australian Vehicles 2010 Information Paper
Figure 9. Change in average CO2 emissions between 2009 and 2010 for new passenger and light commercial vehicles segment
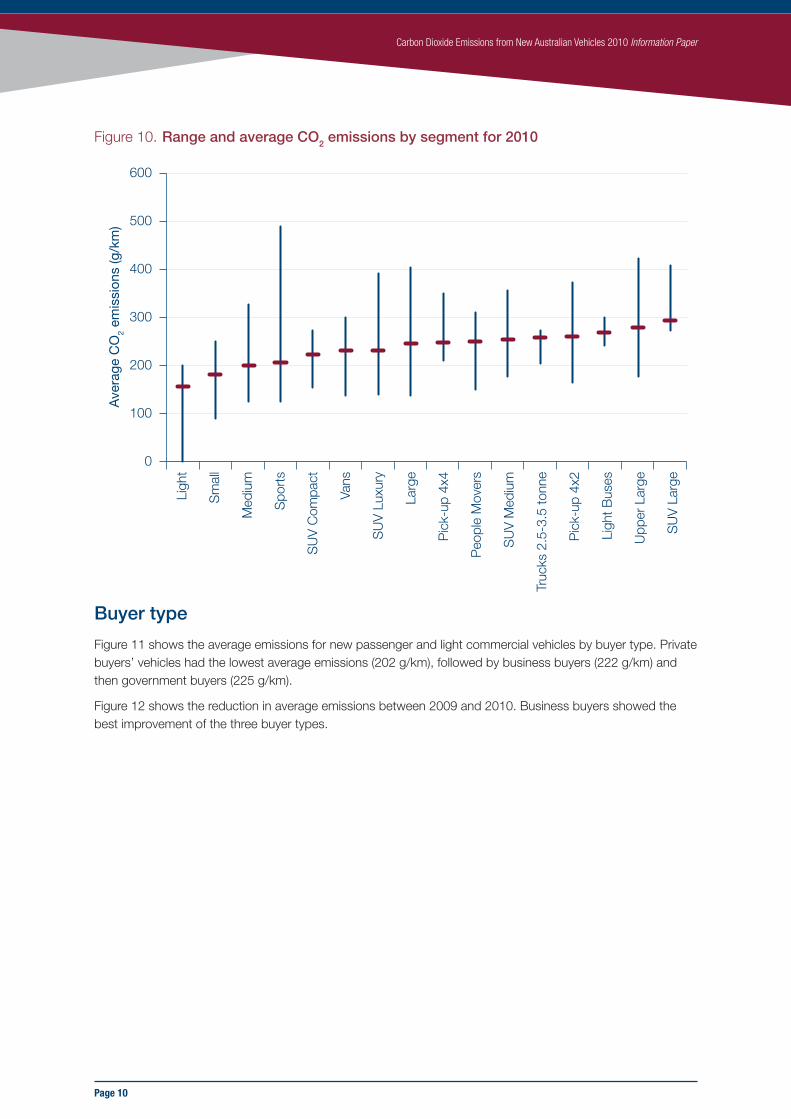
Figure 10 shows the average and the range in emissions for the segments during 2010. The lowest emitting vehicle in the “light” segment is Mitsubishi’s i-MiEV electric vehicle with 0 g/km. Although electric vehicles have zero tailpipe emissions, the electricity that fuels these vehicles produces emissions.
The “sports” segment shows the greatest range in emissions, but its average emissions is the fourth lowest of all segments at 206 g/km.
If Australian consumers had have purchased vehicles with best-in-class emissions in 2010 (not including the i-MiEV electric vehicle), the national average carbon dioxide emissions would have been reduced to 135 g/km (a reduction of 36%). This shows the potential emissions reduction with currently available vehicles and technology.
Per
cen
t
SU
V L
uxur
y
Spo
rts
Med
ium
Truc
ks 2
.5-3
.5 to
nne
SU
V M
ediu
m
Larg
e
Upp
er L
arge
Pic
k-up
4x2
SU
V C
ompa
ct
Ligh
t
Sm
all
Vans
Pic
k-up
4x4
Ligh
t Bus
es
SU
V L
arge
Peo
ple
Mov
ers
-8
-7
-6
-5
-4
-3
-2
-1
0
1
2
-7.2
-5.9
-5.2
-3.7 -3.6 -3.6
-1.9-1.6
-1.0 -0.8 -0.7 -0.4-0.4 -0.3
0.2
1.4
Page 10
Carbon Dioxide Emissions from New Australian Vehicles 2010 Information Paper
Figure 10. Range and average CO2 emissions by segment for 2010
Buyer type
Figure 11 shows the average emissions for new passenger and light commercial vehicles by buyer type. Private buyers’ vehicles had the lowest average emissions (202 g/km), followed by business buyers (222 g/km) and then government buyers (225 g/km).
Figure 12 shows the reduction in average emissions between 2009 and 2010. Business buyers showed the best improvement of the three buyer types.
Ave
rage
CO
2 em
issi
ons
(g/k
m)
0
100
200
300
400
500
600Li
ght
Sm
all
Med
ium
Spo
rts
SU
V C
ompa
ct
Vans
SU
V L
uxur
y
Larg
e
Pic
k-up
4x4
Peo
ple
Mov
ers
SU
V M
ediu
m
Truc
ks 2
.5-3
.5 to
nne
Pic
k-up
4x2
Ligh
t Bus
es
Upp
er L
arge
SU
V L
arge

Page 11
Carbon Dioxide Emissions from New Australian Vehicles 2010 Information Paper
Figure 11. Average CO2 emissions for new passenger and light commercial vehicles by buyer type for 2010
Figure 12. Change in average CO2 emissions for new passenger and light commercial vehicles by buyer type between 2009 and 2010
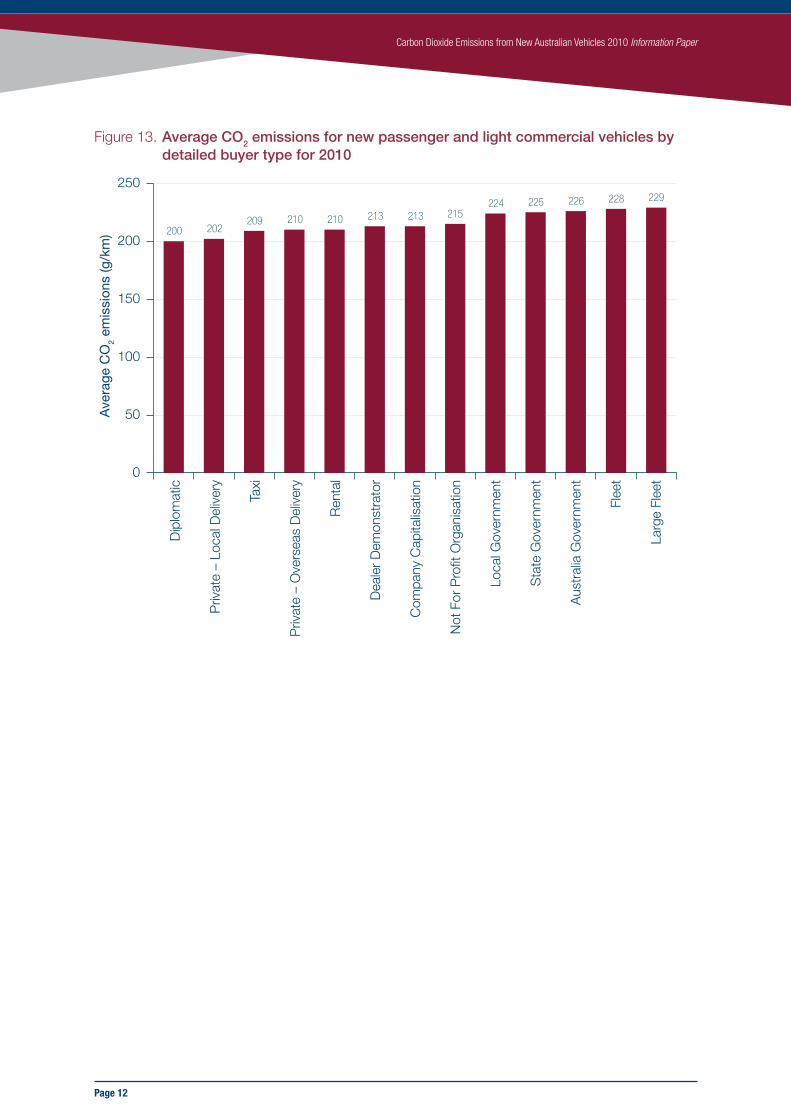
NTC has more information about buyer-type emissions than before. The three earlier categories of private, government and business can now be broken down further:
• Private; local delivery and overseas delivery
• Government; Australian, state and local
• Business; rental, not-for-profit organisation, company capitalisation, diplomatic, taxi, large fleet, fleet and dealer demonstrator.
The average emissions for these buyer types are shown in Figure 13. The change in average emissions from 2009 to 2010 is shown in Figure 14.
202
222 225
0
50
100
150
200
250
Ave
rage
CO
2 em
issi
ons
(g/k
m)
Private Business Government
-2.9
-2.7
-2.2
Per
cen
t
PrivateBusiness Government
-3.0
-2.5
-2.0
-1.5
-1.0
-0.5
0.0
Page 12
Carbon Dioxide Emissions from New Australian Vehicles 2010 Information Paper
Figure 13. Average CO2 emissions for new passenger and light commercial vehicles by detailed buyer type for 2010
0
50
100
150
200
250
Ave
rage
CO
2 em
issi
ons
(g/k
m)
Dip
lom
atic
Priv
ate
– Lo
cal D
eliv
ery
Taxi
Priv
ate
– O
vers
eas
Del
iver
y
Ren
tal
Dea
ler
Dem
onst
rato
r
Com
pany
Cap
italis
atio
n
Not
For
Pro
fit O
rgan
isat
ion
Loca
l Gov
ernm
ent
Sta
te G
over
nmen
t
Aus
tral
ia G
over
nmen
t
Flee
t
Larg
e Fl
eet
200 202209 210 210 213 213 215
224 225 226 228 229
Page 13
Carbon Dioxide Emissions from New Australian Vehicles 2010 Information Paper
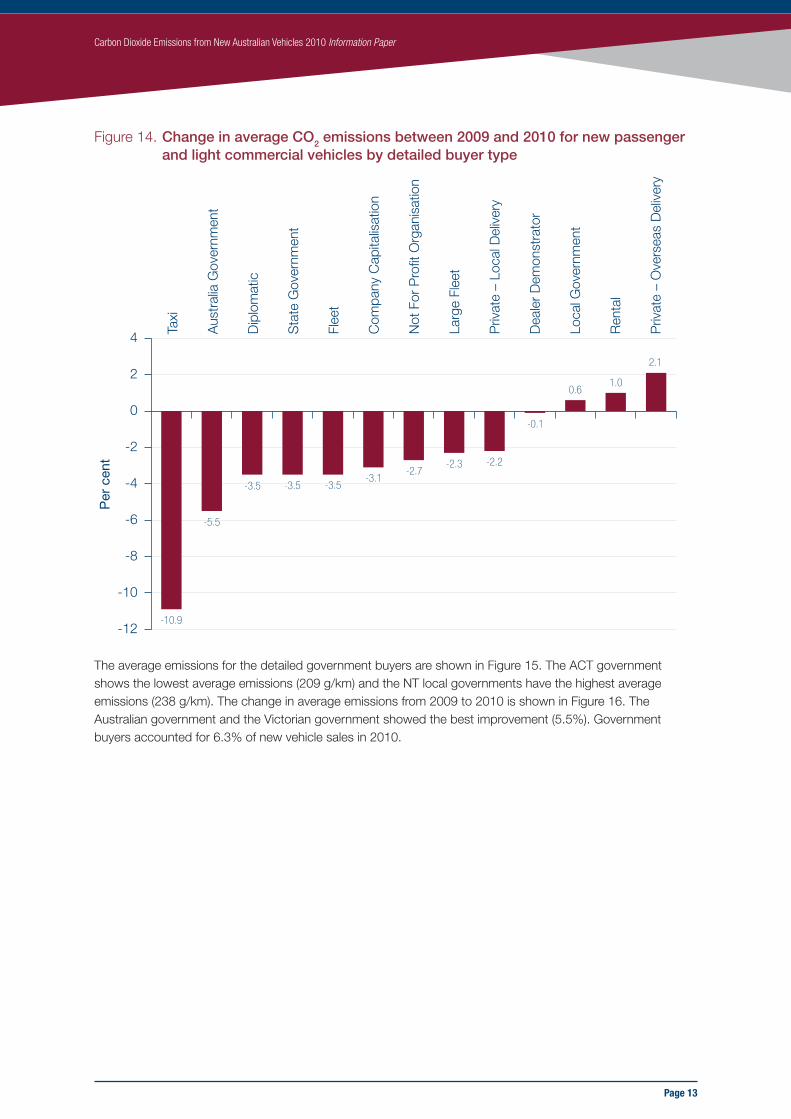
Figure 14. Change in average CO2 emissions between 2009 and 2010 for new passenger and light commercial vehicles by detailed buyer type
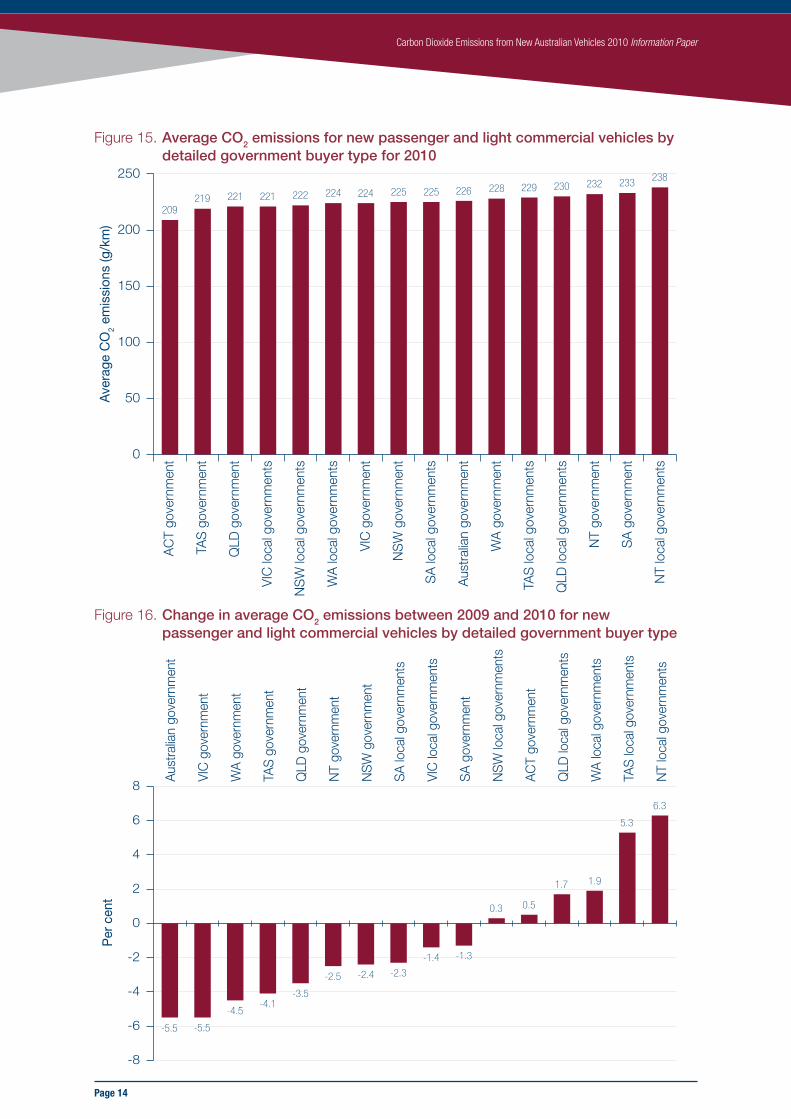
The average emissions for the detailed government buyers are shown in Figure 15. The ACT government shows the lowest average emissions (209 g/km) and the NT local governments have the highest average emissions (238 g/km). The change in average emissions from 2009 to 2010 is shown in Figure 16. The Australian government and the Victorian government showed the best improvement (5.5%). Government buyers accounted for 6.3% of new vehicle sales in 2010.
Per
cen
t
Taxi
Aus
tral
ia G
over
nmen
t
Dip
lom
atic
Sta
te G
over
nmen
t
Flee
t
Com
pany
Cap
italis
atio
n
Not
For
Pro
fit O
rgan
isat
ion
Larg
e Fl
eet
Priv
ate
– Lo
cal D
eliv
ery
Dea
ler
Dem
onst
rato
r
Loca
l Gov
ernm
ent
Ren
tal
Priv
ate
– O
vers
eas
Del
iver
y
-12
-10
-8
-6
-4
-2
0
2
4
-10.9
-5.5
-3.5 -3.5 -3.5-3.1
-2.7-2.3 -2.2
-0.1
0.61.0
2.1
Page 14
Carbon Dioxide Emissions from New Australian Vehicles 2010 Information Paper
Figure 15. Average CO2 emissions for new passenger and light commercial vehicles by detailed government buyer type for 2010
Figure 16. Change in average CO2 emissions between 2009 and 2010 for new passenger and light commercial vehicles by detailed government buyer type
Ave
rage
CO
2 em
issi
ons
(g/k
m)
AC
T go
vern
men
t
TAS
gov
ernm
ent
QLD
gov
ernm
ent
VIC
loca
l gov
ernm
ents
NS
W lo
cal g
over
nmen
ts
WA
loca
l gov
ernm
ents
VIC
gov
ernm
ent
NS
W g
over
nmen
t
SA
loca
l gov
ernm
ents
Aus
tral
ian
gove
rnm
ent
WA
gov
ernm
ent
TAS
loca
l gov
ernm
ents
QLD
loca
l gov
ernm
ents
NT
gove
rnm
ent
SA
gov
ernm
ent
NT
loca
l gov
ernm
ents
209219 221 221 222 224 224 225 225 226 228 229 230 232 233 238
0
50
100
150
200
250
Per
cen
t
-5.5 -5.5
-4.5-4.1
-3.5
-2.5 -2.4 -2.3
-1.4 -1.3
0.3 0.5
1.7 1.9
5.3
6.3
-8
-6
-4
-2
0
2
4
6
8
Aus
tralia
n go
vern
men
t
VIC
gov
ernm
ent
WA
gov
ernm
ent
TAS
gov
ernm
ent
QLD
gov
ernm
ent
NT
gove
rnm
ent
NS
W g
over
nmen
t
SA
loca
l gov
ernm
ents
VIC
loca
l gov
ernm
ents
SA
gov
ernm
ent
NS
W lo
cal g
over
nmen
ts
AC
T go
vern
men
t
QLD
loca
l gov
ernm
ents
WA
loca
l gov
ernm
ents
TAS
loca
l gov
ernm
ents
NT
loca
l gov
ernm
ents
Page 15
Carbon Dioxide Emissions from New Australian Vehicles 2010 Information Paper
Fuel type
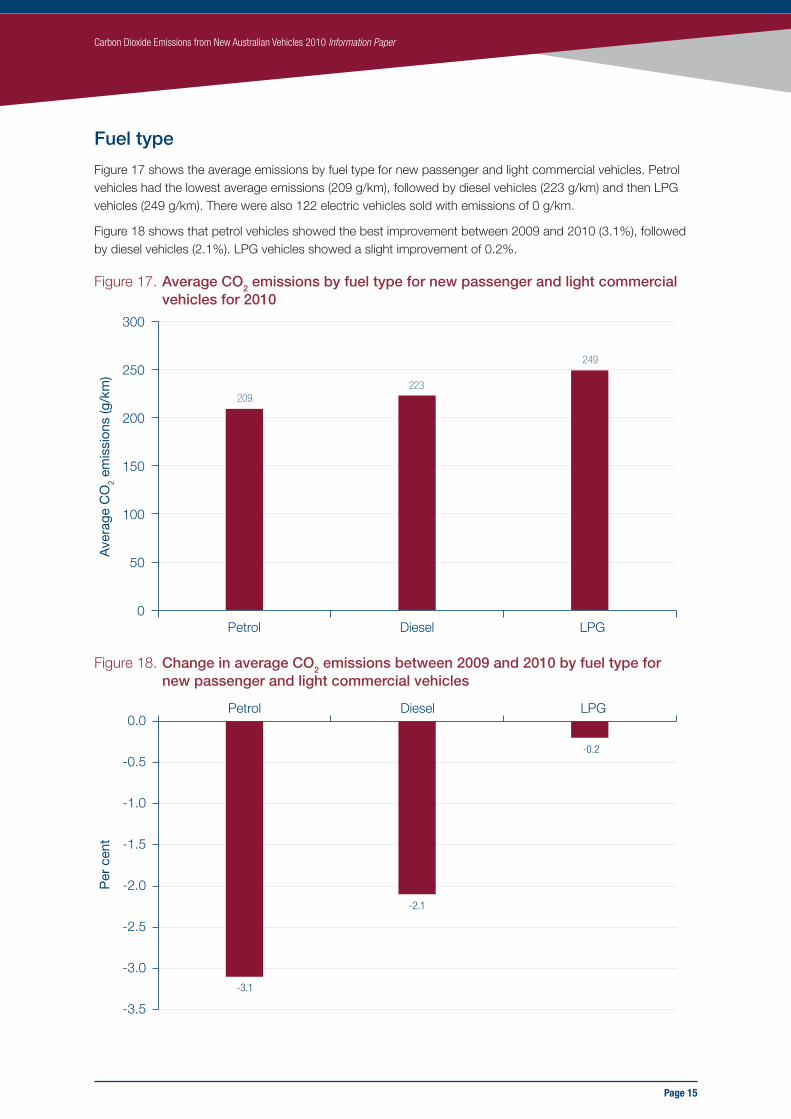
Figure 17 shows the average emissions by fuel type for new passenger and light commercial vehicles. Petrol vehicles had the lowest average emissions (209 g/km), followed by diesel vehicles (223 g/km) and then LPG vehicles (249 g/km). There were also 122 electric vehicles sold with emissions of 0 g/km.
Figure 18 shows that petrol vehicles showed the best improvement between 2009 and 2010 (3.1%), followed by diesel vehicles (2.1%). LPG vehicles showed a slight improvement of 0.2%.
Figure 17. Average CO2 emissions by fuel type for new passenger and light commercial vehicles for 2010
Figure 18. Change in average CO2 emissions between 2009 and 2010 by fuel type for new passenger and light commercial vehicles
0
50
100
150
200
250
300
Ave
rage
CO
2 em
issi
ons
(g/k
m)
Petrol Diesel LPG
209223
249
Per
cen
t
Petrol Diesel LPG
-3.1
-0.2
-3.5
-3.0
-2.5
-2.0
-1.5
-1.0
-0.5
0.0
-2.1

Page 16
Carbon Dioxide Emissions from New Australian Vehicles 2010 Information Paper
4. Comparison of Australian and International DataIn this section, Australian and international data are compared. However, this task is not straightforward because different methods are used worldwide to calculate vehicle emissions. The three main methods are:
• European method
• Japanese method and
• United States method.
Each method can give a different emissions result when applied to the same vehicle.
Australia uses the European method. Therefore, Australian vehicle emissions are directly comparable with European vehicle emissions. However, the published data from Europe refers either to passenger vehicles or to light commercial vehicles. The Australian data, as presented in Section 3, is combined data covering both passenger vehicles and light commercial vehicles. NTC analysed the Australia data further so that it could be directly compared with the European data.
To produce comparable data, the following vehicle segments were grouped:
• passenger vehicles: light, small, medium, large, upper large, sports, people movers, SUV compact, SUV medium, SUV large and SUV luxury and
• light commercial vehicles: pick-ups 4x2, pick-ups 4x4, trucks 2.5–3.5 tonnes and vans.
Table 4 gives emissions data for these two groups. The average emissions for passenger vehicles in Australia was 205 g/km in 2010. This was a 2.7 improvement from the previous year. The average emissions for light commercial vehicles in Australia was 250 g/km in 2010. This was a 1.1% improvement from the previous year.
Table 4. Average CO2 emissions for passenger vehicles and light commercial vehicle for 2009 and 2010
Vehicles
Average vehicle CO2 emissions (g/km)
Annual change2009 2010
Passenger 210 205 –2.7%
Light commercial 253 250 –1.1%
NTC has compared Australian and European data for light commercial vehicles for 2007 (NTC 2009). However, no post-2007 European data could be found. Therefore, a similar analysis could not be repeated in this paper.
The rest of this section compares Australian and European data for passenger vehicles. The latest European data for passenger vehicles is for 2009 and hence the analysis that follows focuses on 2009. The last section discusses reasons for the differences between the Australian and European data.
Passenger vehicles: emissions by country
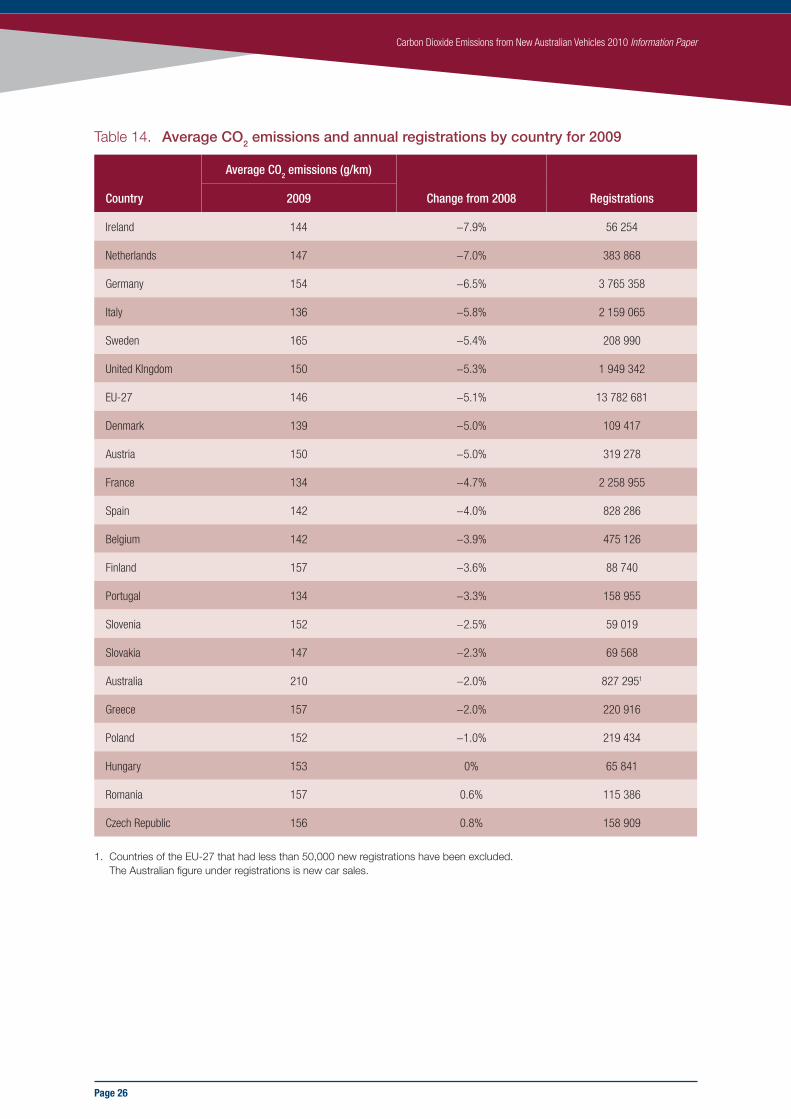
In 2009, the European average emissions for new passenger vehicles was 146 g/km. Australia’s average emissions was 210 g/km: 44% higher than the European average. In 2009, European emissions ranged from 134 g/km in France to 165 g/km in Sweden (see Table 14 in Appendix A).
The reduction in average emissions between 2008 and 2009 for Europe was 5.1%. Australia’s average emissions fell by 2%. The European countries showed the highest annual reductions were Ireland (7.9%) and the Netherlands (7%) (see Table 15 in Appendix A).

Page 17
Carbon Dioxide Emissions from New Australian Vehicles 2010 Information Paper
Passenger vehicles: proportion of “green” cars
The Swedish Government defines a “green” car as a vehicle whose emissions of carbon dioxide do not exceed 120 g/km (Government Offices of Sweden 2007). In Australia, the proportion of “green” passenger cars sold in 2010 was 0.6% of total sales (compared to 0.7% in 2009).
There were 13 models of “green” cars available in Australia in 2010. This includes Mitsubishi’s i-MiEV electric vehicle with emissions of 0 g/km.
Passenger vehicles: emissions by manufacturer
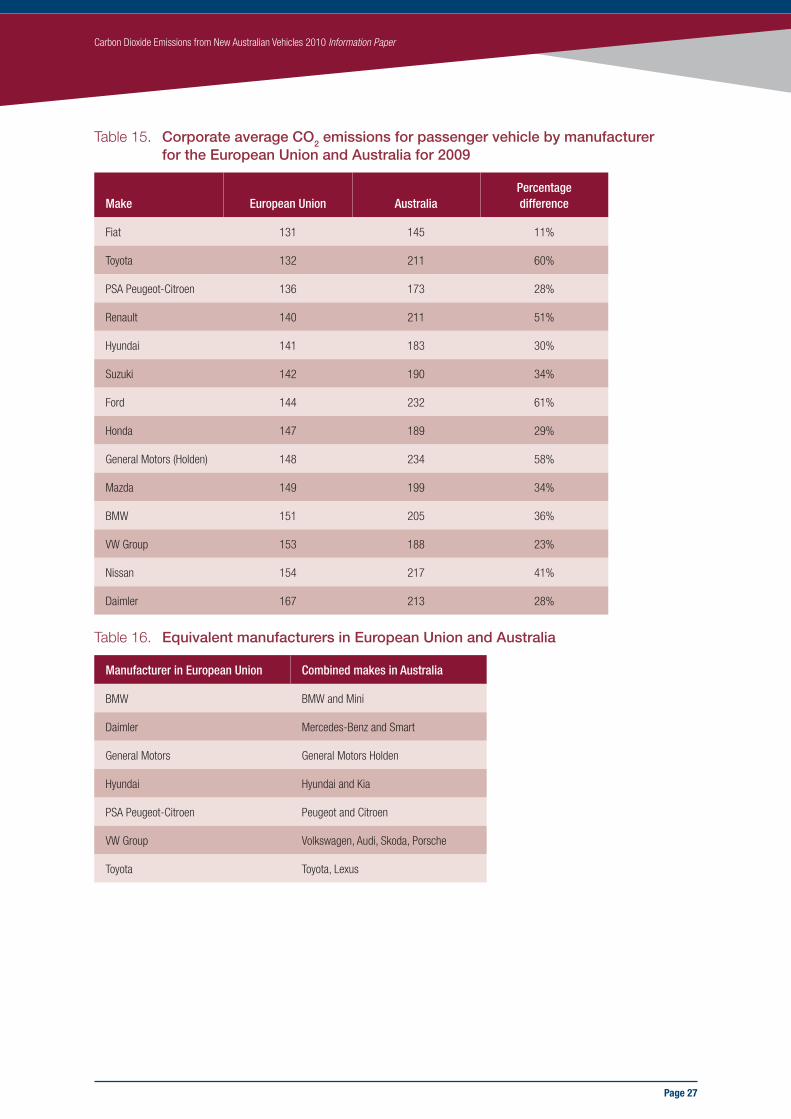
The average emissions in 2009 for new vehicles by manufacturer for the European Union and Australia are shown in Figure 19. Vehicles have been grouped in a way that makes comparisons possible. (The groupings are shown in Table 16 in Appendix A.) The range of corporate average emissions in the European Union is from 131 g/km (for Fiat) to 167 g/km (for Daimler). The range of corporate average emissions in Australian is from 145 g/km (for Fiat) to 234 g/km (for General Motors Holden). Note that the range of emissions in the European Union is 36 g/km compared to 89 g/km in Australia.
Figure 19. Corporate average CO2 emissions for new passenger vehicles by manufacturer for the European Union and Australia - 2009 (Transport and Environment 2010)
Ave
rage
CO
2 em
issi
ons
(g/k
m)
Fiat
Toyo
ta
PS
A P
euge
ot-C
itroe
n
Ren
ault
Hyu
ndai
Suz
uki
Ford
Hon
da
Gen
eral
Mot
ors
(Hol
den)
Maz
da
BM
W
VW
Gro
up
Nis
san
Dai
mle
r
131 132 136 140 141 144142 147 148 149 151 153 154167
213217
188
205199
234
189
232
190183
211
173
211
145
0
50
100
150
200
250
European Union
Australia

Page 18
Carbon Dioxide Emissions from New Australian Vehicles 2010 Information Paper
Figure 20 shows the percentage higher corporate average emissions for Australian makes compared to the European makes. Fiat has the smallest difference (11%) in corporate average between Australia and the European Union. Ford has the largest difference (61%).
Figure 20. Percentage higher corporate average CO2 emissions in Australia compared to the European Union for new passenger vehicles by manufacturer for 2009
Source for European Union data: Transport and Environment (2010).
Discussion
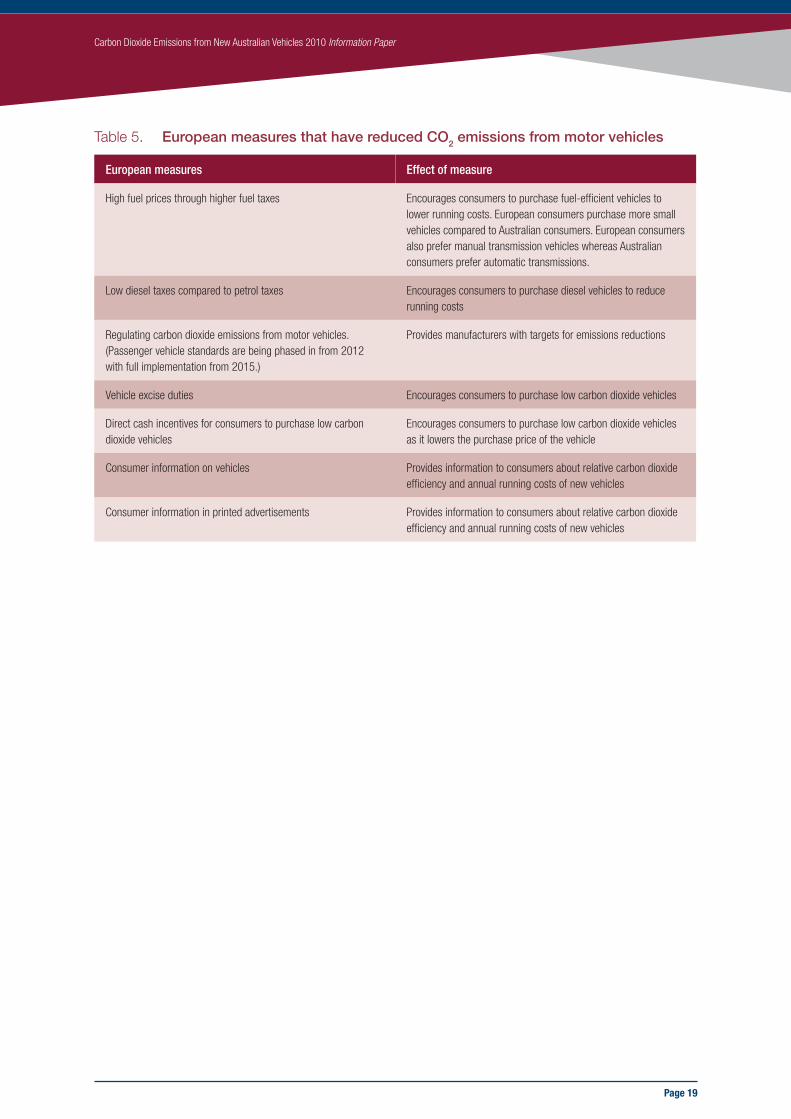
There are a number of reasons why emissions from new vehicles in the European countries analysed are lower than in Australia. One is that there have been fewer measures in Australia to reduce carbon dioxide emissions. The European measures are shown in Table 5. A summary of the European measures was published by the European Conference of Ministers of Transport (2007).
Per
cen
t
Fiat
VW
Gro
up
PS
A P
euge
ot-C
itroe
n
Dai
mle
r
Hon
da
Hyu
ndai
Suz
uki
Maz
da
BM
W
Nis
san
Ren
ault
Gen
eral
Mot
ors
(Hol
den)
Toyo
ta
Ford
11
23
29 30
34 3436
41
51
5860 61
28 28
0
10
20
30
40
50
60
70
Page 19
Carbon Dioxide Emissions from New Australian Vehicles 2010 Information Paper
Table 5. European measures that have reduced CO2 emissions from motor vehicles
European measures Effect of measure
High fuel prices through higher fuel taxes Encourages consumers to purchase fuel-efficient vehicles to lower running costs. European consumers purchase more small vehicles compared to Australian consumers. European consumers also prefer manual transmission vehicles whereas Australian consumers prefer automatic transmissions.
Low diesel taxes compared to petrol taxes Encourages consumers to purchase diesel vehicles to reduce running costs
Regulating carbon dioxide emissions from motor vehicles. (Passenger vehicle standards are being phased in from 2012 with full implementation from 2015.)
Provides manufacturers with targets for emissions reductions
Vehicle excise duties Encourages consumers to purchase low carbon dioxide vehicles
Direct cash incentives for consumers to purchase low carbon dioxide vehicles
Encourages consumers to purchase low carbon dioxide vehicles as it lowers the purchase price of the vehicle
Consumer information on vehicles Provides information to consumers about relative carbon dioxide efficiency and annual running costs of new vehicles
Consumer information in printed advertisements Provides information to consumers about relative carbon dioxide efficiency and annual running costs of new vehicles
Page 20
Carbon Dioxide Emissions from New Australian Vehicles 2010 Information Paper
ReferencesAustralian Labor Party 2010, Emissions standards for cars http://www.alp.org.au/agenda/environment/emission-standards-for-cars, viewed on 9 March 2011.
Department of Climate Change 2009, National greenhouse accounts (NGA) factors, DCC, Canberra.
European Conference of Ministers of Transport 2007, Cutting Transport CO2 Emissions. What Progress? OECD, Paris.
Federal Chamber of Automotive Industries 2009, http://www.fcai.com.au/sales/segmentation-criteria, viewed on 29 July 2009.
Federal Chamber of Automotive Industries 2011, http://www.fcai.com.au/news/all/all/264/significant-improvement-in-vehicle-fuel-efficiency, viewed on 9 March 2011.
Government offices of Sweden 2007, The Swedish government introduces green car rebate, press release, Ministry of the Environment, 30 March. http://www.sweden.gov.se/sb/d/8202/a/79866, viewed on 25 September 2009.
National Transport Commission 2009, Carbon emissions from new Australian vehicles information paper, Melbourne.
Transport and Environment 2010, How clean are Europe’s cars? An analysis of carmaker progress towards EU CO2 targets in 2009, Transport and Environment, Brussels.

Page 21
Carbon Dioxide Emissions from New Australian Vehicles 2010 Information Paper
Appendix AThis appendix provides annual sales and average vehicle emissions data used in this report.
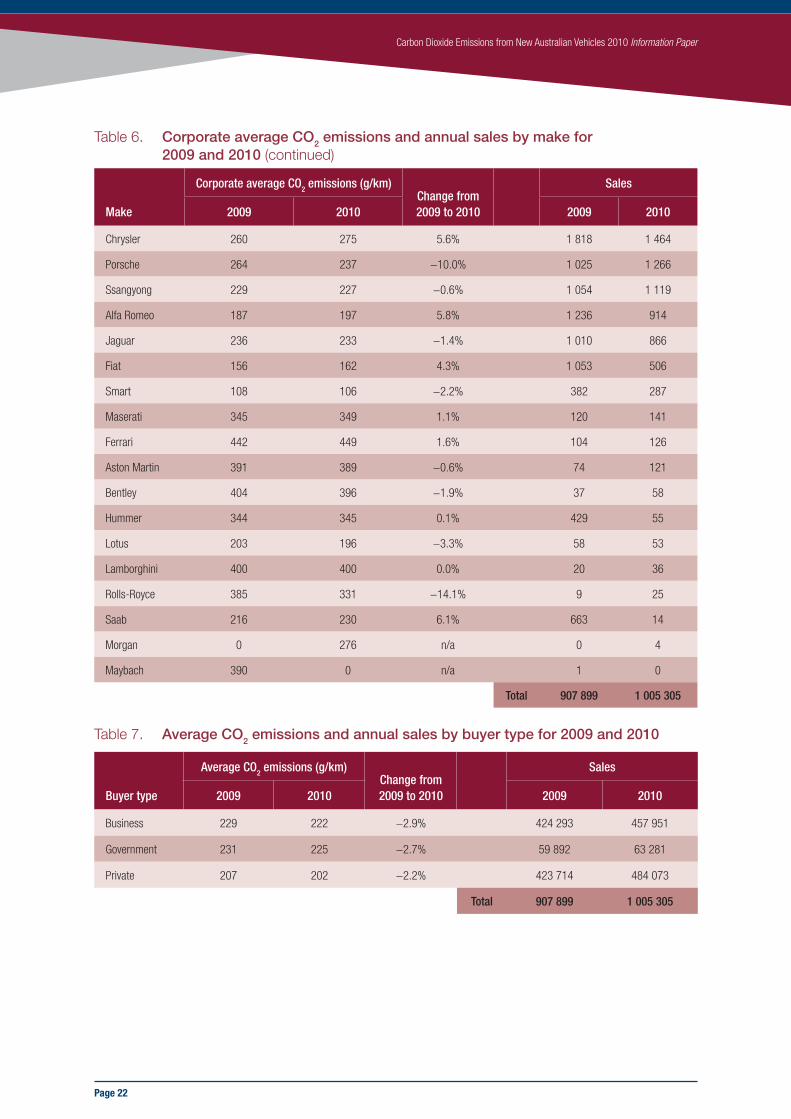
Table 6. Corporate average CO2 emissions and annual sales by make for 2009 and 2010
Make
Corporate average CO2 emissions (g/km)Change from 2009 to 2010
Sales
2009 2010 2009 2010
Toyota 222 217 −2.1% 200 709 214 352
Holden 242 229 −5.2% 119 568 132 923
Ford 241 237 −1.6% 4 647 93 754
Mazda 205 204 −0.5% 77 739 84 777
Hyundai 182 182 0.1% 63 207 80 038
Nissan 232 230 −1.0% 52 901 62 676
Mitsubishi 224 215 −3.7% 56 998 62 384
Honda 189 189 0.2% 41 443 40 375
Subaru 222 215 −3.2% 36 506 40 025
Volkswagen 187 175 −6.4% 29 651 37 172
Suzuki 190 177 −6.5% 20 298 24 789
Kia 200 199 −0.8% 19 407 23 848
Mercedes-Benz 217 209 −3.5% 16 379 19 441
BMW 210 191 −9.1% 17 099 17 993
Audi 191 182 −4.7% 11 310 12 900
Great Wall 250 251 0.2% 1 907 6 690
Lexus 227 220 −3.0% 5 836 6 526
Jeep 266 266 0.0% 4 193 5 975
Peugeot 174 173 −0.7% 5 744 5 649
Isuzu Ute 223 224 0.3% 3 566 5 114
Volvo Car 238 230 −3.3% 4 668 4 945
Land Rover 278 260 −6.7% 3 813 4 789
MINI 157 152 −3.4% 2 030 2 267
Dodge 249 253 1.9% 2 420 1 917
Proton 159 156 −1.9% 1 635 1 898
Renault 204 208 2.1% 2 278 1 778
Skoda 173 174 0.5% 1 252 1 652
Citroen 174 168 −3.7% 1 602 1 603
Page 22
Carbon Dioxide Emissions from New Australian Vehicles 2010 Information Paper
Make
Corporate average CO2 emissions (g/km)Change from 2009 to 2010
Sales
2009 2010 2009 2010
Chrysler 260 275 5.6% 1 818 1 464
Porsche 264 237 −10.0% 1 025 1 266
Ssangyong 229 227 −0.6% 1 054 1 119
Alfa Romeo 187 197 5.8% 1 236 914
Jaguar 236 233 −1.4% 1 010 866
Fiat 156 162 4.3% 1 053 506
Smart 108 106 −2.2% 382 287
Maserati 345 349 1.1% 120 141
Ferrari 442 449 1.6% 104 126
Aston Martin 391 389 −0.6% 74 121
Bentley 404 396 −1.9% 37 58
Hummer 344 345 0.1% 429 55
Lotus 203 196 −3.3% 58 53
Lamborghini 400 400 0.0% 20 36
Rolls-Royce 385 331 −14.1% 9 25
Saab 216 230 6.1% 663 14
Morgan 0 276 n/a 0 4
Maybach 390 0 n/a 1 0
Total 907 899 1 005 305
Table 7. Average CO2 emissions and annual sales by buyer type for 2009 and 2010
Buyer type
Average CO2 emissions (g/km)Change from 2009 to 2010
Sales
2009 2010 2009 2010
Business 229 222 −2.9% 424 293 457 951
Government 231 225 −2.7% 59 892 63 281
Private 207 202 −2.2% 423 714 484 073
Total 907 899 1 005 305
Table 6. Corporate average CO2 emissions and annual sales by make for 2009 and 2010 (continued)
Page 23
Carbon Dioxide Emissions from New Australian Vehicles 2010 Information Paper
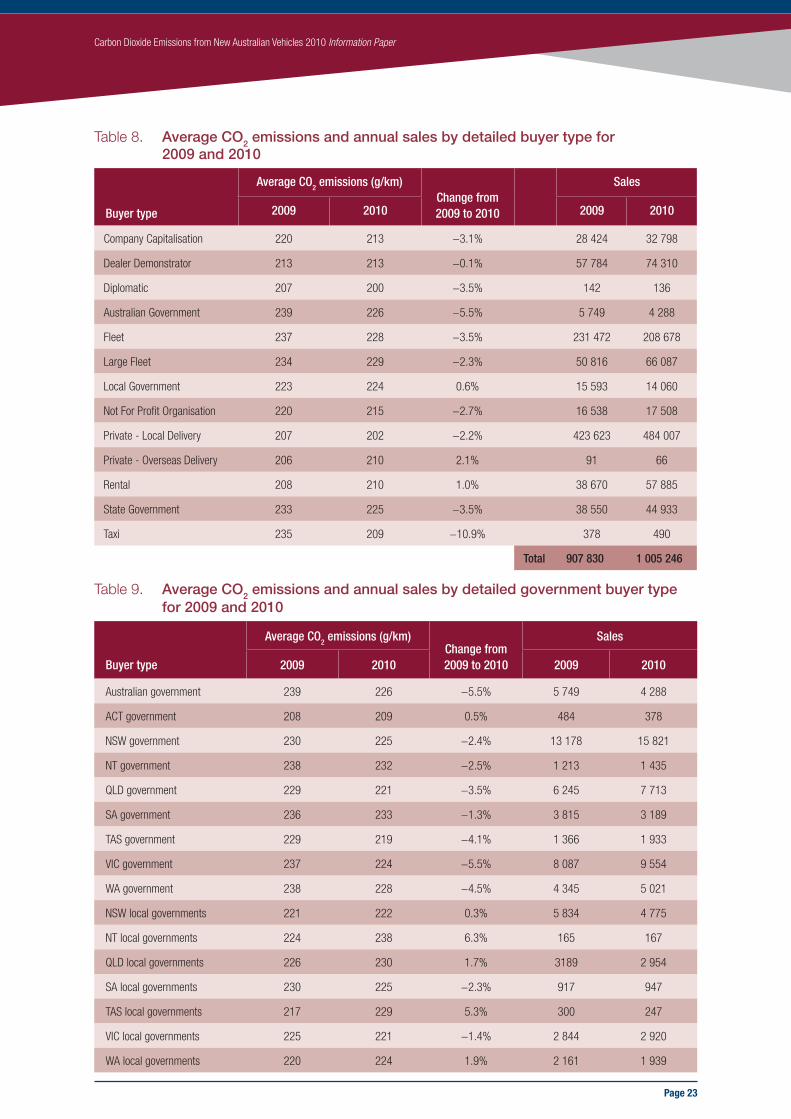
Table 8. Average CO2 emissions and annual sales by detailed buyer type for 2009 and 2010
Buyer type
Average CO2 emissions (g/km)Change from 2009 to 2010
Sales
2009 2010 2009 2010
Company Capitalisation 220 213 −3.1% 28 424 32 798
Dealer Demonstrator 213 213 −0.1% 57 784 74 310
Diplomatic 207 200 −3.5% 142 136
Australian Government 239 226 −5.5% 5 749 4 288
Fleet 237 228 −3.5% 231 472 208 678
Large Fleet 234 229 −2.3% 50 816 66 087
Local Government 223 224 0.6% 15 593 14 060
Not For Profit Organisation 220 215 −2.7% 16 538 17 508
Private - Local Delivery 207 202 −2.2% 423 623 484 007
Private - Overseas Delivery 206 210 2.1% 91 66
Rental 208 210 1.0% 38 670 57 885
State Government 233 225 −3.5% 38 550 44 933
Taxi 235 209 −10.9% 378 490
Total 907 830 1 005 246
Table 9. Average CO2 emissions and annual sales by detailed government buyer type for 2009 and 2010
Buyer type
Average CO2 emissions (g/km)Change from 2009 to 2010
Sales
2009 2010 2009 2010
Australian government 239 226 −5.5% 5 749 4 288
ACT government 208 209 0.5% 484 378
NSW government 230 225 −2.4% 13 178 15 821
NT government 238 232 −2.5% 1 213 1 435
QLD government 229 221 −3.5% 6 245 7 713
SA government 236 233 −1.3% 3 815 3 189
TAS government 229 219 −4.1% 1 366 1 933
VIC government 237 224 −5.5% 8 087 9 554
WA government 238 228 −4.5% 4 345 5 021
NSW local governments 221 222 0.3% 5 834 4 775
NT local governments 224 238 6.3% 165 167
QLD local governments 226 230 1.7% 3189 2 954
SA local governments 230 225 −2.3% 917 947
TAS local governments 217 229 5.3% 300 247
VIC local governments 225 221 −1.4% 2 844 2 920
WA local governments 220 224 1.9% 2 161 1 939
Page 24
Carbon Dioxide Emissions from New Australian Vehicles 2010 Information Paper
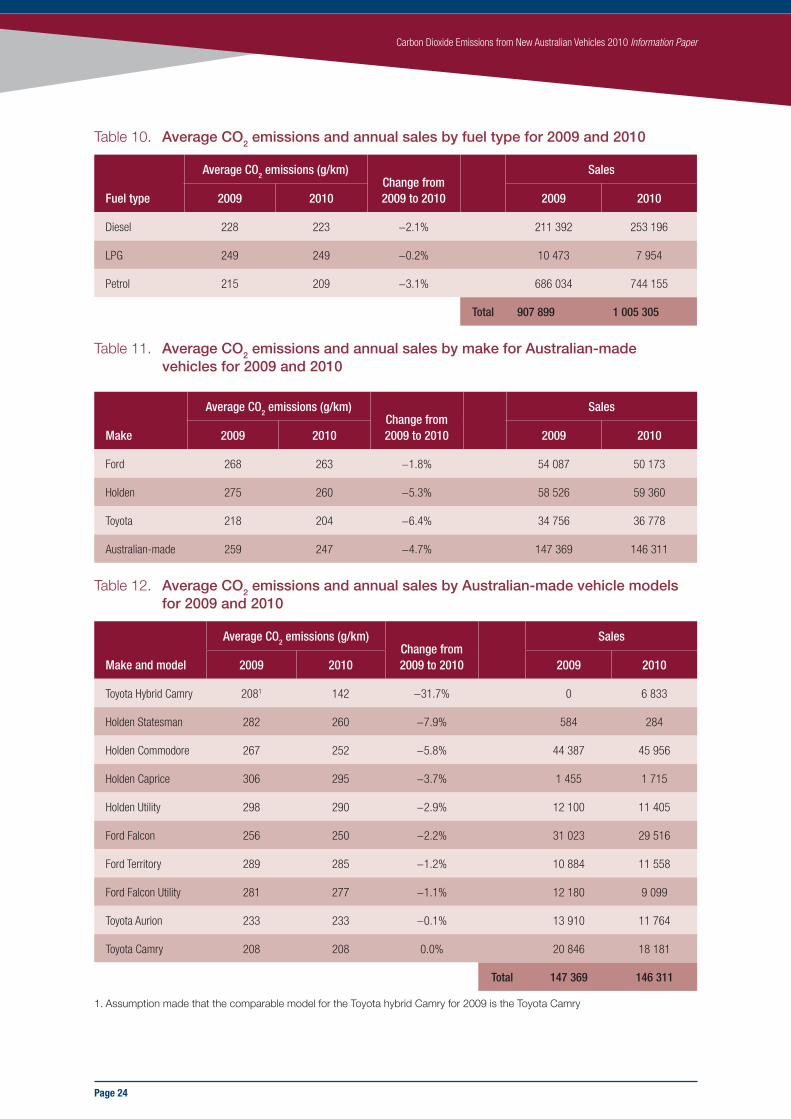
Table 10. Average CO2 emissions and annual sales by fuel type for 2009 and 2010
Fuel type
Average CO2 emissions (g/km)Change from 2009 to 2010
Sales
2009 2010 2009 2010
Diesel 228 223 −2.1% 211 392 253 196
LPG 249 249 −0.2% 10 473 7 954
Petrol 215 209 −3.1% 686 034 744 155
Total 907 899 1 005 305
Table 11. Average CO2 emissions and annual sales by make for Australian-made vehicles for 2009 and 2010
Make
Average CO2 emissions (g/km)Change from 2009 to 2010
Sales
2009 2010 2009 2010
Ford 268 263 −1.8% 54 087 50 173
Holden 275 260 −5.3% 58 526 59 360
Toyota 218 204 −6.4% 34 756 36 778
Australian-made 259 247 −4.7% 147 369 146 311
Table 12. Average CO2 emissions and annual sales by Australian-made vehicle models for 2009 and 2010
Make and model
Average CO2 emissions (g/km)Change from 2009 to 2010
Sales
2009 2010 2009 2010
Toyota Hybrid Camry 2081 142 −31.7% 0 6 833
Holden Statesman 282 260 −7.9% 584 284
Holden Commodore 267 252 −5.8% 44 387 45 956
Holden Caprice 306 295 −3.7% 1 455 1 715
Holden Utility 298 290 −2.9% 12 100 11 405
Ford Falcon 256 250 −2.2% 31 023 29 516
Ford Territory 289 285 −1.2% 10 884 11 558
Ford Falcon Utility 281 277 −1.1% 12 180 9 099
Toyota Aurion 233 233 −0.1% 13 910 11 764
Toyota Camry 208 208 0.0% 20 846 18 181
Total 147 369 146 311
1. Assumption made that the comparable model for the Toyota hybrid Camry for 2009 is the Toyota Camry

Page 25
Carbon Dioxide Emissions from New Australian Vehicles 2010 Information Paper
Table 13. Average CO2 emissions and annual sales by segment for 2009 and 2010
Segment
Average CO2 emissions (g/km)Change from 2009 to 2010
Sales
2009 2010 2009 2010
Light 158 157 –1.0% 116 460 137 804
Small 182 181 –0.8% 213 988 239 191
Medium 210 200 –5.2% 76 624 82 622
Large 254 245 –3.6% 101 701 98 583
Upper Large 284 278 –1.9% 3 592 3 753
Sports 219 206 –5.9% 17 145 17 393
People movers 246 250 1.4% 11 032 12 655
SUV Compact 225 222 –1.2% 84 002 114 761
SUV Medium 263 254 –3.6% 72 210 83 811
SUV Large 292 293 0.2% 11 013 12 256
SUV Luxury 249 231 – 7.2% 20 928 24 457
Light buses 269 269 –0.3% 2 115 2 335
Pick-up 4x2 264 260 –1.6% 67 389 59 052
Pick-up 4x4 249 248 –0.4% 85 813 93 956
Trucks 2.5-3.5 tonne 268 258 –3.7% 610 676
Vans 233 231 –0.7% 23 277 22 000
Page 26
Carbon Dioxide Emissions from New Australian Vehicles 2010 Information Paper
Table 14. Average CO2 emissions and annual registrations by country for 2009
Country
Average CO2 emissions (g/km)
Change from 2008 Registrations2009
Ireland 144 −7.9% 56 254
Netherlands 147 −7.0% 383 868
Germany 154 −6.5% 3 765 358
Italy 136 −5.8% 2 159 065
Sweden 165 −5.4% 208 990
United KIngdom 150 −5.3% 1 949 342
EU-27 146 −5.1% 13 782 681
Denmark 139 −5.0% 109 417
Austria 150 −5.0% 319 278
France 134 −4.7% 2 258 955
Spain 142 −4.0% 828 286
Belgium 142 −3.9% 475 126
Finland 157 −3.6% 88 740
Portugal 134 −3.3% 158 955
Slovenia 152 −2.5% 59 019
Slovakia 147 −2.3% 69 568
Australia 210 −2.0% 827 2951
Greece 157 −2.0% 220 916
Poland 152 −1.0% 219 434
Hungary 153 0% 65 841
Romania 157 0.6% 115 386
Czech Republic 156 0.8% 158 909
1. Countries of the EU-27 that had less than 50,000 new registrations have been excluded. The Australian figure under registrations is new car sales.
Page 27
Carbon Dioxide Emissions from New Australian Vehicles 2010 Information Paper
Table 15. Corporate average CO2 emissions for passenger vehicle by manufacturer for the European Union and Australia for 2009
Make European Union AustraliaPercentage difference
Fiat 131 145 11%
Toyota 132 211 60%
PSA Peugeot-Citroen 136 173 28%
Renault 140 211 51%
Hyundai 141 183 30%
Suzuki 142 190 34%
Ford 144 232 61%
Honda 147 189 29%
General Motors (Holden) 148 234 58%
Mazda 149 199 34%
BMW 151 205 36%
VW Group 153 188 23%
Nissan 154 217 41%
Daimler 167 213 28%
Table 16. Equivalent manufacturers in European Union and Australia
Manufacturer in European Union Combined makes in Australia
BMW BMW and Mini
Daimler Mercedes-Benz and Smart
General Motors General Motors Holden
Hyundai Hyundai and Kia
PSA Peugeot-Citroen Peugeot and Citroen
VW Group Volkswagen, Audi, Skoda, Porsche
Toyota Toyota, Lexus

Page 28
Carbon Dioxide Emissions from New Australian Vehicles 2010 Information Paper


www.ntc.gov.au