
Information, Liquidity and Corporate Yield Spreads · Information, Liquidity and Corporate Yield...
61
1 Information, Liquidity and Corporate Yield Spreads Xing Zhou ∗ Rutgers Business School Rutgers University ABSTRACT Valuation of corporate debt has been an extremely important, albeit imprecise task in asset pricing. Both structural models and reduced form models have had limited success in explaining the corporate yield spreads observed in actual markets. This paper demonstrates that in addition to liquidity, information asymmetry plays an important role in determining yield spreads of risky corporate bonds. In line with a strand of recent literature on the implications of market microstructure for asset pricing, this paper suggests corporate bond yields might embed an information risk premium that is ignored by existing bond pricing models. ∗ I thank NASD for help with the data. The views expressed herein are solely those of the author and not those of any other person or entity, including NASD. I thank Hazem Daouk, David Easley, Yongmiao Hong, Robert Jarrow, David Ng, Maureen O’Hara, David Weinbaum, Xiaoyan Zhang and seminar participants at Cornerstone Research, Cornell University, Rutgers University, University of South Carolina and University of Toronto for helpful comments and discussions. Any errors are my own.
Transcript of Information, Liquidity and Corporate Yield Spreads · Information, Liquidity and Corporate Yield...

1
Information, Liquidity and Corporate Yield Spreads
Xing Zhou∗
Rutgers Business School
Rutgers University
ABSTRACT
Valuation of corporate debt has been an extremely important, albeit imprecise task in asset pricing. Both structural models and reduced form models have had limited success in explaining the corporate yield spreads observed in actual markets. This paper demonstrates that in addition to liquidity, information asymmetry plays an important role in determining yield spreads of risky corporate bonds. In line with a strand of recent literature on the implications of market microstructure for asset pricing, this paper suggests corporate bond yields might embed an information risk premium that is ignored by existing bond pricing models.
∗ I thank NASD for help with the data. The views expressed herein are solely those of the author and not those of any other person or entity, including NASD. I thank Hazem Daouk, David Easley, Yongmiao Hong, Robert Jarrow, David Ng, Maureen O’Hara, David Weinbaum, Xiaoyan Zhang and seminar participants at Cornerstone Research, Cornell University, Rutgers University, University of South Carolina and University of Toronto for helpful comments and discussions. Any errors are my own.

2
Traditional structural models of default risk, built on the original insights of
Black and Scholes (1973) and Merton (1974), provide an intuitive framework for
identifying the determinants of yield spread of risky debt securities. According to
Merton (1974), corporate debt can be valued as a portfolio comprised of similar risk
free debt and a short position in a put option on the issuer’s assets. This option-based
approach has been extended in numerous theoretical studie1 to incorporate realistic
economic considerations. For example, Longstaff and Schwartz (1995) propose a
tractable model which incorporates both default risk and interest rate risk and allows
for deviations from strict absolute priority. Anderson and Sundaresan (1996) and
Mella-Barral and Perraudin (1997) factor strategic debt service into the premium on
risky corporate debt. Leland and Toft (1996) relax the assumption of the
exogenously–determined default boundaries, and Collin-Dufresne and Goldstein
(2001) improve on the structural approach by allowing the firms to adjust their capital
structure to reflect changes in asset value.
Despite the richness of this structural paradigm, practical applications have
been disappointing. Several empirical analyses [see for example, Jones, Mason and
Rosenfeld (1984)] have shown that the Corporate-Treasury yield spreads generated
by the original Merton (1974) model are significantly below those observed in the
market. Additionally, tests of other structural models have not yet reached any
consensus on the ability of these models to explain the observed corporate yield
spreads [see Anderson and Sundaresan (2000), Lyden and Saraniti (2000) and Eom,
Helwege and Huang (2002)]. Instead, Collin-Dufresne, Goldstein and Martin (2001)
find that variables that should theoretically determine credit spread changes actually
have rather limited explanatory power. Furthermore, they identify a ‘single common
factor’ that drives most of the changes in yield spreads. This common factor, however,
1 See Anderson and Sundaresan (1996), Black and Cox (1976), Collin-Dufresne and Goldstein (2001), Duffie and
Lando (2001), Geske (1977), Ingersoll (1977), Kim, Ramaswamy and Sundaresan (1993), Leland (1994, 1998),
Leland and Toft (1996), Longstaff and Schwartz (1995), Mella-Barral and Perraudin (1997) and Zhou (2001).

3
can not be explained by any macroeconomic or financial variables in their study.
Moreover, Huang and Huang (2003) conclude that credit risk accounts for only part
of the observed Corporate-Treasury yield spreads, leaving the rest again unexplained
within the structural framework of credit risk valuation.
Instead of modeling credit risks on the variability of the firm’s asset value as
in the structural framework, an alternative approach would be reduced form models2,
which value risky bonds by discounting certainty equivalent cash flows at risk free
rates. Therefore, the value of a risky bond is directly linked to the default risk and the
recovery rate in the event of default, both of which are assumed to be stochastic and
exogenous to the model. Compared to structural models, reduced form models are
more flexible, and mathematically more tractable. Furthermore, they incorporate
several factors other than default risk, such as illiquidity and state taxes, into the
stochastic default risk process. However, these models are still unable to fully
rationalize actual corporate yield spreads. The unsatisfactory performance of these
two basic approaches underscores the weakness of our understanding of corporate
bond price behavior.
I will argue in this paper that corporate bond market microstructure factors,
including information and liquidity, affect corporate bond yield spreads. Consistent
with Chen, Lesmond and Wei (2006), I find that liquidity is an important factor in
determining yield spread of risky corporate bonds. But perhaps more important, I also
find that the degree of asymmetric information in individual bonds contains
significant additional power in explaining corporate yield spreads. This finding
suggests that actual corporate yield spreads may incorporate both an information
premium and a liquidity premium that are ignored by traditional corporate bond
2 See Duffee (1999), Duffie and Singleton (1997, 1999), Das and Tufano (1996), Elton, Gruber, Agrawal and
Mann (2001), Lando (1997), Madan and Unal (1998, 2000), Jarrow, Lando and Turnbull (1997), Jarrow and
Turnbull (1995).

4
pricing models. It also confirms the general argument made by O’Hara in her 2003
American Finance Association (AFA) Presidential Address regarding the implications
of market microstructure for asset pricing: “Markets provide two important
functions—liquidity and price discovery…. Asset pricing models need to be recast in
broader terms to incorporate the transaction costs of liquidity and the risks of price
discovery.”3
Several authors have noted that the relative liquidities of corporate and
Treasury bonds, and the role of liquidity in the pricing of corporate debt has been
explored in a host of recent studies. 4 Since illiquidity prevents investors from
continuously hedging their risks, a liquidity premium is required for compensation.
Because secondary corporate bond transactions take place in the over-the-counter
(OTC) market, meaningful quote data is difficult to obtain, making it impossible to
directly calculate reliable measures of liquidity, such as the bid-ask spread.
Furthermore, quality bond transaction data did not exist before the introduction of the
Trade Reporting and Compliance Engine (TRACE)5 by the National Association of
Securities Dealers (NASD). Because of this, empirical research in this area has relied
on indirect liquidity measures,6 including the total amount of a bond issue [Alexander,
3 See O’Hara (2003), Presidential Address: Liquidity and Price Discovery, Journal of Finance 58, page 1335. 4 The role of liquidity in the pricing of equity securities has been studied extensively in the literature on the
implications of market microstructure for asset pricing. See for example, Amihud (2002), Amihud and Mendelson
(1986, 1988), Acharya and Pedersen (2004), Boudoukh and Whitelaw (1993), Brennan and Subrahmanyam (1996),
Brennan, Chordia and Subrahmanyam (1998), Chalmers and Kadlec (1998), Chordia, Roll and Subrahmanyam
(2000), Haugen and Baker (1996), Chordia, Subrahmanyam and Anshuman (2001), Pastor and Stambaugh (2001),
Vayanos (2004) and Hasbrouck (2005). Liquidity in the Treasury markets has also been the topic of numerous
studies. See for example, Sarig and Warga (1989), Amihud and Mendelson (1991), Warga (1992), Daves and
Ehrhardt (1993), Kamara (1994), Elton and Green (1998), Fleming (2002, 2003), Strebulaev (2002),
Krishnamurthy (2002) and Goldreich, Hanke and Nathy (2004). 5 For a detailed description of the TRACE system, see Zhou (2005a). 6 In the reduced form approach, liquidity is not modeled specifically to explain corporate yield spreads. Instead, it
is subsumed into the stochastic default risk process. Duffee (1999) simply argues that the unexplained part of
yields spreads is liquidity based.

5
Edwards and Ferri (2000) and Hong and Warga (2000)], coupon rate [Gehr and
Martell (1992)], whether the issuer’s equity is publicly traded [Alexander, Edwards
and Ferri (2000)], age of a bond [Alexander, Edwards and Ferri (2000), Hong and
Warga (2000) and Elton, Gruber, Agrawal and Mann (2002)], price volatility of a
bond [Alexander, Edwards and Ferri (2000) and Hong and Warga (2000)] and
number of market participants quoting the bond [Gehr and Martell (1992)]. 7
Houweling, Mentink and Vorst (2003) propose two additional measures: the
occurrence of ‘price runs’8 or missing values, and the dispersion of yields quoted
from different sources9. They show that all of these measures account for some
portion of the yield spread changes. Collin-Dufresne, Goldstein and Martin (2001)
quantify liquidity effects by using the spread between on- and off-the-run Treasuries,
swap spreads and the frequency of quotes versus matrix prices in the Warga database.
Furthermore, Longstaff, Mithal and Neis (2004) use the time-series average of the
bid-ask spread reported by Bloomberg, time to maturity of a bond, and dummy
variables for bonds issued by financial firms and for bonds issued by highly-rated
firms respectively. Chen Lesmond and Wei (2006) uses quarterly bid ask quotes from
Bloomberg, as well as percentage of zero return and another liquidity proxy derived
from Lesmond, Ogden and Trzcinka (1999). These proxies are demonstrated to be
strongly related to the nondefault component of yield spreads10.
While these different liquidity measures provide more insight into the
determinants of yield spread changes, their added explanatory power is rather limited.
7 For a more complete literature overview of liquidity measures from the empirical bond liquidity literature and
their effects on the bond yield, see Houweling, Mentink and Vorst (2003). 8 ‘Price Run’ occurs when two consecutive prices for a bond are identical. See Sarig and Warga (1989). 9 For a detailed description of how to calculate the yield dispersion, see Houweling, Mentink and Vorst (2003). 10 Other studies have investigated the exposure of corporate bond returns to liquidity shocks in related markets. De
Jong and Driessen (2004) show that corporate bond returns are closely related to changes in the equity market
liquidity and Treasury market liquidity. Cremers, Driessen, Maenhout and Weinbaum (2004) look at the liquidity
of the market for related individual options and find that the liquidity of the firm’s traded options have a
significant liquidity-spillover effect on the firm’s short-maturity corporate bonds.

6
Moreover, as almost all of these measures investigate the cross-sectional variation in
liquidity or liquidity changes at the aggregate level, little is known about how the
time-variation in corporate bond liquidity affects yield spreads on an individual basis.
Taking advantage of a recent corporate bond transaction data set from the NASD, I
use the number of transactions (NOT) and price impact [Amihud (2002)] to measure
the liquidity of individual corporate bonds. I find that over time, a low-grade
corporate bond’s liquidity has significant effects on its yield spread. A one-standard-
deviation drop in NOT leads to a widening of the yield spread by more than 13 basis
points, and a one-standard deviation increase in price impact raises the yield spread
by 52 basis points. This is consistent with previous studies on the liquidity effects on
bond yields, and suggests an important liquidity dimension to corporate yield spreads.
Compared to the extensive literature on liquidity effects in asset pricing,
research on information risk as a determinant of asset returns is still in its infancy.
During the process of new information becoming incorporated into market prices, the
informational advantage of informed traders creates risks for uninformed traders as
they constantly lose to the informed ones in the sense that they always end up with
portfolios that invest too much in bad assets and too little in good ones. In order for
investors to hold securities about which they are uninformed, an information risk
premium is required. In a theoretical paper, Easley and O’Hara (2004) develop an
asymmetric information asset pricing model and show that a firm’s information
structure has substantial effects on its cost of capital. An empirical application of this
model to the equity market is provided by Easley, Hvidkjaer and O’Hara (2004).
Consistent with the prediction of the Easley and O’Hara (2004) model, they find that
stocks with more private information and less public information have a higher excess
return, all else being equal. Specifically, they identify a 2.5 percent difference in
expected annual returns for two stocks with a difference of 10 percentage points in
their proxy for information asymmetry, the probability of information-based trading
7
(PIN)11. Easley, Hvidkjaer and O’Hara (2004) further confirm the information risk
premium in stock returns. After forming composite zero-investment portfolios by
taking long positions in high PIN stocks and short positions in low PIN stocks of
equal size, they show that these portfolios earn significant excess returns, which
cannot be explained by the Fama-French or momentum factors. The conclusion that
stock returns embed an information risk premium has also been reached by Burlacu,
Fontaine and Jimenez-Garces (2005).
This paper extends the literature on the implications of market microstructure
for asset pricing to corporate debt securities and investigates whether corporate yield
spreads observed in the market embed an information risk premium. There has been
substantial anecdotal evidence that information-based trading takes place in the
corporate bond market. In the late 1980s, investigations by the Securities and
Exchange Commission (SEC) and the U.S. Attorney’s Office revealed the occurrence
of insider trading in the junk bond market by Michael Milken, the “king of junk
bonds”. In 2000, Donald Trump quietly spent $46 million buying bonds issued by
Trump Hotels and Casino Resorts while he threatened to stop payment of interest to
investors in his bonds.12 Furthermore, in 1998, former SEC chairman Arthur Levitt
stated that the SEC has “found anecdotal evidence of the possible misuse of inside
information in the high-yield (debt) market.”13
Several studies in market microstructure literature also provide strong
empirical evidence of information-based trading in corporate debt securities. Datta
and Datta (1996) argue that the absence of any reporting requirement for insider bond
transactions may create an enhanced opportunity for insiders to exploit private
information to expropriate wealth from uninformed bond traders. In a companion
11 For PIN estimation details, see Easley, Kiefer and O’Hara (1997). 12 The Wall Street Journal, 10/31/2001. 13 See speech by former SEC Chairman Arthur Levitt: “The Importance of Transparency in America’s Debt Market”, at the Media Studies Center, New York, N.Y., on September 9th, 1998.

8
paper [Zhou (2005a)], I find that current high-yield bond returns have explanatory
power for future stock price changes, suggesting that the corporate bond market
serves an important role in the price discovery process. The fact that some bond
traders posses superior information related to the value of corporate bonds, and hence
might take advantage of this private information at the expense of uninformed traders
suggests that bond holders require compensation for bearing the asymmetric
information risk. Using a transaction-based asymmetric information measure (AIM)
for individual corporate bonds, I find that yield spreads of high-yield corporate bonds
are significantly affected by changes in the degree of information asymmetry, even
after accounting for effects of liquidity and other traditional corporate bond pricing
factors. A one-standard-deviation jump in the AIM measure of a corporate bond
causes the bond’s yield spread to increase by 71 basis points. Furthermore, the AIM
measure itself explains about 10% of the changes in yield spreads. The strong
evidence of information and liquidity components in the corporate yield spreads
provides insight into the credit spread puzzle.
The rest of the paper is structured as follows. Section I describes the AIM
measure, which is derived from an asymmetric information asset pricing model,
followed by empirical specifications of this measure for corporate bonds. Section II
describes the data used for this study with special emphasis on corporate bond
transaction data from the NASD’s TRACE system. Section III contains summary
descriptions of the results from estimating the private information content of
individual corporate bonds. In section IV, I empirically test whether corporate yield
spreads are related to the level of asymmetric information and liquidity of individual
bonds. Various robustness checks are performed in section V. I conclude my
arguments in section VI.
I. The Asymmetric Information Measure and its Empirical
Specifications for Corporate Bonds

9
Private information content of common stocks has been of extreme interest to
both academics and financial practitioners, and several approaches have been
suggested for its measurement. These approaches could be classified into two
categories: informal measures and formal microstructure model based measures.
Informal asymmetric information measures include measures related to financial
analysts, such as the forest error or the forecast dispersion [Krishnaswami and
Subramaniam (1998), Gilson et al. (1998), D’ Mello and Ferris (2000)], and the
number of following financial analysts [Brennan and Hughes (1991), Brennan et al.
(1993), Elton, Gruber and Gultekin (1984)], the market-to-book ratio or the price
earning ratio [Smith and Watts (1992), McLaughlin et. al. (1998)], and the firm-
specific return variation [Bhagat et al. (1985), Blackwell et al. (1990), Clark and
Shastri (2001), Van Ness et al. (2001). However, empirical studies show that these
informal measures present significant drawbacks. For example, Easley, O’Hara and
Paperman (1998) examine the relationship between analyst coverage and their PIN
(probability of informed trading) measure. They find that the number of financial
analysts is not a good proxy for information-based trading. Similar conclusions are
reached by Chung et al. (1995), Clarke and Shastri (2001) and Van Ness et al. (2002).
Clarke and Shastri (2001) and Van Ness et al. (2001) also cast some doubts on using
the market-to-book ratio or the price earning ratio to measure private information as
they find that these two measures have non-significant and sometimes even negative,
correlations with several alternative information asymmetry measures. Similarly,
using the firm-specific return variation as a proxy for the degree of information-based
trading is also very controversial. Morck et al. (2000) and Drunev (2004) argue high
specific return variations are often related to a more informative price. Hence the
correlation between return variations and the degree of private information is negative,
inconsistent with the argument that firms with high return variations tend to be more
risky, less known by the market and the degree of private information is higher.

10
A second group of measures are derived from theoretical microstructure models,
which include the informational component of bid-ask spreads and the PIN. As other
informal measures, they have also received various critics from the financial literature.
O’Hara (1995) declares that it is difficult to distinguish between the transitory and
informational component of the bid-ask spread. This argument has been supported by
several empirical studies. The estimated information components range from about
10% of the total bid-ask spread [George et al (1991) ] up to 40% [Madhavan (1997)].
Neal and Wheatley (1998) and Van Ness et al. (2001) concludes that the
informational component of spreads is rather a noisy transformation of the total bid-
ask spread and hence, these microstructure measures are poorly specified for
measuring a security’s degree of information asymmetry.
Another widely accepted formal measure is the PIN measure, which is proposed
and extended in a series of theoretical and empirical papers by Easley and O’Hara and
their coauthors. They show that the PIN measure has significant effects on stock
returns and its effects dominate those of other traditional factors. This measure has
received extensive support since its publication. It has been shown to be strongly
related to the specific stock return variations [Durnev et al. (2004)], the bid-ask
spread [Chung and Li (2003)] and the cost of capital [Botosan and Plumlee (2003)].
However, due to data limitations, estimating the PIN for corporate bonds turns out to
be extremely difficult.
This paper employs an alternative approach which measures information
asymmetry from transaction data, instead of quotes data. Burlacu et al (2005) is the
first to apply this approach in the equity securities. Using CRSP US daily stock data
for about 7,000 stocks over 17 years, they find that this AIM measure has a strong
impact on stock returns and dominates traditional asset pricing factors such as β and
the Fama and French factors.

11
The AIM measure is obtained directly from a Rational Expectations (RE) model
with multiple securities and many sources of uncertainty. This model is essentially a
generalization of the Grossman and Stiglitz (1980) model, which focuses on an
economy where some investors are more informed on the future distributions of a
security’s returns than others. Intuitively, if the market is noisy, price of a security
contains some private information about future returns. Since this part of private
information is not revealed by prices, it is related to future returns. The AIM measure
employed in this paper basically uses the degree of correlation between current
security prices and future returns as a measure of the private information embedded in
the security.
A. The Model
Consider an economy with information asymmetry. Investors trade N risky
securities and one risk-free security at time 0, and consume at time 1 when these
securities pay off. The pay-off (liquidation value) of risky security i is generated by
one specific and K common factors as follows:
i
K
kkkiiip εθβµ ++= ∑
=1,
1 ,
where 1ip is the payoff of risky security i, iµ and kθ represent the specific and
common factors respectively, ki ,β denotes the factor loading to the common factor k
for security i, and iε is the error term. The realization of the specific and common
factors is known toλ percent of the investors, known as informed traders, at time 0,
while the remaining investors only know that these factors are independent random
variables and have normal distributions. Investors are constant absolute risk averse,
and they trade to maximize their utility at time 1:
( ) 11 jIj eIU α−−= ,

12
where 1jI is investor j’s income at time 1, and α denotes the risk aversion coefficient
for investor j. The per capita supply of security i is assumed to be an independent
random variable iz , which is normally distributed. The supply iz is unknown by both
the informed and uninformed investors.
For expositional convenience, I drop the subscript for each random variable
and obtain random vectors. Specifically, let
[ ]′= NppppP ...321 ,
⎥⎥⎥⎥
⎦
⎤
⎢⎢⎢⎢
⎣
⎡
=Β
NKNN
K
K
βββ
ββββββ
...1...00
...0...10
...0...01
21
22221
11211
MMMMMMMM,
[ ]′=Θ KN θθθµµµ ...... 2121 ,
[ ]′=Ε Nεεεε ...321 ,
and [ ]′= NzzzzZ ...321 .
Thus, the N-vector of securities’ payoff at time 1 thus can be written as
EBP +Θ=1 ,
where Θ is the (N+K) dimensional vector containing both N common factors and K
specific factors, and B is the (N, N+K) block matrix obtained by joining the N
dimensional identity matrix with the matrix of asset factor loadings. Without loss of
generality, it is assumed the expected values and variance-covariance matrices for Θ ,
E and Z are Θ , 0, Z , and ΘΩ , εΩ and zΩ , respectively. All variance-covariance
matrices are further assumed to be regular.
Under certain regularity conditions, it is not difficulty to show that when some
investors possess superior information about future price movements, there exists a

13
unique equilibrium in which current equilibrium securities prices are linear functions
of the informed investors’ private information Θ and asset supplies Z at time 1:
ZAAAP 2100 −Θ+=
where 210 , AAA, are the coefficient matrices. Since the supplies Z are unknown to
both informed and uninformed investors, the uninformed investors are not able to
infer the realization of Θ from current securities prices. Therefore, part of the private
information remains in the hands of informed investors. Since ,1 EBP +Θ= the
equilibrium price at time 0 also suggests that the total amount of uncertainty about
future price movements, measured by ( )01var PP − , is determined by uncertainty
related to pricing factors ( ΘΩ ), pricing noise ( εΩ ) and per capita asset supply ( zΩ ).
As part of informed traders’ private information is incorporated into prices through
trading, observing current security prices helps to reduce the uncertainty about future
price changes to ( )001var PPP − , which is determined by the remaining uncertainty
about the pricing factors after prices are known to the market ( 0PΘΩ ), and εΩ and zΩ .
Therefore, the drop in the volatility in future price changes from ( )01var PP − to
( )001var PPP − is solely attributed to the reduction from ΘΩ to 0PΘΩ , which, in turn,
is caused by the information asymmetry between information and uninformed traders.
Since more aggressive trading on private information results in more information
revealed by prices, and hence smaller uncertainty about future price movements, the
difference between ΘΩ and 0PΘΩ could be used to suggest a measure for the degree of
information asymmetry during the trading process. Specifically, the degree of
information asymmetry for security i at time 0 is defined as the amount of private
information that is unrevealed by current prices of all existing securities ( 0PΘΩ ),
relative to the total amount of initial private information ( ΘΩ ). As the difference
between ΘΩ and 0PΘΩ can not be directly estimated from market data, I used the
14
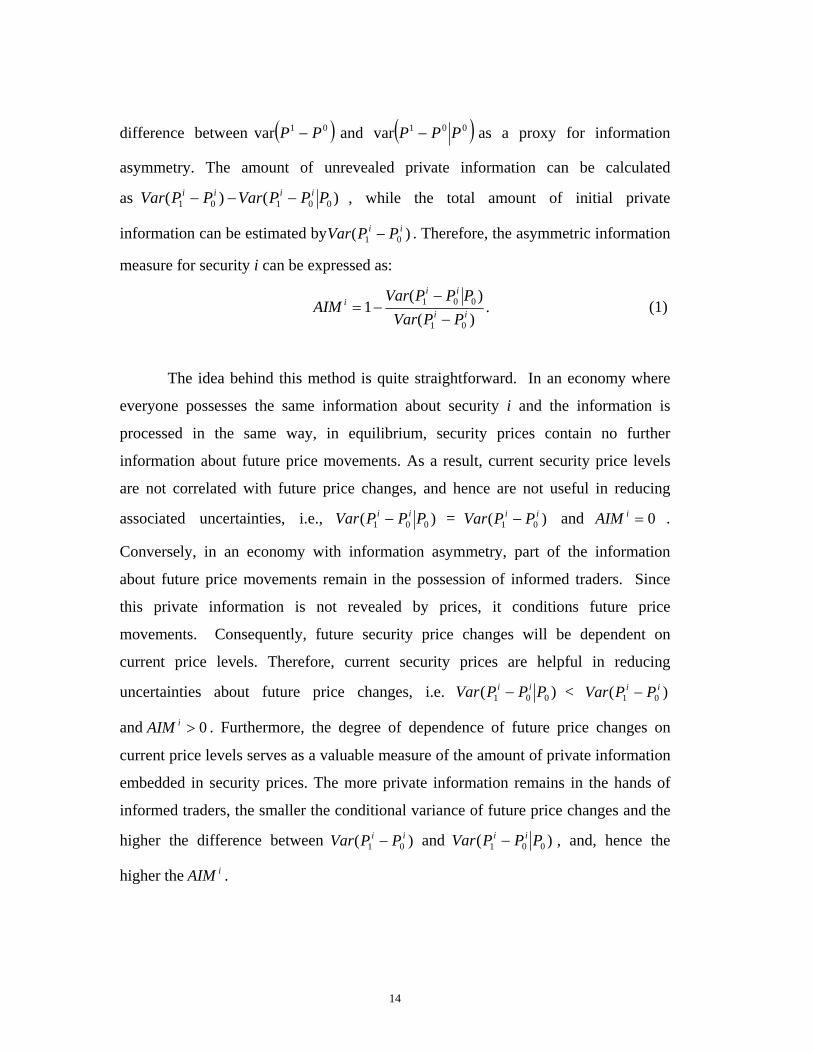
difference between ( )01var PP − and ( )001var PPP − as a proxy for information
asymmetry. The amount of unrevealed private information can be calculated
as )()( 00101 PPPVarPPVar iiii −−− , while the total amount of initial private
information can be estimated by )( 01ii PPVar − . Therefore, the asymmetric information
measure for security i can be expressed as:
.)(
)(1
01
001ii
iii
PPVarPPPVar
AIM−−
−= (1)
The idea behind this method is quite straightforward. In an economy where
everyone possesses the same information about security i and the information is
processed in the same way, in equilibrium, security prices contain no further
information about future price movements. As a result, current security price levels
are not correlated with future price changes, and hence are not useful in reducing
associated uncertainties, i.e., )( 001 PPPVar ii − = )( 01ii PPVar − and 0=iAIM .
Conversely, in an economy with information asymmetry, part of the information
about future price movements remain in the possession of informed traders. Since
this private information is not revealed by prices, it conditions future price
movements. Consequently, future security price changes will be dependent on
current price levels. Therefore, current security prices are helpful in reducing
uncertainties about future price changes, i.e. )( 001 PPPVar ii − < )( 01ii PPVar −
and 0>iAIM . Furthermore, the degree of dependence of future price changes on
current price levels serves as a valuable measure of the amount of private information
embedded in security prices. The more private information remains in the hands of
informed traders, the smaller the conditional variance of future price changes and the
higher the difference between )( 01ii PPVar − and )( 001 PPPVar ii − , and, hence the
higher the iAIM .

15
B. Empirical Specifications
To implement this method in the corporate bond market, notice that the AIM
measure is obtained by projecting one-period bond price changes on price levels at
the beginning of the corresponding period. The resulting R2 from this regression is
exactly the AIM derived from the RE model. Specifically, following Burlacu et al
(2005), I use the next regression for the AIM estimation:
∑=
− ++=∆N
j
it
jt
jiiit PP
11
, εβα , (2)
where itP 1− denotes the price of bond i at the beginning of period t and
it
it
it PPP 1−−=∆ ,
represents bond i’s price changes during period t. I take logarithms of corporate bond
prices before I calculate price changes, since the logarithms of prices are closer to the
normality hypothesis. Furthermore, to ameliorate the econometric properties of the
AIM, which is bounded in the [0,1] interval, I apply the following transformation to
the original R2 to get the new AIM for bond i:
⎟⎟⎠
⎞⎜⎜⎝
⎛−
= 2
2
1ln
i
ii
RRAIM . (3)
In order to complete the empirical specification of the AIM, a decision needs
to be made on what prices should be included in the above regression for a relevant
extraction of information about future bond price movements. Theoretically, in a
world where values of all securities are more or less related to each other, price
changes of any bond i should be projected on the prices of all securities to get a full
estimation of the AIM. This approach unfortunately is unfeasible in practice. Limited
observations on corporate bonds preclude the use of a large number of securities as
regressors. Therefore, this study includes a few related securities and a market index

16
that have been suggested in the literature as important information sources for
individual corporate bond price changes.
Specifically, the information sources include the price of bond i, the price of
the issuer’s common stock, the price of a corresponding default-free bond whose
future cash flows perfectly match those of the target corporate bond, and the S&P 500
index level. The rationale behind using the stock price as an information source is
fairly simple. As a firm’s stock and bonds represent claims to the same underlying
assets, information regarding the value of the assets will affect both the firm’s stock
and bonds. Hence, if information-based trading takes place in the stock market, stock
prices contain valuable information about future bond price movements. Empirical
evidence of the predictive power of stock price on future bond price changes has been
documented in both Kwan (1996) and Zhou (2005a). Besides individual stock prices,
I also include the S&P 500 index level to provide information about overall stock
market conditions. Previous studies [see for example, Blume, Keim and Patel (1991)
and Cornell and Green (1991)] have shown that high-yield corporate bonds are very
sensitive to stock market movements. Finally, the price of a corresponding default-
free bond with matching future cash flows is included to control for interest rate risk.
The price of default-free bonds is obtained by discounting the cash flows of the
corresponding corporate bond at default-free zero-coupon interest rates. These zero-
coupon rates are estimated by employing a modified version of the extended Nelson-
Siegel model [Bliss (1997)] on the observed on-the-run Treasury curve.14
To test the robustness of my results, I propose several specifications for the
AIM by increasing the number of information sources in the regression. In the
simplest specification, besides the price of the target corporate bond, I include the
price of the issuer’s common stock to capture firm-specific information gleaned from
the issuer’s equity security:
14 See Appendix B for a description of the extend Nelson-Siegel model and related estimation details.

17
it
it
siit
biiit SPP εββα +++=∆ −− 1
,1
, , (4)
with P and S denoting the price of the target bond and its corresponding common
stock respectively. To enrich the extraction of information related to corporate bond
price changes, I also consider the information provided by market movements:
it
it
miit
siit
biiit MSPP εβββα ++++=∆ −−− 1
,1
,1
, , (5)
with M representing the S&P 500 index level. Furthermore, as the price of
corresponding default-free bonds contains information about risk-free rate changes,
this variable is also added to the model, and hence the last specification for the AIM
used in this study becomes:
it
it
siit
miit
dfiit
biiit SMDFPP εββββα +++++=∆ −−−− 1
,1
,1
,1
, , (6)
where DF stands for default-free bond.
II. Data Description
Compared to the abundant literature on the pricing of equity securities, research
on the price behavior of corporate bonds is much sparser due to the lack of high
quality bond data.15 Unlike stocks, the majority of corporate bond transactions take
place on the OTC market16 and no price related information had been available to the
public until NASD introduced the Fixed Income Pricing System (FIPS)17 in 1994,
which was later incorporated into a broader system known as TRACE18 on July 1st,
15 The omission of research in this important market has been noted by Goodhart and O’Hara (1997) in an
extensive review of the market microstructure literature.
16 Some corporate bonds are also traded on the NYSE’s Automated Bond System (ABS). But the trading volume
is relatively low compared to that on the OTC market.
17 For more information about FIPS, please see the NASD Notice to Members (NtM) 94-23, Alexander, Edwards,
and Ferri (1999, 2000), and Hotchkiss and Ronen (2002). 18 Zhou (2005a) provides a brief review of recent developments in the corporate bond market, as well as a detailed
description of the TRACE system.

18
2002. Under TRACE rules,19 all NASD members are obligated to submit transaction
reports for any secondary market transaction in TRACE-eligible securities20 between
8:00PM and 6:30PM (EST) within one hour and fifteen minutes of the time of
execution.21 Based on these submitted trading reports, NASD immediately distributes
to the market transaction information on investment grade bonds with $1 billion or
higher initial issuance, as well as a set of 50 most actively traded Non-Investment
grade bonds (TRACE 50 thereafter). In the subsequent two and a half years, more and
more corporate bonds have been designated for immediate dissemination, and
beginning February 7th, 2005, NASD has begun to fully disseminate transaction
information on virtually all corporate bonds in real-time.
Since high-yield bonds incorporate an equity component and are more sensitive to
firm-specific information than investment grade bonds, transaction data for the
TRACE 50 bonds are used to study whether information is priced in corporate bonds.
Based on the same data set, Zhou (2005a) finds that current corporate bond prices
contain valuable information about future stock price movements, identifying an
important informational role for the corporate bond market. The evidence of
information-based trading in the corporate bond market provides encouragement for
continued exploration of whether information risk is priced in the corporate bond
market.
Specifically, this data set contains execution date and time (recorded to the
second), price, yield, quantity (and other information that can be used to purge invalid 19 Also known as the NASD Rule 6200 series.
20 According to NASD Rule 6210(a), TRACE-eligible securities ‘mean all United States dollar denominated debt
securities that are depository eligible securities under Rule 11310(d); Investment Grade or Non-Investment Grade;
issued by United States and/or foreign private issuers; and: (1) registered under the Securities Act of 1933 and
purchased or sold pursuant to Rule 144A of the Securities Act of 1933.’ It does not include debt securities issued
by government-sponsored entities (GSE), mortgage-backed or asset-backed securities, collateralized mortgage
obligations and money market instruments. 21 The reporting time has been shortened to 15 minutes as of July 1st, 2005.

19
transaction reports) for every trade in the TRACE 50 high-yield bonds during the
period from July 1st, 2002 to September 30th, 200422. The TRACE 50 bonds are
chosen by the NASD advisory committee based on criteria such as the security’s
volume, price, name recognition, amount of research attracted, amount outstanding,
number of dealers that are making a market in this security and the security’s
contribution to the TRACE 50’s industry diversity. Similar to the FIPS 50 bonds
studied by Hotchkiss and Ronen (2002), the TRACE 50 bonds are characterized by
high trading volume, both in terms of number of transactions and number of block
size trades, and similar trading patterns to the issuer’s stock. Over time, bonds with
small trading volume have been replaced with more active bonds. Transaction
information on the first TRACE 50 bonds has been released to the market on a real-
time basis since July 1st, 2002. From July 13th, 2003 until September 30th, 2004, the
TRACE 50 list was updated every 3 months. During this time period, 177 high-yield
bonds from 135 issuing firms were included in the TRACE 50 lists for dissemination.
More frequent updating of the TRACE 50 lists since July 13th, 2003 makes it
difficult to keep track of the time-series variation of liquidity and information
asymmetry of any individual bond. To mitigate the effects introduced by discontinued
dissemination for some bonds, I focus on the first TRACE 50 list which covers the
period from July 1st, 2002 to July 13th, 2003, a total of 259 trading days. For each
individual bond in this list, daily close price data are constructed by keeping the
transaction price for the last valid trade before 6:30PM (EST), the time when TRACE
is closed. Daily stock price data for the issuing firms is retrieved from CRSP for this
time period. Since some firms are not public, and some are traded on the OTC market
or the pink sheet market, corresponding stock price data does not exist for 7 of these
bonds. Among the remaining 43 bonds, 8 are issued by firms with very inactive
stocks, which do not have valid end of day bid-ask quotes or close prices for some of
22 On October 1st, 2004, NASD began its second stage dissemination, and many more high-yield bonds are subject
to dissemination. The concept of TRACE 50 does not exist any more.

20
the trading days. By excluding these firms from my sample, I am left with a panel of
36 bonds across 259 trading days.
Table I contains summary characteristics for the 36 corporate bonds and their
issuing firms. Issuing firms are fairly large, with median total asset value of 8744
million USD, and characterized by high financial leverage, which is consistent with
the low credit ratings of these bonds. All 36 bonds in the sample are non-convertible,
with 14 (38.89%) being callable prior to maturity. The bonds included in this study
represent 6 different industries, concentrated in Manufacturing (30.56%), Service
(30.56%) and Telecommunications (22.22%). More than half of the 36 bonds are
senior unsecured notes. Coupon payments are made twice per year for each of the 36
bonds, and all are fixed plain-vanilla coupons, except for one bond which has a
variable coupon size. The average coupon rate is 8.848%. During the one year period
studied by this paper, over 80% of the 36 TRACE 50 bonds were rated between CCC
and BB by S&P and none of them defaulted.
Finally, in order to measure the private information content of individual bonds,
and calculate the yield spread of a corporate bond (which is defined as the difference
between the corporate bond yield and the yield on a default-free bond with exactly the
same maturity and coupon size), I first estimate the term structure of risk-free zero-
coupon interest rates. I use data on the most recently issued 3-month, 6-month US
Treasury bills, 1-year Treasury note, as well as US Treasury bonds with maturities
closest to 2, 3, 5, 7, 10 and 30 years from CRSP Daily US Treasury files. The
extended Nelson-Siegel model [Bliss (1997)] is employed for estimation.
III. Measuring liquidity and the Private Information Content of
Individual Corporate Bonds

21
Trading volume has been a widely cited measure for liquidity as more active
markets tend to be more liquid [see for example, Chordia, Roll and Subrahmanyam
(2000) and Hasbrouck (2003)]. Unfortunately, data for daily bond volume in each
individual bond is not easy to construct from the TRACE 50 transaction dataset since
the exact size of a trade is disseminated only for those trades whose par values do not
exceed 1 million US dollars. For block size trades, only a sign of ‘1MM+’ is recorded.
As an alternative, I use trading frequency, which is equal to the number of total valid
transactions per day (NOT), as a proxy for liquidity. This measure is consistent with
notion that liquid bonds tend to be traded more frequently. I also use the trading
impact on bond yields as a measure of illiquidity (ILLQ):
tj
tjtjtj volume
ysysILLQ
,
1,,,
)log()log( −−= ,
where ys stands for yield spread.
While liquidity is easy to measure from the data, estimating private information
content involves applying the empirical models proposed in section I to time series
data for each bond individually. Specifically, for each bond, I estimate the regressions
for 3 different AIM specifications with a sample of 10 weeks, which represents 50
observations. The resulting AIM represents the private information content of the
bond during this period. The 10-week periods are then moved day by day, and
regressions (4)-(6) are estimated accordingly. This allows us to rapidly capture
changes in the information flow and determine bond specific AIM for every single
day on the sample period. Therefore, AIM measures are available for each trading
day in the sample period from September 11th, 2002 to July 11th, 2004 for each of the
35 TRACE 50 bonds. Summary statistics for these AIM measures, as well as the
liquidity measures NOT and ILLQ are provided in Table II.
Panel 1 presents some interesting results. First, compared to the stock market or
the Treasury bond market, low grade corporate bonds are much less frequently traded,

22
with a median trade number of 2 per day during the sample period. Secondly, the
group of low grade corporate bonds studied in this paper contains significantly higher
private information during the period from July 1st, 2002 to July 11th, 2003 than the
6988 common stocks examined by Burlacu et al (2005) from January 1st, 1985 to
December 31st, 2002. Information extracted from prices of the target corporate bond
and its issuer’s common stock reduces the uncertainty about future bond price
movements of about 19.6%, compared to a maximum of about 7% from the different
AIM specifications for common stocks by Burlacu et al (2005). Including the S&P
500 index level as one of the information sources helps to further reduce the
uncertainty by 4.6%, and the addition of the price of corresponding default-free bond
makes it possible to explain 28.8% of future bond prices changes. Finally, the overall
dispersion of my AIM measures for corporate bonds is much higher than that for
common stocks, with an average standard deviation of about 12.7% for bonds, versus
4% for stocks. The majority part of this variation can be explained by the fact that my
AIM measures for corporate bonds display a high variability in time. The average
time-series standard deviation is about 10.2%, with little deviation across different
measures. This result differs from Easley, Hvidkjaer and O’Hara (2002) who find that
the estimated PIN is very stable across time. AIM measures in this paper thus raise
the hope of keeping a closer track of the dynamics in information flow and capturing
the changes in private information rapidly.
An interesting question is how these AIM measures are related to the liquidity
measure, both across bonds and over time. According to market microstructure theory,
liquidity is an inter-temporal concept which is not necessarily related to how
information gets incorporated into prices.23 Empirical microstructure work, however,
23 A strand of microstructure literature has been focused on the notion of liquidity. See for example, Demsetz
(1968), Garman (1976), Stoll (1978), Ho and Stoll (1981), Amidhud and Mendelson (1986, 1988), O’Hara and
Oldfield (1986), Grossman and Miller (1988), Biais (1993) and Madhavan and Smidt (1993). O’Hara (1995)
provides an excellent textbook treatment of liquidity issues in microstructure theory. For a clear illustration of the
difference between liquidity and price discovery, see O’Hara (2003).

23
has shown that infrequently traded stocks are generally illiquid and have high private
information content [see for example, Easley, Kiefer, O’Hara and Paperman (1996),
Chordia, Subrahmanyam and Anshuman (2001), Easley, Hvidkjaer and O’Hara (2002)
and Burlacu, Fontaine and Jimenez-Garces (2005)]. If actively traded stocks face a
less severe adverse selection problem due to information-based trading, the negative
correlation found in these studies should not be surprising.
Panel 2 and 3 in Table II present the correlation coefficients between trade
frequency and various AIM estimates for corporate bonds. Except for the correlation
between NOT and AIM3, all of the correlations are highly significant and exhibit the
anticipated signs. Trade frequency is negatively correlated with the degree of
information asymmetry, with the correlation coefficient varying from -0.020 to -0.046.
Illiquidity measure (ILLQ) is negatively correlated with NOT, and positively
correlated with the AIM measures. The magnitude of correlation for the set of low
grade corporate bonds is smaller than that for common stocks found in other studies.
For example, Easley, Hvidkjaer and O’Hara (2002) find the average correlation
between their PIN estimates and the logarithm of average daily trading volume is -
0.58, fluctuating between -0.38 and -0.71. Burlacu et al (2005) obtain a much smaller
estimate of the correlation with a range of -0.04 to -0.10, which is still greater than
those for corporate bonds. Corporate bond trade frequency, however, displays a
stronger correlation with AIM estimates over time. Panel 3 shows that cross-
sectional averages of correlations over time vary from -0.064 to -0.086. Finally, not
surprisingly, different AIM measures for the bonds exhibit strong positive
correlations with a minimum coefficient of 0.808.
IV. Information Asymmetry, Liquidity and Corporate Yield Spreads:
Benchmark Results

24
With the private information content and liquidity of individual bonds estimated
above, this section takes the next step and studies whether these factors possess
explanatory power for corporate yield spreads, in addition to those from the
traditional corporate bond pricing models. During the sample period examined in this
paper, the corporate bond market experienced a major increase in transparency when
NASD started its Phase II implementation of public corporate bond transaction
reporting through the TRACE system on March 3rd, 200324. The pool of corporate
bonds which are subject to immediate dissemination was dramatically expanded from
500 to 4,200. The enhanced transparency of the corporate bond market could cause
significant changes for the key variables studied in this paper, including informational
efficiency, liquidity and yield spreads of the 35 TRACE 50 bonds. Therefore, I divide
my sample into two parts, one before the end of February of 2003 (period I) and one
after (period II). Figure 1 and Figure 2 depict how the main variables change over
time, and summary statistics for these variables are reported in Table III.
First, as shown by Figure 1, trading activity levels for these bonds experienced a
huge jump on February 28th, 2003 when news of the SEC’s approval of NASD’s
phase II implementation of the TRACE system became available to the market, and
remained high thereafter. According to Table III, the average number of trades per
day was 1.68 prior to March 3rd, 2003, but jumped to 4.09 afterwards. The finding
that enhanced transparency in the corporate bond market increases liquidity in the
already transparent TRACE 50 bonds may be due to traders becoming more aware of
transparent prices. If transparency decreases transaction costs for those bonds made
transparent on March 3rd and raises their liquidity, as found by Edwards, Harris and
Piwowar (2005), the finding that TRACE 50 bonds also became more liquid might be
due to some commonality in liquidity [see for example, Chordia, Roll and
24 The plan for Phase II dissemination of public corporate bond transaction reporting through NASD's Trade
Reporting and Compliance Engine (TRACE) was approved by SEC and publicly announced on February 28th,
2003. See NASD News Release on February 28th, 2003.

25
Subrahmanyam (2000), Hasbrouck and Seppi (2001), Huberman and Halka (2001),
and Chordia, Sarkar and Subrahmanyam (2003)].
Second, the degree of information asymmetry in the 35 TRACE 50 bonds has
been lower since the Phase II dissemination. Panel 1 of Table III shows that the
average AIM estimates for period II is lower than that for period I. This result is
consistent with the experimental evidence provided by Bloomfield and O’Hara (1997)
that trade disclosure improves informational efficiency. However, the enhanced
transparency of the bond market brings to the market some new information resources,
from which extra information about future bond price movements can be extracted. It
thus raises the question of whether the AIM specifications proposed in Section 1 are
still appropriate in measuring the private information content of corporate bonds. Not
surprisingly, the availability of additional information sources might subject my AIM
measures to serious bias. This indicates that focusing on the period I sub-sample
might be more appropriate.
Finally, corporate yield spreads became narrow after March 3rd (Figure 2). The
average yield spread for the 35 bonds was 10.56% for period I. This number,
however, declined by almost a third to 7.27% for period II, suggesting that the lower
degree of asymmetric information from trade disclosure reduces the information risks
faced by uninformed traders, and hence less compensation is required for bearing
such risks. Former studies on the corporate bond yield puzzle have relied on bond
data when the market is not transparent, so, to allow for comparability with these
studies, and due to the possibility that larger disclosure might introduce some bias
into my AIM measures as suggested above, I will focus on the period I sub-sample in
the rest of this paper.
A. Informal Examination
26
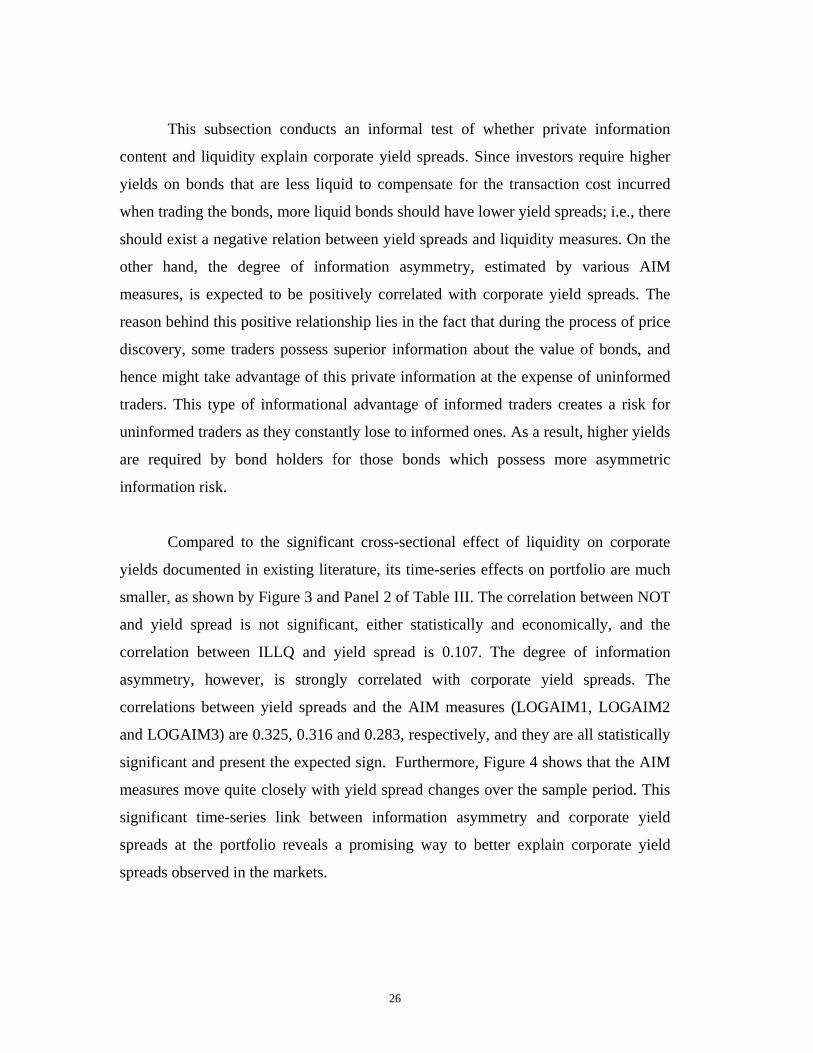
This subsection conducts an informal test of whether private information
content and liquidity explain corporate yield spreads. Since investors require higher
yields on bonds that are less liquid to compensate for the transaction cost incurred
when trading the bonds, more liquid bonds should have lower yield spreads; i.e., there
should exist a negative relation between yield spreads and liquidity measures. On the
other hand, the degree of information asymmetry, estimated by various AIM
measures, is expected to be positively correlated with corporate yield spreads. The
reason behind this positive relationship lies in the fact that during the process of price
discovery, some traders possess superior information about the value of bonds, and
hence might take advantage of this private information at the expense of uninformed
traders. This type of informational advantage of informed traders creates a risk for
uninformed traders as they constantly lose to informed ones. As a result, higher yields
are required by bond holders for those bonds which possess more asymmetric
information risk.
Compared to the significant cross-sectional effect of liquidity on corporate
yields documented in existing literature, its time-series effects on portfolio are much
smaller, as shown by Figure 3 and Panel 2 of Table III. The correlation between NOT
and yield spread is not significant, either statistically and economically, and the
correlation between ILLQ and yield spread is 0.107. The degree of information
asymmetry, however, is strongly correlated with corporate yield spreads. The
correlations between yield spreads and the AIM measures (LOGAIM1, LOGAIM2
and LOGAIM3) are 0.325, 0.316 and 0.283, respectively, and they are all statistically
significant and present the expected sign. Furthermore, Figure 4 shows that the AIM
measures move quite closely with yield spread changes over the sample period. This
significant time-series link between information asymmetry and corporate yield
spreads at the portfolio reveals a promising way to better explain corporate yield
spreads observed in the markets.

27
B. Regression Analysis
Following a brief examination of the correlations between corporate yield
spreads and the AIM and liquidity measures, this subsection turns to benchmark
regressions, which analyze the impact of private information and liquidity on
corporate yield spreads. To explore how the time-variation in private information
content and liquidity of corporate bonds affect yield spreads on an individual basis,
the following empirical models are estimated based on the panel data of 35 bonds
across 107 trading days:
tititi AIMYS ,,10, εγγ ++= , (7)
tititi NOTYS ,,20, εγγ ++= , (8)
and
titititi NOTAIMYS ,,2,10, εγγγ +++= , (9)
where tiYS , stands for the yield spread of bond i in day t, and ti ,ε is the mean-zero
error term. All these regressions are pooled, imposing the same coefficients both over
time and across different bonds. These models are estimated for three alternative AIM
specifications (LOGAIM1, LOGAIM2 and LOGAIM3), and the estimation results are
presented in Table IV.
My primary interest lies in the estimates of 1λ and 2λ , i.e., the coefficients for
AIM and NOT (or ILLQ). My hypothesis concerning the liquidity effect is that since
a decrease in the liquidity of a corporate bond (or equivalently an increase in the
illiquidity) increases its transaction costs, and hence the required returns on this bond
(the yield), a significant negative coefficient for NOT (or a significant positive
coefficient for ILLQ) should be expected. As to the influence from information-based
trading in corporate bonds, my hypothesis is that a higher degree of information
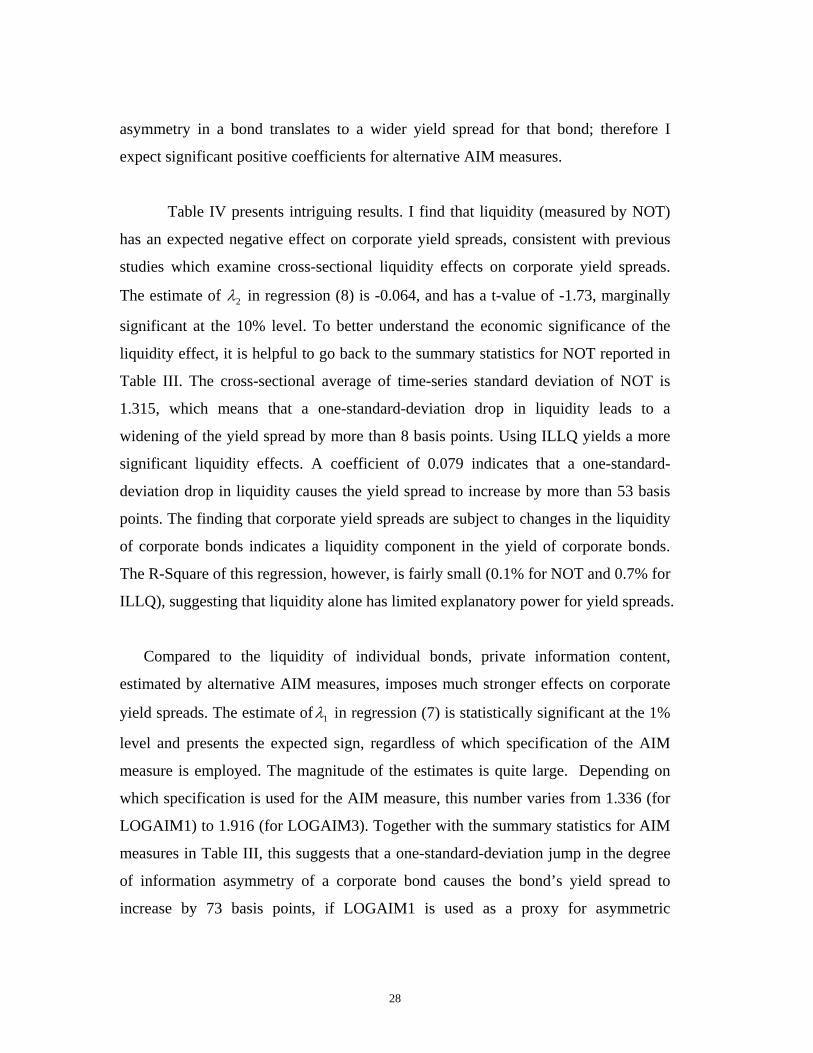
28
asymmetry in a bond translates to a wider yield spread for that bond; therefore I
expect significant positive coefficients for alternative AIM measures.
Table IV presents intriguing results. I find that liquidity (measured by NOT)
has an expected negative effect on corporate yield spreads, consistent with previous
studies which examine cross-sectional liquidity effects on corporate yield spreads.
The estimate of 2λ in regression (8) is -0.064, and has a t-value of -1.73, marginally
significant at the 10% level. To better understand the economic significance of the
liquidity effect, it is helpful to go back to the summary statistics for NOT reported in
Table III. The cross-sectional average of time-series standard deviation of NOT is
1.315, which means that a one-standard-deviation drop in liquidity leads to a
widening of the yield spread by more than 8 basis points. Using ILLQ yields a more
significant liquidity effects. A coefficient of 0.079 indicates that a one-standard-
deviation drop in liquidity causes the yield spread to increase by more than 53 basis
points. The finding that corporate yield spreads are subject to changes in the liquidity
of corporate bonds indicates a liquidity component in the yield of corporate bonds.
The R-Square of this regression, however, is fairly small (0.1% for NOT and 0.7% for
ILLQ), suggesting that liquidity alone has limited explanatory power for yield spreads.
Compared to the liquidity of individual bonds, private information content,
estimated by alternative AIM measures, imposes much stronger effects on corporate
yield spreads. The estimate of 1λ in regression (7) is statistically significant at the 1%
level and presents the expected sign, regardless of which specification of the AIM
measure is employed. The magnitude of the estimates is quite large. Depending on
which specification is used for the AIM measure, this number varies from 1.336 (for
LOGAIM1) to 1.916 (for LOGAIM3). Together with the summary statistics for AIM
measures in Table III, this suggests that a one-standard-deviation jump in the degree
of information asymmetry of a corporate bond causes the bond’s yield spread to
increase by 73 basis points, if LOGAIM1 is used as a proxy for asymmetric

29
information. For the other AIM measures, LOGAIM2 and LOGAIM3, this number
becomes 78 and 65 respectively. The R-square value of regression (7) is much larger
than that of regression (8) where the liquidity measure is used as the repressor. For
example, when the first AIM measure (LOGAIM1) is used in regression (7), the R-
square is 0.098, meaning that information alone explains about 10% of the corporate
yield spreads. R-square values for regression (8) using LOGAIM2 and LOGAIM3 are
0.108 and 0.072 respectively. Furthermore, the strong information effects persist even
when the liquidity measure is added into the model [see the results of regression (9)].
The estimate of 1λ is still statistically significant at the 1% level and remains positive.
Several recent studies on information risk as a determinant of stock returns [for
example, Easley et al (2002) find that a difference of 10 percentage points in PIN
between two stocks leads to a difference of 2.5 percent annual return; Burlacu et al
(2005) argue that their AIM measure has a strong impact on stock returns and
dominates traditional factors of risk such as β and the Fama and French factors]. In
line with this, the results of this paper present striking evidence that information is an
important factor in determining the corporate yield spread, and the risk of
information-based trading is also priced in the yield of corporate bonds.
V. Robustness and Sensitivity Analysis
To check the robustness of the benchmark results, I consider in this section
several extensions of the original model. First, I exclude from the sample those bonds
which have special features that would subject their value to information-based
trading. After that, I add to the model several factors from corporate bond pricing
literature that have been shown to have some explanatory power for corporate yield
spreads.
A. Embedded Options

30
High-yield corporate bonds typically have special features, such as embedded
options, that would result in their being priced differently. If options are attractive to
traders with superior information about the issuer’s assets, as extensively supported
[see for example, Black (1975), Easley, O’Hara and Srinivas (1998); For an
overview of the literature on informed trading in the options markets, see Zhou
(2005a)], the high sensitivity of a bond’s yield spread to the degree of information
asymmetry identified in section 4 might simply be reflective of the relation between
the bond’s embedded options and the information-based trading. To get rid of this
potential bias, all bonds with embedded call or put options or sinking fund provisions,
and bonds with floating-rate coupon payments were eliminated. Since all TRACE 50
bonds are nonconvertible, no bonds were excluded for that reason, leaving a panel of
21 bonds across 107 trading days.
Table V presents strong evidence of the liquidity and information effects on
corporate yield spreads. Compared to the benchmark regression results when all 36
TRACE 50 bonds are included (provided in Table IV), the coefficient for liquidity
(measured by NOT) in regression (8) continues to be negative, but its significance
level increases, both statistically and economically. The t-statistics for 2λ in
regression (8) changes from -1.73 to -2.02, bringing the significance to a level lower
than 5%. The estimate for 2λ (when NOT is used as a measure for liquidity) is now -
0.1, indicating that a one-standard-deviation fall in liquidity leads to a jump of the
yield spread by more than 13 basis points (it is a 57 basis point if ILLQ is used to
measure liquidity). Even though the explanatory power of liquidity remains small,
with an R-square of 0.2% for regression (8), it is higher than when bonds with special
features were included in the sample.
What is more surprising, however, is that information effects remain strong,
and even become slightly stronger when bonds with embedded options are eliminated.
Re-estimation of regression (8) shows that the coefficients for the AIM measures

31
increase and are still significant at the 1% level, no matter which specification is used.
The estimates of the coefficients for LOGAIM1, LOGAIM2 and LOGAIM3 in
regression (8) move from 1.336, 1.898 and 1.916 to 1.596, 2.1 and 2.271 respectively.
This implies that if the degree of information asymmetry of a corporate bond
(measured by LOGAIM1) goes up by one-standard-deviation, the yield spread of this
bond will rise 87 basis points 25 . Furthermore, the explanatory power of the
information factor increases. The R-square becomes 12.3%, 12.4% and 9.2% for the
regression (7) with AIM specified by LOGAIM1, LOGAIM2 and LOGAIM3
correspondingly. Finally, even after accounting for liquidity differences, the private
information content of a corporate bond continues to be a significant factor
influencing corporate bond yield spreads (see Table V).
B. Traditional Factors Affecting Corporate Yield Spreads
Within traditional corporate bond pricing literature, several factors have
already been identified as determinants of corporate yield spreads. To make the
argument that information and liquidity provide additional explanatory power for
yield spreads, it is important to test whether these microstructure factors are simply
proxies for traditional yield spread determinants. Therefore, the regression model in
equation (9) is expanded to include the following independent variables:
Credit Ratings. Previous studies have shown that credit ratings26 of corporate
bonds affect their yield spreads [see for example, Campbell and Taksler (2003) and
Cremers, Driessen, Maenhout and Weinbaum (2004)]. Since this study focuses on a
relatively small number of high-yield corporate bonds, I aggregate the different
25 It is 86 and 77 basis points for LOGAIM2 and LOGAIM3, respectively. 26 The credit rating of a corporate bond is not a perfect measure for credit risk, as several studies have shown that there is a lag between changes in credit risks and credit rating migrations [see for example, Cremers, Driessen, Maenhout and Weinbaum (2004)]. Since this paper is not focusing on modeling the dynamics of credit risks, I follow Campbell and Taksler (2003) by using credit rating as a control for bond credit risks.

32
ratings by Standard and Poor’s (S&P) into 3 groups: Rating Group 1 includes bonds
rated no lower than BB- by S&P. Rating Group 2 consists of the B level bonds, and
all the other bonds which are rated no higher than CCC+ are left in Rating Group 3.
Level and slope of the Term Structure of Treasury Rate. Longstaff and
Schwartz (1995) argue in their model that an increase in risk-free interest rates
implies an upward drift in the risk-neutral process for the value of the firm, (which
means that firm value drifts away for the financial distress threshold at a faster rate as
the interest rate rises), and hence a reduction in the risk-neutral probability of default
and corporate yield spread. The negative relation between the risk-free interest rate
and corporate yield spreads predicted by the model was empirically supported in their
paper. Following Collin-Dufresne, Goldstein and Martin (2001) and Cremers,
Driessen, Maenhout and Weinbaum (2004), among others, I use the 10-year Treasury
rate to describe the level of the term structure. I also include the squared level of the
10-year Treasury rate, as in Collin-Dufresne, Goldstein and Martin (2001), to capture
potential nonlinear effects due to convexity. Even though all of these studies also
calculate the difference between the 10- and 2- year Treasury rates to describe the
slope of the term structure, and use it to measure the expectation of future short rates
and overall economic health, empirical evidence of its effect on yield spreads is rather
limited [see for example Collin-Dufresne, Goldstein and Martin (2001) and Campbell
and Taksler (2003)]. Therefore, I only use the daily series of 10-year Treasury rates
from the CRSP Daily Fixed Term Indices File.
Implied Volatilities of Individual Options. In a recent paper, Cremers,
Driessen, Maenhout and Weinbaum (2004) show that option implied volatilities
contain important information for corporate yield spreads. To test whether my AIM
measures are simply picking up volatility risk, implied volatilities of the options for
those firms that have their bonds included in my sample were added. If the AIM
measures are correlated with implied volatilities of individual options, the coefficients
33
on AIM measures should shrink to zero when a direct proxy for volatility risk is
added to the model. Following Cremers, Driessen, Maenhout and Weinbaum (2004),
for each individual bond, I retrieve from OptionMetrics, LLC the daily data on the
implied volatility of at-the-money put options on the issuer’s common stock.
Liquidity of Issuer’s Options. If firm-specific credit risk in a corporate bond
can be somewhat hedged by trading in individual options of its issuer, the liquidity of
the market for these options may have an influence on the bond’s yield spread. When
the liquidity for the issuer’s options dries up, hedging the corporate bond becomes
difficult and costly. A higher yield spread thus will be required to compensate for that
cost. This hypothesis is empirically supported by Cremers, Driessen, Maenhout and
Weinbaum (2004). They find some evidence that individual options do have liquidity-
spillover effects on the corporate bonds. Furthermore, if the liquidity of a corporate
bond is correlated with the liquidity of the issuer’s traded options, the significance of
the liquidity measure for corporate bonds in the benchmark regression might simply
reflect the liquidity-spillover effects mentioned above.
Lagged Stock Returns. Leading effects of stocks on corporate bonds have
been documented in several studies [see for example, Kwan (1996), Collin-Dufresne,
Goldstein and Martin (2001), Campbell and Taksler (2003) and Zhou (2005a)].
Therefore, I also include the one-day lagged S&P 500 return as a regressor.
By including all these additional variables, the benchmark regression is expanded as
follows:
,,18,7,6
543,2,10,
tittiti
tiitititi
SPOPTLIQOPTVOLTENYRRGTHREERGTWONOTAIMYS
εγγγγγγγγγ
++++
+++++=
−
(10)
where RGTWO and RGTHREE denote the dummy variables for Rating Group two
and Rating Group three; TENYR stands for the ten-year interest rate; OPTVOL and
OPTLIQ represent the implied-volatility and liquidity of the at-the-money put option

34
by the issuer, and SP symbolizes the S&P 500 return. Results from estimating this
model are presented in Table VI.
It is intriguing to observe that liquidity and AIM measures for individual
corporate bonds continue to play important roles in determining corporate yield
spreads. Coefficients for both liquidity and information asymmetry remain
statistically significant and present the expected signs. Furthermore, these factors
prove to be economically meaningful in explaining yield spreads. The coefficient of -
0.1 for NOT (0.078 for ILLQ) implies that a one-standard-deviation shock to the
liquidity of a corporate bond moves its yield spread by more than 13 basis points (52
basis points), when the first specification of the AIM measure is used in the
regression. This impact (from NOT) changes slightly when different AIM measures
are employed [about 11 basis points and 9 basis points for the second and the third
AIM measures respectively]. Compared to the liquidity effect, information-based
trading has a larger influence on the corporate yield spread. For the AIM measure
specified by equation (4), the coefficient of 1.311 indicates that a one-standard
deviation increase in the degree of information asymmetry of a corporate bond is
associated with a widening of the bond’s yield spread by 71 basis points. The change
in the yield spread becomes 74 and 65 basis points when specification 2 and
specification 3 are chosen for the AIM measure. The extreme robustness of these
results supports my hypothesis that information-based trading risks, as well as the
transaction costs of liquidity, assume important roles in explaining corporate yield
spreads. Valuation of risky corporate debt needs to be recast to incorporate these
market microstructure factors, which have long been ignored in the literature.
To finish up the robustness check of my results, it is necessary to examine the
traditional corporate bond pricing factors. Consistent with earlier work, coefficients
for all of these extra variables are statistically significant and carry the expected signs,
except for the S&P 500 market return. This result, however, is not that surprising, as

35
Collin-Dufresne, Goldstein and Martin (2001) also find that this coefficient is not
significant and presents the wrong sign for higher leverage (lower rated) bonds,
which are the focus of this study. Turning to other factors, the credit rating of a
corporate bond continues to bring economically meaningful differences in yield
spreads. Lower rated bonds tend to have higher yield spreads. The level of risk-free
interest rates, measured by the 10-year treasury rate, has a significant negative effect
on yield spreads, in line with the argument made by Longstaff and Schwartz (1995).
Finally, the options market contains valuable information in explaining corporate
yield spreads. Implied volatilities of at-the-money put options on the issuer’s common
stock are shown to be useful proxies for volatility risk, which directly affect the yield
spread of the issuer’s debt securities, reinforcing the findings by Cremers, Driessen,
Maenhout and Weinbaum (2004). The liquidity of a firm’s traded options has
significant negative effects on the yield spread of its bond, again confirming the
liquidity spill-over effects documented by Cremers, Driessen, Maenhout and
Weinbaum (2004).
VI. Conclusion
Taking advantage of a recently available corporate bond transaction dataset from
the National Association of Securities Dealers (NASD), as well as a new measure for
the degree of information asymmetry derived from a multi-security rational
expectations model, I have demonstrated in this paper that market microstructure
factors, including information and liquidity, possess additional explanatory power in
explaining the actual yield spreads of risky corporate bonds. A one-standard-
deviation drop in liquidity (measured by NOT) leads to a widening of the yield spread
by more than 13 basis points (by 52 basis points when ILLQ is used), and a one-
standard-deviation jump in the degree of information asymmetry of a corporate bond
causes the bond’s yield spread to increase by 71 basis points, after controlling for the
effects from traditional corporate bond pricing models. Liquidity (measured by trade

36
frequency) and information (measured by AIM) alone explain about 10% of the
corporate yield spreads. This paper extends the recent literature on the implications of
market microstructure for asset pricing [initiated by Easley and O’Hara (2004)] to the
corporate bond market, and suggests that yields of corporate debt might embed both
an information premium and a liquidity premium that are ignored by existing
corporate bond pricing models. Therefore, valuation of corporate debt needs to be
recast in broader terms to integrate the transaction costs of liquidity and risks from
information asymmetry during the process of price discovery.
Furthermore, this paper also suggests that the information structure surrounding a
firm’s debt has important effects on its financing and risk management decisions. If
there is enormous information-based trading in a firm’s risky bonds, investors will
require higher yields to hold these bonds, and hence the firm will be less willing to
issue bonds in equilibrium. This study, consistent with Easley and O’Hara (2004),
implies that a firm can affect its cost of debt by choosing analyst coverage, disclosure
policy, market microstructure, accounting treatments and any other factors that will
influence the information structure surrounding its debt securities. It provides a new
perspective to understand the complete market assumption in the Modigliani and
Miller Theorem.
Finally, recent research has started to look beyond the traditional bond pricing
framework for better explanations of the credit spread puzzle. Odders-White and
Ready (2004) show that microstructure measures of adverse selection in the equity
securities are larger when credit ratings of the issuer’s bonds are poor. Yu (2005)
finds that firms with higher accounting transparency tend to have lower credit spreads.
The main contribution of this paper is that I establish a significant link between
corporate yield spreads and two main market microstructure factors: information and
liquidity. Whether these factors completely solve the yield spread puzzle in the
finance literature is not addressed in this paper, but constitutes a very interesting and

37
important topic for further research. This topic in turn, requires an estimation of the
information risk premium and liquidity premium, as well as a theoretical corporate
bond pricing model which explicitly incorporates the information risk and liquidity
costs. Research in this direction is currently under way.

38
References: Acharya, Viral V., and Lesse H. Pedersen, 2005, Asset Pricing with Liquidity Risk,
Journal of Financial Economics 77, 375-410. Alexander, Gordon, Amy K. Edwards, and Michael G. Ferri, 1999, What Does the
Nasdaq’s High-Yield Bond Market Reveal about Bondholder-Stockholder Conflict? Working Paper, University of Minnesota, SEC, and George Mason University.
Alexander, Gordon, Amy K. Edwards and Michael G. Ferri, 2000, The Determinants
of Trading Volume of High-Yield Corporate Bonds, Journal of Financial Markets 3, 177-204.
Amihud, Yakov, 2002, Illiquidity and Stock Returns: Cross Section and Time Series
Effects, Journal of Financial Markets 5, 31-56. Amihud, Yakov, and Haim Mendelson, 1986, Asset Pricing and the Bid-Ask Spread,
Journal of Financial Economics 17, 223-249. Amihud, Yakov, and Haim Mendelson, 1988, Liquidity and Asset Prices: Financial
Management Implications, Financial Management, spring 1-15. Amihud, Yakov, and Haim Mendelson, 1991, Liquidity, Maturity and the Yields on
U.S. Treasury Securities, Journal of Finance 46, 1411-1425. Anderson, Ronald, and Suresh Sundaresan, 1996, Design and Valuation of Debt
Contracts, Review of Financial Studies 9, 37-68. Anderson, Ronald, and Suresh Sundaresan, 2000, A Comparative Study of Structural
Models of Corporate Bond Yields: An Exploratory Investigation, Journal of Banking and Finance 24, 255-269.
Biais, Bruno, 1993, Price Formation and Equilibrium Liquidity in Fragmented and
Centralized Markets, Journal of Finance 48, 157-185. Black, Fisher, and John Cox, 1976, Valuing Corporate Securities: Some Effects of
Bond Indenture Provisions, Journal of Finance 31, 351-367. Black, Fisher, 1975, Fact and Fantasy in the Use of Options, Financial Analysts
Journal 31, 36-41, 61-72. Black, Fisher, and Myron Scholes, 1973, The Pricing of Options and Corporate
Liabilities, Journal of Political Economy 81, 637-654.

39
Bliss, Robert, 1997, Testing Term Structure Estimation Methods, Advances in
Futures and Options Research 9, JAI Press, 197-231. Bloomfield, Robert J., and Maureen O’Hara, 1999, Market Transparency: Who Wins
and Who Loses? Review of Financial Studies 12, 5-13. Boudoukh, Jacob, and Robert Whitelaw, 1993, Liquidity as a Choice Variable: A
Lesson from the Japanese Government Bond Market, Review of Financial Studies 6, 265-292.
Brennan, Michael, Tarun Chordia, and Avanidhar Subrahmanyam, 1998, Alternative
Factor Specifications, Security Characteristics and the Cross-Section of Expected Stock Returns, Journal of Financial Economics 49, 345-373.
Brennan, Michael, and Avanidhar Subrahmanyam, 1996, Market Microstructure and
Asset Pricing: On the Compensation for Illiquidity in Stock Returns, Journal of Financial Economics 41, 441-464.
Burlacu, Radu, Patrice Fontaine and Sonia Jimenez-Garces, 2005, A New Measure
for Determining the Amount of Private Information of Common Stocks, C.E.R.A.G – UMR CNRS 5820, Université Pierre Mendès France.
Campbell, John Y., and Glen B. Taksler, 2003, Equity Volatility and Corporate Bond
Yields, Journal of Finance 58, 2321-2349. Chen, Long, David Lesmond, and Jason Wei, 2005, Corporate Yield Spreads and
Bond Liquidity, 14th Annual Conference on Financial Economics and Accounting, http://ssrn.com/abstract=495422.
Chalmers, John M., and Gregory B. Kadlec, 1998, An Empirical Examination of the
Amortization Spread, Journal of Financial Economics 48, 159-188. Chordia, Tarun, Richard Roll and Avanidhar Subrahmanyam, 2000, Commonality in
Liquidity, Journal of Financial Economics 56, 3-28. Chordia, Tarun, Asani Sarkar and Avanidhar Subrahmanyam, 2003, An Empirical
Analysis of Stock and Bond Market Liquidity, Working Paper, Emory University.
Chordia, Tarun, Avanidhar Subrahmanyam, and Ravi Anshuman, 2001, Trading
Activity and Expected Stock Returns, Journal of Financial Economics 59, 3-32.

40
Collin-Dufresne, Pierre, and Robert S. Goldstein, 2001, Do Credit Spreads Reflect Stationary Leverage Ratios? Journal of Finance 56, 1929-1957.
Collin-Dufresne, Pierre, Robert S. Goldstein and Spencer Martin, 2001, The
Determinants of Credit Spread Changes, Journal of Finance 56, 2177-2208. Cremers, Martijn, Joost Driessen, Pascal Maenhout, and David Weinbaum, 2004,
Individual Stock-Option Prices and Credit Spreads, Yale ICF Working Paper No. 04-14.
Das, Sanjiv R., and Peter Tufano, 1996, Pricing Credit Sensitive Debt when Interest
Rates and Credit Spreads are Stochastic, Journal of Financial Engineering 5, 161-198.
Datta, Sudip, and Mai Iskandar-Datta, 1996, Does Insider Trading Have Information
Content for the Bond Market? Journal of Banking and Finance 20, 555-575. Daves, Philip R., and Michael C. Ehrhardt, 1993, Liquidty, Reconstitution and the
Value of U.S. Treasury Strips, Journal of Finance 48, 315-329. Demsetz, Harold, 1968, The Cost of Transacting, Quarterly Journal of Economics 82,
33-53. De Jong, Frank, and Joost Driessen, 2004, Liquidity Risk Premia in Corporate Bond
and Equity Markets, Working Paper, University of Amsterdam. D’Mello, Ranjan, and Stephen Ferris, 2000, The Information Effects of Analyst
Activity as the Announcement of New Equity Issues, Financial Management 29, 78-95.
Duffee, Gregory R., 1998, The Relation Between Treasury Yields and Corporate
Bond Yield Spreads, Journal of Finance 54, 2225-2241. Duffee, Gregory R., 1999, Estimating the Price of Default Risk, Review of Financial
Studies 12, 197-226. Duffie, Darrell, and David Lando, 2001, Term Structure of Credit Spreads with
Incomplete Accounting Information, Econometrica 69, 633-664. Duffie, Darrell, and Kenneth J. Singleton, 1997, An Econometric Model of the Term
Structure of Interest Rate Swap Yields, Journal of Finance 52, 1287-1321. Duffie, Darrell, and Kenneth J. Singleton, 1999, Modeling Term Structures of
Defaultable Bonds, Review of Financial Studies 12, 687-720.

41
Easley, David, Soeren Hvidkjaer, and Maureen O’Hara, 2002, Is Information Risk a
Determinant of Asset Pricing? Journal of Finance 57, 2185-2221. Easley, David, Soeren Hvidkjaer, and Maureen O’Hara, 2004, Factoring Information
into Returns, Working Paper, Cornell University. Easley, David, Nicholas M. Kiefer and Maureen O’Hara, 1997, One day in the life of
a Very Common Stock, Review of Financial Studies 10, 805-835. Easley, David, Nicholas M. Kiefer, Maureen O’Hara and Joseph B. Paperman, 1996,
Liquidity, Information, and Infrequently Traded Stocks, Journal of Finance 51, 1405-1436.
Easley, David, and Maurenn O’Hara, 2002, Information and the Cost of Capital,
Journal of Finance 59, 1553-1583. Easley, David, Maureen O’Hara, and P. S. Srinivas, 1998, Option Volume and Stock
Prices: Evidence on Where Informed Traders Trade, Journal of Finance 53, 431-466.
Elton, Edwin J., and T. Clifton Green, 1998, Tax and Liquidity Effects in Pricing
Government Bonds, Journal of Finance 53, 1533-1562. Elton, Edwin, J., Martin J. Gruber, Deepak Agrawal, and Christopher Mann, 2001,
Explaining the Rate Spread on Corporate Bonds, Journal of Finance 56, 247-277.
Elton, Edwin, J., Martin J. Gruber, Deepak Agrawal, and Christopher Mann, 2002,
Factors Affecting the Valuation of Corporate Bonds, New York University Working Paper.
Fleming, Michael J., 2002, Are Larger Treasury Issues More Liquid? Evidence from
Bill Reopenings, Journal of Money, Credit, and Banking 3, 707-735. Fleming, Michael J., 2003, Measuring Treasury Market Liquidity, FRBNY Economic
Policy Review, 83-108. Garman, Mark, 1976, Market Microstructure, Journal of Financial Economics 3, 257-275. Gehr, Adam K., and Terrence F. Martell, 1992, Pricing Efficiency in the Secondary
Market for Investment-Grade Corporate Bonds, Journal of Fixed Income 2, 24-38.

42
Geske, Robert, 1977, The Valuation of Corporate Liabilities as Compound Options,
Journal of Financial and Quantitative Analysis, 541-552. Goldreich, David, Bernd Hanke, and Purnenedu Nath, 2004, The Pricing of Future
Liquidity” Time-Varying Liquidity in the U.S. Treasury Market, Working Paper, London Business School, Institute of Finance and Accounting, http://faculty.london.edu/dgoldreich/liqdecRF.pdf.
Goodhart, Charles, and Maureen O’Hara, 1997, High Frequency Data in Financial
Markets: Issues and Applications, Journal of Empirical Finance 4, 73-114. Grossman, Sanford J., and Merton H. Miller, 1988, Liquidity and Market
Microstructure, Journal of Finance 43, 617-633. Grossman, Sanford J., and Joseph E. Stiglitz, 1980, On the Impossibility of
Informationally Efficient Markets, The American Economic Review 70, 393-408.
Haugen, Robert A., and Baker, Nadine L. (1996), Commonality in the Determinants
of Expected Stock Returns, Journal of Financial Economics 41, 401-439. Hasbrouck, Joel, Trading Costs and Returns for U.S. Equities: The Evidence from
Daily Data, Working Paper, New York University. Hasbrouck, Joel, and Duane J. Seppi, 2001, Common Factors in Prices, Order Flows,
and Liquidity, Journal of Financial Economics 59, 383-411. Ho, Thomas, and Hans Stoll, 1981, Optimal Dealer Pricing under Transactions and
Return Uncertainty, Journal of Financial Economics 9, 47-73. Hong, Gwangheon, and Arthur Warga, 2000, An Empirical Study of Bond Market
Transactions, Financial Analysts Journal 56, 32-46. Hotchkiss, Edith S., and Tavy Ronen, 2002, The Informational Efficiency of the
Corporate Bond Market: An Intraday Analysis, Review of Financial Studies 15, 1325-1354.
Houweling, Patrick, Albert Mentink, and Ton Vorst, 2003, How to Measure
Corporate Bond Liquidity? Tinbergen Institute Discussion Paper, TI 2003-030/2.
Huang, Jing-Zhi, and Ming Huang, 2003, How Much of Corporate-Treasury Yield
Spread Is Due to Credit Risk?: A New Calibration Approach, 14th Annual

43
Conference on Financial Economics and Accounting (FEA); Texas Finance Festival, http://ssrn.com/abstract=307360.
Huberman, Gur, and Dominika Halka, 2001, Systematic Liquidity, Journal of
Financial Research 24, 161-178. Longstaff, Francis, Sanjay Mithal and Eric Neis, 2004, Corporate Yield Spreads:
Default Risk or Liquidity? New Evidence from the Credit-Default Swap Market, NBER Working Paper No. 10418.
Jarrow, Robert A., David Lando, and Stuart Turnbull, 1997, A Markov Model for the
Term Structure of Credit Spreads, Review of Financial Studies 10, 481-523. Jarrow, Robert A. and Stuart Turnbull, 1995, Pricing Derivatives on Financial
Securities Subject to Credit Risk, Journal of Finance 50, 53-85. Jones, Charles M., Gautam Kaul, and Marc L. Lipson, 1994, Transactions, Volume,
and Volatility, Review of Financial Studies 7, 631-651. Jones, E. Philip, Scott Mason and Eric Rosenfeld, 1984, Contingent Claims Analysis
of Corporate Capital Structures: An Empirical Investigation, Journal of Finance 39, 611-625.
Kamara, Avraham, 1994, Liquidity, Taxes, and Short-Term Treasury Yields, Journal
of Financial and Quantitative Analysis 29, 403-417. Kim, Joon, Krishna Ramaswamy, and Suresh Sundaresan, 1993, Does Default Risk in
Coupons Affect the Valuation of Corporate Bonds? Financial Management 22, 117-131.
Krishnamurthy, Arvind, 2002, The Bond/Old-Bond Spread, Journal of Financial
Economics 66, 463-506. Kwan, Simon H., 1996, Firm-Specific Information and the Correlation between
Individual Stocks and Bonds, Journal of Financial Economics 40, 63-80. Ingersoll, Johnthan E., 1977, A Contingent-Claims Valuation of Convertible
Securities, Journal of Financial Economics 4, 289-321. Lando, David, 1997, Modeling Bonds and Derivatives with Default Risk, in M.
Dempster and S. Pliska: Mathematics of Derivative Securities, 369-393, (Cambridge University Press, Cambridge, U.K.).

44
Leland, Hayne, 1994, Corporate Debt Value, Bond Covenants, and Optimal Capital Structure, Journal of Finance 49, 1213-1252.
Leland, Hayne, 1998, Agency Costs, Risk Management, and Capital Structure,
Journal of Finance 53, 1213-1242. Leland, Hayne, and Klaus B. Toft, 1996, Optimal Capital Structure, Endogenous
Bankruptcy, and the Term Structure of Credit Spreads, Journal of Finance 51, 987-1019.
Longstaff, Francis, and Eduardo Schwartz, 1995, Valuing Risky Debt: A New
Approach, Journal of Finance 50, 789-820. Madan, Dilip, and Haluk Unal, 1998, Pricing the Risks of Default, Review of
Derivative Research 2, 121-160. Madan, Dilip, and Haluk Unal, 2000, A Two-Factor Hazard-Rate Model for Pricing
Risky Debt and the Term Structure of Credit Spreads, Journal of Financial and Quantitative Analysis 35, 43-65.
Madhavan, Ananth, and Seymour Smidt, 1993, An Analysis of Daily Changes in
Specialist Inventories and Quotations, Journal of Finance 48, 189-210. Mella-Barral, Pierre, and William Perraudin, 1997, Strategic Debt Service, Journal of
Finance 52, 531-566. Merton, Robert C., 1974, On the Pricing of Corporate Debt: The Risk Structure of
Interest Rates, Journal of Finance 29, 449-470. Odders-White, Elizabeth R., and Mark J. Ready, 2004, Credit Ratings and Stock
Liquidity, Working Paper, University of Wisconsin-Madison. O’Hara, Maureen, 1995, Market Microstructure Theory (Blackwell, Cambridge, MA). O’Hara, Maureen, 2003, Presidential Address: Liquidity and Price Discovery,
Journal of Finance 58, 1335-1354. O’Hara, Maureen, and George S. Oldfield, 1986, The Microeconomics of Market
Making, Journal of Financial and Quantitative Analysis 21, 361-376. Pastor, Lubos, and Robert F. Stambaugh, 2001, Liquidity Risk and Stock Returns,
Journal of Political Economy 111, 642–685.

45
Sarig, Oded, and Arthur D. Warga, 1989, Bond Price Data and Bond Market Liquidity, Journal of Financial and Quantitative Analysis 24, 367-378.
Schultz, Paul, 2001, Corporate Bond Trading Costs and Practices: A Peek Behind the
Curtain, Journal of Finance 56, 677-698. Strebulaev, Ilya A., 2002, Many Faces of Liquidity and Asset Pricing: Evidence from
the U.S. Treasury Securities Market, Working Paper, London Business School, http://papers.ssrn.com/sol3/papers.cfm?abstract_id=275843.
Stoll, Hans R., 1978, The Supply of Dealer Services in Securities Markets, Journal of
Finance 33, 1133-1151. Stoll, Hans. R., 1989, Inferring the Components of the Bid-Ask Spread: Theory and
Empirical Tests, Journal of Finance 44, 115-134. Van Ness, Bonnie F., Robert A. Van Ness, and Richard S. Warr, 2001, How Well Do
Adverse Selection Components Measure Adverse Selection? Financial Management 30, 77-98.
Vayanos, Dimitri, 1998, Transaction Costs and Asset Pricing: A Dynamic
Equilibrium Model, Review of Financial Studies 11, 1-58. Warga, A. D., 1992, Bond Returns, Liquidity and Missing Data, Journal of Financial
and Quantitative Analysis 27, 605-617. Yu, Fan, 2005, Accounting Transparency and the Term Structure of Credit Spreads,
Journal of Financial Economics 75(1), 53-84. Zhou, Chunsheng, 2001, The Term Structure of Credit Spreads with Jump Risk,
Journal of Banking and Finance 25, 2015-2040. Zhou, Xing, 2005a, Information-Based Trading in the Junk Bond Market, working
paper, Cornell University. Zhou, Xing, 2005b, Informational Content of Trading Volume in the Corporate Bond
Market, working paper, Cornell University.

46
Table I Characteristics of 36 TRACE 50 Bonds and Their Issuing Firms
This table contains summary characteristics for the 36 corporate bonds and their issuing firms at the time of their initial entry to the TRACE 50 list. Firm characteristics are based on data from COMPUSTAT, while bond characteristics are determined from the TRACE 50 dataset. Most of these descriptive bond data were obtained from NASD, with the remainder provided by the issuing firms. The following abbreviations are used in this table: for bond type, SRDEB (Senior Debenture), SRNT (Senior Note), SRSECNT (Senior Secured Note), SRSUBNT (Senior Subordinated Note), SRUNNT (Senior Unsecured Note), and UNNT (Unsecured Note); for industry, ENGY (Energy), FIN (Financial), MANU (Manufacturing), SERV (Services), TELE (Telecommunications) and TRANS (Transportation). Panel 1: Variable Mean Median Min Max Std Dev Issuer’s Total Assets ($ millions) 12642.4 8744 2265.9 36566 9364.9 Leverage (Total Liabilities/Total Assets) 0.8529 0.8667 0.5024 1.1835 0.1196 Coupon Rate 8.8483 9.0625 6.0000 11.6250 1.2945 Time to Maturity (year) 6.8998 6.6283 2.5435 26.7050 3.7830 Panel 2: Bond Type SRDEB SRNT SRSECNT SRSUBNT SRUNNT UNNT Number of Bonds 1 7 2 6 19 1 Percentage 2.78 19.44 5.56 16.67 52.78 2.78 Panel 3: S&P Rating BBB BB B CCC CC C NR Number of Bonds 3 10 14 5 1 1 2 Percentage 8.33 27.78 38.89 13.90 2.78 2.78 5.56 Panel 4: Coupon Type Variable Plain Vanilla Fixed Coupon Number of Bonds 1 35 Percentage 2.78 97.22 Panel 5: Payment Frequency Semiannually Number of Bonds 36 Percentage 100 Panel 6: Industry ENGY FIN MANU SERV TELE TRANS Number of Bonds 4 1 11 11 8 1 Percentage 11.11 2.78 30.56 30.56 22.22 2.78

47
Panel 7: Callable Yes No Number of Bonds 14 22 Percentage 38.89 61.11 Panel 8: Convertible Yes No Number of Bonds 0 36 Percentage 0 100

48
Table II Descriptive Statistics for Liquidity Measure, the AIM measures and their Cross
Correlations Panel 1 presents the mean, the median, the minimum, the maximum, the first quartile, the third quartile, and the standard deviation for the liquidity measures: number of transactions (NOT), and Amihud’s illiquidity measure (ILLQ), and the AIM measures. AIM1, AIM2 and AIM3 correspond to specifications (4)-(6) respectively. LOGAIM1, LOGAIM2 and LOGAIM3 are obtained by performing the transformation (3) on AIM1 through AIM3. Panel 2 and 3 contain cross-correlation coefficients between the liquidity measures and various AIM measures. Panel 2 has the coefficients based on the pooled data while Panel 3 includes the cross-sectional averages across the 35 bonds of correlations over time. Panel 1
Mean Median Min First Quartile
Third Quartile Max
Standard Deviation
NOT 2.36 2 0 0 3 15 2.34 ILLQ 6.732 3.129 0 2.046 7.118 38.214 5.396 AIM1 0.215 0.196 0.000 0.117 0.304 0.855 0.127 AIM2 0.255 0.242 0.002 0.093 0.350 0.875 0.127 AIM3 0.291 0.288 0.003 0.192 0.382 0.876 0.125 LOGAIM1 -1.778 -1.628 -9.114 -2.143 -1.190 -0.157 0.820 LOGAIM2 -1.534 -1.418 -6.492 -1.843 -1.050 -0.133 0.659 LOGAIM3 -1.348 -1.244 -5.936 -1.650 -0.962 -0.133 0.524 Panel 2:
AIM1 AIM2 AIM3 LOG- AIM1
LOG- AIM2
LOG- AIM3 NOT ILLQ
AIM1 1.000 0.935 0.878 0.882 0.835 0.808 -0.029 0.109 AIM2 0.935 1.000 0.935 0.834 0.911 0.874 -0.027 0.213 AIM3 0.878 0.935 1.000 0.787 0.852 0.943 0.001 0.117 LOGAIM1 0.930 0.839 0.753 1.000 0.902 0.829 -0.041 0.121 LOGAIM2 0.882 0.834 0.787 0.902 1.000 0.910 -0.046 0.180 LOGAIM3 0.808 0.874 0.943 0.829 0.910 1.000 -0.020 0.229 NOT -0.029 -0.027 0.001 -0.041 -0.046 -0.020 1.000 -0.189 ILLQ 0.109 0.213 0.187 0.072 0.180 0.139 -0.189 1.000 Panel 3:
AIM1 AIM2 AIM3 LOGAIM1
LOGAIM2
LOGAIM3 NOT ILLQ
AIM1 1.000 0.900 0.816 0.930 0.848 0.789 -0.086 0.143 AIM2 0.900 1.000 0.905 0.839 0.953 0.883 -0.085 0.193 AIM3 0.816 0.905 1.000 0.753 0.855 0.969 -0.064 0.154 LOGAIM1 0.930 0.839 0.753 1.000 0.876 0.779 -0.089 1.120 LOGAIM2 0.848 0.953 0.855 0.876 1.000 0.889 -0.085 1.108 LOGAIM3 0.789 0.883 0.969 0.779 0.889 1.000 -0.071 0.149 NOT -0.086 -0.085 -0.064 -0.089 -0.085 -0.071 1.000 -0.217 ILLQ 0.143 0.193 0.154 0.120 0.108 0.149 -0.217 1.000

49
Table III Sub-Sample Summary Statistics for Corporate Yield Spread, Liquidity and AIM
Measures This table reports summary statistics for YS (Yield Spread), NOT (Number of Trades), ILLQ (Amihud’s Illiquidity measure) and AIM measures (LOGAIM1, LOGAIM2 and LOGAIM3) for both period I (September 11th, 2002 to February 28th, 2003) and Period II (March 3rd, 2003-June 19th,2003). Yield spread is calculated as the difference between the corporate bond yield and the yield on a default-free bond with exactly the same maturity and coupon size. Yield on the corresponding default-free bond is estimated by employing a modified version of the extended Nelson-Siegel model [Bliss (1997)] on the observed on-the-run Treasury curve. AIM measures (LOGAIM1- LOGAIM3) are obtained by performing the transformation (3) on AIM1 through AIM3, which correspond to specifications (4)-(6) respectively. Statistics reported in Panel 1 includes the global mean of each variable (cross-sectional average of the time-series averages), the cross-sectional average of time-series standard deviation of each variable for both sub-samples. The correlations between yield spreads and the liquidity and AIM measures in time-series (averaged across bonds) for period I is presented in Panel2. Non-significant correlations are italicized. Panel 1: Mean and Time-Series Standard Deviations
Period I Period II Variable Mean TS Std. Dev. Mean TS Std. Dev. YS 10.562 2.274 7.272 1.352 NOT 1.681 1.315 4.090 2.197 ILLQ 7.476 6.778 3.289 4.237 LOGAIM1 -1.778 0.548 -1.834 0.574 LOGAIM2 -1.525 0.414 -1.864 0.503 LOGAIM3 -1.365 0.341 -1.388 0.395 Panel 2: Time-Series Correlation with Yield Spreads NOT ILLQ LOGAIM1 LOGAIM2 LOGAIM3 YS 0.035 0.107 0.325 0.316 0.283

50
Table IV Benchmark Regressions with Alternative AIM Measures
This table reports the results from estimating regression (7)-(9) based on the panel data of 35 TRACE 50 bonds across 107 trading days. Results from estimating regression (7) and (9) for three alternative AIM measures are presented in Panel 1, Panel 2 and Panel 3 respectively. Panel 4 contains results for regression (8). For each regression, I report the estimates of coefficients and their associated t-statistics and p-value, together with the resulting R-Square. The dependent variable, YS (yield spread), is calculated as the difference between the corporate bond yield and the yield on a default-free bond with exactly the same maturity and coupon size. Yield on the corresponding default-free bond is estimated by employing a modified version of the extended Nelson-Siegel model [Bliss (1997)] on the observed on-the-run Treasury curve. NOT and ILLQ stand for number of trades and Amihud’s illiquidity measure. AIM measures (LOGAIM1- LOGAIM3) are obtained by performing the transformation (3) on AIM1 through AIM3, which correspond to specifications (4)-(6) respectively. Panel 1: Private Information Content Measure by LOGAIM1
REGRESSION 7 REGRESSION 9
Est. t-stat Est. t-stat Est. t-stat Constant 12.938 12.25 13.036 12.30 11.376 11.98 AIM 1.336 20.22 1.336 20.21 1.176 18.23 NOT -0.059 -1.7 ILLQ 0.079 3.17 R-Square 0.098 0.099 0.118
Panel 2: Private Information Content Measured by LOGAIM2
REGRESSION 7 REGRESSION 9
Est. t-stat Est. t-stat Est. t-stat Constant 13.457 12.72 13.552 12.77 12.731 9.83 AIM 1.898 21.3 1.897 21.29 1.367 15.85 NOT -0.058 -1.67 ILLQ 0.103 2.77 R-Square 0.108 0.109 0.123
Panel 3: Private Information Content Measure by LOGAIM3
REGRESSION 7 REGRESSION 9
Est. t-stat Est. t-stat Est. t-stat Constant 13.179 12.48 13.257 12.51 11.78 10.75 AIM 1.916 16.98 1.912 16.94 1.19 7.43 NOT -0.05 -1.41 ILLQ 0.08 4.11 R-Square 0.072 0.072 0.89

51
Panel 4: Liquidity and Yield Spreads
REGRESSION 8
Est. t-stat Est. t-stat Constant 10.669 10.21 8.765 7.34 NOT -0.064 -1.73 ILLQ 0.079 5.11 R-Square 0.001 0.007

52
Table V Benchmark Regressions with Alternative AIM Measures on bonds without
special features
This table reports the results from estimating regression (7)-(9) based on the panel data of 21 TRACE 50 bonds across 107 trading days. These 21 bonds have constant semiannual coupon payments, and no embedded options (convertible, callable or sinking fund provisions). Results from estimating regression (7) and (9) for three alternative AIM measures are presented in Panel 1, Panel 2 and Panel 3 respectively. Panel 4 contains results for regression (8). For each regression, I report the estimates of coefficients and their associated t-statistics and p-value, together with the resulting R-Square. The dependent variable, YS (yield spread), is calculated as the difference between the corporate bond yield and the yield on a default-free bond with exactly the same maturity and coupon size. Yield on the corresponding default-free bond is estimated by employing a modified version of the extended Nelson-Siegel model [Bliss (1997)] on the observed on-the-run Treasury curve. NOT stands for number of trades, which is used as a measure for liquidity in this paper. AIM measures (LOGAIM1- LOGAIM3) are obtained by performing the transformation (3) on AIM1 through AIM3, which correspond to specifications (4)-(6) respectively. Panel 1: Private Information Content Measure by LOGAIM1
REGRESSION 7 REGRESSION 9
Est. t-stat Est. t-stat Est. t-stat Constant 12.975 9.13 13.134 9.21 9.881 10.54 AIM 1.596 17.74 1.595 17.74 1.497 15.67 NOT -0.096 -2.08 ILLQ 0.087 1.91 R-Square 0.123 0.125 0.139
Panel 2: Private Information Content Measured by LOGAIM2
REGRESSION 7 REGRESSION 9
Est. t-stat Est. t-stat Est. t-stat Constant 13.338 9.39 13.461 9.44 14.234 10.39 AIM 2.1 17.83 2.095 17.78 1.589 16.05 NOT -0.079 -1.7 ILLQ 0.074 3.13 R-Square 0.124 0.125 0.147
Panel 3: Private Information Content Measure by LOGAIM3
REGRESSION 7 REGRESSION 9
Est. t-stat Est. t-stat Est. t-stat Constant 13.24 9.33 13.328 9.35 10.239 8.53 AIM 2.271 15.09 2.26 15.19 1.963 11.75 NOT -0.062 -1.31 ILLQ 0.077 3.21

53
R-Square 0.092 0.093 0.121 Panel 4: Liquidity and Yield Spreads
REGRESSION 8
Est. t-stat Est. t-stat Constant 10.456 7.48 9.142 8.37 NOT -0.1 -2.02 ILLQ 0.085 4.17 R-Square 0.002 0.083
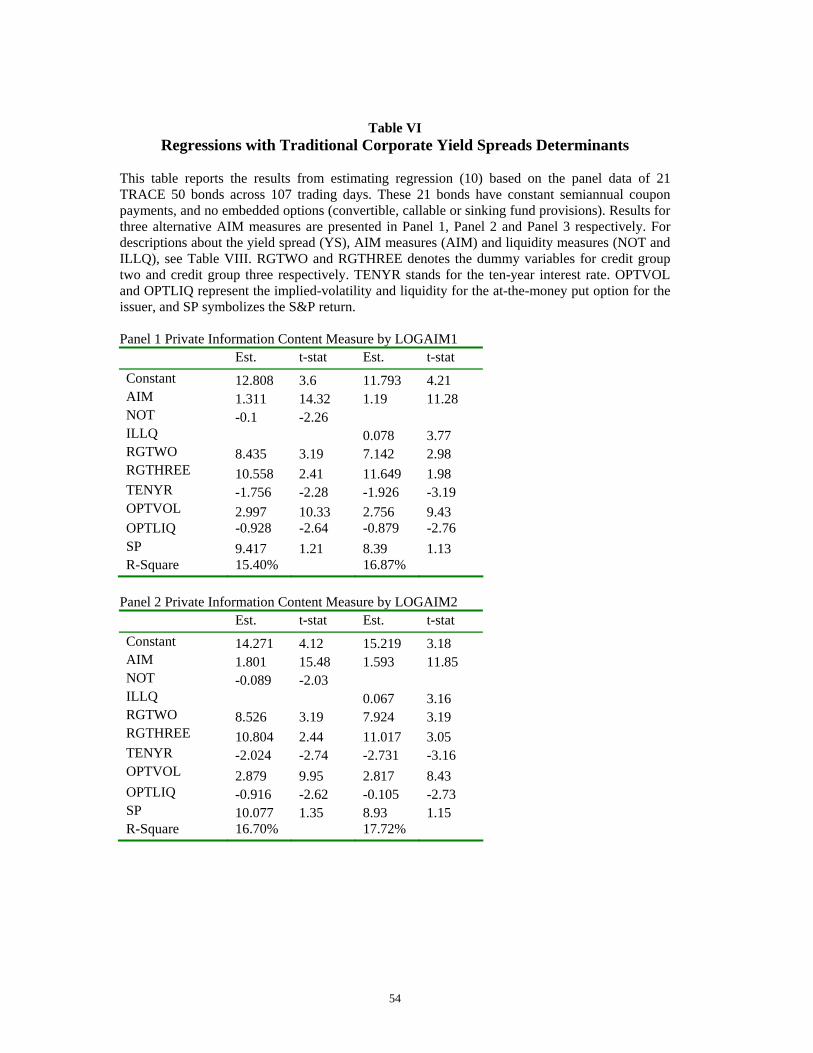
54
Table VI Regressions with Traditional Corporate Yield Spreads Determinants
This table reports the results from estimating regression (10) based on the panel data of 21 TRACE 50 bonds across 107 trading days. These 21 bonds have constant semiannual coupon payments, and no embedded options (convertible, callable or sinking fund provisions). Results for three alternative AIM measures are presented in Panel 1, Panel 2 and Panel 3 respectively. For descriptions about the yield spread (YS), AIM measures (AIM) and liquidity measures (NOT and ILLQ), see Table VIII. RGTWO and RGTHREE denotes the dummy variables for credit group two and credit group three respectively. TENYR stands for the ten-year interest rate. OPTVOL and OPTLIQ represent the implied-volatility and liquidity for the at-the-money put option for the issuer, and SP symbolizes the S&P return. Panel 1 Private Information Content Measure by LOGAIM1 Est. t-stat Est. t-stat Constant 12.808 3.6 11.793 4.21 AIM 1.311 14.32 1.19 11.28 NOT -0.1 -2.26 ILLQ 0.078 3.77 RGTWO 8.435 3.19 7.142 2.98 RGTHREE 10.558 2.41 11.649 1.98 TENYR -1.756 -2.28 -1.926 -3.19 OPTVOL 2.997 10.33 2.756 9.43 OPTLIQ -0.928 -2.64 -0.879 -2.76 SP 9.417 1.21 8.39 1.13 R-Square 15.40% 16.87%
Panel 2 Private Information Content Measure by LOGAIM2 Est. t-stat Est. t-stat Constant 14.271 4.12 15.219 3.18 AIM 1.801 15.48 1.593 11.85 NOT -0.089 -2.03 ILLQ 0.067 3.16 RGTWO 8.526 3.19 7.924 3.19 RGTHREE 10.804 2.44 11.017 3.05 TENYR -2.024 -2.74 -2.731 -3.16 OPTVOL 2.879 9.95 2.817 8.43 OPTLIQ -0.916 -2.62 -0.105 -2.73 SP 10.077 1.35 8.93 1.15 R-Square 16.70% 17.72%
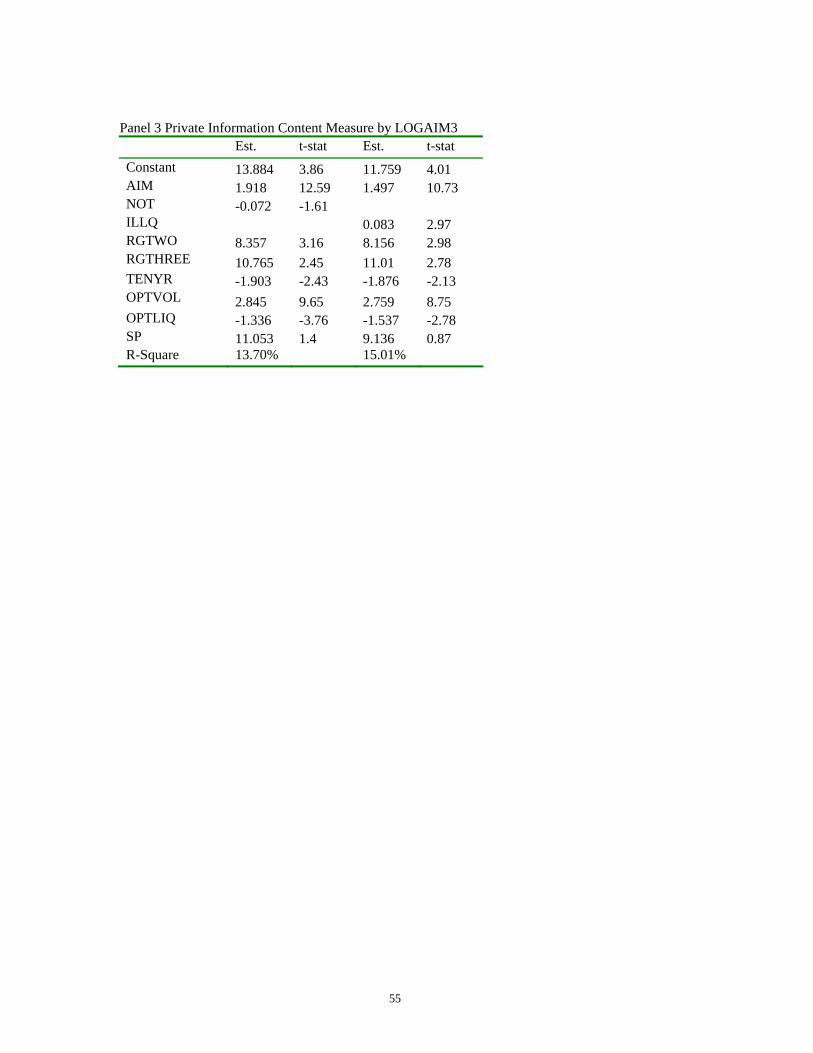
55
Panel 3 Private Information Content Measure by LOGAIM3 Est. t-stat Est. t-stat Constant 13.884 3.86 11.759 4.01 AIM 1.918 12.59 1.497 10.73 NOT -0.072 -1.61 ILLQ 0.083 2.97 RGTWO 8.357 3.16 8.156 2.98 RGTHREE 10.765 2.45 11.01 2.78 TENYR -1.903 -2.43 -1.876 -2.13 OPTVOL 2.845 9.65 2.759 8.75 OPTLIQ -1.336 -3.76 -1.537 -2.78 SP 11.053 1.4 9.136 0.87 R-Square 13.70% 15.01%
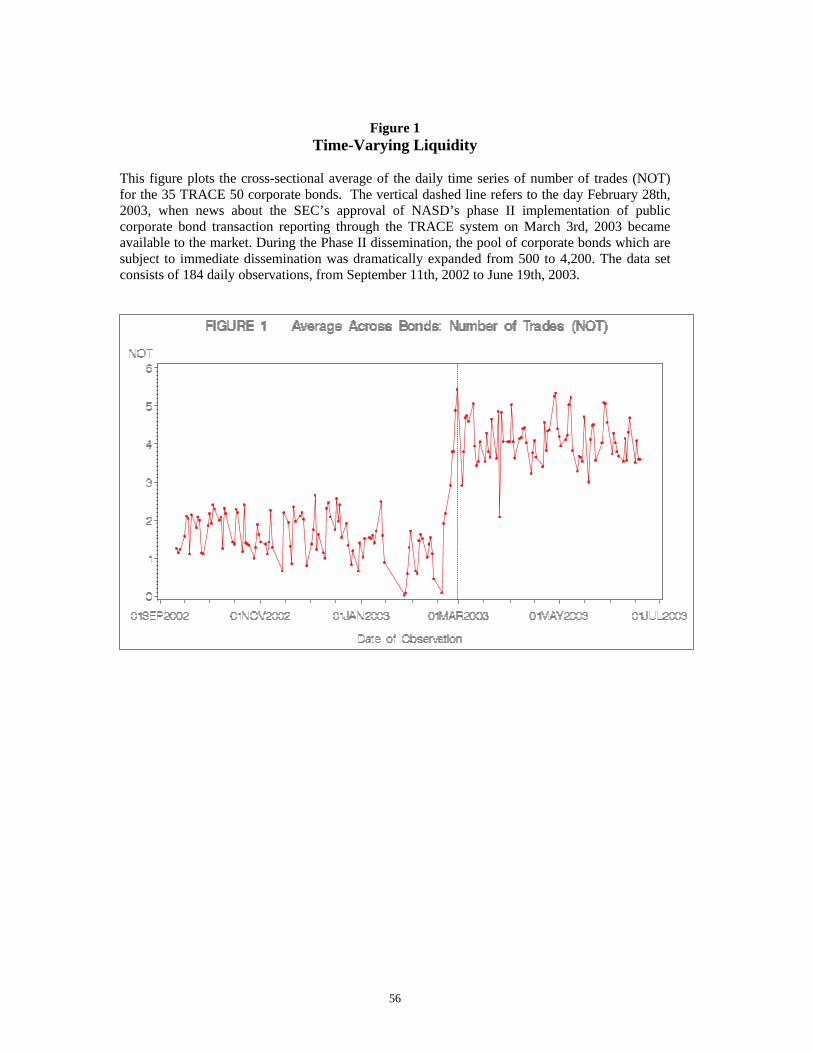
56
Figure 1 Time-Varying Liquidity
This figure plots the cross-sectional average of the daily time series of number of trades (NOT) for the 35 TRACE 50 corporate bonds. The vertical dashed line refers to the day February 28th, 2003, when news about the SEC’s approval of NASD’s phase II implementation of public corporate bond transaction reporting through the TRACE system on March 3rd, 2003 became available to the market. During the Phase II dissemination, the pool of corporate bonds which are subject to immediate dissemination was dramatically expanded from 500 to 4,200. The data set consists of 184 daily observations, from September 11th, 2002 to June 19th, 2003.
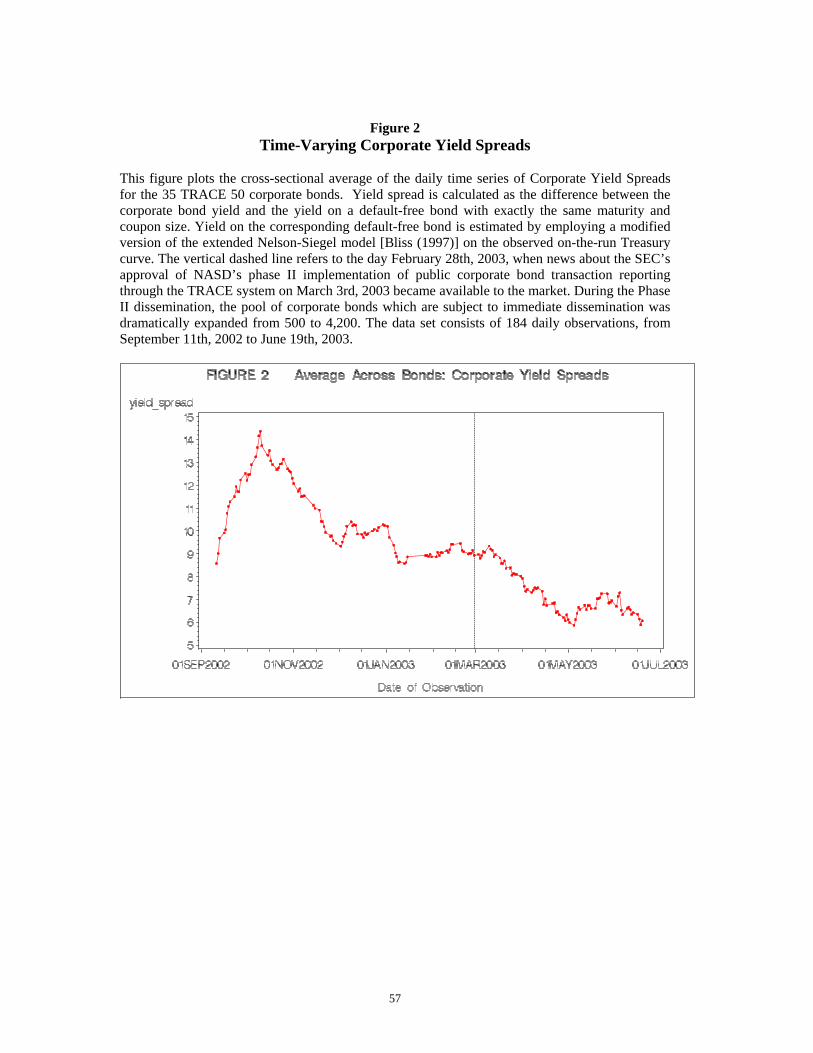
57
Figure 2 Time-Varying Corporate Yield Spreads
This figure plots the cross-sectional average of the daily time series of Corporate Yield Spreads for the 35 TRACE 50 corporate bonds. Yield spread is calculated as the difference between the corporate bond yield and the yield on a default-free bond with exactly the same maturity and coupon size. Yield on the corresponding default-free bond is estimated by employing a modified version of the extended Nelson-Siegel model [Bliss (1997)] on the observed on-the-run Treasury curve. The vertical dashed line refers to the day February 28th, 2003, when news about the SEC’s approval of NASD’s phase II implementation of public corporate bond transaction reporting through the TRACE system on March 3rd, 2003 became available to the market. During the Phase II dissemination, the pool of corporate bonds which are subject to immediate dissemination was dramatically expanded from 500 to 4,200. The data set consists of 184 daily observations, from September 11th, 2002 to June 19th, 2003.

58
Figure 3 Liquidity and Corporate Yield Spreads
This figure plots the liquidity measure (NOT) alongside Corporate Yield Spreads for the 35 TRACE 50 corporate bonds during the period from September 11th to February 28th, 2003, one day before the NASD started its phase II implementation of public corporate bond transaction reporting through the TRACE system. The dotted line represents corporate yield spreads, which are plotted against the left vertical axis, while the solid line denotes the number of trades (NOT), which are plotted against the right vertical axis. The data set consists of 107 daily observations.

59
Figure 4 AIM measures and Corporate Yield Spreads
The following 3 figures plot the cross-sectional average of daily time series of corporate yield spreads and the log transformation of the AIM measures for the 35 TRACE 50 corporate bonds during the period from September 11th to February 28th, 2003, one day before the NASD started its phase II implementation of public corporate bond transaction reporting through the TRACE system. The dotted line represents corporate yield spreads, which are plotted against the left vertical axis, while the solid line denotes the AIM measures (logaim1-logaim3), which are plotted against the right vertical axis. AIM measures (logaim1- logaim3) are obtained by performing the transformation (3) on AIM1 through AIM3, which correspond to specifications (4)-(6) respectively. The data set consists of 107 daily observations.

60

Appendix A
Estimation Default-Free Zero-Coupon Interest Rates by Using the Extend
Nelson-Siegel Model The extended Nelson-Siegel Model fits an exponential approximation of the discount rate function directly to observed bond prices. In this model, the bond pricing function is simply
∑=
−=iM
m
mmrmii ecp
1
)(,ˆ
, where c and m refer to the cash flow and its related time respectively. The discount rate function, r(m), takes the following functional form:
⎥⎦
⎤⎢⎣
⎡−
−+⎥
⎦
⎤⎢⎣
⎡ −+= −
−−2
21/
2
/
21
/
10 /1
/1)( τ
ττ
τβ
τββ m
mm
em
ememr
. A set of parameters, ],,,,[ 21210 ττβββ=Φ , is estimated using the following nonlinear constrained optimization estimation procedure:
,)(min1
2
,,,, 21210∑=
tN
iiiw ε
ττβββ subject to
0)( min ≥mr , 0)( max ≥mr ,
and ])(exp[])(exp[ 11 ++−≥− kkkk mmrmmr , maxmin mmm k <≤∀ ,
where
∑=
=tN
jj
ii
d
dw
1/1
/1
, and
iii pp ˆ−=ε . In this model, d denotes the Macaulay duration and iε is the pricing error. With the
estimates ]ˆ,ˆ,ˆ,ˆ,ˆ[ˆ21210 ττβββ=Φ , the discount rate r(m), the default-free zero-coupon
interest rate, and thereafter the price and the yield of the corresponding default-free bonds can be readily calculated.