Information is Power – Eliminating Waste at the Work Face is Power – Eliminating Waste at the...
24
LCI Australian Conference – 2014 Information is Power – Eliminating Waste at the Work Face
Transcript of Information is Power – Eliminating Waste at the Work Face is Power – Eliminating Waste at the...

LCI Australian Conference – 2014 Information is Power – Eliminating Waste at the Work Face
Information is Power – Eliminating Waste at the Work Face
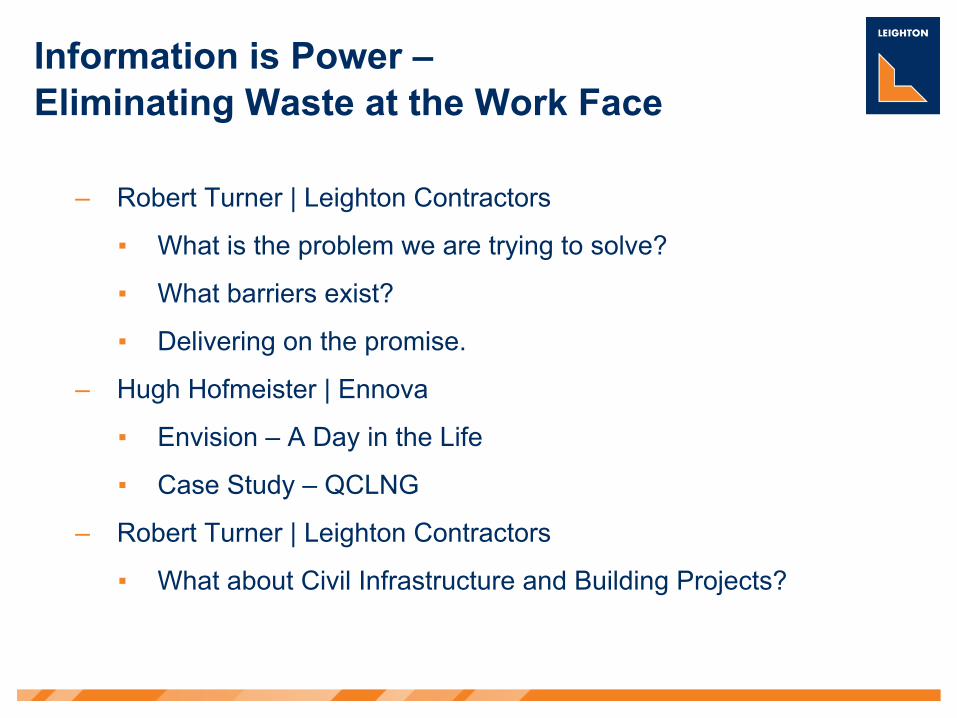
– Robert Turner | Leighton Contractors
▪ What is the problem we are trying to solve?
▪ What barriers exist?
▪ Delivering on the promise.
– Hugh Hofmeister | Ennova
▪ Envision – A Day in the Life
▪ Case Study – QCLNG
– Robert Turner | Leighton Contractors
▪ What about Civil Infrastructure and Building Projects?

Productivity in Construction – Why has it stood still?
“The light is just starting to shine on Australia’s Construction Productivity” – Marosszeky July 2013 LIC Australia Conference
Hugh Hofmeister
Construction Industry Institute
Hugh Hofmeister
Text

Information is Power – Eliminating Waste at the Work Face
■ The Problem – Construction Industry Productivity has stood still at
best – or worse – gone backwards ■ Theoretical solutions abound
– CPM – Critical Chain – Lean – Earned Value / CS2
Information is Power – Eliminating Waste at the Work Face
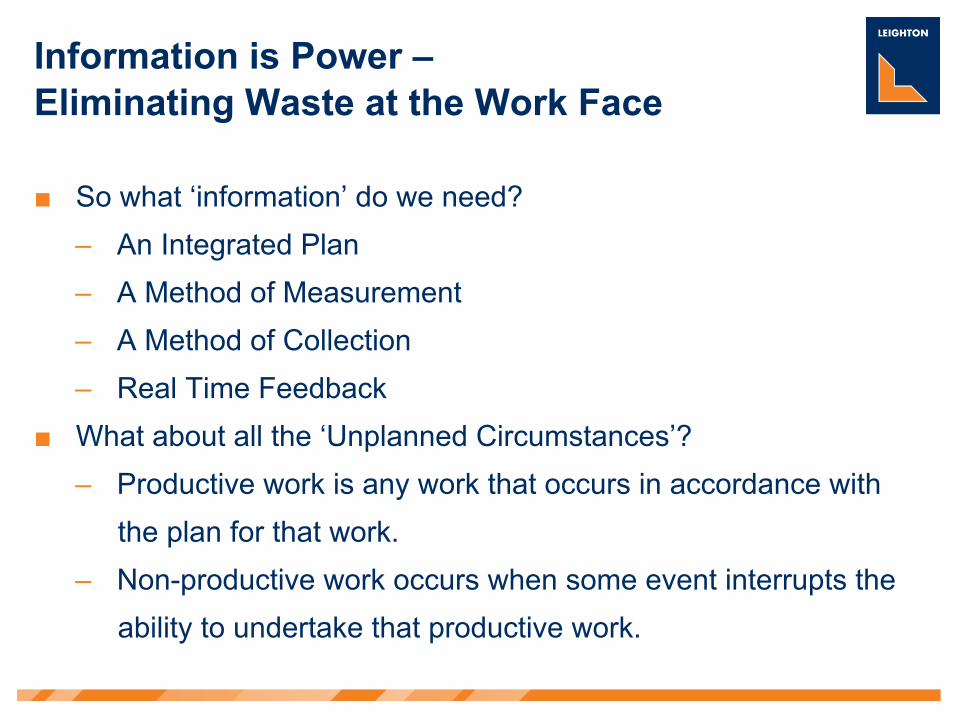
■ So what ‘information’ do we need? – An Integrated Plan – A Method of Measurement – A Method of Collection – Real Time Feedback
■ What about all the ‘Unplanned Circumstances’? – Productive work is any work that occurs in accordance with
the plan for that work. – Non-productive work occurs when some event interrupts the
ability to undertake that productive work.

Information is Power – Eliminating Waste at the Work Face
■ What has been the industry response? – Complex software built around the theories – Complex project controls and performance measurement
requirements ■ What has all this produced?
– Large “Project Controls” teams feeding these systems and requirements
– Drive to cross reference all data to program – Conflicting information – Overload of those whose real role is to manage the
construction activity
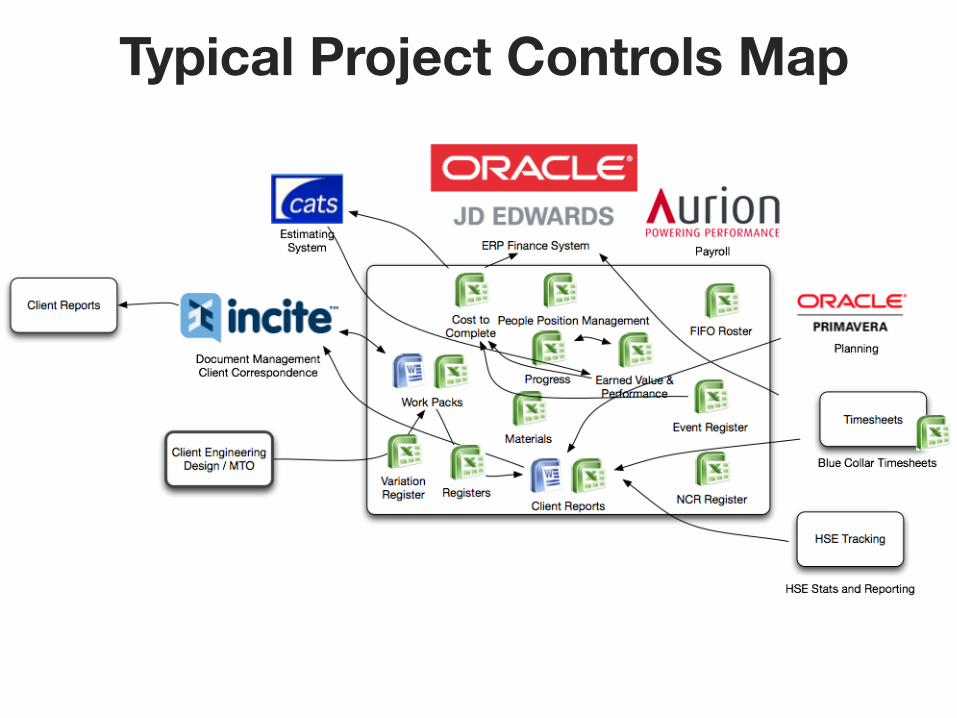
Typical Project Controls Map
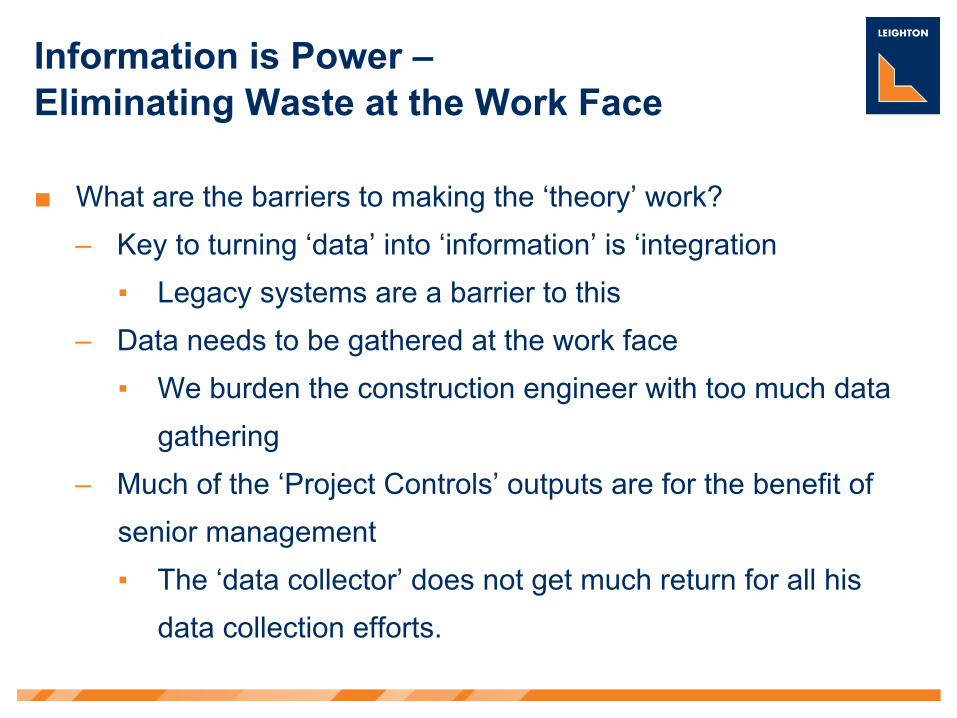
Information is Power – Eliminating Waste at the Work Face
■ What are the barriers to making the ‘theory’ work? – Key to turning ‘data’ into ‘information’ is ‘integration ▪ Legacy systems are a barrier to this
– Data needs to be gathered at the work face ▪ We burden the construction engineer with too much data
gathering – Much of the ‘Project Controls’ outputs are for the benefit of
senior management ▪ The ‘data collector’ does not get much return for all his
data collection efforts.

Envision Integrated Project Controls “Delivering on the promise”

Information is Power – Eliminating Waste at the Work Face
■ So how does Envision allow us to deliver on the promise? – Respects legacy systems – Harness modern mobile technology – Open architecture / wide visibility – Capture electronically as close to the work face as possible
and capture minimum possible. ▪ Let electronic systems provide easy cross reference ▪ Other project participants enrich the data
– Provide real time daily reporting which is of value to those tasked with capturing data in the field.

Envision.

CASE STUDY QCLNG Upstream Compressions

Project sites 14 Construction $2B

8,000 people recruited3,200 peak on roster1,150 Envision users
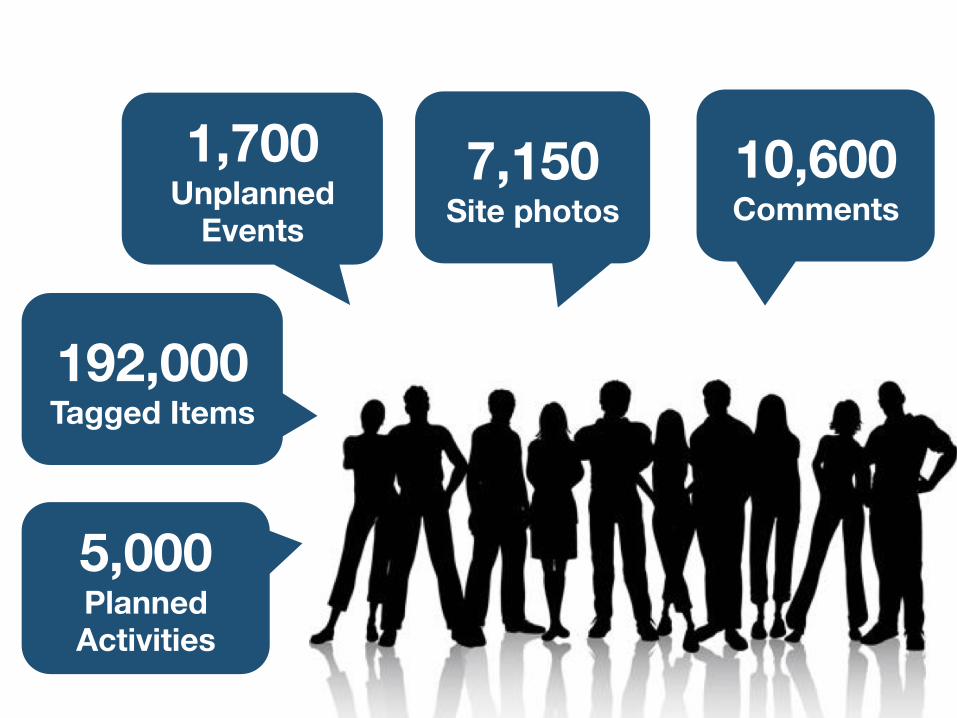
5,000 Planned Activities
192,000Tagged Items
1,700Unplanned
Events 7,150
Site photos 10,600Comments

“Envision has provided accurate real-time reporting that has enabled fast and effective decision making that has led to measurable improvements in efficiency and productivity leading to cost and schedule benefits on our project”
Joe Dujmovic Thiess QCLNG Project Director
Example Weekly Report


150$
200$
250$
300$
350$
400$
450$
500$
$1$$ $2$$ $3$$ $4$$ $5$$ $6$$ $7$$ $8$$ $9$$ $10$$ $11$$ $12$$ $13$$ $14$$
Normalised
+Sched
ule+Da
ys+
Facili3es+Completed+
Learning$Curve$ Normalised$Schedule$Days$
Re#$Baseline$Cost$&$Schedule$
Production Efficiencies
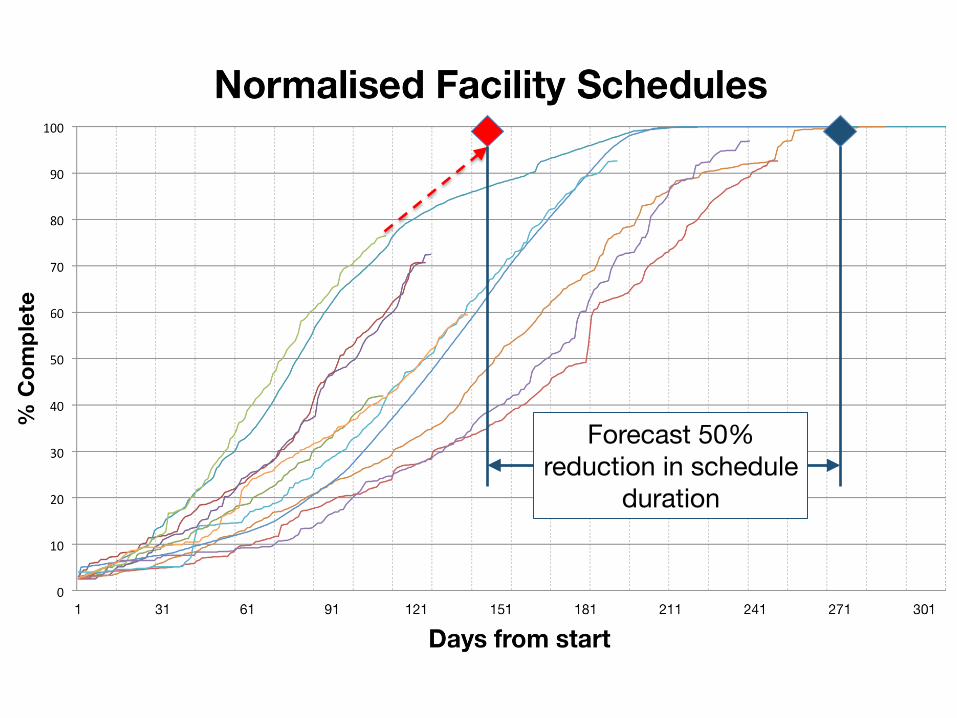
Forecast 50% reduction in schedule
duration

QCLNG Labour Productivity (Compression)
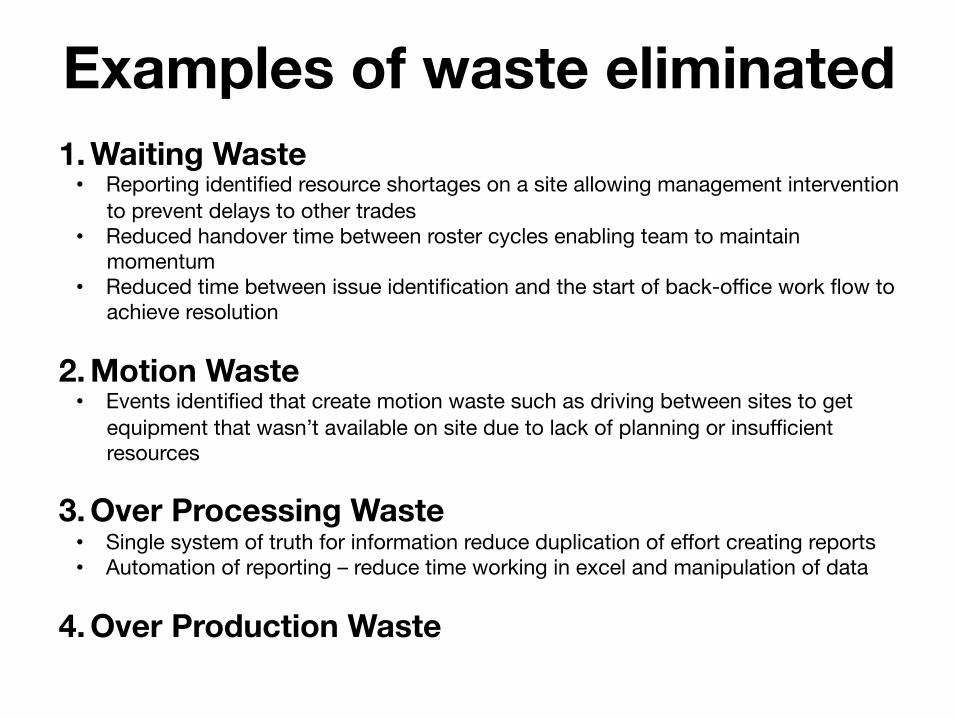
Examples of waste eliminated 1. Waiting Waste • Reporting identified resource shortages on a site allowing management intervention
to prevent delays to other trades • Reduced handover time between roster cycles enabling team to maintain
momentum • Reduced time between issue identification and the start of back-office work flow to
achieve resolution
2. Motion Waste • Events identified that create motion waste such as driving between sites to get
equipment that wasn’t available on site due to lack of planning or insufficient resources
3. Over Processing Waste • Single system of truth for information reduce duplication of effort creating reports • Automation of reporting – reduce time working in excel and manipulation of data
4. Over Production Waste

5. Transportation Waste • Reduced the double handling of materials through improved planning
6. Inventory Wastes
7. Correction / Defect Wastes • Identified methodology/sequence issues in steel erection shared across the project • Reduction of impact caused by rework through early identification and
communication
8. Under-Utilised Talent/Creativity • Making project information available to project team created engagement and
continuous peer review and comment leading to improved problem solving
Examples of waste eliminated

Information is Power – Eliminating Waste at the Work Face
■ Federal Government Infrastructure Spend
■ Civil Infrastructure and Building Project – Cost Ratio | Labour v Plant / Equipment v Materials – Self Execute v Trade Package Subcontractors – Design & Construct v Construct Only