Information for a tabular grades 7-9. and 157 for grades ...
48
DOCUMENT R ES E ED 025 153 EM 006 844 The Status of Instructional Television. A Study of Instructional Television for Elementary and Secondary Schools During the First Semester of the School Year 1963-1964. with Supplementary Tables. National Instructional Television Library. New York, N.Y. Pub Date Mar 64 Note- 47p. EDRS Price MF-$0.25 HC-$2.45 Descriptors- Airborne Television. *Closed Circuit Television. *Commercial Television, Course Content, Economics. *Educational Television. Elementary Schools, Grouping (Instructional Purposes). 1nservice Courses, Instructional Design, *Instructional Television, Lesson Plans, Questionnaires, Secondary Schools. Student Enrollment, *Tables (Data) Identifiers-Midwest Program On Airborne Television Instruction Information for a tabular study of instructional television (ITV) series was supplied via questionnaire by 81.educational fetevision stations, the Midwest Program on Airborne Television Instruction, 41 closed-circuit installations. and 51 commeroal channels. Most of the series offerings (727) were designed for elementary grades. Offerings for secondary grades were 137 for grades 7-9. and 157 for grades 10-12. The instructional purpose of each series was categorized as major resource. supplemental, or enrichment. Supplementary fables provide statistics on the following: hours devoted to ITV programing (25,800 broadcast hours during first semester 1963-64). enrollment, weekly lesson frequency. number of lessons in an entire series. length of lessons. production sources, types of program selection control, expenses and sources of income of educational television stations for ITV programing, course offerings and content, air time for ITV series, lesson repeats. inservice teacher education, and educational television assessment formulas. (TI)
Transcript of Information for a tabular grades 7-9. and 157 for grades ...

DOCUMENT R ES E
ED 025 153EM 006 844
The Status of Instructional Television. A Study of Instructional Television for Elementary and Secondary
Schools During the First Semester of the School Year 1963-1964. with Supplementary Tables.
National Instructional Television Library. New York, N.Y.
Pub Date Mar 64Note- 47p.EDRS Price MF-$0.25 HC-$2.45
Descriptors- Airborne Television. *Closed Circuit Television. *Commercial Television, Course Content, Economics.
*Educational Television. Elementary Schools, Grouping (Instructional Purposes). 1nservice Courses,
Instructional Design, *Instructional Television, Lesson Plans, Questionnaires, Secondary Schools. Student
Enrollment, *Tables (Data)Identifiers-Midwest Program On Airborne Television Instruction
Information for a tabular study of instructional television (ITV) series was
supplied via questionnaire by 81.educational fetevision stations, the Midwest Program
on Airborne Television Instruction, 41 closed-circuit installations. and 51 commeroal
channels. Most of the series offerings (727) were designed for elementary grades.
Offerings for secondary grades were 137 for grades 7-9. and 157 for grades
10-12. The instructional purpose of each series was categorized as major resource.
supplemental, or enrichment. Supplementary fables provide statistics on the following:
hours devoted to ITV programing (25,800 broadcast hours during first semester
1963-64). enrollment, weekly lesson frequency. number of lessons in an entire series.
length of lessons. production sources, types of program selection control, expenses
and sources of income of educational television stations for ITV programing, course
offerings and content, air time for ITV series, lesson repeats. inservice teacher
education, and educational television assessment formulas. (TI)

U.S. DEPARTMENT OF HEALTH, EDUCATION & WELFARE
OFFICE OF EDUCATION
THIS DOCUMENT HAS BEEN REPRODUCED EXACTLY AS RECEIVED FROM THE
PERSON OR ORGANIZATION ORIGINATING II. POINTS OF VIEW OR OPINIONS
STATED DO NOT NECESSARILY REPRESENT OFFICIAL OFFICE OF EDUCATION
POSITION OR POLICY.
TBE STATUS OF INSTRUCTIONAL TELEVISION
A Study of Instructional Television
for Elementary and Secondary Schools
during the First Semester of the School Year 1963-1964
with Supplementary Tables
NATIONAL INSTRUCTIONAL TELEVISION LIBRARY
10 Columbus Circle
New York, New York 10019
March 1964
APPMIX A
006844

THE STATUS OF INSTRUCTIONAL TELEVISION
A study of instructional television for use by classes in elementary
and secondary schools during the first senester of the sdhool year
1963-1964 was made by the National Instructional Television Library. The
study included the instructional television offerings and related opera-
tions of educational television stations, closed circuit installations,
and commercial channels:
Before starting this study, a review was made of previous studies.
Although these studies included a wealth of information, none dealt with
the current school year. Educational television is a fast-moving field
of endeavor in which the facts and figures are constantly changing. Also,
none of the previous studies gave data concerning certain aspects of
instructional television which were deemed important in this study, and
no source consulted gave information concerning instructional television
offered over commercial channels.
The report is based upon the information furnished by the 81 educational
television stations on the air September, 1963, Midwest Program on Airborne
Television Instruction, 41 closed circuit installations, and 51 commercial
channels offering instructional television courses. Of the 81 educational
television stations, 72 reported offering instructional television lessons
for elementary and secondary grades. A description of the method by which
the data of this report was gathered is given in some detail in the last
section of this report.
Unless otherwise stated, all figures are totals for instructional
television (TM during the first semester of the school year 1963-1964

Status - 2
over educational television stations (ETV), closed circuit television
installations (CCTV), and commercial channels (COM) offering regular
ITV courses. The elementary grade level grouping was kindergarten through
sixth grade (K-6); the secondary grouping, seventh through twelth grade
(7-12).
Grade Emphasis
The division of the total offerings of litv series according to grades
Showed an emphasis on offerings for the elementary grades, 72 per cent
of the total: Of per cent for grades K-30 iSrper cent for grades 4-6.
The series offerings for secondary grades were 28 per cent of the
total, with 13 per cent for grades 7-9, and 15 per cent for grades 10-12.
FIGURE 1
TOTAL OFFERINGS OF 1887 ITV SERIES
Elementary - 1355 series
K-3: 451 4-6: 904
Secondary - 532 series
7-9: 245 i 10-12: 287 1
An ITV series is a sequence of television lessons dealing with
specific subject-matter content at specified grade level or levels. Series
vary in length from 2 to 190 lessons, as explained in some detail in a
later part of this report.
The term "offering of ITV series" refers to the count of the number
of series offered by the various broadcasting facilities. The figure for
the total offering for ITV series does not refer to the number of discrete
Status - 3
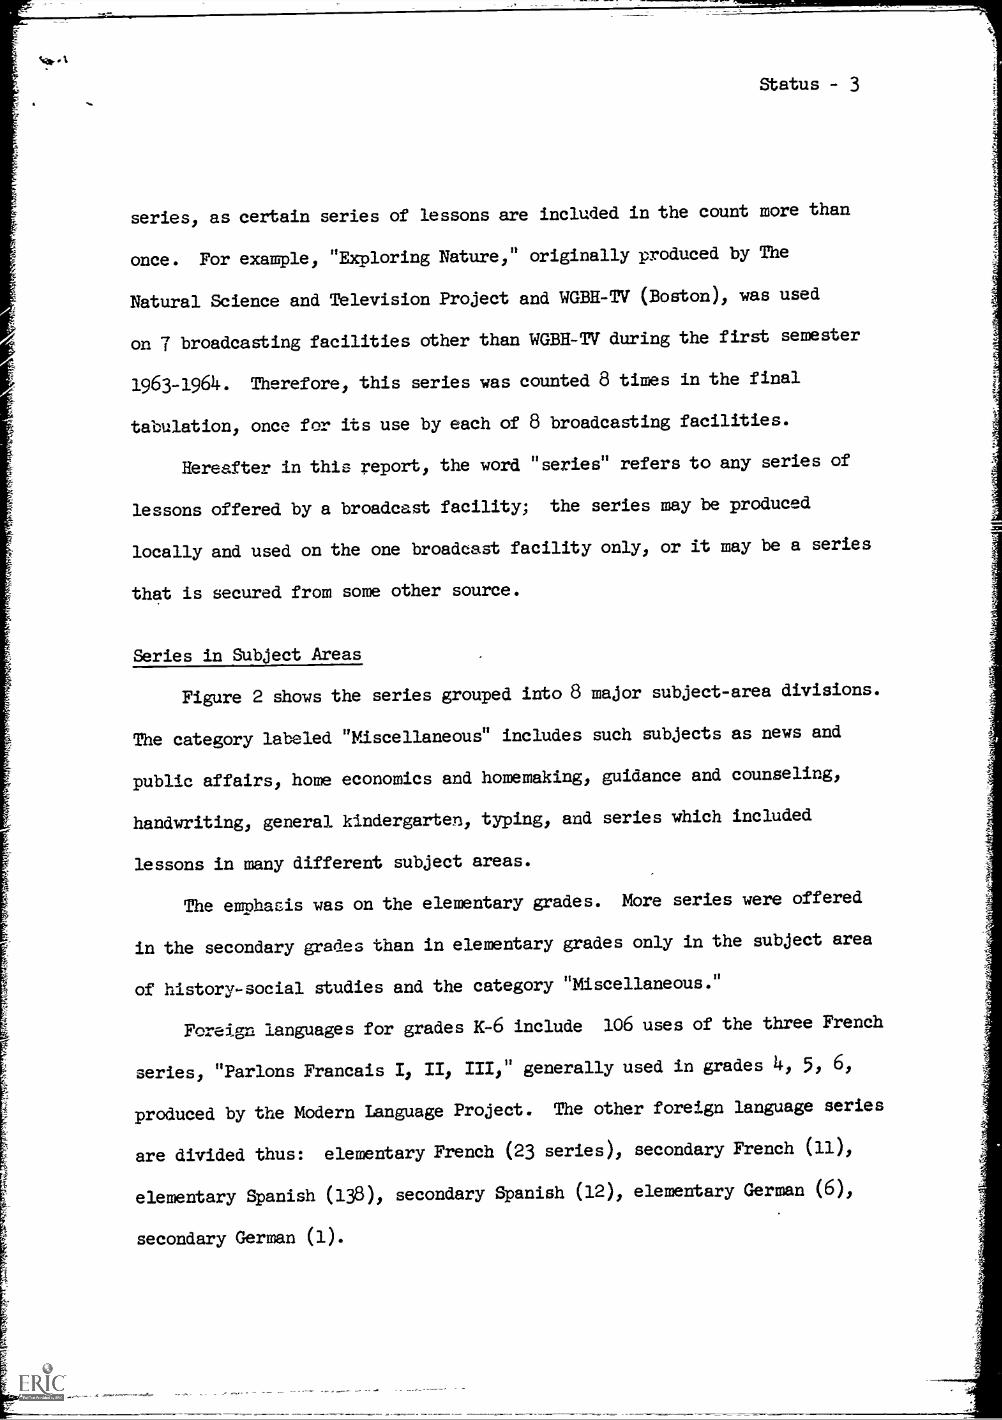
series, as certain series of lessons are included in the count more than
once. Fbr example, "Exploring Nature," originally produced by The
Natural Science and Television Project and WGBH-TV (Boston), was used
on 7 broadcasting facilities other than WGBH-TV during the first semester
1963-1964. Therefore, this series was counted 8 times in the final
tabulation, once for its use by each of 8 broadcasting facilities.
Hereafter in this report, the word "series" refers to any series of
lessons offered by a broadcast facility; the series may be produced
locally and used on the one broadcast facility only, or it may be a series
that is secured from some other source.
.11111111
311
Series in Subject Areas
Figure 2 shows the series grouped into 8 major subject-area divisions.
The category labeled "Miscellaneous" includes such subjects as news and
public affairs, home economics and homemaking, guidance and counseling,
handwriting, general kindergarten, typing, and series which included
lessons in many different subject areas.
The emphasis was on the elementary grades. More series were offered
in the secondary grades than in elementary grades only in the subject area
of history-social studies and the category "Miscellaneous."
Foreign languages for grades K-6 include 106 uses of the three French
series, "Parlons Francais 1, II) III)" generally used in grades 4, 5, 6,
produced by the Modern Language Project. The other foreign language series
are divided thus: elementary French (23 series), secondary French (11),
elementary Spanish (138), secondary Spanish (12), elementary German (6),
secondary German (1).

C=
11
Pi
Science
24
135
131
FIGURE 2
SERIES IN SUBJECT AREAS
64 1 olor
tmom
mo
Foreign
History-
English-
Languages Social Studies Language
Arts
440
297
254
195
23%
16%
13%
10%
165 M
usic
183
3102
47
1
Arithmetic-
Mathematics
130
63
27
12
Phys.Ea.- Miscellaneous
Health -
Safety
K-6
7-12
59
78
"."
*1.=
00A
NII
I/14
.
149
142
90
137
9.5%
8%
7.5%
5%
7%

Status - 5
Instructional Purpose (ETV)
The ITV series as described in the printed materials supplied by
the ETV stations were analyzed according to instructional purpose. They
were separated into three categories: major resource, supplemental, and
enrichment.
FIGURE 3
INSTRUCTIONAL PURPOSE (ETV)
Major Resource I
410 294
Supplemental I
637
Enrichment265
500
K-6I
7-121
The phrase "major resource" was used to characterize my series which
presented the major content or all the basic concepts of the course. Such
a presentation still allowed time for the classroom teacher to conduct
activities to clarify, reinforce, and extend the television lessons. Series
which presented 4 or 5 lessons a week, sometimes 30 minutes in length,
obviously belong in this category. Other series, though less frequent or
shorter, were placed in this category when the statement of the purpose
included in the printed program schedules indicated such placement; this
was most frequently true with elementary grades series.
"Supplemental" included series which were definitely correlated with
the local courses of study, but which did not present all of the major con-

Status - 6
tent. Such series usually provided expert teaching and unusual resources,
introducing content material in a different manner, thus reinforcing the
classroom activities. Such lessons usually were broadcast alternate weeks
or once a week, although other patterns of frequency were to be found.
"Enrichment" included series which included valuable resource materials
which did not relate directly to the principal contents of courses of study.
This category included series such as news and public
music, guidance or counseling, ,r-
c..trwriraNnr14,1C4A..Lc4a-as.7,
series which brought materials which were
related but not essential to courses of study.
These categories are not rigid by any means. An rrV science series
may be used as a major resource in a school which has limited science equip-
ment or a teacher not especially trained to teach science; the same series
may be considered supplementary or even enrichment by another school which
has adequate equipment and a qualified science teacher.
The subject areas which appeared most frequently under major resources
were foreign language (193 series), science (65), history-social studies (50),
and music (41). As TTV series in foreign languages are widely used in the
elementary schools in classrooms with teachers not especially trained to
teach a foreign language, the large percentage of major resource series in
this area was to be expected.
Instructional Purpose (CCTV and Commercial)
The school districts having closed circuit installations or using
commercial channels for ITV were asked to characterize their series as
"basic" or "enrichment," since these are the terms of differentiation most
commonly used. The series here classed as "enrichment" no doubt include
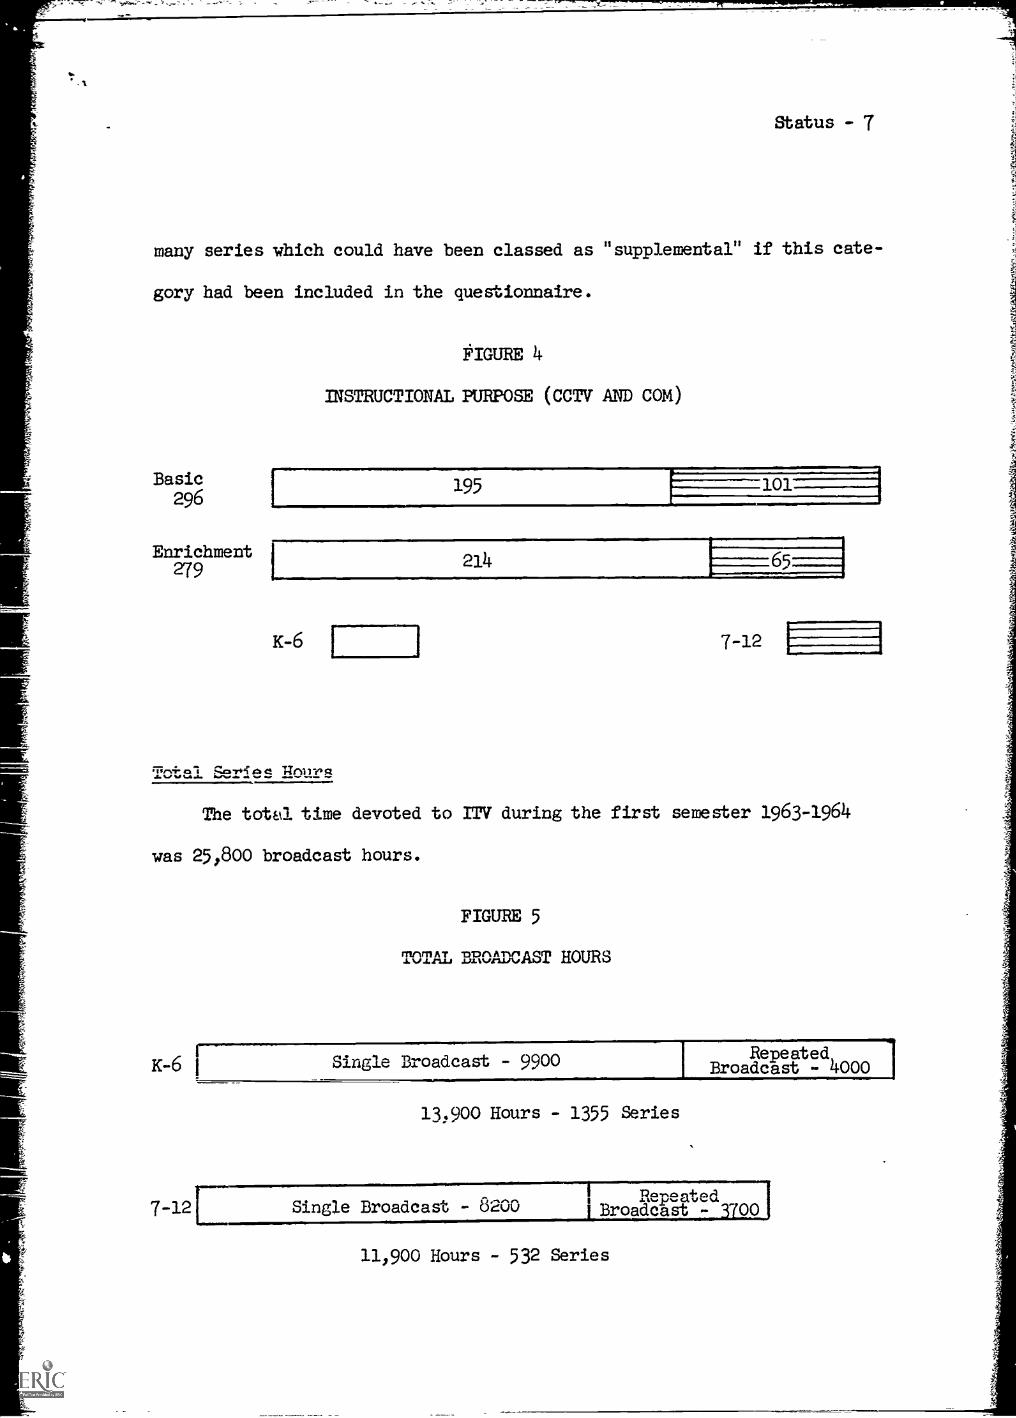
Status - 7
many series which could have been classed as "supplemental" if this cate-
gory had been included in the questionnaire.
Basic296
Enrichment279
'IGURE 4
INSTRUCTIONAL PURPOSE (CCTV AND COM)
195 lor
214
K-6
Total gcvwcoc Rniri4R
7-12
The total time devoted to 1TV during the first semester 1963-1964
was 25,800 broadcast hours.
K-6
7-12
FIGURE 5
mnrilAT BROADCAST HOURS
Single Broadcast - 9900 RepeatedBroadcast - 4000
13,900 Hours - 1355 Series
Single Broadcast - 8200Repeated
BroadcAst - 37001
11,900 Hours - 532 Series
Status - 8
In order to fit television offerings to class schedules and thereby
facilitate the use of the television lessons, many broadcast facilities
repeated lessons. The repeat pattern varied from 1 to 11 repeats. Thirty-
five per cent of the ITV series were repeated. Single broadcast time was
70 per cent total time; rebroadcast time, 30 per cent.
There seems to be a disproportionate amount of time for grades 7-12
if that figure is related to the number of series offered. Secondary
series, however, usually were longer and had a larger number of lessons
each week, as will be shown in more detail in other sections of the re-
port.
Increase in ITV Programming (ETT)
The total number of hours for in-school broadcasting has increased
as the number of ETV stations increased. The percentage of total broad-
cast time for in-school programming has also increased from 33.56 per
cent in the spring of 1962 to 39.47 per cent in the first semester of
1963-1964. Other figures concerning the growth of in-school programming
are shown in Table 1.
The figures for 1961 and 1962 were taken from two reports published
by Brandeis University: "One Week in Educational Television: May 21-27,
1961" and "One Week in Educational Television: March 18-24, 1962."
As the two reports from Brandeis University included in-service educa-
tion series for teachers, the figures for in-service were also included in
the 1963-1964 figures.
Certain other statistical figures can be given for the first semester
of 1963-1964. The series for in-class use took a tctal time of 1331:10
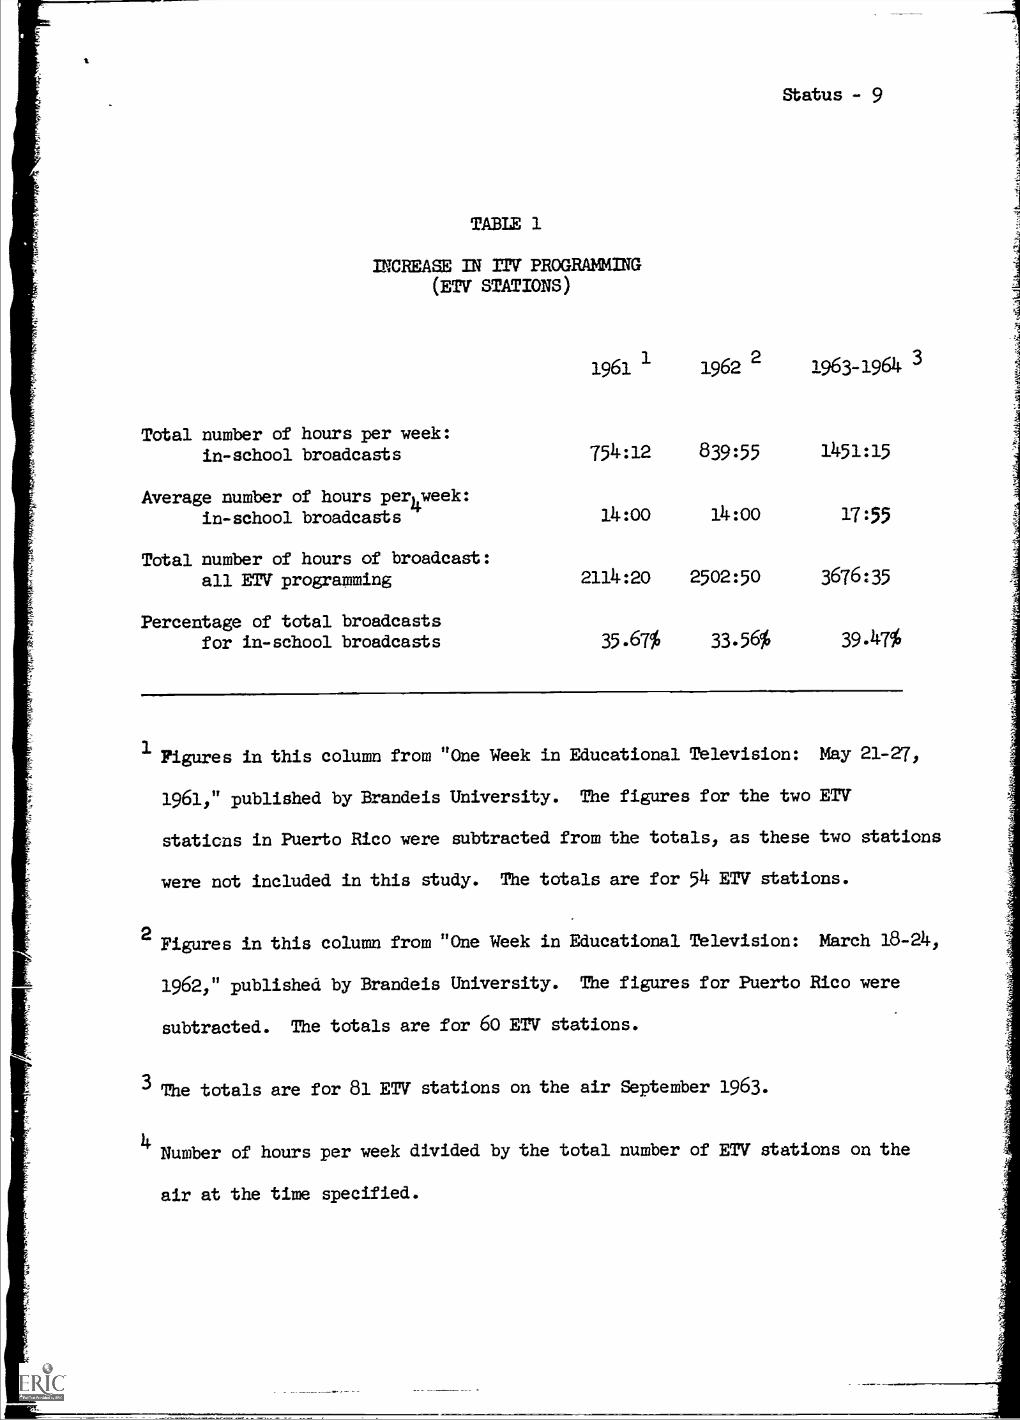
TABLE 1
INCREASE IN ITV PROGRAMMING(ETV STATIONS)
Total number of hours per week:in-school broadcasts
Average number of hours per4week:in-school broadcasts
Total number of hours of broadcast:all ETV programming
Percentage of total broadcastsfor in-school broadcasts
Status - 9
1961 1 1962 2 1963-1964 3
754:12 839:55 1451:15
14:00 14:00 17:55
2114:20 2502:50 3676:35
35.67% 33.56% 39.47%
1 Figures in this column from "One Week in Educational Television: May 21-27,
1961," published by Btrandeis University. The figures for the two ETV
stations in Puerto Rico were subtracted from the totals, as these two stations
were not included in this study. The totals are for 54 ETV stations.
2 Figures in this column from "One Week in Educational Television: March 18-24,
1962," published by Brandeis University. The figures for Puerto Rico were
subtracted. The totals are for 60 ETV stations.
3 The totals are for 81 ETV stations on the air September 1963.
4 Number of hours per week divided by the total number of ETV stations on the
air at the time specified.

Status - 10
hours per week, or 36.21 per cent of the total broadcast time; in-service,
120:05 hours; or 3.26 per cent. The total number of hours per week for
series for in-class use divided by the number of ETV stations offering
courses for K-12 (72 stations) indicates that such stations offered an
average of 18:30 hours per week for in-class use. The figure 17:55 in
Table 1, average number of hours per week for in-school broadcast, includes
in-service education series and was computed by dividing the total number
of hours for in-school broadcasts by the total number of ETV stations,
both those offering series for K-12 and those not offering such courses.
The total number of hours per week for in-service education divided by the
number of ETV stations offering such courses (55), indicates that such
stations offered 2:12 hours per week on the average.
Enrollments
The term "enrollments" refers to the total number of students en-
rolled in classes utilizing TTV courses. This does not refer to the num-
ber of individual students. A single student may have been enrolled in
two or even more classes which utilized television lessons; he would
thereby be counted two or three times.
FIGURE 6
ITV ENROLLMENTS
K-6: 71400,000
I7-12: 2,240,000 1

Status - 11
The total enrollment wai-M40,000 students. Enrollments in the
elementary grades were 77 per cent of the total; in the secondary, 23 per
cent. These percentages parallel the percentages for series offerings,
which were 72 per cent for elementary, 28 per cent for secondary.
!i!r2g:Y_ItERIDMD:M22.Z
The largest number of ITV series had one or two lessons a week, as is
shown in Figure 7. Eighty-two per cent of the series for the elementary
grades had one or two lessons weekly; 62 per cent of the series for
secondary grades had the same weekly lesson frequencies.
WeeklyFrequency
2
Other
FIGURE 7
WEEKLY LESSON FREQUENCY
Number ofCourses
689 229 918
416
r---- 250 1=203 ]
K-6 7-12
516
453
"Other" included a wide variety of frequencies: 3, 4, or 5 times a
week; two lessons one week, one lesson the next; three lessons one week,
two the next; alternate weeks; monthly; or occasionally.

Status - 12
Number of Lessons in Entire Series
The number of lessons in the entire series was dependent upon the
frequency of lessons each week and the length of the series: a full
academic year, a semester, a part of a semester. Series ranged in num-
ber from 2 lessons to 190 lessons.
FIGURE 8
NUMBER OF LESSONS IN ENTIRE SERIES
Number ofNumber of
LessonsSeries
2-9182
10-19 195 61 256
20-29J
100 122
3o-39 1 444 [:=120::=1 564
60-69 [ 290, Lid 332
40-49 [
Other:
50-5970-190
221
K-6 7-12 t
14-31
The largest number of series had 30 to 39 lessons; generally, these
were the courses that had one television /esson a week for the full academic
year. Series with 60-69 lessons, the second largest grouping, were usually

Status - 13
designed to have two lessons a week.
Fifty-four per cent of the elementary series fell within these two
categories, only 30 Der cent of the secondary series. Thirty-seven per
cent of the secondary series had 70 to 199 lessons. The number of lessons
in the series generally was greater in secondary courses where the subject-
matter scope and depth required more televlsion lessons.
Series with lessons often had one lesson a month, or came in the
category of "occasional." In this group were also some of the series from
NET, not originally produced as Try but selected by participating schools
and ETV stations as making a definite academic contribution to local courses
of study.
Series with 10-19 lessons frequently had lessons twice monthly or
alternate weeks.
Length of Lessons
As can be seen in Figure 9, elementary grade lessons were most fre-
quently fifteen or twenty minutes in length; secondary lessons, most
frequently thirty minutes.
Of the 1355 series for the elementary grades; 46 per cent were fifteen
minutes in length, 25 per cent were twenty minutes, 8.5 per cent were twenty-
five minutes, and 20 per cent were thirty minutes.
Of the 532 series for the secondary grades, 7.7 per cent were fifteen
minutes in length, 7.5 per cent were twenty minutes) 16 per cent were
twenty-five minutes) and 60 per cent were thirty minutes.
The "other" lesson lengths were five, ten, twelve, thirty-five, forty,
forty-five, fifty, and fifty-three minutes.

Minutes
15 I
20 1
FIGURE 9
LENGTH OF LESSONS
621
327 Il
25 115
30 271
Other 24-3
K-6
Status - 14
Series
662
367
200
43231
59
7-12 1
61t
In-Service Education
One hundred eighty-six series for direct in-service education for
teachers were offered. All good ITV lessons serve as indirect in-service
education, as the classroom teacher has the opportunity to observe another
teacher at work. These 186 series, however: were designed to serve the
teachers directly. They were broadcast usually during out-of-school hours.
The lessons were usually 30 minutes in length (155 of the 186), Once
a week (132). One hundred thirty-seven series were produced locally.
Forty-nine series were produced elsewhere; in this figure is included the
teacher's lessons accompanying such series as "Parlons Francais."

The series offered were placed in three categories: those primarily
for elementary teachers, those primarily for secondary teachers, and those
for both levels.
The series divided according to grade level and subject content are:
Elementary - foreign languages (63), arithmetic-mathematics (22),
science (11), English-language arts (6), art (4), music (4), social studies (2)0
audio-visual (2), series including a variety of subjects (5).
Secondary - foreign languages (9), economics (8), home economics (4),
nursing (4), drama (4), social studies (2), guidance (1), English MI series
including a variety of subjects (4).
For both grade levels - mathematics (11), English (4), physical educa-
tion (4), foreign language MI series including a variety of subjects (10).
Production Sources
The greatest number of series (1452) were produced locally by the trans-
mitting facilities; 435 were secured from other sources.
Of the series secured from other sources, 409 were secured in recorded
form, as videotape, films, or kinescopes. TWenty-six were picked off the air
for rebroadcast.
The sources of the 409 recorded courses were: "Ptrlons Francais"
(3 series-106 uses), MPATI (16-37), National Educational Television (34-70),
commercial companies (18-26), National Instructional Television Library (4-16),
Great Plains Regional Instructional Television Library (6-16), educational
television stations (li7-75), state departments of education (20-32),
universities and colleges (9-10), professional organizations (3-4), commer-
cial television stations (7-12), and others (5-5).

1 -17-12
K-6
243
719
FIGURE 10
SOURCES OF SERIES
280
101
179 314-1---
26
ETV CCTV
Status - 16
ProducedLocally
Secured fromOther Sources
210
COM
The 26 series picked up from the air cane from 5 ETV stations and were
rebroadcast by 5 ETV stations and 2 closed circuit installations. This
figure does not include the rebroadcast of programs over stations form-
ing a network, as the Georgia network, or stations working cooperatively, as
Seattle and Yakima.
In addition to these 435 series, which were designed for classroom
use, there were 49 series for direct in-service educption secured elsewhere.
This number includes the in-service lessons which are part of an my

Status - 17.
IIpackage," such as the teacher lessons accompanying "Parlons Francais."
Attitude Toward Using Series Produced Elsewhere
The ETV stations and school districts using commercial channels were
asked: "Would you consider using my series produced elsewhere?" The
answer was affirmative for 58 ETV stations and 30 commercial channel users.
There was 1 negative response from an ETV station, and 2 from commercial
channel users. The other ETV and commercial broadcast facilities did not
respond to the question. The question was not raised with CCTV installa-
tions.
The 96 per cent affirmative response was to be expected in the light of
the large and growing number of series used which were not produced locally.
Another question was asked: "Under what conditions would you use 1TV
series produced elsewhere?" The responses were largely one or more of the
following:
1. If the series meets local curricular needs and or is approved by
local committees.
2. If the production is good/superior.
3. If the rental fee is reasonable.
4. If the recordings are of high technical quality.
5. If the television teacher does a superior job.
Another questionnaire was sent to places which have received an ETV
construction permit or are planning to start telecasting within a year or so.
Ten replies were received from those far enough along in their programming
for 1TV for grades K-12 to give data covering the projected sources for pro-
gramming. These ten stations plan to program 42.5 per cent of their time by

Status - 18
means of recorded materials procured from other sources.
Control Over Selection of 1TV Offerings
Table 2 shaws the various educational groups who were responsible for
selection of ITV offerings. Closed circuit offerings were most frequently
determined by one school system. Offerings over ETV stations and commercial
channels were most frequently determined by a group of cooperating school systems.
TABLE 2
EDUCATIONAL GROUPS HAVING CONTROL OVERSELECTION OF 17V OFFERINGS
Installations
Control Ptttern ETV CCTV
I
COM :TOTAL'
One school system
One county system
One school district plus one county system
Cooperation among two or more sdhooldistricts and/or county systeMs
State network .
Other control patterns
14
2
2
25
2
*11
33
2
-
1
1
-
9 1 561
1
- i 4i
- 1 21
1
I
22s
48
1
- 1 31
1
lj. 15
*Variety of groups cooperating with state departments of education (6),
various television councils and associations (4), MPATI membership group (1).
**Cooperation between school systems and state departments of education (2),
television councils (2).
N * 61-ETV, 37-CCTV, 35-COM

Status - 19
ITV Budgets for ETV Stations
Total budgets for 1TV programming mere reported by 47 ETV indtvidual
stations or groups of cooperating stations and MPATI. These are shown in
Table 3. The median budget figure is $1421000.
TABLE 3
TOTAL BUDGETS FCR 1TV PROGRAMMINGOVER ETV STATIONS
$ 1:000 $ 73:910 $1451000 $2101000
31500 75:000 1501000 217:000
5:000 75:000 1501000 220:000
201000 851000 1551000 224:000
20:970 89:000 155:700 2561000
30:303 901000 160l000 3151000
35,000 90l000 160,000 425,000
35,000 loolow 168,566 511,50o
370400 103,000 170,000 575,000
380000 103,514 175,000 650,000
40,496 1121000 200:000 31000:000(MPATI)
57:000 1421172 2001000
One station reported that it had no separate ITV budget. One received
varying sums of money from the state. In three cases: the figures quoted were
for a network arrangement of 2 stations. In one case: the figure quoted was
for a network of 4 stations.

Status - 20
Sources of Income for ITV Programming Over ETV Stations
As can be seen in Table 4, the money for ITV programming over ETV
stations most frequently came directly from the participating school dis-
tricts.
TABLE 11.
SOURCES OF INCOME FOR Try PROGRAMMINGOVER ETV STATIONS
.Participating school district(s)
State appropriations
School districts plus state appropriations
Local ITV councils
School districts plus grants
School districts plus university
State plus ITV association
School districts, state, ETV council, plus gifts
County systems plus some local underwriting
N257
31
7
4
2
2
1
1
1
1
Assessment Formulas for ETV Stations
Many ETV stations or the cooperating school districts have formulated
a system of assessment for the raising of money for ITV programming. The
formulas ranged from 250 per pupil in the school system to $100 "per floor"
plus $2.00 per pupil. The median assessment figure was $1.00 per pupil.

Status - 21
Cost of Programs (ETV)
Table 5 lists the reported estimated costs of 30-minute 1TV programs
produced locally, excluding recording and transmission costs.
TABLE 5
REPORTED ESTIMATED COSTS OF 30-MiNUTE ITV PROGRAMS PRODUCEDLOCALLY, EXCLUDING RECORDING AND TRANSMISSION COSTS (ETV)
Cost Number of Percentage of
Range Stations Reporting Stations in Cost Range
$ o-5o 8
50-100 7loo-150150-2oo 6
200-300 4300-5co 7
(375-1,000-1,500(Various Series 1
500-750 5
1,000 2
1,800 12,307 1
Median = $150 - $200
N = 54
30% - $100 or less
28% - $100 to $200
- $200 to $500
lk% - $500 to $11000
Method of Data Collection
Questionnaires were sent to all educational television stations, to-
gethei: a KevebL eopie6 or t.:urzelit ptogram seueduleb.
Somewhat shorter questionnaires and requests for printed schedules were
sent to closed circuit installations and school districts using comnercial
stations for ITV programming.
This report is based upon the responses to the questionnaires and a
study of the printed program schedules supplied by various transmitting

Status - 22
facilities.
Information was gathered from the 81 ETV stations located in 33 states
and the District of Columbia. The two stations in Puerto Rico were ex-
cluded from the study because of their unique situation and problems. Vine
ETV stations reported no courses for elementary or secondary schools.
Information concerning the 2 channels used by the Midwest Program on
Airborne 1M.evision Instruction is included in the data from educational
television stations. Although MPATI is not a regular ETV station, it
serves the same purpose.
Forty-one closed circuit installations located in 19 states reported
the use of regular series of instructional lessons. Other responses in-
dicated use only for single-room demonstrations or special uses other than
for regular televised instruction; figures from sudh installations were
not included in this report. The 41 closed circuit installations range
from a small unit offering only one course to large installations such as
the one in Hagerstown, Maryland, serving one county, and the one in South
Carolina serving much of the state.
Responses were received from 51 educational units using commercial
television stations for ITV courses. These stations are located in 24
states. Tha educational units range from a single school district using
the commerm, ^hnnne, for its own purpose, to a complex of school districts
cooperating in planning and production. The offerings range from a single
course to a full offering comparable to that of an educational station.
Because some broadcasting facilities did not choose or were unable to
answer certain questions on the questionnaires, all data do not represent

Utatus - 23
100 per cent response. Where the figures do not represent complete re-
sponses, the number (M) at the bottom of the table represents the number
of broadcasting channels involved. This number is usually more than the
total number of responses indicated. This is because networks gave a
single reply for the several channels of the network.

TABLE A
OFFERINGS OF Try SERIES OVER ETV STATIONS, CLOSED CIRCUIT
INSTALLATIONS, AND COMMERCIAL CHANNELS
K-3
4-6
7-9
10-12
1TOTALS
ETV
CCTV
ITO-
COM I TAL
ETVCCTV
ITO-
COM 1TAL
ETV
CCTV
ITO-
COM
I
TAL
ETV
CCTVCOM
TO-
TAL
ETVCCTV
I TO-
COM I TAL
PER-
CENT 1
Science
75
16
16
107
139
26
41
'206
51
16
8 I
75
11.1
74 I
52
306
65
69
44o
23.3
Foreign
14
11
21
208
13
31
252
68
418
2Ii.
o230
28
391
297
15.7
Languages
History-
3.4
Ii.
6I
211.
65
10
20
95
36
89
53
66
313
82
181
25
48 1
254
13.5
Social Studies
English-
54
16
11
81
38
93
50
19
52
1
26
27
10
138
138
11.0
17i
195
10.3
Language Arts
Music
55
18
lo
83
53
19
10
82
81
1lo
61
18
122
39
22
183
9.7
Arithmetic-
11
10
728
50
12
12
74
18
11
130
97
117
88
11.0
21
149
7.
Mathematics
Art
29
12
714.8
52
18
12
82
11
35
Ii.
03
86
31
25
142
7.5
Physical Ed.,
19
s7
31
211.
62
32
50
o5
18
22
22
66
13
11
90
4.8
Health, Safety
News and
10
02
10
70
00
318
12
21
1.1
Public Affairs
Miscellaneous
211.
12
27
14
61
21
87
116
31
15
6 t
52
77
29
101
116
6.1
TOTAL
296
85
70
451
650
120
134
904
159
57
29 '245
207
49
31'287
1312
311
264
1887
99.9

TABLE B
NUMBER OF BROADCASTING FACILITIES OFFERING
SERIES LISTED IR TABLE A
4-6
7-9
10-12
ETVCCTV
i TO-
COM 1 TAL
ETVCCTV
i ITO-
COM TAL
ETV
CCTVCOM
TAL
ETVCCTV
TO-
CO4TAL
Science
45
911
65
62
13
28
103
39
11
757
23
42
129
,
Foreign
10
33
16
67
18
90
67
316
13
04
1
Languages
i
History-
12
35
20
35
611
52
814.1
33
25
40
Social Studies
English-
34
78
1
49
28
63
37
16
14.
222
22
14.
127
Language Arts
Music
31
11
648
32
11
10
53
81
110
61
18
Arithmetic-
10
56
21
30
78
45
16
14.
121
73
111
Mathematics
Art
17
65
28
35
11
10
56
11
35
14.
03
7
Physical Ed.,
13
21
16
52
23
30
03
16
22
20
Health, Safety
News and
10
01
71
210
70017
03
Public Affairs
Miscellaneous
18
12
121
11
61
18
87
1I
16
16
10
6I32
i
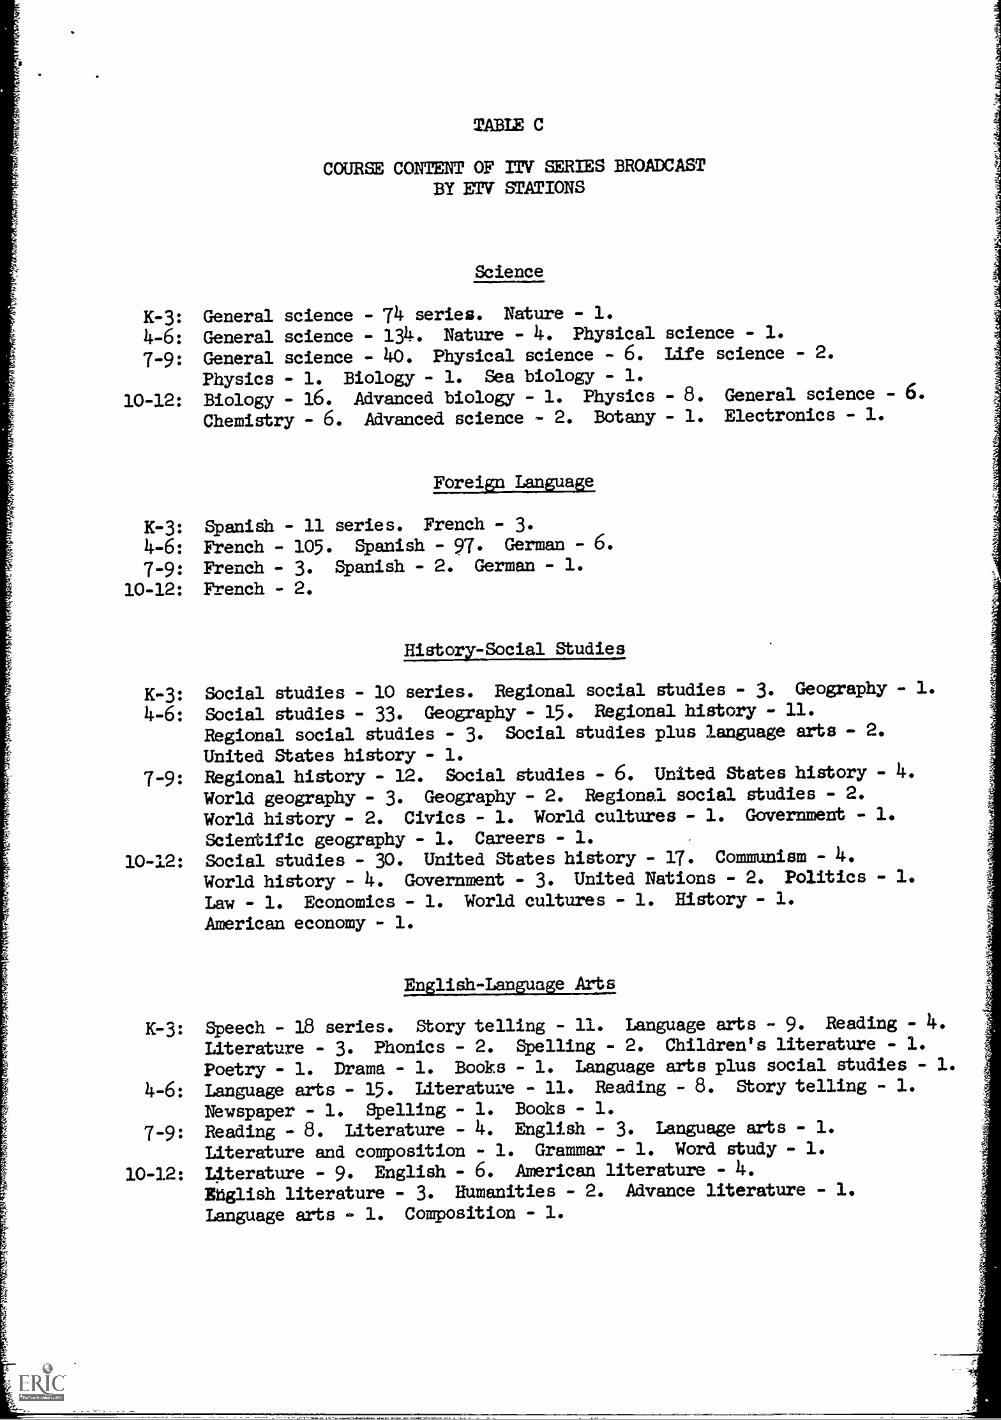
TABLE C
COURSE CONTENr OF ITV SERIES BROADCASTBY ETV STATIONS
Science
K-3: General science - 74 series. Nature - 1.
4-6: General science - 134. Nature - 4. Physical science - 1.
7-9: General science - 40. Physical science - 6. Life science - 2.
Physics - 1. Biology - 1. Sea biology - 1.
10-12: Biology - 16. Advanced biology - 1. Physics - 8. General science - 6.
Chemistry - 6. Advanced science - 2. Botany - 1. Electronics - 1.
Foreip Language
K-3: Spanish - 11 series. French - 3.
4-6: French - 105. Spanish - 97. German - 6.
7-9: French - 3. Spanish - 2. German - 1.
10-12: French - 2.
History-Social Studies
K-3: Social studies - 10 series. Regional social studies - 3. Geography - 1.
4-6: Social studies - 33. Geography - 15. Regional history - 11.
Regional social studies - 3. Social studies plus language arts - 2.
United States history - 1.
7-9: Regional history - 12. Social studies - 6. United States history - 4.
World geography - 3. Geography - 2. Regional social studies - 2.
World history - 2. Civics - 1. World cultures - 1. Government - 1.
Scientific geography - 1. Careers - 1.
10-12: Social studies - 30. United States history - 17. Communism - 4.
World history - 4. Government - 3. United Nations - 2. Politics - 1.
Law - 1. Economics - 1. World cultures - 1. History - 1.
American economy - 1.
English-Language Arts
K-3: Speech - 18 series. Story telling - 11. Language arts - 9. Reading - 4.
Literature - 3. Phonics - 2. Spelling - 2. Children's literature - 1.
Poetry - 1. Drama - 1. Books - 1. Language arts plus social studies - 1.
4-6: Language arts - 15. Literature - 11. Reading - 8. Story telling - 1.
Newspaper - 1. Spelling - 1. Books - 1.
7-9: Reading - 8. Literature - 4. English - 3. Language arts - 1.
Literature and composition - 1. Grammar - 1. Word study - 1.
10-12: Literature - 9. EngliSh - 6. American literature - 4.
Ehglish literature - 3. Humanities - 2. Advance literature - 1.
Language arts - 1. Composition - 1.

TABLE C
Page 2
Music
K-3: Music - 55 series.4-6: MUsic - 41. Music appreciation - 12.
7-9: Music appreciation - 8.
10-12: Instrumental music - 4. Music appreciation -2.
Arithmetic-Mathematics
K-3: Arithmetic - 11 series.4-6: Arithmetic - 33. Mathematics - 11. Accelerated mathematics - 1.
7-9: Mathematics - 14. Algebra - 4.
10-12: Calculus - 2. Calculus and analytical geometry - 2. Algebra - 1.
Advanced algebra - 1. Geometry - 1. Trigonometry - 1. Mathematics - 1.
Art
K-3: Art - 27 series. Crafts - 2.
4-6: Art - 50. Art appreciation - 2.
7-9: Art appreciation - 1.
10-12: Art -
K-3:
7-9:10-12:
K-3:
4-6:
7-9:
10-12:
Physical Education, Health, Safety
Physical education - 9 series. Physical fitness - 6. Dental health -
Mental health - 1. Safety - 1.
Physical education - 16. Safety
Health - 3. Health science - 1.Driver education - 12. PhysicalSafety - 2.
1.Health - 1.- 4. Health - 2. Physical fitness - 2.
Physical education - 1.education -2. Smoking - 2.
Miscellaneous
All subjeats - 16 series. Kindergarten - 7.. Readiness - 1.
Current events - 1Current events - 7. All subjects - 5. Handwriting - 5. Library -
Field trip - 1.Current events - 6. Clubs - 4. Core - 2. Home economics - 1.
Library - 1. Public affairs - 1.
Guidance - 8. Specials - 7. Public affairs - 3: Home economics -
All subjects - 3. Industrial arts - 2. Home making - 2. Typing -
Nutrition - 1. Heritage - 1. Electronics - 1. Year book - 1.
Newspaper - 1.
3.
3.1.

TABLE D
INSTRUCTIONAL PURPOSE OF ITV SERIES
ETV STATIONS
MSTRUCTIONALPURPOSE
GRADE MATOR RE SCURCE SUPPLEMENTARY ENRICRENT
K- 3 44 185 67
4-6 250 315 85
7-9 58 70 31
10-12 58 67 82,
TOTAL 410 637 265
CLOSED C IRCUIT
INSTRUCTIONALPURPOSE
GRADE BASIC ENRICHMENT
K- 3 51 34
4-6 85 35
7-9 53 4
10-12 36 13
TOTAL 225 86
COMMERC IAL
INSTRUCTIONAL- 0441sE
GRADE BASIC ENRICHMENT
K- 3 14 564-6 45 89
7-9 8 2110-12 4 27
TOTAL 71 193

K-34-6
7-910-12
TOTAL
K-34-6
7-910-12
TABLE E
INSTRUCTIONAL PURPOSE OF 'Tv SERIES ACCORDINGTO SUBJECT AREAS - ETV STATIONS
M AJOR
'RESOURCEI
SUPPLE-
--MENTAL
,
ENRICH-MENT
Science
5
21
19
20
6211227
14
8
6
5
7
65 215 26
TOTALS
K-34-6
7-910-12
TOTALS
K-34-6
7-910-12
TOTALS
K-34-6
7-910-12
TOTALS
Foreign Languages
9178
5
30
-
-
4 2 -
2 - -
193 37 o
History-Social Studies
1
1320
16
lo
32
12
19
3
20
431
50 73 58
English-Language Arts
1 228
12
3 14 2
8 8 11
i 16 69
,
1 53_.
Music
25 27 3
16 24 13
- - 8
- 4 2
4155 1
26
MAJOR SUPPLE- [ ENRICH-RESOURCE MEBTAL MENT
Arithmetic-Mathematics
11
5 44 1
11 78 1
24
Art
23 6
n 31 10
1
4
u_ 58 17
Physical Ed., Health, Safety
15 4
3 14 7
1 41 13 4
5 46 15
News and Public Affairs
- - 1
- - 7- 7
- - 3
o o 18
Miscellaneous
9 14
4 0/- 4 4
3 5 23
22 50
GRADES
K-34-6
7-910-12
TOTAL
K-34-6
7-910-12
TOTAL
K-34-6
7-910-12
TOTAL
K-34-6
7-910-12
TOTAL
1
2
3
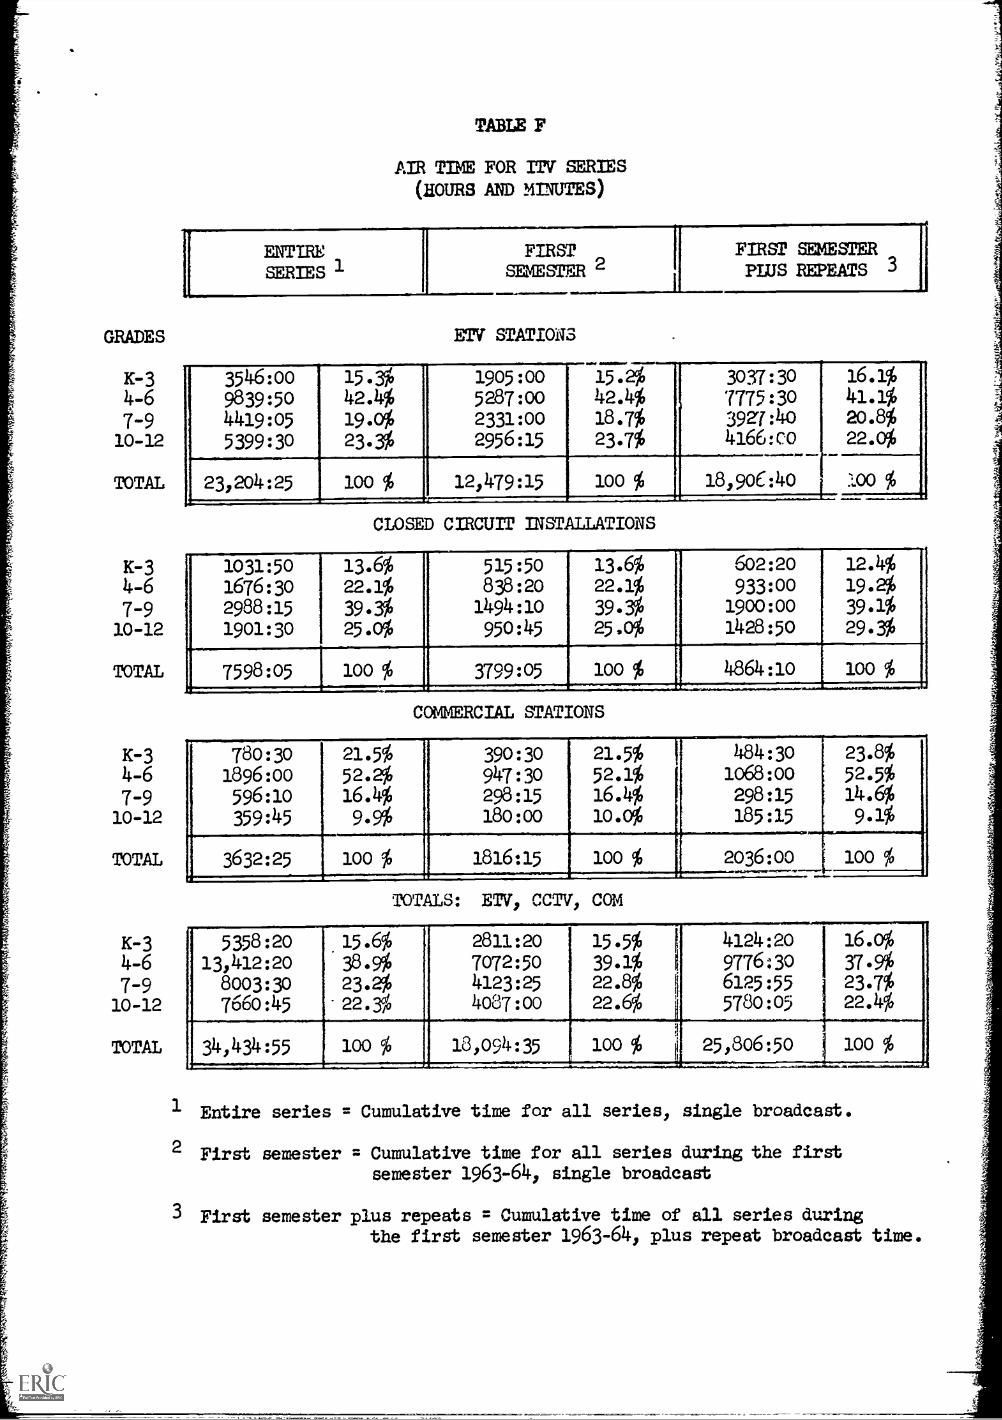
TABLE F
PIR TIME FOR ITV SERIES
(HOURS AND MLNUTES)
ENTIRE FIRST FIRST SEMESTER
SERIES 1 SEMESTER 2 PLUS RMATS 3
ETV STATIONS
3546:00 15.3% 1905:00 15.2% 3037:30 16.1%
9839:50 42.4% 5287:00 42.4% 7775:30 41.1%
4419:05 19.0% 2331:00 18.7% 3927:40 20.8%
5399:30 23.3% 2956:15 23.7% 4166:C0 22.0%
23,204:25 100 % 12 479:15 100 % 18 90C:40 100 %
CLOSED CIRCUIT INSTALLATIONS
1031:501676:302988:15
1901:30
13.6%22.1%
39.3%25.0%
,,,.,,,,,,
515:50838:201494:10950:45
13.6%22.1%39.3%25.0%
602:20933:001900:001428:50
,
12.4%19.2%39.1%
29.3%
7598:05
,
100 % 3799:05 100 % I 4864:10 100 %i
COMMERCIAL STATIONS
780:30 21.5% 390:30 21.5% 484:30 23.8%
1896:00 52.2% 947:30 52.1% 1068:00 52.5%
596:10 16.4% 298:15 16.4% 298:15 14.6%
359:45 9.9% 180:00 10.0% 185:15 9.1%
,
I 3632:25 100 % I 1816:15 100 %J
2036:00 100 %.._.........,....
TOTALS: ETV, CCTV, COM
5358:2013,412:208003:307660:45
15.6%38.9%23.2%22.3%
2811:207072:504123:254087:00
15.5%39.1%22.8%22
4124:20 16.0%
9776:30 37.9%6125:55 23.7%
5780:05 22.4%
34,434:55 100 % 13,094:35 100 %ji
25 806:50------
100 %
Entire series
First semester
First semester
= Cumulative time for all series, single broadcast.
= Cumulative time for all series during the firstsemester 1963-64, single broadcast
plus repeats = Cumulative time of all series duringthe first semester 1963-64, plus repeat broadcast time.

K-34-6
7-910-12
TOTALS
K-34-6
7-910-12
TOTALS
K-34-6
7-910-12
TOTALS
K-34-6
7-910-12
TOTALS
K-34-6
7-910-12
TOTALS
TABLE G
AIR TIME (HOURS AND MINUTES) FOR rrv SERIES
ACCORDING TO SUBJECT AREAS - ETV STATIONS
FIRST
ENTIRE FIRST SEMESTER4.
SERIES 1 SEMESTER 2 REPEATS 3
Science
1 609:552235:201507:30
1373:55
343:051194:20790:00762:50
621:351740:45
1
1367:501086:50
5726:40,
3090:15 4817:00
Foreign languages
234:403603:15213:10160:00
117:151886:15
1
115:0580:00
151:452775:20154:3580:00
4211:05 2198:35 3161:40
History-Social Studies
I 108:101013:251319:201405:20
82:55
559:15694:20758:55
122:25859:151213:201164:25
3846:15 2095:25 3359:25
English-Language Arts
549:59 316:25 586:45
503:15 275:50 409:45
208:55 127:35 268:50
706:40 388:10 543:35
1968:49 1108:00 1808:55
Music
787:55 404:35 669:10
728:20 397:25 587:15
36:00 28:00 50:00
80:00 46:00 58:00
1632:15 876:00 1364:25
FIRST
ENTIRE FIRST SENEMER4SERIES 1 SEMESTER 2 REPEATS 3
Arithmetic-Mathematics
108:15 63:00 122:45
648:50 385:25 555:20
787:40 394:35 504:35
443:30 240:30 240:30
19P8:15 1083:30 1423:10
Art
230:25 118:05 155:05
597:00 311:45 466:10
4:00 4:00 28:00
64:00 32:00 64:00
895:25 465:50 713:15
Physical Ed., Health, Safety
116:45190:35107:30203:25
5815106:5053:45146:15
65:45134:30175:00250:30
618:15 365:05
_625:45
news and Public Affairs
7:30 3:45 3:45
66:20 33:30 63:45
111:00 59:10 78:30
55:00 27:30 42:30
239:50 123:55 188:30
Miscellaneous
,
792:25 397:45 538:30
253:30 136:30 183:30
124:00 64:30 87:00
907:40 474:05 635:40
2077:35 1072: 0 1444:40
1 Entire series = Cumulative time for all series, single broadcast
2 First semester = Cumulative time for all series during the first
semester 1963-64 only, single broadcast time
3 First semester plus repeats = Cumulative time for all series during the
first semester 1963-64 only, plus repeat broadcast time

TABLE H
REPEATS OF LESSONS IN ITV SERIE S
ETV STATIONS
iUMBER OFEATS
GRADES 0 1 2 3 h. 5 6 7 8 9 an 11
K-3 159 79 115 10 2 0 1 0 0 04-6 378 201 47 11 7 4- 1 1 0 o7-9 76 43 11 7 8 5 6 2 0 1
10-12 119 44 16 11 9 5 1 o 2 0,
TOTAL 732 367 119 39 1 26 14 9 I 3 2 1f , S
CLO SED C IRCUIT
NUMBER OF'EPEATS
1
GRADES 0 1 2 3 14. 5 6 7 8 9 an 11
K- 3 78 5 1 1 o o o o4-6 112 7 1 o o o o o
7-9 4-4 7 4 1 o 1 0 , 010-12 33 5 2 2 2 3 1 1
TOTAL 267 24. 8 14. 2 4. 1 1
COMMERC OL
NUMBER OFEKES
GRADES 0 1 2 1 3 14. 5 6 7 8 9 10 11
K- 34-67-9 .
in- 12
591212924.
2706
95o1
o1o0
. 14.
TOTAL 233 15 15 1.
........_-
TOTALS : ETV, CCTV, COM
NUMBER OFEATS
GRADES 0 1 2 3 14. 5 67 8 9 10 11
K- 3 296 86 55 11 2 0 1 0 0 0 04.-6 611 215 53 11 8 4 1 1 0 0 0
7-9 149 5o 15 8 8 6 6.2 0 o 110-12 176 55 19 13 11 3 2 0 2 1 0
TOTAL 1232 406 14.2 43 29 i.3 10 3 2 1 1
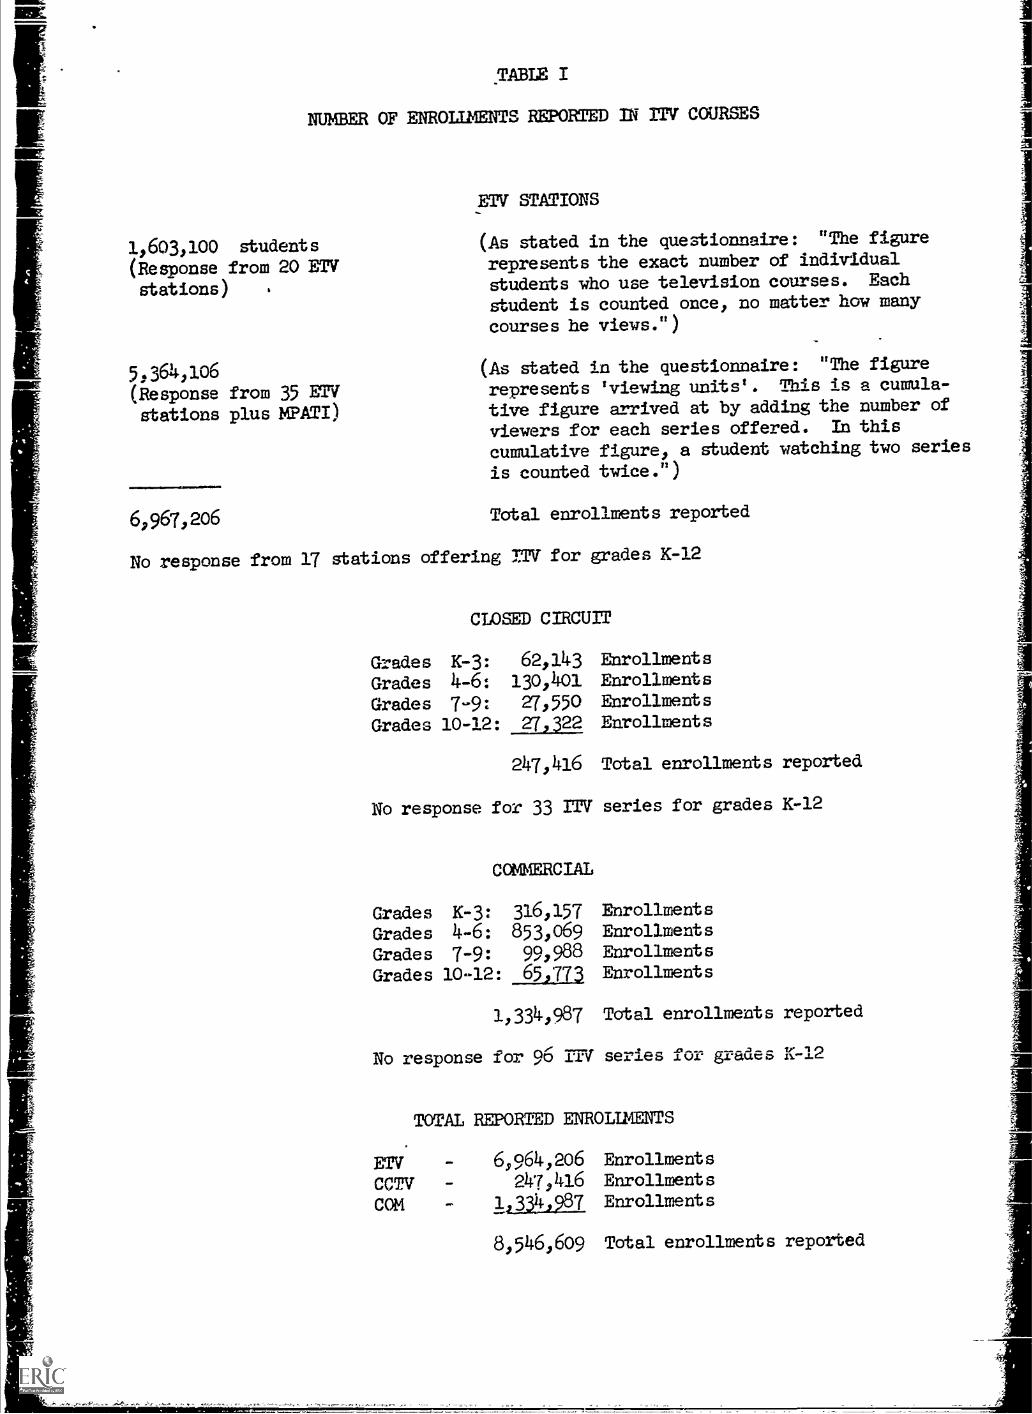
_TABLE I
NUMBER OF ENROIIMENTS REPORTED IN ITV COURSES
1,603,100 students(Response from 20 ETV
stations) .
5,364,106(Response from 35 ETVstations plus MPATI)
62967,206
ETV STATIONS
(As stated in the questionnaire: "The figure
represents the exact number of individualstudents who use television courses. Each
student is counted once, no matter how manY
courses he views.")
(As stated in the questionnaire: "The figure
represents 'viewing units'. This is a cumula-
tive figure arrived at by adding the number of
viewers for each series offered. In this
cumulative figure, a student matching two series
is counted twice.")
Total enrollments reported
No response from 17 stations offering ITV for grades K-I2
CLOSED CIRCUIT
Grades K-3: 62,143 Enrollments
Grades 4-6: 130,401 Frtrollments
Grades 7-9: 27,550 Erollments
Grades 10-12: 27422 Enrollments
247,416 Total enrollments reported
NO response for 33 ITV series for grades K-12
COMMERCIAL
Grades K-3: 316,157
Grades 46: 853,069Grades 7-9: 99,988
Grades 10-12: 651773
1,334,987
EnrollmentsEnrollmentsEnrollmentsEnrollments
Total enrollments reported
No response for 96 ITV series for grades K-12
TOTAL RF20RTED ENROLLMENTS
ETVCCTVCOM
6,964,206247,416
1,5114,A!L
8,546,609
EnrollmentsEnrollmentsEnrollments
Total enrollments reported

TABLE I
Page 2
TOTAL: REPORTED AND ESTIMATED ENROLLMENTS IN IN CCJR0gS
ETV: enrollments reported 6,967,206
ETV: estimated enrollments for 17 stations not reporting 1,000,000
Closed circuit: enrollments reported 247,416
Closed circuit: estimated enrollments for 23 series not reported 3,300
Commercial: enrollments reported 1,334,987
Commercial: estimated enrollments for 96 series not reported 362000e__
Total enrollments: reported and estimated 9,648,909
ESTIMATED DIVISION OF TOTAL RNROLIMENTS ACCORDING TO GRADES
GRADES ETV CCTV COM TOTALS
K-3 2,000,000 63,000 330,000 21393,000
4-6 4l000l000 131,000 885l000 510160oo
7-0 800,000 28;000 110;000 938;000 I
10-12 1,200,000 28,000 75,000 1,303,000 I
TOTAL 8,000,000 250,000 11400,000 9,650l000
FIGURES USED IN ARRIVING AT ESTIMATE OF ENROLLMENTS NOTREPORTED BY ETV STATIONS
17 ETV stations not reporting: estimated population in A-Bviewing area, according to survey made by National EducationalTlevision and Radio Center, March 1963 14,624,000
Estimated school population in these areas, figuring theschool population as 1 in 4 31656;500
Reported potential in-school population (K-12) in A-Bviewing areas of 55 ETV stations reporting enrollments andMPATI 24;452,620
ETV enrollments reported for 64 ETV stations and MPATI 6,967,206
Estimated lTV enrollments for 17 stations not reporting 1,000,000

TABLE
WEEKLY LESSON FREQUENCY OF ITT( SERIES
FREQUENCY
GRADE 1 3 4 5
*
1-2
1 f
MONff
OCC**
2-3.
***
ALT
ETV STATIONS
K-34-6
7-90I
10-12
16628570101
6225734
36
4
32
16
23
4
25
I 1314
10
91725
o2o1
0062
23220
3
10
92o
15
912
[TOTAL 622 389 1 77 56 61 8 48 21
CLOMD CIRCUIT
K-34-6
4656
25
37
6
9
o1
1
3
6
5
1
6o
3
7-9 9 15 11 8 11 0 o 3
10-121
8 6 6 3 13 0 0 13
1 TOTAL 119 83 32 12 28 11 7 19
COMMERCIAL
K-3 50 9 1 0 2 8 o
4-6 86 26 7 1 7 5 2
7-9 20 3 0 5 0 o
10-12 21 6 o 2 1 0
TOTAL 177 44 lo 1 16 14 2
TOTAL : ETV, CCTV, CCM
K-34-6
262427
96
320
1348
427
1319
02
00
37
32
1117
15
12
7-9 99 52 28 21 33 0 6 0 2 4
10-12 130 48 30 17 40 1 2 4 0 15
TOTAL 918 516 119 69 105 3 8 73 30 46
* One lesson-first week, two lessons second week
** Two lessons first week, three lessons second week
*** Alternate weeksOnce a month
44 Occasionally

K-34-6
7-910-12
TOTALS
K-34-6
7-910-12
TOTALS
K-34-6
7-910-12
TOTALS
K-34-6
7-910-12
TOTALS
K-34-6
7-910-12
TOTALS
TABLE
WEEKLY LESSON FREQUENCY OF ITY SERIES ACCORDINGTO SUBJECT AREAS - ETV STATIONS
1 2 3*ALT
*MON
*1-2
* i *2-3 OCC
Science
466823
11
50
10
2
5
-
4-
-
6
1410-
1
-
-
-
2-
-
-
3
3
3
1
10 6 17 - 4 2 - 1 1 -
147 77 24 7 10 26 1 3 4
Foreign Languages
3 8 1 228 141 26 8 4- 4 1 l
- 2
31 153 27 11 7
History-Social Studies
11 2 1 -
37 17 8 1
13 3 7 6 639 11 7 7
100 33 10 22 EEnglish-Language Arts
4025
9
7
10 7 1
10 8
853152832 2
Music
20 27 3 3
31 19 - 3
7 1
6 -
64 46 3 7 2
Ll 1 2 3 4 5 ALT MON 1-2 2-3 OCC
Arithnetic Mathematics
631
213
-
-
-
4-
-
2-
-
-
1
23 4 3 3 2 -
1 2 - 3 3 - - -
41 21 3 10 6 2 2 3
Art
18
34
1
4
57
Physical Ed., Health, Safety
9_1 _ 4
15 - 1 2.3-
2 3 - -
13 2 1 2 - - - ...
39 1 5 1 3 2 9 3 4r
News and Public Affairs
1 !EP
72
2 1
14 3 1
Miscellaneous
12 2 1 1 -
9 2 - - 1 1
7 1 _ _ -
16 6 2 1 4 1 - 1
44ii 3 1 13 2 1 2_
ALT = Alternate weeksMON = Once a month1-2 le One lesson first week, two lessons second week2-3 = Two lessons first week, three lessons second weekOCC = Occasionally

2-9
10-19
2o-29
30-39
4o-49
50-59
6o-69
7o-79
8o-89
90-99
loo-109
110-119
120-129
130-139
140-149
-150-159
160-169
170-179
-;180-189
.190-199
More
NoResponse
TABLE L
NUMBER OF LESSONS IN ENTIRE LENGTHS OF ITV SERIES
ETV STMONS
3k,----4----.4._7-
6 9
I
10-1 TO-11
12 1 TAL
32 44 i 13 45 i 1341- --t --
65 7o ; 20 18 1 173
33 39 6 lo 1t
83_
89 86 < 4o 48 : 363i 1
9 1 2 4 1 18
1 1
1 12 1 5 1 18! 1 1
39 02 I 21 16 1 278 Ii -1, 1
18 37 ; 9 7 ; 711
1 1- 5 4 1 101
2 19 i 7 3 1 31I
7 3 10 1 22 it 1
1 2 1 41
1
1 11_
7 7 1 26---t---
1 1 1 1 31----
3 8 6 : 171
5 4 7 1 18
6 1 8 9 : 241
1 3 2 I 7- -4
1
2 2 i 4
1
. _1
_
3 r 3
1
1
1
i
CLOSED CIRCUIT COMERCIAL TOTALS
8 :14____f____
11 i 13)
4 1
33 36
_
10 15
9 3_6
2 3
1
1 3
1 6
1
1-
7 1
20 16 8
510133 67 10
1
10-,T0- K 4- 7 10-1 TO-I
12 fTAL 3 6 9 12 TAL1
I
12 1 20 ho 65 16 61 I 182
1
0 1 50 96 99 30 31 i 256f
1
1 16 42 58 6 14 1 122
1
8 1118 i55 89 56 64 1 564-
1
_-I
1 2 3112 5121I
1 1 3 1 14
I , ,. I
26 56 34 26 10 i 332I_
v. - -1 -

2-9
3.0-19
20-29
30-39
4o-49
50-59
6o-69
7o-79
8o-89
9o-99
00-109
10-119
20-129
30-139
40-149
50-159
60-169
7o-179
8o-189
9o-199
re
TABLE M
NUMBER OF LESSONS IN ENTIRE LENGTHS OF ITV SERIESACCORDING TO SUBJECT AREAS - ETV STATIONS
Science
K
146
79
1 o To-12 iTAL
67.429
8
24
8
22
3
:
4
,tb
2 1 19
2 ji 57_
21
1
12 90
2
8
10
2
3
..1.
8 I, 8
4 1 7
1 6o--i------,
2 1 12---r--1
1 I 4
2 1"-
1
3
8 9
1.1__
_
3i 4--1---
1 4
1
---f---
3
ForeignLanguages
K3
4--
6 9
1
0-t TO-2 1 TAL
1
1
7
1
1,
,-,
1.!
32
4
P
5
3
29
4
1
91
lo
15
1
'5
1
1
1
19... . _ __
:1141--
19T
1 11-------1
I 16 1---1
I 7 I
---11
1 2
i
1 9
1
1
1 it
i 1i
t2 3 ;1
_
_
.
1
1
1 3.
1
1 2--1------
1
----1 ---I
1
a
History- English-Social Studies Language Arts
Blig1C-I.
i6
TO-12 ' TAL
19 7
I
7 II 4o
73 1
III6
-4
" I 33
1
20
7
3
1
L
I16 1
3.
1
i
1
2 1--12 1
2 1-1
35 8
1 1 1
li-1 1
-t---;
2 I
r_
1i
i_
2 5
1
1
4 ) 11
3 1 4
4
4
1 2
2
fI
1
i
2 1
1
1 1 111
-I-
i
1
K-3
4-1 7-6 9
o-I TO-12 1TAL
1
4
12
8 i 2_,
1-5
1
.6,_ 171
5 1 27
3 31
2 20
181
1 1 39_r_
1 21
7 7
1
1
1 1 1
14 18
1
1 1
1
i
1 1, 1
I 2
r
1
. i
1
I
1
,--1
1 1
i1_1_
1
1
1 1 2
1--
4 1 5--1
1
11
-I-
1
i1
i1
Music
K-3
46
7-109
TO-12 TAL
5
21
! 5
1
5
6
2
1
16
1
2 11
82 1
10
11 23 38
11
1
1
1 ii14 11
1
25
1
11 7 1 181
1 .
-I-I
I
i
i
1
_1
I1
1
1
.1
i
11-1
----I--1
1. ,
1
1 -
--t
1
---f1.
t1

2-9
3.0-19
2o-29
3o-39
=40-49
50-59
-60-69
7o-79
8o-89
9o-99
00-109
10-119
20-129
3o-139
50-159
'60-169
7o-179
80-189
9o-199
ore
Arithmetic-Mathemat ics
K-3
4-'7-a0-i6 9
TO-12 1 TAL
1 5 1 1 71
4 4 1 81
lo I 10--I-_
4 17 3 I 24
1
1
I I
11 4 1 I 161._, ____
2 2 3 1 7
!2
I
_ . 1
-7-----'
_ _1 11
iII. 2 4 1 71 _
I
i
I
i___2
1
1 11
2 1 1 3i
I
1 ,1
1
1
1
1
Art
K3
46 9
0-1 TO-2 1 TAL
10 10 1 211 - .
1!
6I__ _I
1
16 30 4 I 504
1 I 1
1
--t1 5
I- -1--
1 1
I --I-2 1
1
t" ---Ti----
i
1
. --4 - 4----
1
i
I1
I
-1- 7i
1
- 4- --- --I
---ti
e
I
I. t--
I
I
I
1
I
Physical Ed.,Health, Safety Public Affairs Miscellaneous
News and
TABLE M
Page 2
K
346
79
10-1 TO-12 i TAL
I 4 i 15i
1 i 17I
I
1 6
7 2 6211
1 1
II-2 1. 2
IiI 11_ --Ii
1
1-
1
1
1
rI 1
-41
1
1
1
1
2
1
1_ _
1
1
1
1
_ --1 --1
1 _
a
1
K3
46
79
i 0 TO-12 ITAL
I
1
I
1 2 1
i3
1 6 a. 2 ' 101--
1
-+-1
1----2 1 1 3r-
1
---4----1
-1----1
I
I
I
I
I
I
---I--- -I
I_
I
I
I
1
___A. tI
- - iI
I
I
;
-II
I
i
K
34-6
79121TAL
2
2
1 1
6 1 8
11 5
2 4
7 8 6 5 26
2 1 8 14
2 3
1 1
2
-T---11 1
2 a I 3 :
5 I 5 ,
-4----
I
3,1

TABLE N
LENGTHS OF INDIVIDUAL LESSONS
ETV STATIONS
MINUTESGRADE
10-
12 15 20 25 3035-40
K-3 1 174 83 8 30 o4-6 9 282 138 71 150 o7-9 1 13 18 31 94 210-12 0 11 6 32 155
_.3
TOTAL 11 480 245 142 429 5
CLOSED CIRCUIT INSTALLATION
MINUTESGRADE
5-12 15 20 25 30
35-
53
K-3 5 37 34 9 o o4-6 4 29 50 18 17 27-9 3 1 5 11 16 2110-12 o 3 5 8 20 13
TOTAL 12 70 94 46 53 36
COMERCIAL STAT ONS
MINUTESGRADE 15 20 25 30
K-3 43 7 o 204-6 56 15 9 547-9 7 5 2 1510-12 6 1 1 23
TOTAL 112 28 12 112
TOTALS: ETV, CCTV, COM
MINUTES 5- 35-GRADE 12 15 20 25 30 53
K-3 6 254 124 17 50 o4-6 i 13 367 203 98 221 2
7-9 4 21 28 44 125 2310-12 0 20 12 41 198 16
TOTAL 23 662 367 200 594 41..

TABLE 0
LENGTHS OF INDIVIDUAL LESSONS IN Iry SERIESACCORDING TO SUBJECT AREAS - ETV STATIONS
MINUTESGRADE
10-
12 15 20 25 3035-40
K-34-6
7-910-12
TOTALS
K-34-6
7-910-12
TOTALS'
K-34-6
7-910-12
TOTALS
K-34-6
7-910-12
TOTALS
K-34-6
7-910-12
TOTALS
Science
4219
25
48
2
23
6
49
2 1 13 34 1
3 35 3
74 41 124 4
Foreign Languages
14
5 163 14 1 25
2 1 32
5 179 15 1 30
History-Social Studies
7 724 18 11 12
2 7 10 17
4 1 13 48
37 33 34 77
English-Language Arts
11
36
12
15
11
2
5 9 I
3 5 4 72 10 15
-
33 21 31
Music
ii4 ij 16 I
8
6
51 25 9 37
10-
12.
15 20 25 30 35
Arithmetic-Mathematics,
, 5 31 3
15 16 6 13
1 3 14
9
20 20 9 39
Art
14 10 3 2
15 10 11 161
4
29 203 14 23
Physical Ed., Health, Safety
11 4 43 12 6 2 1
1 k 41 2 15,
3 25 10 4 24,
News and Public Affairs
(
I 31 3 11 1 2 2 2
1 2
1
1
6 5 2 4I .
Miscellaneous
10 6 82 3 91
1 1 1 4 1
6 3 3 19
19 10 7 40 1

TABLE P
IN-SERVICE EDUCATION
SERIES OFFERINGS
GRADECONCERNED
SERIES OFFERINGS
ETV CCTV COM TOTAL
K-37-12
Many Grades
TOTAL
107
36
24
1
5
111
1
117
3730
167 6 13 186
LMNGTH OF LESSONS
NUMBER OF FACILITIESOnehRING MESE SERIES
ETV CCTV COM TOTAL
36
17
6 1
1
5
7
a.
1
4318
1 12
1
10 minutes - 2 25 minutes - 12
15 minutes - II- 30 minutes - 155
20 minutes - 9 45 minutes 3
60 minutes - 1
FREQUENCY OF LESSONS
Once a week - 132Twice a week - 8Three times a week - 3Four times a week - 3
No repeats - 159
REPEATS
SOURCES OF SERIES
Produced locally - 137
NUMBER OF LESSONS IN SERIES
Five times a week - 6Alternate weeks - 12Once a month - 17Occasionally - 5
One repeat - 21Two repeats - 6
Secured elsewhere - 49
1-910-1920-293o-39
4o-49
- 4o
- 43- 14
73- 1
6o-69 - 4
9o-99 - 2
120-129 - 1
160-169 - 5
Unspecified - 3
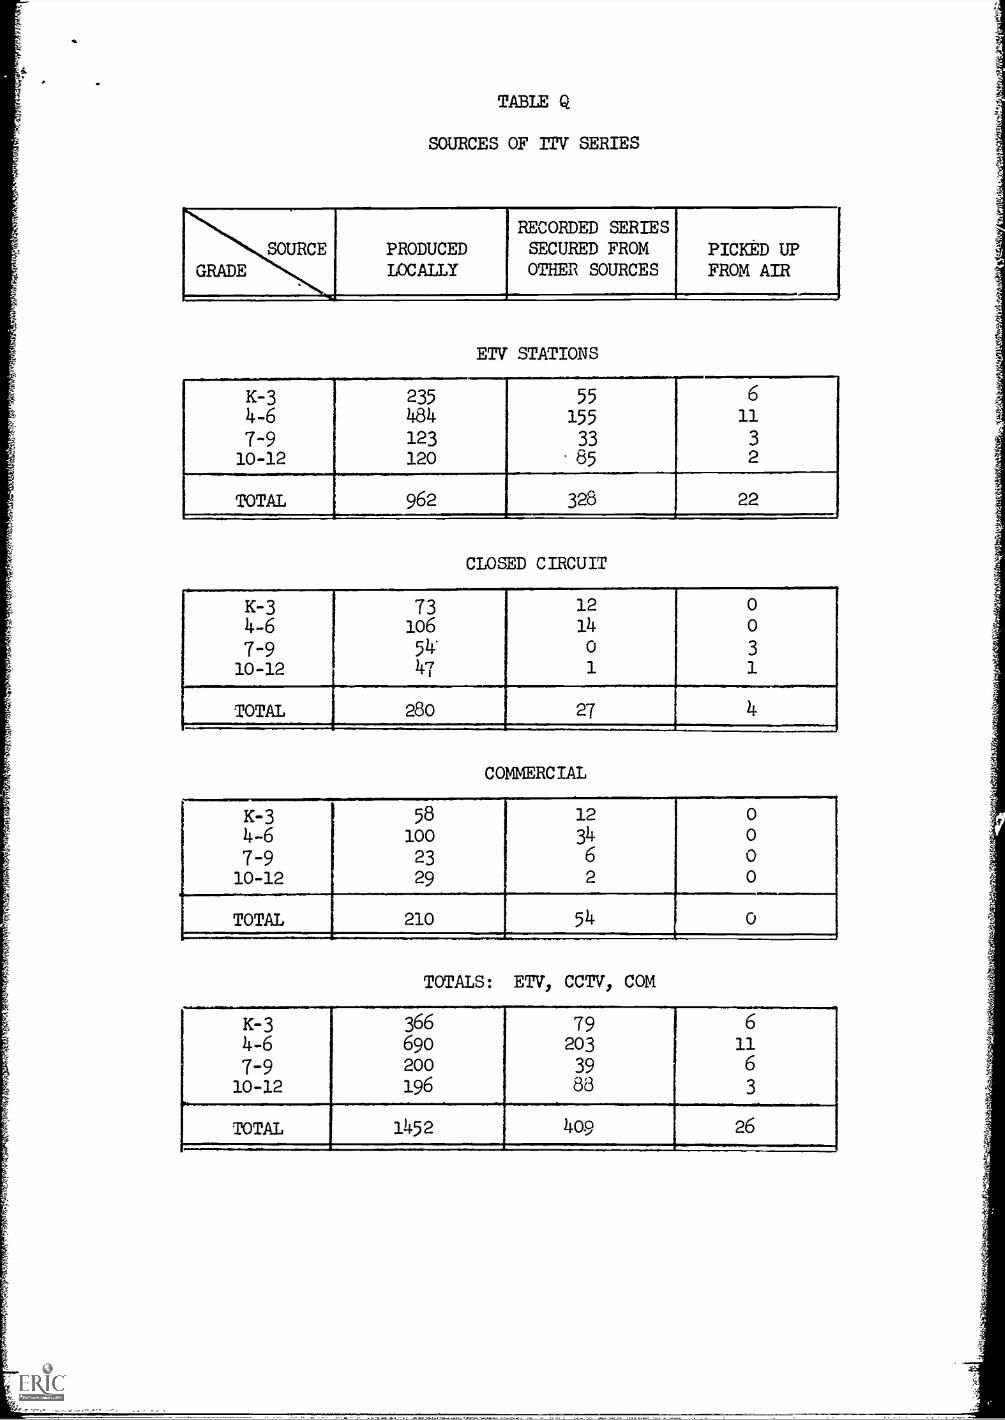
TABLE Q
SOURCES OF rrir SERIES
RECORDED SERIESSOURCE PRODUCED SECURED FROM PICKED UP
GRADE LOCALLY OTHER SOURCES FROM AIR
ETV STATIONS
K-3 235 55 6
4-6 484 155 11
7-9 123 33 310-12 120 85 2
TOTAL 962 323 22
CLOSED CIRCUIT
K-34-6
73106
12
14
o
o
7-9 54* 0 3
10-12 47 1 1
TOTAL 280 27 4
COMMERCIAL
K-3 58 12 0
4-6 100 34 o
7-9 23 6 0
10-12 29 2 0
TOTAL 210 54 0
TOTALS: ETV, CCTV, COM
K-3 366 79 6
4-6 690 203 11
7-9 200 39 6
10-12 196,
88 3
TOTAL 1452 409 26. ,

TABLE Q
Page 2
SOURCES OF 409 RECORDED SERIES
SOURCE
NUMBER OFDIFFERENTSERIES
USESBY ETV
USESBY CCTV
USESBY COM
NETRC 34 65 1 4
MPATI 16 33 2 2
NITL 4 12 - 4
GPRITL 6 6 2 8
16 ETV stations 47 62 7 6
3 State Departments of Education 20 16 7 9
5 colleges and universities 9 2 1 7
9 commercial companies 21 115 7 lo
4 commercial channels 7 12 - -
8 other sources 8 5 - 4
TOTALS 172 328 27 54

TABIER
ATTITUDE TOWARD USE OF RECORDED MATERIAL PRODUGED ELSEWHERE(ETV STATIONS AN) CCMMERCIAL CHANNELS)
RESPONSE TO QOESTION: "Would you consider using ITV series produced elsewhere?"
YES
NO
ETV COM
58
1
30
2
* * * * * * * * * * *
RESPONSE TO QUESTION: "Under what conditions?"
IIf course meets local curricular needsIf the production is good/superiorIf the rental fee is reasonableIf course is approved by local committees, etc.If the recordings are of high technical qualityIf the television teacher does a superior jobIf the series cannot be produced locallyIf the series is better than can be produced locallyIf the sequence of lessons is flexibleIf preview materials are availableIf accompanied by study guides, etc.If the coqrse is in accord with state policyIf it meets GPRITL standardsIf it meets MPATI standardsIf all clearances have been madeIf the lessons are no longer than 20 minutesIf there are no local referencesIf a tape machine were availableIf shipping costs were the only rtharge
ReluctantlyUncertain
TOTAL
88
3
ETV COM 1TOTAL
29 22 5121 5 i 26
13 7 20
9 0
5 55 53 1 32 2
1 2
2 2
2 2
1 1 I 2
1 1 2
1 1
1 i 1
1 1
1
1 1
1 1
1 1
1 1

TABLES
ASSESSENT FORMULAS - ETV STATIONS
250 per pupil in system250 A.D.A.500500 A.D.A.500 per pupil in system (2)
75O A.D.A./$1.50 A.D.A. for metropolitan schools750 per pupil plus $1.00 per teacher750 per elementary pupil and special assessment for secondary programs800 per pupil enrolled/$5,500 maximum$1.00 (3)$1.00 per pupil (2)$1.00 per pupil enrolled$1.00 per pupil enrolled or $4.00 per pupil in television classes$1.00 A.D.A.$1.00 A.D.M.$1.02 A.D.A.$1.00-$2.00$1.25 A.D.A. for larger counties; flat fee for smaller$1.50$1.50 per pupil (K-12)$2.00 per pupil$1.00 for K-3, $3.00 for 4-12 or 5o0-750 for entire enrollment in county system$3.89, approximate cost per pupil, paid by school district (station owned and
operated by one district)$100.00 "per floor" plus $2.00 per pupil/$2.00 per pupil for smaller schoolsNumber participating pupils times course cost per pupil?
N = 53
No assessment formula becr.ise other ways of securing money, etc. - 14