
Information Asymmetry, Signaling, and Share...
48
1 Information Asymmetry, Signaling, and Share Repurchase Jin Wang Lewis D. Johnson School of Business Queen‟s University Kingston, ON K7L 3N6 Canada Email: [email protected] [email protected] February 2008 We acknowledge helpful comments from participants at the presentation of an earlier version of this paper at the 2006 European FMA Conference in Stockholm, Sweden.
Transcript of Information Asymmetry, Signaling, and Share...

1
Information Asymmetry, Signaling, and Share Repurchase
Jin Wang
Lewis D. Johnson
School of Business
Queen‟s University
Kingston, ON K7L 3N6
Canada
Email: [email protected]
February 2008
We acknowledge helpful comments from participants at the presentation of an earlier version of this
paper at the 2006 European FMA Conference in Stockholm, Sweden.
2
We examine whether share repurchase announcements or actual share repurchases
provide reliable signals to convey information to investors. We find that increases in
operating performance and decreases in systematic risk are correlated with actual
repurchase amounts but are not correlated with repurchase announcements. Further, we
find that long-run abnormal stock returns are correlated with actual repurchase amounts
but not with repurchase announcements. The paper has important implications for
research on stock repurchases, since most literature to date has focused on the
announced repurchase magnitude, which may lead to misleading results.
Keywords: Share repurchase, operating performance, signaling
JEL Classification: G35

3
Information Asymmetry, Signaling, and Share Repurchase
Repurchasing of shares has represented a growing proportion of total U.S. corporate
payouts in recent years. The ratio of expenditure on the purchase of common and
preferred stocks to market value has risen from 0.19% in 1972 to 1.36% in 2000, whereas
the ratio of total dividends declared on common stocks to market value has decreased
from 2.19% to 1.2% over the same period (Grullon and Michaely, 2002). Moreover, both
Fama and French (2001) and Grullon and Michaely (2002) show that the number of firms
that repurchase has increased dramatically. As the importance of share repurchases
increases, the economic motivations behind the decision to repurchase shares have
attracted increased academic attention.
Most researchers and managers agree that share repurchases convey information,
which reflects the economic motivations behind repurchase decisions (Brav, Graham,
Harvey, and Michaely (2005)). The literature proposes two potential ways that managers
can use share repurchases as signals to overcome the information asymmetry that exists
between principal and agents. The first rationale is the signaling hypothesis (Bhattacharya
(1979), Miller and Rock (1985), and Vermaelen (1984)), which suggests that managers
who have private information about future cash flows can use repurchases as a signal of
future profitability. The signaling hypothesis implies that profitability will improve after
share repurchases. The second rationale is the free cash-flow hypothesis, which suggests
that firms repurchase their shares to mitigate potential waste of cash by management
(Jensen (1986)). The theory suggests that firms that have been experiencing a reduction
in growth opportunities are more likely to repurchase their shares, leaving fewer funds
available to invest in uneconomic projects. When the value of growth options represents a
4
lower portion of the firm‟s total value, the overall risk of the firm will decline (because
the growth options of the firm are likely to be riskier than the assets in place). Therefore,
the free cash-flow hypothesis also implies that firms‟ systematic risk will decrease after
repurchase decisions.
In this paper we attempt to determine the nature of the signal conveyed by open-
market share repurchases. We examine the repurchase announcement and the actual
repurchase decision separately, as they convey different signals. We are motivated by the
fact that extant literature provides no consensus as to what information the repurchase
announcements actually contain. For example, Bartov (1991), Comment and Jarrell
(1991), and Lie (2005) favor the signaling hypothesis, whereas Jagannathan and Stephens
(2003), Grullon and Michaely (2004), and Li and McNally (2007) favor the free cash-
flow hypothesis. This controversy may be due to the uncommitted nature of repurchase
announcements (Lie (2005)). This represents an important difference between the
declaration of share repurchase programs and the declaration of dividend payments – the
latter becomes a firm‟s obligation once declared whereas the former does not. For
example, firms may simple announce repurchase intentions to mimic competitors that
have previously made such announcements (Massa, Rehman and Vermaelen (2007)).
Consequently, we conjecture that it may be the actual repurchase activities and not the
repurchase intention announcements that convey information associated with the
economic motivations of share repurchases.
Evidence documented in this paper suggests that the real changes associated with
share repurchases (i.e., the improvements in firms‟ operating performance and the
reduction in firms‟ systematic risk) are correlated only with the actual repurchase

5
magnitude, but not with the announced magnitude. With respect to operating performance,
we find significantly positive abnormal operating performance only among firms that
repurchase more than three percent of shares outstanding in that year; firms that
repurchase less than one percent of shares outstanding actually experience significantly
negative abnormal operating performance in that year. With respect to change in
systematic risk, we find a significant reduction in systematic risk after the announcement
of share repurchases. Using the CAPM model, we find that the market beta decreases by
0.095 on average. Using the Fama-French Three-Factor model, we find that while the
factor loadings on market excess return and HML do not change at a statistically
significant level, the factor loading on SMB decreases by 0.12 on average. This finding
suggests that, consistent with the free cash-flow hypothesis, firms that repurchase shares
behave more like larger firms than before. However, we do not find a statistically
significant reduction in systematic risk over the 36-month period subsequent to
repurchase announcements among firms that do not actually repurchase shares for more
than 0.5 percent of total shares outstanding. With these findings (and others reported in
the paper), we conclude that the information content of share repurchases is revealed by
the actual repurchase activities and that the announced magnitude conveys little, if any,
information about the economic motivations behind share repurchase decisions.
We further examine the stock returns of repurchasing firms to see whether the signal
is being received by investors. If only the actual repurchase magnitude conveys
information associated with share repurchases, the abnormal returns around the
repurchase announcement dates should be correlated only with the actual future
(unknown) magnitude, but not with announced magnitude. However, our evidence
6
suggests the exact opposite: the abnormal returns around the announcement dates are
positively correlated with the announced magnitude, but not with the actual repurchase
magnitude. This indicates that investors fail to take actual repurchase magnitude into
account when responding to the repurchase announcements. However, it may be difficult
for investors to estimate future actual repurchase magnitude on announcement dates
(Stephens and Weisbach (1998), Jagannathan, Stephens,and Weisbach (2000)).
To find out whether investors‟ inability to estimate the actual repurchase magnitude
causes the above mentioned inconsistency, we examine the long-run abnormal stock
returns of repurchasing firms. We conjecture that as real changes and actual repurchase
magnitude are revealed gradually and since actual repurchase magnitude was not
incorporated into announcement returns, long-run abnormal stock returns subsequent to
repurchase announcements should be correlated with the actual repurchase magnitude;
and since announced magnitude has already been incorporated into announcement returns,
long-run stock abnormal returns should not be correlated with the announced magnitude.
Our findings confirm this conjecture: we find that the abnormal stock returns of
repurchasing firms over the 36 months subsequent to the announcements are only
correlated with the actual repurchase magnitude, but not with the announced magnitude.
This paper is related to several strands of literature. The first strand of related
literature investigates the motivations of open-market share repurchases and the source of
economic gain from open-market share repurchases. Bartov (1991) documents positive
unexpected annual earnings in the repurchase announcement year and positive revisions
of earnings forecasts by analysts around announcement dates. He concludes that, overall,
open-market repurchases convey information about earnings. Maxwell and Stephens

7
(2003) analyze stock and bond returns around repurchase announcements. They find
evidence consistent with both signaling and wealth redistribution (from bondholders to
shareholders) hypotheses. Chan, Ikenberry, and Lee (2003) analyze three key economic
motivations – undervaluation, disgorgement of free cash flow and leverage. They find
evidence supporting the undervaluation and free cash-flow hypotheses and little support
for the leverage hypothesis. In contrast, Grullon and Michaely (2004) document evidence
that announcements of open-market share repurchase programs are not followed by an
increase in operating performance. They therefore conclude that the information content
of share repurchases is primarily related to a reduction in agency conflict and preclude
the possibility that earning are likely to recover in the long run1. All of these studies use
announced repurchase magnitude to proxy for the economic scale of repurchase programs.
Lie (2005) highlights the importance of actual share repurchases by providing evidence
that firms‟ operating performance improves only after firms actually repurchase a
significant portion of shares outstanding. Gong, Louis, and Sun (2008) further find that
both post-repurchase abnormal returns and reported improvement in operating
performance are at least in part driven by pre-repurchase downward earnings
management. Our study extends Lie‟s study by providing striking new evidence (1) that
whether the motivation of share repurchases is for signaling future profitability or
showing managers‟ commitment to reduce agency costs, only actual repurchase
magnitude matters and announced repurchase magnitude provides little additional
information beyond what is already known by the market; and (2) that even for firms that
actually repurchase a significant portion of their total equity value, announced repurchase
1 Using samples of special dividends, regular dividend increases, and self-tender offers, Lie (2000) also
finds that the stock price reaction is positively related to excess funds for self-tender offers.

8
magnitude still conveys little additional information. Since announced repurchase
magnitude is often used as the most important variable to proxy for the economic
motivation of the repurchase program in prior studies, our study has important
implications for future research by highlighting the need to differentiate between
announced and actual repurchase magnitudes.
The second related literature focuses on the “option” nature of open-market share
repurchases. Bhattacharya and Dittmar (2004) argue that undervalued and ignored firms
may use “cheap talk” (e.g., announce open-market share repurchase programs but do not
actually repurchase shares) to attract the attention of speculators. Chan, Ikenberry, Lee,
and Wang (2005) investigate whether some repurchase programs are motivated by intent
to mislead the market. They find evidence consistent with the notion that, in some cases,
managers may be using repurchase programs to manipulate market opinion. Two
conditions are presumably required for the existence of “cheap talk” behavior. First, to
give firms motivation to pursue “cheap talk”, the market reaction should be positive to
the “talk” itself, at least in the short term. Second, there should be no significant real
changes caused by the “cheap talk” in the long run (otherwise, it is no longer “cheap”).
Our results suggest that these two conditions can indeed be satisfied. Our study thus
provides supplemental evidence for the possible existence of “cheap talk” behavior.
Finally, the third related literature analyzes the source of the long-run abnormal
return experienced by repurchasing firms. Ikenberry, Lakonishok, and Vermaelen (1995)
examine long-run firm performance following open market share repurchase
announcements. They attribute the long-run drift of repurchasing firms‟ stock returns to
investors‟ under-reaction to the information conveyed by the repurchase announcements.
9
Using data from Canadian market, Ikenberry, Lakonishok, and Vermaelen (2000) find
that mis-pricing affects repurchasing firms‟ completion rate. Peyer and Vermaelen (2005)
find that long-run abnormal stock performance is related to the stated reasons at the
announcement. Our study provides another explanation for the long-run abnormal stock
returns of repurchasing firms: announced repurchased magnitude conveys little
information necessary to eliminate information asymmetry; however, the market only
uses announced repurchase magnitude to re-assess the firm‟s value at the announcement.
Consequently, mis-pricing is not fully eliminated at announcement dates and is revealed
through long-run abnormal stock returns.
The remainder of this paper is organized as follows. Section I describes data sources,
sample selection criteria and the methodology to estimate the actual repurchase
magnitude. Sections II and III examine whether actual repurchase magnitude or
announced repurchase magnitude conveys information about future profitability and
changes in systematic risk, respectively. Section IV examines whether stock abnormal
returns of repurchasing firm support our findings in Sections II and III. Section V
concludes.
I. Data and Sample Selection
We obtain our sample from announcements reported in the Security Data
Corporation‟s U.S. Mergers and Acquisitions database. This database contains the most
comprehensive sample of open-market share repurchase programs available, and covers
most of the share repurchase programs announced after 1984 (Grullon and Michaely
(2004)). As with Grullon and Michaely‟s sample, our sample includes regulated firms

10
(e.g., financial institutions and utilities), because they represent a large proportion of the
total repurchase sample.
Our final sample satisfies the following criteria:
(1) Each firm is present on Compustat at the beginning of the fiscal year in which
the open-market share repurchase program is announced.
(2) Common stock return is available in CRSP.
(3) The firm discloses the number or the percentage of shares sought during the
duration of the share repurchase program. If the firm announces only the
number of shares sought, we calculate the percentage of shares sought by using
the number of shares outstanding at the time the firm announces the share
repurchase program.
(4) We exclude any repurchase programs that occur within three years from another
repurchase programs, whether open-market or not, of the same firm. The
purpose of this exclusion is to avoid confounding effects and to ensure the
accuracy of the actual repurchase magnitude.
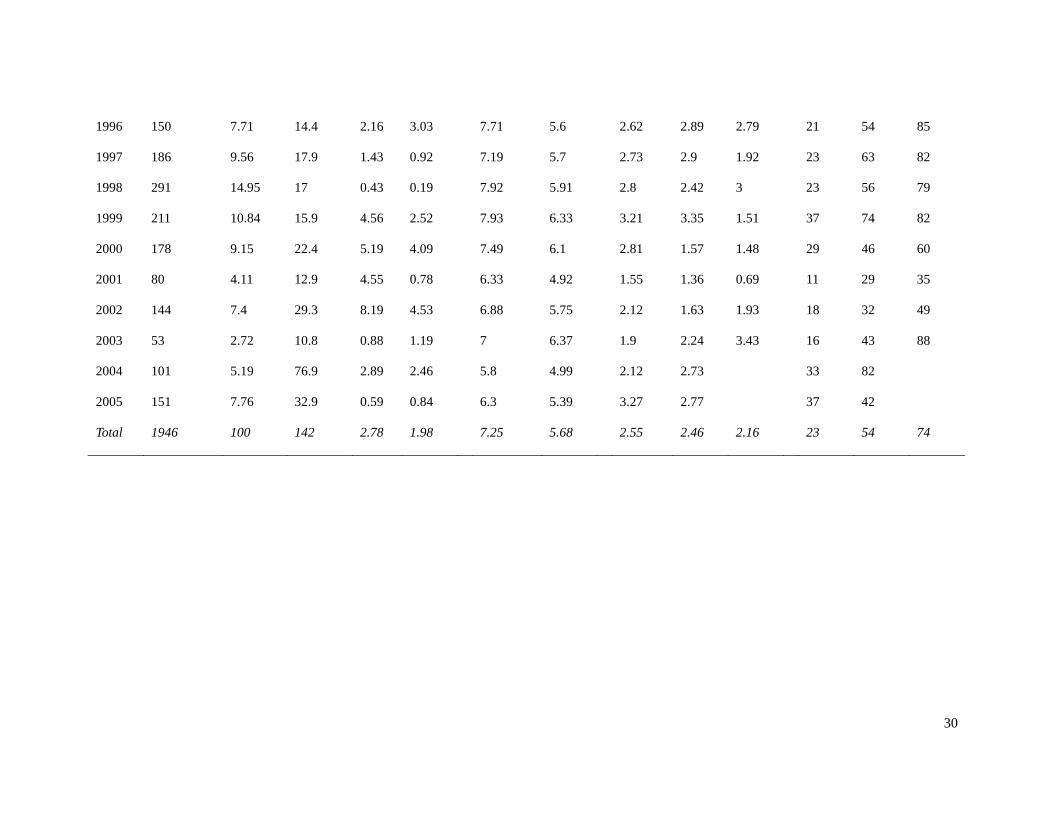
These selection criteria create a sample of 1,946 open-market share repurchase
announcements for the period 1987 to 2005. The actual sample size for each individual
test may vary, depending on the variables used in the test.
Table I reports the distribution of repurchasing firms by calendar years. Grullon and
Michaely (2004) report that most repurchase announcements are concentrated in the
1990s. We find the same result in our sample. The average (median) market reaction
around open-market repurchase announcements is 2.85 percent (1.99 percent), a finding
that is consistent with previous evidence (e.g., Vermaelen (1981), Comment and Jarrell

11
(1991), Ikenberry, Lakonishok, and Vermaelen (1995), and Grullon and Michaely (2004)).
These positive announcement returns confirm the notion that open-market repurchases
convey information to the investors. Table I also shows that the average (median)
proportion of share sought by the firms is 7.44 percent (5.91 percent), which is consistent
with the figures (6.77 percent for mean and 5.00 percent for median) reported in Grullon
and Michaely (2004).
Stephens and Weisbach (1998) suggested four methods to estimate actual repurchase
magnitude of US firms. However, Banyi, Dyl and Kahle (2005) show that the Compustat
purchase of common and preferred stock (adjusted for the change in preferred stock) is
the most accurate measure of actual repurchases among these four methods. Following
Jagannathan, Stephens and Weisbach (2000), Dittmar (2000), and Lie (2005), we use this
method to estimate the actual repurchase magnitude. Specifically, we extract the value of
firms‟ repurchases on their Statement of Cash Flows from Compustat database (data item
#115) and then adjust the value by the yearly change in the value of preferred stocks (data
item #55). The value of firms‟ repurchases (data item #115) is an aggregation of many
other types of transactions and overstates actual share repurchase. This aggregation
includes conversions of other classes or preferred stock, and redemptions of redeemable
preferred stock. The purchases of treasury stock also include privately negotiated
repurchases and self-tender offers in addition to open market repurchases. Since our
measure is adjusted for changes in preferred stocks and our sample includes only firms
that do not have other repurchase program during the 73 months around the
announcement month, our measure is still overstated by the amount of conversions of
other classes of stocks. However, Dittmar (2000) points out that the frequency of these

12
events is much less than that of stock repurchase. Furthermore, Stephens and Weisbach
(1998) find that most firms repurchase all of the stock they ultimately will during the two
years subsequent to the initiation of a program. Hence, we measure actual repurchase
magnitude at the end of fiscal year 0, 1, and 2, respectively.
Table I also shows the mean actual repurchase magnitude and mean completion rate
for fiscal year 0, 1, and 2. Completion rate is defined as actual repurchase value divided
by target repurchase value. The completion rates reported in Table 1 are very close to
those reported in Stephens and Weisbach (1998). Not surprisingly, the mean completion
rates reported in Table I indicate that sample firms on average do not repurchase as many
shares as they have announced.
II. Operating Performance and Repurchase Magnitude
The signaling hypothesis predicts that share repurchases convey information about
future profitability. Controversy exists on whether repurchases are indeed associated with
improvements in operating performance. Bartov (1991) documents positive unexpected
annual earnings in the repurchase announcement year and positive revisions of earnings
forecasts by analysts around announcement dates. They conclude that, overall, open-
market repurchases convey information about earnings. In contrast, Grullon and
Michaely (2004) document the notion that announcements of open-market share
repurchase programs are not followed by an increase in operating performance. They
therefore conclude that the information content of share repurchases is primarily related
to a reduction in agency conflict and preclude the possibility that earnings are likely to
recover in the long run. Lie (2005) finds operating performance improvement among

13
firms that actually repurchase shares during the fiscal quarter of repurchase
announcement. He concludes that actual repurchases, and not announcements per se,
signal future performance improvement. Gong et al (2008) further find that at least part
of the improvement of operating performance is driven by pre-repurchase downward
earnings management.
Evidence from these studies suggests that if share repurchases convey information
about future profitability, the information is likely revealed by the actual repurchase
magnitude. In this section, we explicitly test this hypothesis. Our test has two purposes.
The first purpose is to examine whether the actual repurchase magnitude conveys
information about future profitability, as Lie‟s finding implies. However, Lie‟s study does
not say much about whether the announced magnitude conveys information about future
profitability. Therefore, our second purpose is to examine whether the announced
magnitude conveys information about future profitability.
Following Barber and Lyon (1996) and Lie (2005), we use operating income before
depreciation (Compustat item 13) scaled by the average of beginning- and ending-period
book value of total assets as the measure of operating performance. This measure has the
advantage that it is not affected by changes in capital structure. Furthermore, operating
performance of repurchasing firms is adjusted by operating performance of a matching
firm. Following Lie (2005), we choose matching firms that closely resemble the sample
firms in industry classification, operating performance in year 0, and market-to-book
ratio in year 0. Specifically, for each sample firm, we first identify all firms with the same
two-digit SIC code, operating performance within +/-20% or within +/-0.01 of the
performance of the sample firm in the announcement year, and market-to-book value of
14
assets at the beginning of the announcement year within +/-20% or within +/-0.01 of that
of the sample firm. If no firms meet these criteria, we relax the industry criterion to a
one-digit SIC. If still no firms meet the criteria, we disregard the SIC code. Finally, we
choose the firm with operating performance closest to the sample firm.
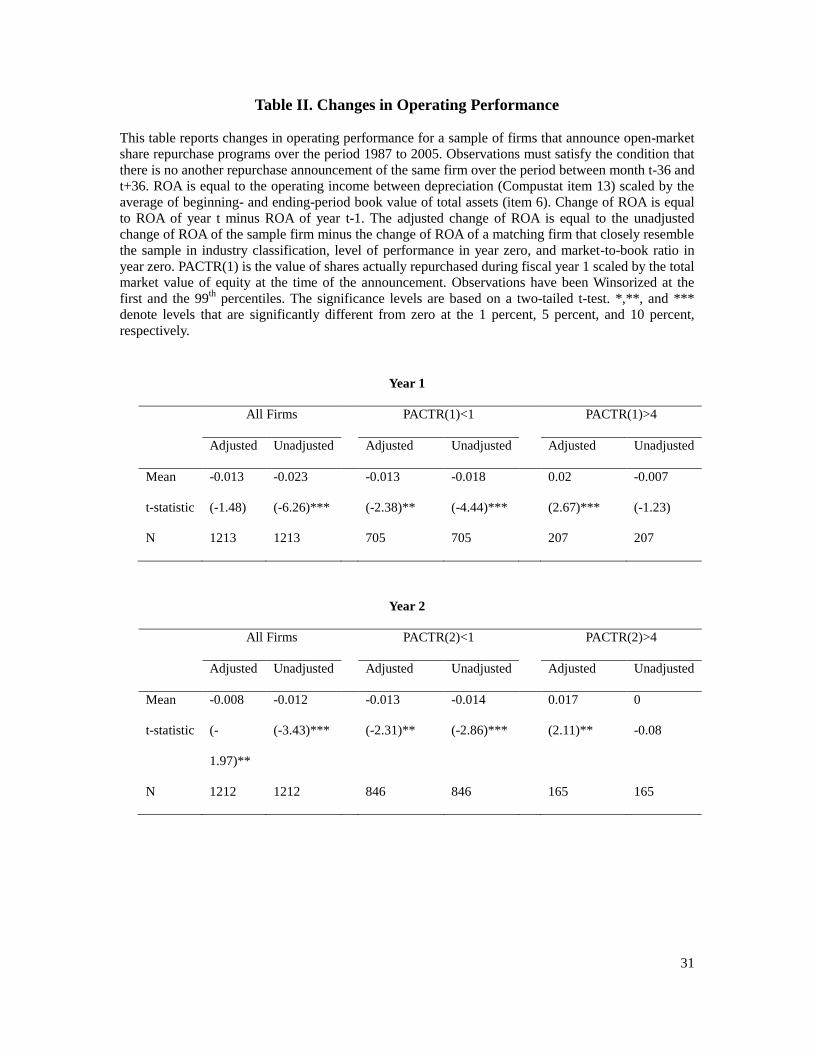
Table II reports the summary statistics of changes in operating performance. Overall,
changes in operating performance in fiscal year 1 and 2 are negative. However, for firms
that actually repurchase less than 1% of total shares outstanding in the fiscal year 1, the
mean adjusted change in operating performance of that year is negative; for firms that
actually repurchase more than 4% of total shares outstanding in the fiscal year 1, the
mean adjusted change in operating performance of that year is positive. The results are
similar for fiscal year 2. These results are consistent with the empirical evidence
documented in previous studies. On the one hand, the overall deterioration of sample
firms‟ profitability is consistent with Grullon and Michaely‟s (2004) finding that
announcements of open-market share repurchase programs are not followed by an
increase in operating performance. On the other hand, the statistically significant increase
in operating performance is consistent with Lie‟s (2005) finding that a sub-sample of
firms that actually repurchase shares experiences improvements in operating performance.
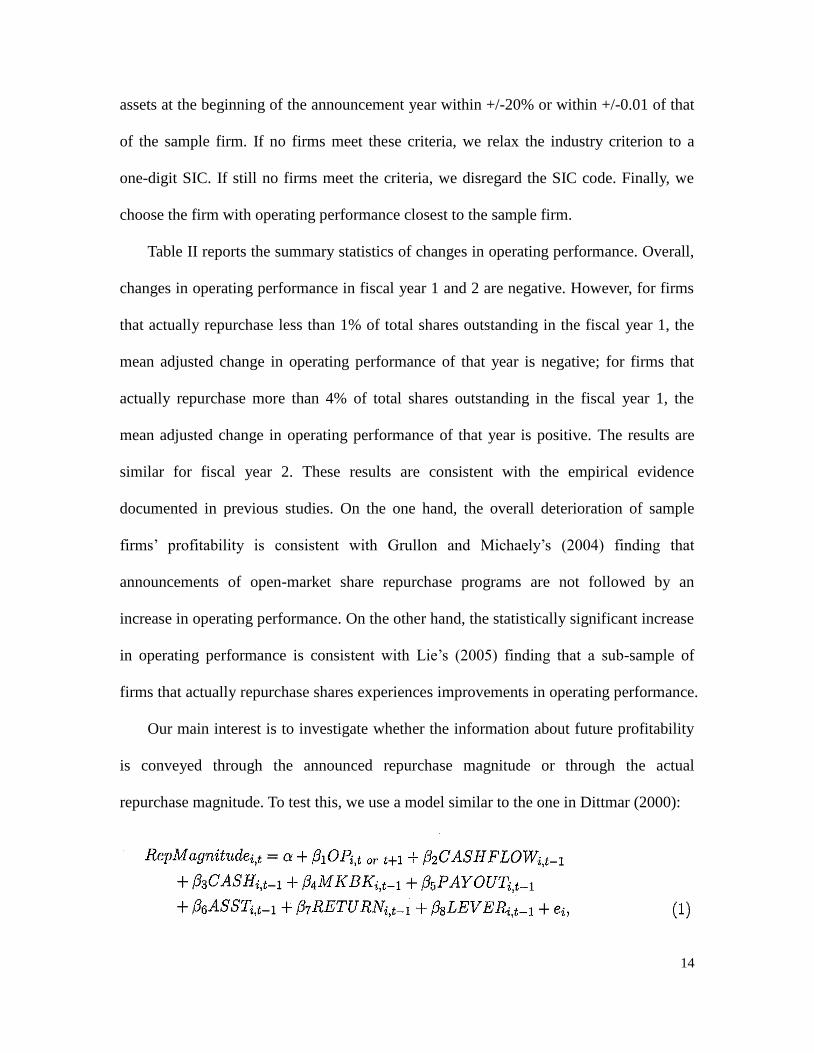
Our main interest is to investigate whether the information about future profitability
is conveyed through the announced repurchase magnitude or through the actual
repurchase magnitude. To test this, we use a model similar to the one in Dittmar (2000):
15
where i represents the repurchasing firm and t is the fiscal year in which shares are
repurchased or the repurchase program is announced. OP represents change or level of
operating performance of year t or year t+1. Operating performance of sample firms is
adjusted by that of matching firms. CASHFLOW is operating income in year t-1 scaled
by total assets. MKBK is market-to-book ratio at the end to year t-1. PAYOUT is cash
dividend paid in year t-1 scaled by net income. ASST is total assets at the end of year t-1.
RETURN is the past 36-month cumulative stock return measured at the end of year t-1.
LEVER is leverage ratio at the end of year t-1, adjusted by industry (2-digit SIC code)
median leverage ratio. To reduce the noise caused by conversions of class A, class B, and
special stock into common stock, we screen stock repurchases as in Dittmar‟s (2000)
study by setting repurchases equal to zero for any firm-year that does not repurchase at
least 1% of its market value of equity at the announcement date.
Table III reports the analysis for the actual repurchase magnitude. Following Dittmar
(2000), we use a Tobit model because actual repurchase magnitude is left-censored at
zero. The results in Table III strongly support the notion that actual repurchase magnitude
conveys information about future operating performance. All of the coefficients on
operating performance measures are positive and all except one are highly significant,
indicating that better operating performance in the current or next year leads to more
shares actually repurchased in the current year. Coefficients on other variables have the
expected signs as well. Specifically, all of the coefficients on CASHFLOW are positive
and highly significant and all of the coefficients on CASH are positive (although not
significant), indicating that the more cash the firm has, the more shares it actually buys
back. All of the coefficients on MKBK are negative and highly significant, suggesting

16
that growth firms tend to repurchase fewer shares than value firms do. All of the
coefficients on lnASST are positive, suggesting that mature firms tend to repurchase
more shares than do younger firms. All of the coefficients on PAYOUT are negative
(although not statistically significant), suggesting that firms may use share repurchases as
a substitution for cash dividends (Grullon and Michaely (2002)). Finally, all of the
coefficients on LEVER are negative, suggesting that firms may use share repurchases to
adjust leverage to the optimal level. The market timing hypothesis predicts that RETURN
should have a negative coefficient, whereas our results are mixed for RETURN. Our
results, however, are consistent with those in Dittmar (2000). Dittmar points out that the
use of annual data may explain the mixed results for RETURN.
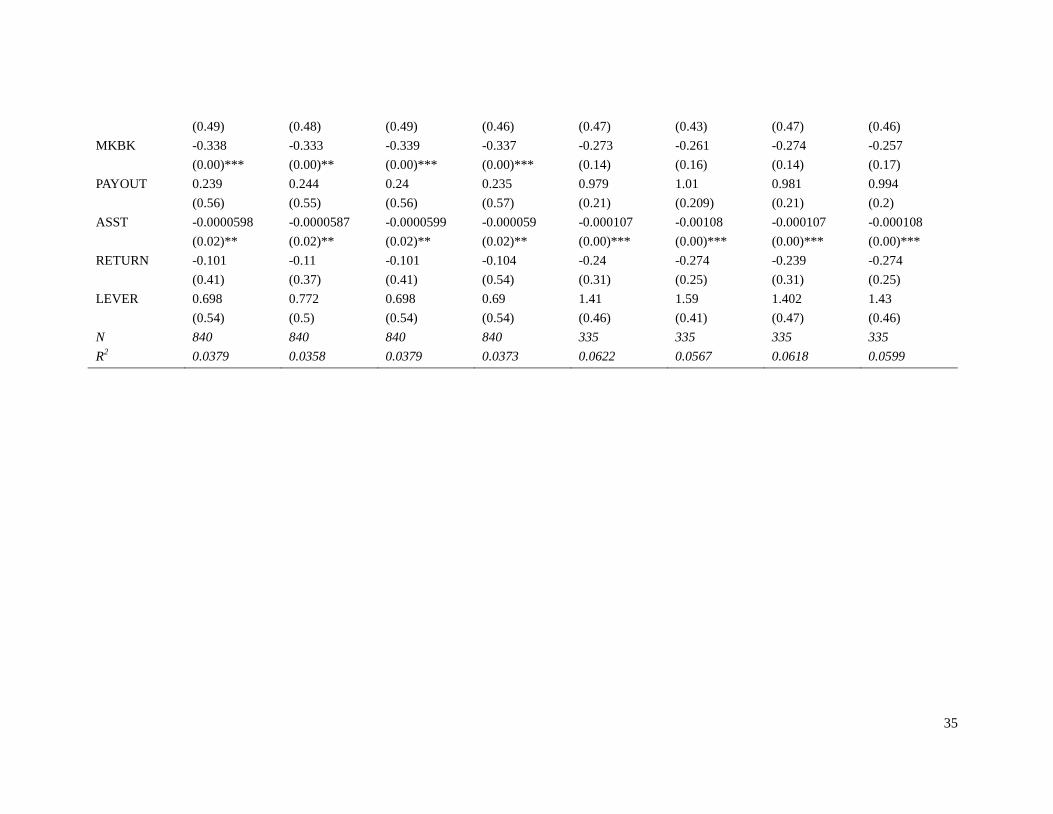
Table IV reports the analysis for the announced repurchase magnitude. Since the
measure of announced magnitude is not censored, we use a conventional OLS model
instead of a Tobit model. Models (1) to (4) use the entire sample, whereas models (5)-(8)
use a sub-sample where the actual repurchase magnitude in that year is greater than 4
percent of the market value at the announcement date. We differentiate firms that actually
repurchase a significant portion of shares from those that do not so that we can
investigate whether announced magnitude is more strongly associated with future
profitability for this subgroup of firms. The results reported in Table IV indicate that, for
both of the entire sample and the sub-sample, the announced magnitude is not associated
with the operating performance in year 1 and year 2. As expected, the signs of the
coefficients of MKBK are consistently negative. Surprisingly, the signs of the coefficients
of ASST are consistently positive, whereas these signs in Table III are negative. These
results suggest that larger firms tend to announce a relatively higher repurchase target but

17
actually repurchase relatively fewer shares, implying a lower completion rate for bigger
firms. In an unreported test, we indeed find that the completion rate at the end of year 1
for smaller firms (below median of NYSE firm size) is 68% and for bigger firms (above
median of NYSE firm size) it is 45%; the completion rate at the end of year 2 for smaller
firm is 89% and for bigger firms is 62%2
. Furthermore, none of coefficients of
CASHFLOW, CASH, PAYOUT, and LEVER are statistically significant. This evidence
suggests that the announced repurchase magnitude, unlike the actual repurchase
magnitude, is not closely related to firms‟ financial condition. This detachment between
announced repurchase magnitude and firms‟ financial conditions further strengthens the
notion that announced repurchase magnitude may be an ad hoc amount and may convey
little information about the motivation behind the repurchase decisions.
Overall, our evidence in Tables III and IV suggests that the actual repurchase
magnitude is related to firms‟ financial condition. Moreover, the actual repurchase
magnitude is related to future profitability even when firms‟ characteristics such as
market-to-book ratio and past cash flow are controlled. This suggests that the actual
repurchase magnitude contains additional information beyond what the market knows at
the time of the repurchase announcement. In contrast, the announced repurchase
magnitude is not related to future profitability once firms‟ characteristics such as market-
to-book ratio and size are controlled. Since these variables are already known at the
repurchase announcement, we conclude that the announced repurchase magnitude
conveys little additional information about firms‟ future profitability.
2 Using data from the Canadian market, Ikenberry, Stephens, and Weisbach (200) also find that firm size
has an negative impact on completion rate.
18
III. Change in Systematic Risk and Repurchase Magnitude
The free cash-flow hypothesis (Easterbrook (1984) and Jensen (1986)) suggests that
share repurchases mitigate the agency costs associated with the possible overinvestment
of free cash-flows. Thus, share repurchases convey information to the market about
managers‟ commitment to reduce the potential agency costs of free cash flow. Positive
announcement returns reflect the good news that the likelihood of overinvestment is
lower.
The condition required by the free cash-flow hypothesis is that the firm experiences a
contraction in its investment opportunity set. Given this condition, the firm should
experience a decline in risk as well. This is because the growth options of the firm are
likely to be riskier than the assets in place (since growth implies uncertainty). As a result,
when the value of growth options represents a lower portion of the firm‟s total value, the
overall risk of the firm will decline. In the framework of the free cash-flow hypothesis,
the repurchase magnitude should convey information about managers‟ commitment to
reduce the agency costs of overinvestment. The more severe the overinvestment problem
the firm faces, the more cash should it pay out through share repurchases. Presumably,
either announced repurchase magnitude or actual repurchase magnitude may effectively
convey information about managers‟ commitment to reduce the agency costs of
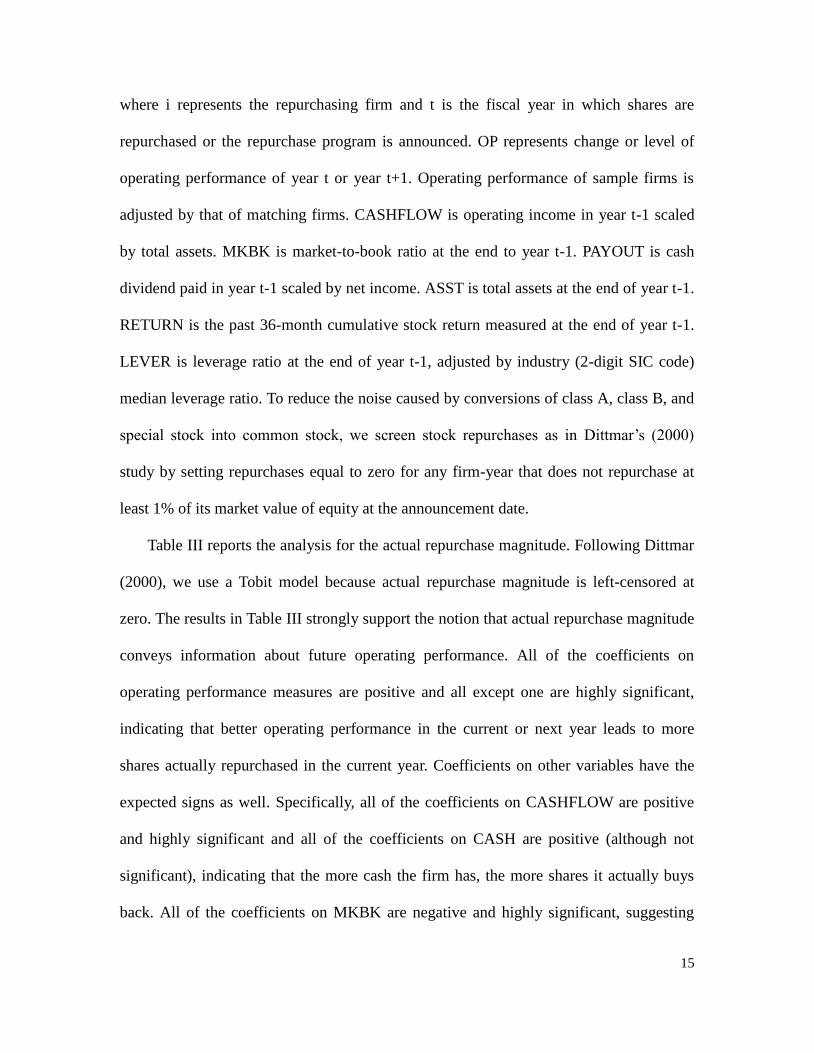
overinvestment. In this section, we try to answer this question empirically. Our test model
is as follows:
19
where i represents the ith repurchasing firm in our sample. Risk is the level of the firm‟s
systematic risk before year 0 and ΔRisk is change in the firm‟s systematic risk after year
0. RepMagnitude is either announced repurchase magnitude or actual repurchase
magnitude. MKBK is market-to-book ratio measured at the end of year t-1. ASST is the
firm‟s total asset measured at the end of year t-1. LEVERAGE is the firm‟s leverage ratio
measured at the end of year t-1. Following Grullon and Michaely (2004), we measure
change in the systematic risk of equity (Risk and ΔRisk) based on the CAPM model and
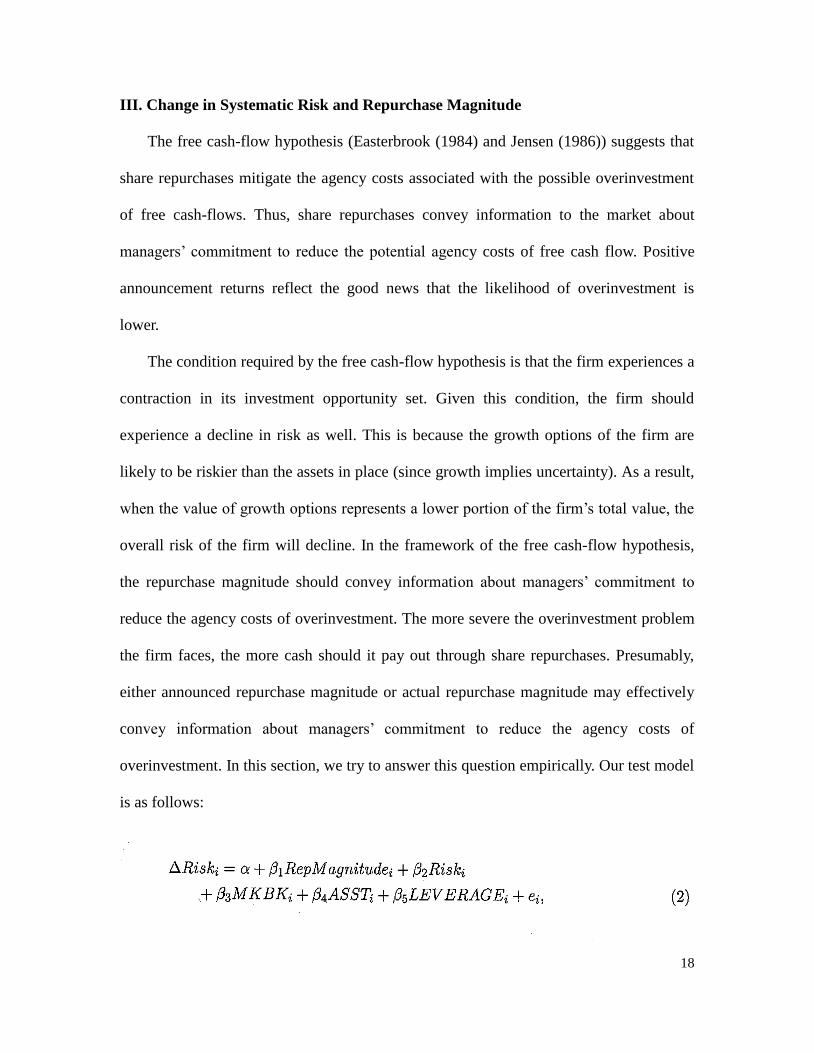
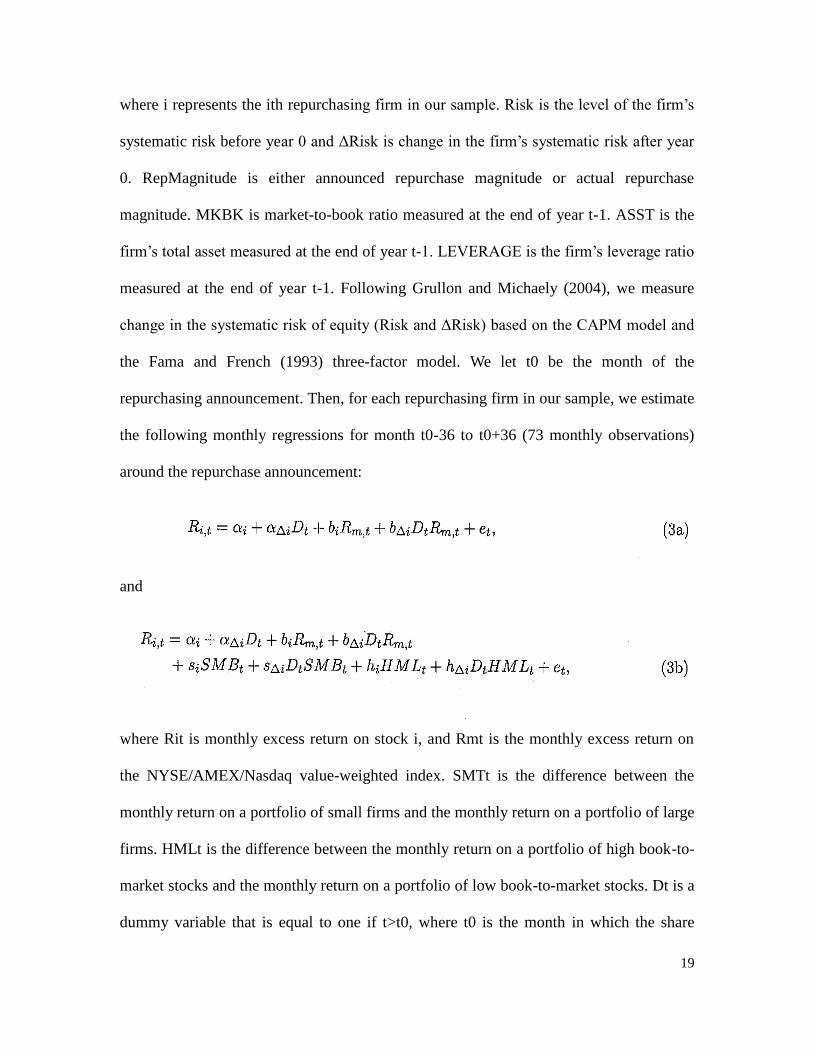
the Fama and French (1993) three-factor model. We let t0 be the month of the
repurchasing announcement. Then, for each repurchasing firm in our sample, we estimate
the following monthly regressions for month t0-36 to t0+36 (73 monthly observations)
around the repurchase announcement:
and
where Rit is monthly excess return on stock i, and Rmt is the monthly excess return on
the NYSE/AMEX/Nasdaq value-weighted index. SMTt is the difference between the
monthly return on a portfolio of small firms and the monthly return on a portfolio of large
firms. HMLt is the difference between the monthly return on a portfolio of high book-to-
market stocks and the monthly return on a portfolio of low book-to-market stocks. Dt is a
dummy variable that is equal to one if t>t0, where t0 is the month in which the share

20
repurchase program is announced. We use the estimated change in factor loadings (i.e.,
bΔi, sΔi, and hΔi) as the measure of change in systematic risk (ΔRisk).
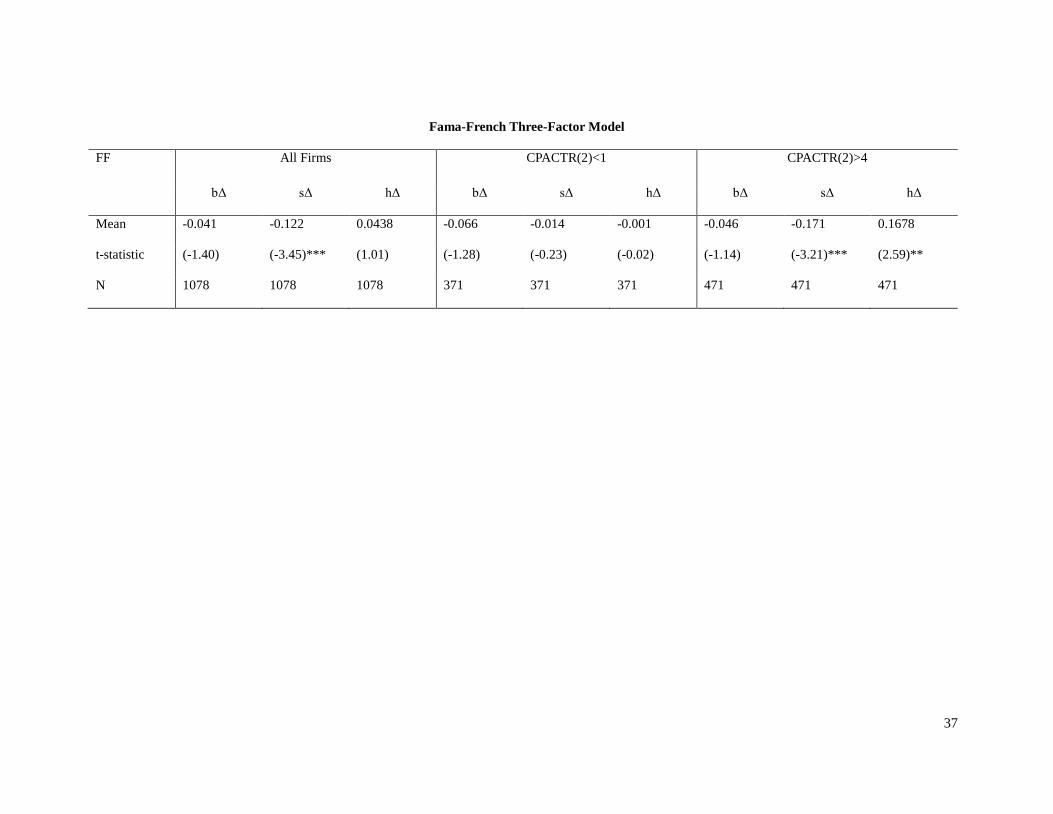
Table V reports summary statistics of the changes in systematic risk of
repurchasing firms. Panel A reports changes in market beta based on the CAPM model.
Overall, the market beta decreases by 0.095 after the repurchase announcement and we
can reject the null hypothesis that the decrease is zero at 1% significance level. This
result is consistent with the evidence reported by Grullon and Michaely (2004), who also
find a statistically significant decrease in CAPM market beta for the repurchasing firms3.
The decrease in CAPM market beta is also consistent with the prediction of the free cash-
flow hypothesis that repurchasing firms should experience a reduction in risk.
For a sub-sample of firms that do not repurchase more than 1% of total equity
value during the years 0, 1, and 2, the decrease in market beta is just 0.076 and we can
not reject the null hypothesis that the decrease is zero at a 5% significance level. In
contrast, for a sub-sample of firms that repurchase more than 4% of total equity value
during the year 0, 1, and 2, the decrease in market beta is 0.154 and we can reject the null
hypothesis that the decrease is zero at a 1% significance level. If the changes in market
beta reflect the shift of firms‟ value from growth options to assets in place, these results
suggest that actual repurchase magnitude likely conveys information about managers‟
commitment to reduce agency costs of overinvestment.
Panel B reports changes in factor loadings on market return, SMB, and HML,
based on the Fama and French (1993) three-factor model. In this case, while the mean
change in market beta is still negative, it is no longer statistically significant. This result
3 Denis and Kadlec (1994) do not find a change in systematic risk after share repurchases. But they use a
relatively small sample (166 observations) of self-tender offers rather than a large sample of open-market
repurchases.

21
also holds for the two sub-samples of firms that actually buy either less than 1% of total
equity value or buy more than 4%. The loss of statistical significance for change in
market beta should not be surprising, since Fama and French (1992) show that market
beta loses its power to explain cross-sectional stock returns once size is taken as a factor.
Indeed, we find that mean decrease in factor loading on SMB is 0.122 and statistically
significant at a 1% level. This result is also consistent with the evidence reported by
Grullon and Michaely (2004), who point out that change in the SMB beta suggests that
share repurchases make firms behave more like large firms and less like small firms,
consistent with the idea that firms increase their payouts when they move from a growth
phase to a more mature phase. Similar to the findings for the CAPM market beta, the
decrease in factor loading on SMB for firms that actually repurchase less than 1% of total
equity value is just 0.014 and not statistically significant. In contrast, the decrease for
firms that actually repurchase more than 4% of total equity value is 0.171 and statistically
significant at a 1% level. Finally, there is no evidence for overall decreases in HML beta.
However, firms that actually repurchase more than 4% of total equity value experience an
increase in HML beta. The results in Section II indicate that firms that aggressively
repurchase are more likely motivated by undervaluation and signaling better future
profitability. Hence, the value of growth options likely has more weight on total value of
these firms. Consequently, the stock returns of these firms behave more like growth firm
than the stock returns of the rest repurchasing firms.
In sum, the results of the univariate tests suggest that repurchasing firms
experience a decrease in systematic risk, which is reflected by a decrease in market beta
in the CAPM model and a decrease in the SMB beta in Three-Factor model. The

22
univariate tests also indicate the important role of actual repurchase magnitude in
conveying information about changes in firms‟ behavior. To explicitly test which of
announced magnitude or actual magnitude matters for conveying such information, we
must resort to multivariate tests.
Table VI reports the result from analysis on the relationship between changes in
systematic risk and actual repurchase magnitude. In Panel A of Table VI, the dependent
variable is the change in the CAPM market beta. The independent variables include the
actual repurchase magnitude (measured at the end of year 0, 1 and 2, respectively) and
firms‟ characteristics (market beta before repurchase announcements, market-to-book
ratio, total assets, and leverage) measured at the beginning of announcement year. Our
results indicate that the coefficients on all three measures of actual repurchase magnitude
are negative and statistically significant at a 1% level. These results suggest that,
consistent with the free cash-flow hypothesis, the more that a firm actually buys back
shares, the more reduction in systematic risk it experiences.
In Panel B of Table VI, the dependent variable is the change in market beta, SMB
beta, and HML beta based on Three-Factor model. When the dependent variable is
market beta, the coefficients on the three measures of actual magnitude are all negative,
but not always significant. We believe that this is because in Three-Factor model, market
beta does not have strong explaining power to expected return (see Fama and French
(1992)). We are most interested in the relationship between SMB beta and repurchase
magnitude for two reasons. First, the free cash-flow hypothesis suggests that firms
repurchase their shares when they become mature and hence behave more like big firms
and less like small firms. Therefore, changes in SMB beta should be more relevant for
23
repurchasing firms than the other two betas. Second, our univariate tests indicate that the
SMB beta is indeed the only factor loading that decreases significantly after repurchase
announcements. The results in Panel B of Table VI confirm this conjecture. All of the
coefficients on the three measures of actual magnitude are negative and statistically
significant (one at a 10% level, and two at a 1% level). Finally, although in the univariate
test, we find firms that buy back shares aggressively experience an increase in HML beta,
we do not find any statistically significant correlation between HML beta and actual
repurchase magnitude in the multivariate test.
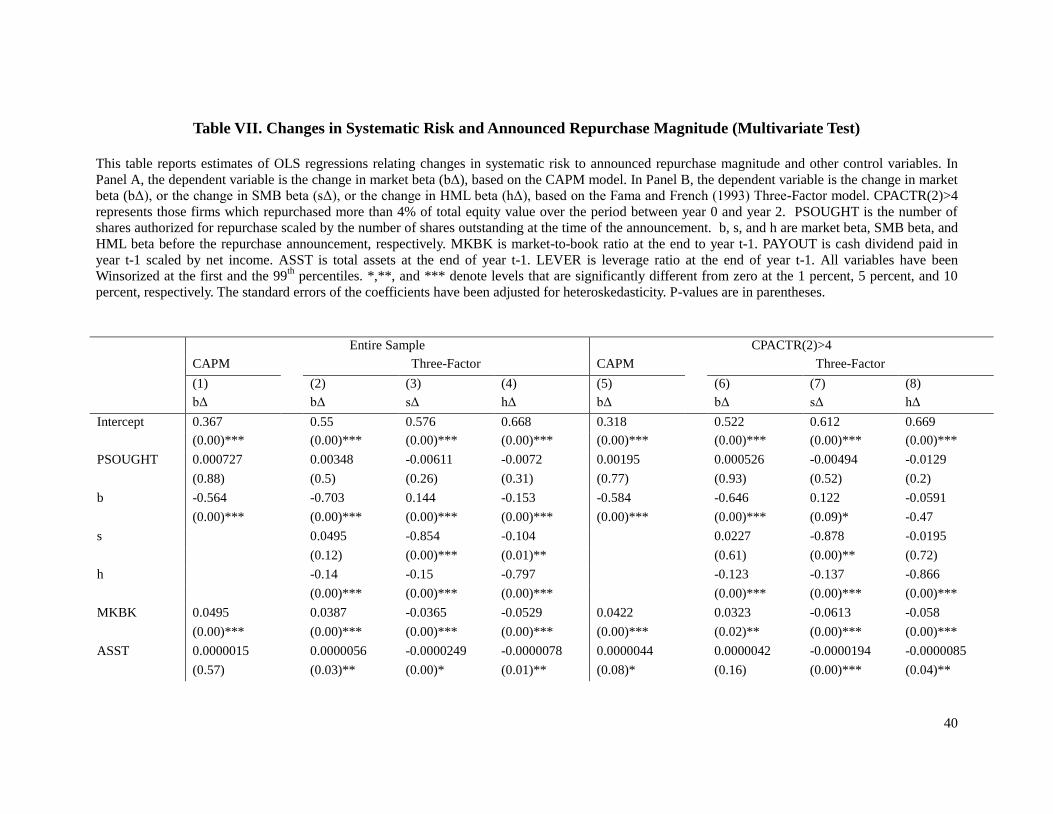
In the next step, we examine whether the announced repurchase magnitude
conveys information about changes in systematic risk. Presumably, it is possible that
managers use the announced repurchase magnitude to covey information to the market
about their commitment to reduce the agency costs of overinvestment. Table VII reports
that results from the multivariate test. Models (1)-(4) use the entire sample. The results
indicate that none of the coefficients on the announced repurchase magnitude is
significant, suggesting that announced repurchase magnitude is not correlated with the
firm‟s change in systematic risk. To further test whether there is a difference for firms that
actually repurchase a significant portion of total equity value, models (5)-(8) use only
firms that repurchase more than 4% of total equity value over the three-year period
between year 0 and year 2. The results turn out to be similar to those with the entire
sample: even for firms that actually buy back a significant portion of total equity value,
announced repurchase magnitude is not correlated with changes in systematic risk. If the
change in systematic risk reflects the consequence of managers‟ commitment to reduce
agency cost, our results imply that the announced repurchase magnitude does not convey

24
information about managers‟ commitment.
In sum, the results reported in this section confirm the results reported in the prior
section: only actual repurchase magnitude conveys information about the economic
motivations behind the repurchase decisions, whereas the announced repurchase
magnitude does not. This seems to be true both for firms that repurchase to signal
undervaluation and for firms that repurchase to signal managers‟ commitment to reduce
the agency costs of overinvestment.
IV. Stock Abnormal Return and Repurchase Magnitude
In the prior two sections we have shown that the actual repurchase magnitude
conveys information about the economic motivation behind repurchase decisions,
whereas the announced repurchase magnitude does not. A natural follow-up question is:
does the market reaction incorporate this difference? We start by examining the
relationship between abnormal returns around the announcement date and the repurchase
magnitude. If information about repurchase motivation is conveyed only through actual
magnitude and if investors can correctly estimate the actual repurchase magnitude ex ante,
the abnormal returns around the announcement date should be correlated with the actual
repurchase magnitude, but not with the announced repurchase magnitude. We use the
following model to test this hypothesis:
25
where RepMagnitude represents actual or announced repurchase magnitude. ΔROA(0)
represents the change in ROA between year t-1 and year 0. ΔROA(3) represents the
changes in ROA between year 0 and year 3. We include these two variables to examine
whether future profitability is incorporated into announcement returns. bΔ, sΔ, and hΔ
represent changes in market beta, SMB beta, and HML beta respectively. We include
them to examine whether changes in systematic risk are incorporated into announcement
returns. MKBK represents market-to-book ratio of the firm‟s assets at the beginning of
the repurchase announcement year. ASST represents the firm‟s total assets at the
beginning of the repurchase announcement year. CASH represents the firm‟s cash
holding at the beginning of the repurchase year scaled by total assets. LEVERAGE
represents the firm‟s leverage ratio at the beginning of the repurchase year.
CASHxLowMB is the product of CASH and LowMB, which is equal to one if the firm‟s
market-to-book ratio is below one and equal to zero if not.
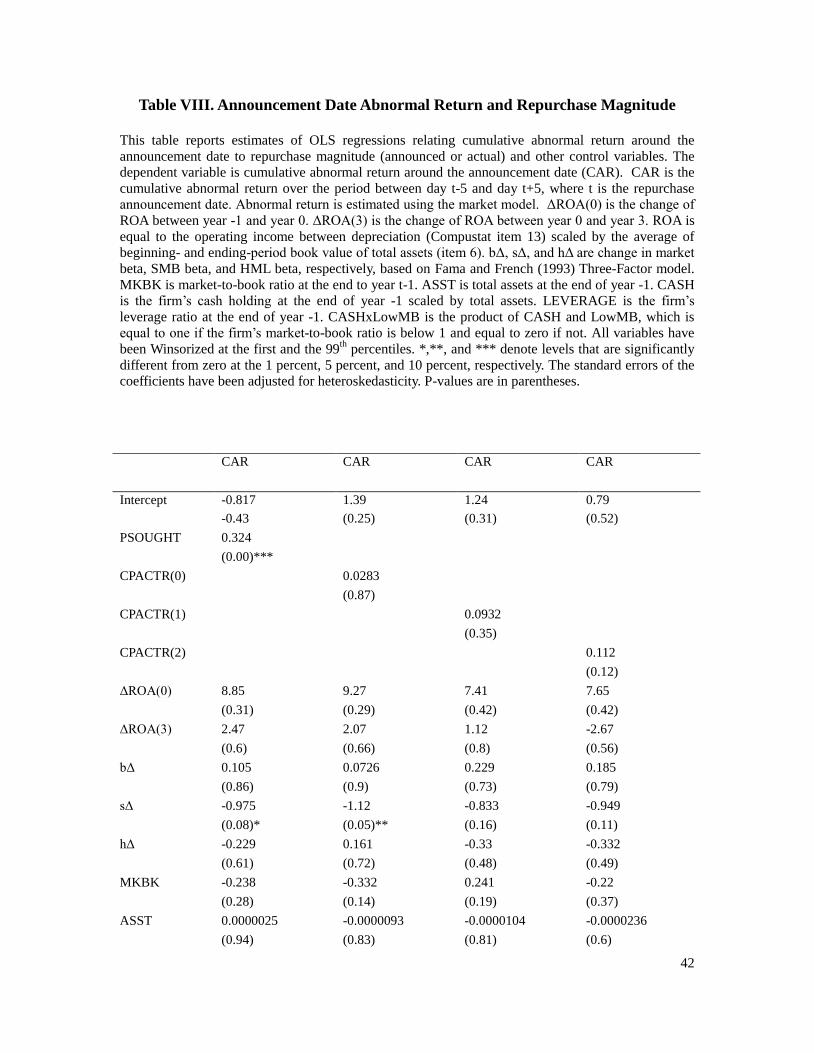
Table VIII reports the results from this analysis. There is a significant correlation
between abnormal return around the announcement date and the announced repurchase
magnitude. This finding is consistent with evidence reported by Grullon and Michaely
(2004). In contrast, there is no evidence that announcement return and actual repurchase
magnitude are correlated; none of the coefficients on the three measures of actual
repurchase magnitude are statistically significant. Moreover, neither of the coefficients on
ΔROA(0) and ΔROA(3) is significant. Thus, there is no evidence that future operating
performance is incorporated into announcement returns. There is mixed evidence that
changes in SMB beta are incorporated into announcement returns, suggesting that
investors may expect some reduction in systematic risk when repurchase decisions are

26
announced. Finally, the coefficient on CASHxLowMB is positive and statistically
significant. Consistent with the free cash-flow hypothesis, this result suggest that for a
certain cash level, firms with fewer growth opportunities experience higher
announcement return, because firms with fewer growth opportunities are more likely to
suffer overinvestment.
These findings suggest that the market reaction is correlated with the announced
repurchase magnitude, but not with the actual repurchase magnitude. This result seems to
be inconsistent with the findings in the previous two sections, where we find that the real
changes associated with share repurchases are only correlated with the actual repurchase
magnitude, but not with the announced repurchase magnitude. A possible reason for this
inconsistency is that actual repurchase magnitude is too difficult for investors to estimate
at the time of repurchase announcements (Stephens and Weisbach (1998)). If this is the
case, then we expect that the information conveyed by the actual repurchase magnitude
should be revealed gradually and incorporated into the long-run abnormal returns of the
repurchasing firms. Specifically, the long-run abnormal returns should be correlated with
actual repurchase magnitude, but not with the announced repurchase magnitude. We use
the following model to test this hypothesis:
where Drift is the abnormal return over the period between month 1 and month 36. Other
variables are the same as those in Equation (4).
27
We follow Barber and Lyon (1997) to estimate long-run abnormal stock returns.
We choose matching firms that closely resemble the sample firms in market value of
equity and market-to-book ratio at month 0. Specifically, for each sample firm, we first
identify all firms with market value between +/-30% of the sample firm. Then we choose
the firm with market-to-book ratio closest to the sample firm.
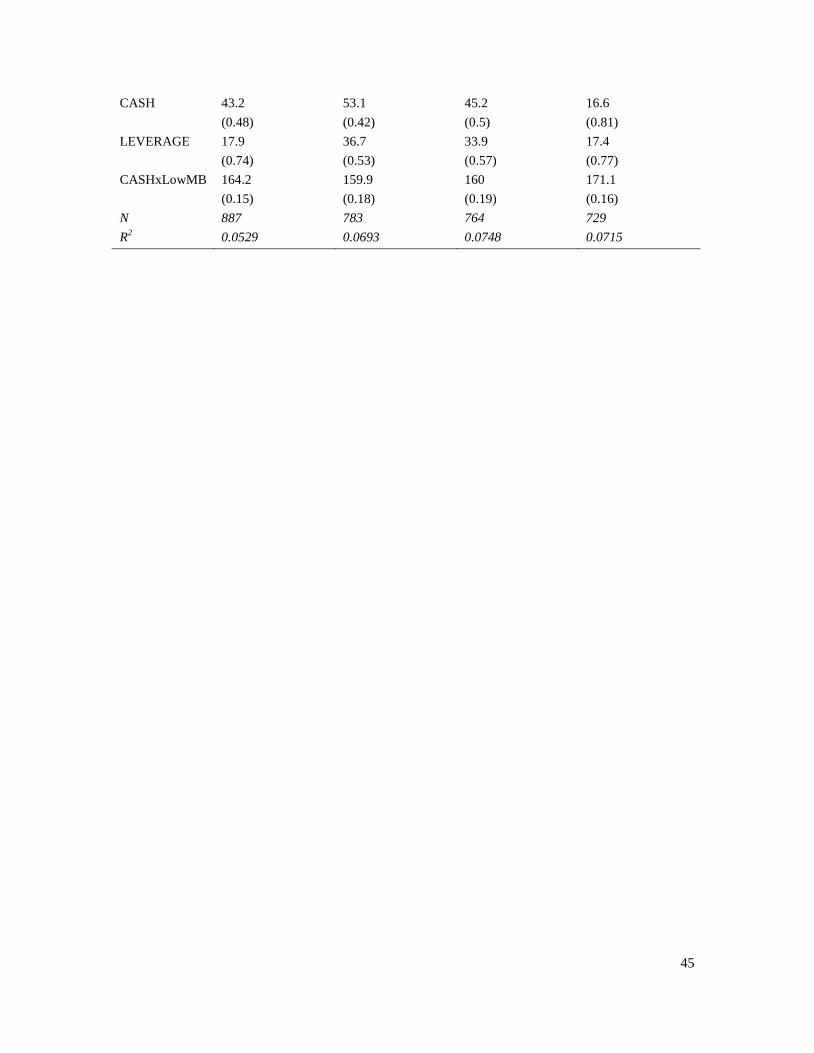
Table IX reports the results from this analysis. Announced repurchase magnitude
and firm characteristics, including those that affect announcement returns, are not
correlated with long-run abnormal returns. This is not surprising, since information
contained in these variables are already known at the announcement and should have
been incorporated into the announcement returns. In contrast, improvement in operating
performance and changes in systematic risk, which are not known by the market at the
time of the repurchase announcement, are significantly correlated with long-run abnormal
returns. Moreover, the actual repurchase magnitude is also significantly correlated with
long-run abnormal returns, even after controlling for the improvement in operating
performance and changes in systematic risk. This suggests that, consistent with our
findings in the previous two sections, actual repurchase magnitude indeed conveys
information about firms‟ valuation.
V. Conclusion
In this paper we investigate the nature of the signal conveyed by open-market
share repurchases. We examine the repurchase announcement and the actual repurchase
decision separately. Evidence documented in this paper suggests that the real changes
associated with share repurchases (i.e., the improvement in firms‟ operating performance
28
and the reduction in firms‟ systematic risk) are correlated only with the actual repurchase
magnitude, but not with the announced magnitude. This conclusion even holds for a
subsample of firms that actually buy back a significant portion of total shares outstanding.
We further examine the stock returns of repurchasing firms to see whether the
signal is being received by investors. We find that the abnormal returns around the
announcement dates are positively correlated with the announced magnitude, but not with
the actual repurchase magnitude. Further, we find that the long-run abnormal stock
returns of repurchasing firms are only correlated with the actual repurchase magnitude,
but not with the announced magnitude. The evidence suggests that it is difficult for
investors to estimate the actual repurchase magnitude at the repurchase announcement.
Consequently, the information associated with the actual repurchase magnitude is
revealed gradually and incorporated into the long-run abnormal stock returns rather than
the announcement returns.
Neither the signaling hypothesis nor the free cash-flow hypothesis differentiates
between announced repurchase magnitude and actual repurchase magnitude from a
theoretical perspective. While our results support both of the hypotheses, our study
highlights the importance of actual repurchase magnitude from an empirical perspective.
Since announced repurchase magnitude has often been used as the most important
variable to proxy for the economic motivation of the repurchase program in prior studies,
our study has important implications for future research by emphasizing the need to
differentiate between announced and actual repurchase magnitudes.

29
Table I. Distribution of Repurchasing Firms by Calendar Year
This table reports the distribution by calendar year for a sample of firms that announced open-market share repurchase programs over the period 1987 to
2005. To be included in the sample, the observation must satisfy the following criteria: the firm‟s financial data are available on Compustat and CRSP;
the firm discloses the number or the percentage of shares sought over the duration of the share repurchase program; and there is no another repurchase
announcement of the same firm over the period between month t-36 and month t+36, where t is the repurchase announcement month. Value is the total
market value of the open-market share repurchase programs in billions of dollars. CAR is the cumulative abnormal return over the period between day t-5
and day t+5. Abnormal return is estimated using the market model. PSOUGHT is the number of shares authorized for repurchase scaled by the number of
shares outstanding at the time of the announcement. CPACTR is the cumulative value of shares actually repurchased scaled by the total market value of
equity at the time of the announcement. CPACTR is measured at the end of fiscal year 0, 1, and 2, respectively. Completion Rate is the ratio of PACTR to
PSOUGHT.
Year # of Obs Fraction Value CAR PSOUGHT CPACTR Median Completion Rate
Mean Median Mean Median Year 0 Year 1 Year 2 Year 0 Year 1 Year 2
1987 5 0.26 3.28 -7.34 -6.68 24.99 9.15 3.18 5.74 5.72 17 43 97
1988 3 0.15 0.18 7.13 5.74 7.35 7.64 5.49 5.39 2.31 72 142 173
1989 4 0.21 0.29 0.25 -0.81 7.23 7.26 1.45 2.2 0.44 19 49 54
1990 6 0.31 0.56 3.6 3.93 5.17 5.65 5.17 1.1 1.68 67 117 209
1991 5 0.26 1.86 9.18 8.42 11.56 10 1.72 3.64 5.84 16 70 96
1992 13 0.67 1.18 -1.56 -0.48 5.48 4.81 1.21 3.33 4.21 19 73 137
1993 27 1.39 2.97 2.37 2.78 8.48 6.22 1.93 4.44 2.88 20 88 118
1994 193 9.92 16.3 1.22 0.89 6.76 5.3 1.97 2.06 1.64 15 39 55
1995 145 7.45 12.8 3.48 2.69 7.42 5.82 2.19 2.62 2.63 22 60 96
30
1996 150 7.71 14.4 2.16 3.03 7.71 5.6 2.62 2.89 2.79 21 54 85
1997 186 9.56 17.9 1.43 0.92 7.19 5.7 2.73 2.9 1.92 23 63 82
1998 291 14.95 17 0.43 0.19 7.92 5.91 2.8 2.42 3 23 56 79
1999 211 10.84 15.9 4.56 2.52 7.93 6.33 3.21 3.35 1.51 37 74 82
2000 178 9.15 22.4 5.19 4.09 7.49 6.1 2.81 1.57 1.48 29 46 60
2001 80 4.11 12.9 4.55 0.78 6.33 4.92 1.55 1.36 0.69 11 29 35
2002 144 7.4 29.3 8.19 4.53 6.88 5.75 2.12 1.63 1.93 18 32 49
2003 53 2.72 10.8 0.88 1.19 7 6.37 1.9 2.24 3.43 16 43 88
2004 101 5.19 76.9 2.89 2.46 5.8 4.99 2.12 2.73 33 82
2005 151 7.76 32.9 0.59 0.84 6.3 5.39 3.27 2.77 37 42
Total 1946 100 142 2.78 1.98 7.25 5.68 2.55 2.46 2.16 23 54 74
31
Table II. Changes in Operating Performance
This table reports changes in operating performance for a sample of firms that announce open-market
share repurchase programs over the period 1987 to 2005. Observations must satisfy the condition that
there is no another repurchase announcement of the same firm over the period between month t-36 and
t+36. ROA is equal to the operating income between depreciation (Compustat item 13) scaled by the
average of beginning- and ending-period book value of total assets (item 6). Change of ROA is equal
to ROA of year t minus ROA of year t-1. The adjusted change of ROA is equal to the unadjusted
change of ROA of the sample firm minus the change of ROA of a matching firm that closely resemble
the sample in industry classification, level of performance in year zero, and market-to-book ratio in
year zero. PACTR(1) is the value of shares actually repurchased during fiscal year 1 scaled by the total
market value of equity at the time of the announcement. Observations have been Winsorized at the
first and the 99th percentiles. The significance levels are based on a two-tailed t-test. *,**, and ***
denote levels that are significantly different from zero at the 1 percent, 5 percent, and 10 percent,
respectively.
Year 1
All Firms PACTR(1)<1 PACTR(1)>4
Adjusted Unadjusted Adjusted Unadjusted Adjusted Unadjusted
Mean -0.013 -0.023 -0.013 -0.018 0.02 -0.007
t-statistic (-1.48) (-6.26)*** (-2.38)** (-4.44)*** (2.67)*** (-1.23)
N 1213 1213 705 705 207 207
Year 2
All Firms PACTR(2)<1 PACTR(2)>4
Adjusted Unadjusted Adjusted Unadjusted Adjusted Unadjusted
Mean -0.008 -0.012 -0.013 -0.014 0.017 0
t-statistic (-
1.97)**
(-3.43)*** (-2.31)** (-2.86)*** (2.11)** -0.08
N 1212 1212 846 846 165 165

32
Table III. Analysis of Actual Repurchase Magnitude
This table reports estimates of Tobit regressions relating actual repurchase magnitude to operating performance and other control variables. The
dependent variable is actual repurchase magnitude (PACTR(t)) - the value of shares actually repurchased during fiscal year t scaled by the total market
value of equity at the time of the announcement. ΔROA(t) is the adjusted change of ROA for fiscal year t; ROA(t) is the adjusted level of ROA for fiscal
year t. ROA is equal to the operating income between depreciation (Compustat item 13) scaled by the average of beginning- and ending-period book
value of total assets (item 6). Change of ROA is equal to ROA of year t minus ROA of year t-1. The adjusted change of ROA is equal to the unadjusted
change of ROA of the sample firm minus the change of ROA of a matching firm that closely resemble the sample in industry classification, level of
performance in year zero, and market-to-book ratio in year zero. CASHFLOW is operating income in year t-1 scaled by total assets. MKBK is market-to-
book ratio at the end to year t-1. PAYOUT is cash dividend paid in year t-1 scaled by net income. ASST is total assets at the end of year t-1. RETURN is
the past 36-month cumulative stock return measured at the end of year t-1. LEVER is leverage ratio at the end of year t-1, adjusted by industry (2-digit
SIC code) median leverage ratio. All variables have been Winsorized at the first and the 99th percentiles. *,**, and *** denote levels that are significantly
different from zero at the 1 percent, 5 percent, and 10 percent, respectively. P-values are in parentheses.
Dependent Variable
PACTR(0) PACTR(1) PACTR(1) PACTR(2) PACTR(0) PACTR(1) PACTR(1) PACTR(2)
Intercept -0.538 -1.66 -1.78 -5.61 -0.548 -1.65 -1.59 -5.17
-0.22 (0.00)*** (0.00)*** (0.00)*** -0.21 (0.00)*** (0.01)*** (0.00)***
ΔROA(1) 3.99 5.54
(0.01)*** (0.00)***
ΔROA(2) 2.75 8.17
(0.12) (0.00)***
ROA(1) 4.15 5.33
(0.00)*** (0.00)***
ROA(2) 4.93 8.69
(0.00)*** (0.00)***
CASHFLOW 6.31 12.6 12.34 20.1 6.24 12.4 11.7 16.92
(0.00)*** (0.00)*** (0.00)*** (0.00)*** (0.00)*** (0.00)*** (0.00)*** (0.00)***

33
CASH 1.39 2.44 2.72 2.06 1.39 2.42 2.78 1.58
(0.32) (0.14) (0.10)* (0.32) (0.33) (0.15) (0.09)* (0.44)
MKBK -0.258 -0.276 -0.241 0.013 -0.262 -0.274 -0.278 -0.0067
(0.00)*** (0.03)** (0.05)** (0.92) (0.00)*** (0.03)** (0.02)** (0.96)
PAYOUT -0.558 -0.551 -0.463 0.35 -0.557 -0.548 -0.483 0.33
(0.25) (0.4) (0.48) (0.92) (0.25) (0.4) (0.46) (0.67)
ASST 0.0001 0 0 0.0001 0.0001 0 0 0.0002
(0.04)** (0.11) (0.10)* (0.00)*** (0.04)** (0.11) (0.10)* (0.00)***
RETURN -0.214 0.142 0.168 0.529 -0.213 0.14 0.152 0.465
(0.12) (0.5) (0.43) (0.05)** (0.13) (0.51) (0.46) (0.08)*
LEVER -0.626 -0.474 -0.318 -3.84 -0.63 -0.456 -0.589 -4.17
(0.62) (0.74) (0.82) (0.02)** (0.62) (0.75) (0.68) (0.02)**
N 785 839 839 870 785 839 839 870
Pseudo-R2 0.5091 0.4153 0.4143 0.3126 0.5092 0.4152 0.4157 0.313

34
Table IV. Analysis of Announced Repurchase Magnitude
This table reports estimates of OLS regressions relating announced repurchase magnitude to operating performance and other control variables. The
dependent variable is announced repurchase magnitude (PSOUGHT) - the number of shares authorized for repurchase scaled by the number of shares
outstanding at the time of the announcement. ΔROA(t) is the adjusted change of ROA for fiscal year t; ROA(t) is the adjusted level of ROA for fiscal year
t. ROA is equal to the operating income between depreciation (Compustat item 13) scaled by the average of beginning- and ending-period book value of
total assets (item 6). Change of ROA is equal to ROA of year t minus ROA of year t-1. The adjusted change of ROA is equal to the unadjusted change of
ROA of the sample firm minus the change of ROA of a matching firm that closely resemble the sample in industry classification, level of performance in
year zero, and market-to-book ratio in year zero. CASHFLOW is operating income in year t-1 scaled by total assets. MKBK is market-to-book ratio at the
end to year t-1. PAYOUT is cash dividend paid in year t-1 scaled by net income. ASST is total assets at the end of year t-1. RETURN is the past 36-month
cumulative stock return measured at the end of year t-1. LEVER is leverage ratio at the end of year t-1, adjusted by industry (2-digit SIC code) median
leverage ratio. All variables have been Winsorized at the first and the 99th percentiles. *,**, and *** denote levels that are significantly different from zero
at the 1 percent, 5 percent, and 10 percent, respectively. Heteroskedasticity of the standard errors has been rejected. P-values are in parentheses.
(1) (2) (3) (4) (5) (6) (7) (8)
Intercept 8.39 8.36 8.31 8.41 10.1 10.1 10.1 10.2
(0.00)*** (0.00)*** (0.00)*** (0.00)*** (0.00)*** (0.00)*** (0.00)*** (0.00)***
ΔROA(1) 1.99 3.94
(0.16) (0.15)
ΔROA(2) 0.459 1.02
(0.72) (0.7)
ROA(1) 2 3.804
(0.15) (0.17)
ROA(2) 1.39 2.39
(0.22) (0.26)
CASHFLOW -0.509 -0.456 -0.549 -0.767 -4.96 -4.85 -5.05 -5.709
(0.74) (0.77) (0.72) (0.63) (0.16) (0.18) (0.15) (0.12)
CASH 0.86 0.88 0.852 0.92 1.67 1.81 1.66 1.69
35
(0.49) (0.48) (0.49) (0.46) (0.47) (0.43) (0.47) (0.46)
MKBK -0.338 -0.333 -0.339 -0.337 -0.273 -0.261 -0.274 -0.257
(0.00)*** (0.00)** (0.00)*** (0.00)*** (0.14) (0.16) (0.14) (0.17)
PAYOUT 0.239 0.244 0.24 0.235 0.979 1.01 0.981 0.994
(0.56) (0.55) (0.56) (0.57) (0.21) (0.209) (0.21) (0.2)
ASST -0.0000598 -0.0000587 -0.0000599 -0.000059 -0.000107 -0.00108 -0.000107 -0.000108
(0.02)** (0.02)** (0.02)** (0.02)** (0.00)*** (0.00)*** (0.00)*** (0.00)***
RETURN -0.101 -0.11 -0.101 -0.104 -0.24 -0.274 -0.239 -0.274
(0.41) (0.37) (0.41) (0.54) (0.31) (0.25) (0.31) (0.25)
LEVER 0.698 0.772 0.698 0.69 1.41 1.59 1.402 1.43
(0.54) (0.5) (0.54) (0.54) (0.46) (0.41) (0.47) (0.46)
N 840 840 840 840 335 335 335 335
R2 0.0379 0.0358 0.0379 0.0373 0.0622 0.0567 0.0618 0.0599

36
Table V. Changes in Systematic Risk and Announced Repurchase Magnitude
This table reports changes in systematic risk for a sample of firms that announce open-market share repurchase programs over the period 1987 to 2005.
Observations must satisfy the condition that there is no another repurchase announcement of the same firm over the period between month t-36 and t+36.
Changes in systematic risk are estimated based on CAPM model and Fama and French (1993) Three-Factor model, respectively. bΔi is change in market
beta. sΔi is change in SMB beta. hΔi is change in HML beta. CPACTR(2) is the cumulative value of shares actually repurchased measured at the end of
fiscal year 2 scaled by the total market value of equity at the time of the announcement. Observations have been Winsorized at the first and the 99th
percentiles. The significance levels are based on a two-tailed t-test. *,**, and *** denote levels that are significantly different from zero at the 1 percent, 5
percent, and 10 percent, respectively.
CAPM Model
All Firms CPACTR(2)<1 CPACTR(2)>4
bΔ bΔ bΔ
Mean -0.095 -0.076 -0.154
t-statistic (-3.66)*** (-1.76)* (-4.11)***
N 1078 371 471
37
Fama-French Three-Factor Model
FF All Firms CPACTR(2)<1 CPACTR(2)>4
bΔ sΔ hΔ bΔ sΔ hΔ bΔ sΔ hΔ
Mean -0.041 -0.122 0.0438 -0.066 -0.014 -0.001 -0.046 -0.171 0.1678
t-statistic (-1.40) (-3.45)*** (1.01) (-1.28) (-0.23) (-0.02) (-1.14) (-3.21)*** (2.59)**
N 1078 1078 1078 371 371 371 471 471 471

38
Table VI. Changes in Systematic Risk and Actual Repurchase Magnitude
This table reports estimates of OLS regressions relating changes in systematic risk to actual
repurchase magnitude and other control variables. In Panel A, the dependent variable is the change in
market beta (bΔ), based on the CAPM model. In Panel B, the dependent variable is the change in
market beta (bΔ), or the change in SMB beta (sΔ), or the change in HML beta (hΔ), based on the
Fama and French (1993) Three-Factor model. CPACTR(t) is the cumulative value of shares actually
repurchased measured at the end of fiscal year five scaled by the total market value of equity at the
time of the announcement. b, s, and h are market beta, SMB beta, and HML beta before the repurchase
announcement, respectively. MKBK is market-to-book ratio at the end to year t-1. PAYOUT is cash
dividend paid in year t-1 scaled by net income. ASST is total assets at the end of year t-1. LEVER is
leverage ratio at the end of year t-1. All variables have been Winsorized at the first and the 99th
percentiles. *,**, and *** denote levels that are significantly different from zero at the 1 percent, 5
percent, and 10 percent, respectively. The standard errors of the coefficients have been adjusted for
heteroskedasticity. P-values are in parentheses.
Panel A
bΔ bΔ bΔ
Intercept 0.471 0.512 0.492
(0.00)*** (0.00)*** (0.00)***
CPACTR(0) -0.0178
(0.01)***
CPACTR(1) -0.0151
(0.00)***
CPACTR(2) -0.00803
(0.01)***
b -0.576 -0.587 -0.585
(0.00)*** (0.00)*** (0.00)***
MKBK 0.0452 0.0445 0.0446
(0.00)*** (0.00)*** (0.00)***
ASST 0.0000021 0.0000026 0.0000026
(0.43) (0.34) (0.38)
LEVERAGE -0.415 -0.428 -0.435
(0.00)*** (0.00)*** (0.00)***
N 875 854 805
R2 0.3007 0.3125 0.3096

39
Panel B
Dependent Variable
bΔ bΔ bΔ sΔ sΔ sΔ hΔ hΔ hΔ
Intercept 0.64 0.675 0.671 0.612 0.668 0.67 0.586 0.601 0.571
(0.00)*** (0.00)*** (0.00)*** (0.00)*** (0.00)*** (0.00)*** (0.00)*** (0.00)*** (0.00)***
CPACTR(0) -0.00462 0.017 -0.0163
(0.54) (0.08)* (0.16)
CPACTR(1) -0.00954 -0.0169 0.00819
(0.03)** (0.00)*** (0.25)
CPACTR(2) -0.00471 -0.0105 0.00613
(0.13) (0.00)*** (0.2)
b 0.0368 0.0361 0.0356 0.133 0.126 0.119 -0.172 -0.177 -0.172
(0.00)*** (0.00)*** (0.00)*** (0.00)*** (0.00)*** (0.01)*** (0.00)*** (0.00)*** (0.00)***
s 0.0435 0.0431 0.04 -0.855 -0.852 -0.859 -0.108 -0.115 -0.113
(0.19) (0.20) (0.25) (0.00)*** (0.00)*** (0.00)*** (0.02)** (0.01)** (0.02)**
h -0.132 -0.121 -0.113 -0.149 -0.147 -0.135 -0.801 -0.799 -0.79
(0.00)*** (0.00)*** (0.00)*** (0.00)*** (0.00)*** (0.00)*** (0.00)*** (0.00)*** (0.00)***
MKBK 0.0368 0.0361 0.0356 -0.0385 -0.0415 -0.0424 -0.0499 -0.0503 -0.0482
(0.00)*** (0.00)*** (0.00)*** (0.00)*** (0.00)*** (0.00)*** (0.00)*** (0.00)*** (0.00)***
ASST 0.0000046 0.0000052 0.0000055 -0.0000254 -0.0000249 -0.0000247 -0.0000098 -0.00001 -0.0000091
(0.11) (0.08)* (0.07)* (0.00)*** (0.00)*** (0.00)*** (0.00)*** (0.00)*** (0.01)**
LEVERAGE 0.255 0.209 0.19 0.0746 0.0669 0.0133 1.0576 1.025 1.057
(0.07)* (0.13) (0.16) (0.65) (0.69) (0.93) (0.00)*** (0.00)*** (0.00)***
N 875 854 805 875 854 805 875 854 805
R2 0.3983 0.3964 0.3975 0.5307 0.529 0.5356 0.4476 0.4487 0.4443
40
Table VII. Changes in Systematic Risk and Announced Repurchase Magnitude (Multivariate Test)
This table reports estimates of OLS regressions relating changes in systematic risk to announced repurchase magnitude and other control variables. In
Panel A, the dependent variable is the change in market beta (bΔ), based on the CAPM model. In Panel B, the dependent variable is the change in market
beta (bΔ), or the change in SMB beta (sΔ), or the change in HML beta (hΔ), based on the Fama and French (1993) Three-Factor model. CPACTR(2)>4
represents those firms which repurchased more than 4% of total equity value over the period between year 0 and year 2. PSOUGHT is the number of
shares authorized for repurchase scaled by the number of shares outstanding at the time of the announcement. b, s, and h are market beta, SMB beta, and
HML beta before the repurchase announcement, respectively. MKBK is market-to-book ratio at the end to year t-1. PAYOUT is cash dividend paid in
year t-1 scaled by net income. ASST is total assets at the end of year t-1. LEVER is leverage ratio at the end of year t-1. All variables have been
Winsorized at the first and the 99th percentiles. *,**, and *** denote levels that are significantly different from zero at the 1 percent, 5 percent, and 10
percent, respectively. The standard errors of the coefficients have been adjusted for heteroskedasticity. P-values are in parentheses.
Entire Sample CPACTR(2)>4
CAPM Three-Factor CAPM Three-Factor
(1) (2) (3) (4) (5) (6) (7) (8)
bΔ bΔ sΔ hΔ bΔ bΔ sΔ hΔ
Intercept 0.367 0.55 0.576 0.668 0.318 0.522 0.612 0.669
(0.00)*** (0.00)*** (0.00)*** (0.00)*** (0.00)*** (0.00)*** (0.00)*** (0.00)***
PSOUGHT 0.000727 0.00348 -0.00611 -0.0072 0.00195 0.000526 -0.00494 -0.0129
(0.88) (0.5) (0.26) (0.31) (0.77) (0.93) (0.52) (0.2)
b -0.564 -0.703 0.144 -0.153 -0.584 -0.646 0.122 -0.0591
(0.00)*** (0.00)*** (0.00)*** (0.00)*** (0.00)*** (0.00)*** (0.09)* -0.47
s 0.0495 -0.854 -0.104 0.0227 -0.878 -0.0195
(0.12) (0.00)*** (0.01)** (0.61) (0.00)** (0.72)
h -0.14 -0.15 -0.797 -0.123 -0.137 -0.866
(0.00)*** (0.00)*** (0.00)*** (0.00)*** (0.00)*** (0.00)***
MKBK 0.0495 0.0387 -0.0365 -0.0529 0.0422 0.0323 -0.0613 -0.058
(0.00)*** (0.00)*** (0.00)*** (0.00)*** (0.00)*** (0.02)** (0.00)*** (0.00)***
ASST 0.0000015 0.0000056 -0.0000249 -0.0000078 0.0000044 0.0000042 -0.0000194 -0.0000085
(0.57) (0.03)** (0.00)* (0.01)** (0.08)* (0.16) (0.00)*** (0.04)**

41
LEVERAGE -0.406 0.223 0.0983 0.967 -0.274 0.377 -0.132 1.025
(0.00)*** (0.09)* (0.53) (0.00)*** (0.06)* (0.04)** (0.54) (0.00)***
N 997 997 997 997 449 449 449 449
R2 0.297 0.3912 0.5322 0.4463 0.3154 0.3636 0.6043 0.4803
42
Table VIII. Announcement Date Abnormal Return and Repurchase Magnitude
This table reports estimates of OLS regressions relating cumulative abnormal return around the
announcement date to repurchase magnitude (announced or actual) and other control variables. The
dependent variable is cumulative abnormal return around the announcement date (CAR). CAR is the
cumulative abnormal return over the period between day t-5 and day t+5, where t is the repurchase
announcement date. Abnormal return is estimated using the market model. ΔROA(0) is the change of
ROA between year -1 and year 0. ΔROA(3) is the change of ROA between year 0 and year 3. ROA is
equal to the operating income between depreciation (Compustat item 13) scaled by the average of
beginning- and ending-period book value of total assets (item 6). bΔ, sΔ, and hΔ are change in market
beta, SMB beta, and HML beta, respectively, based on Fama and French (1993) Three-Factor model.
MKBK is market-to-book ratio at the end to year t-1. ASST is total assets at the end of year -1. CASH
is the firm‟s cash holding at the end of year -1 scaled by total assets. LEVERAGE is the firm‟s
leverage ratio at the end of year -1. CASHxLowMB is the product of CASH and LowMB, which is
equal to one if the firm‟s market-to-book ratio is below 1 and equal to zero if not. All variables have
been Winsorized at the first and the 99th percentiles. *,**, and *** denote levels that are significantly
different from zero at the 1 percent, 5 percent, and 10 percent, respectively. The standard errors of the
coefficients have been adjusted for heteroskedasticity. P-values are in parentheses.
CAR CAR CAR CAR
Intercept -0.817 1.39 1.24 0.79
-0.43 (0.25) (0.31) (0.52)
PSOUGHT 0.324
(0.00)***
CPACTR(0) 0.0283
(0.87)
CPACTR(1) 0.0932
(0.35)
CPACTR(2) 0.112
(0.12)
ΔROA(0) 8.85 9.27 7.41 7.65
(0.31) (0.29) (0.42) (0.42)
ΔROA(3) 2.47 2.07 1.12 -2.67
(0.6) (0.66) (0.8) (0.56)
bΔ 0.105 0.0726 0.229 0.185
(0.86) (0.9) (0.73) (0.79)
sΔ -0.975 -1.12 -0.833 -0.949
(0.08)* (0.05)** (0.16) (0.11)
hΔ -0.229 0.161 -0.33 -0.332
(0.61) (0.72) (0.48) (0.49)
MKBK -0.238 -0.332 0.241 -0.22
(0.28) (0.14) (0.19) (0.37)
ASST 0.0000025 -0.0000093 -0.0000104 -0.0000236
(0.94) (0.83) (0.81) (0.6)

43
CASH 2.13 2.85 2.509 1.093
(0.63) (0.54) (0.6) (0.82)
LEVERAGE 6.99 7.54 7.33 6.606
(0.08)* (0.08)* (0.10)* (0.14)
CASHxLowMB 27.8 29.8 28.4 28.9
(0.02)** (0.02)** (0.03)** (0.03)**
N 892 788 769 734
R2 0.05428 0.0446 0.04245 0.04639

44
Table IX. Long-Run Abnormal Return and Repurchase Magnitude
This table reports estimates of OLS regressions relating long-run abnormal stock return subsequent to
repurchase announcement to repurchase magnitude (announced or actual) and other control variables.
The dependent variable is long-run abnormal stock return subsequent to repurchase announcement.
The long-run abnormal stock return is equal to the cumulative stock return of the sample firm over
the 36 month subsequent to the announcement month minus the cumulative stock return of a matching
firm over the same period that closely resemble the sample firm in market value of equity and market-
to-book ratio. ΔROA(0) is the change of ROA between year -1 and year 0. ΔROA(3) is the change of
ROA between year 0 and year 3. ROA is equal to the operating income between depreciation
(Compustat item 13) scaled by the average of beginning- and ending-period book value of total assets
(item 6). bΔ, sΔ, and hΔ are change in market beta, SMB beta, and HML beta, respectively, based on
Fama and French (1993) Three-Factor model. MKBK is market-to-book ratio at the end to year t-1.
ASST is total assets at the end of year -1. CASH is the firm‟s cash holding at the end of year -1 scaled
by total assets. LEVERAGE is the firm‟s leverage ratio at the end of year -1. CASHxLowMB is the
product of CASH and LowMB, which is equal to one if the firm‟s market-to-book ratio is below 1 and
equal to zero if not. All variables have been Winsorized at the first and the 99th percentiles. *,**, and
*** denote levels that are significantly different from zero at the 1 percent, 5 percent, and 10 percent,
respectively. Heteroskedasticity of the standard errors has been rejected. P-values are in parentheses.
Drift Drift Drift Drift
Intercept 0.549 -15.7 -24.7 -18.9
(0.97) (0.43) (0.24) (0.37)
PSOUGHT 1.67
(0.29)
CPACTR(0) 8.72
(0.00)***
CPACTR(1) 6.09
(0.00)***
CPACTR(2) 4.41
(0.00)***
ΔROA(0) 1.06 0.983 0.931 0.0975
(0.34) (0.39) (0.43) (0.93)
ΔROA(3) 4.16 4.18 4.25 4.07
(0.00)*** (0.00)** (0.00)*** (0.00)***
bΔ 8.42 6.84 9.54 9.71
(0.35) (0.47) (0.33) (0.32)
sΔ 17.9 20.4 23 20.7
(0.01)*** (0.00)*** (0.00)*** (0.00)***
hΔ -14 -16.5 -18.9 -14.3
(0.03)** (0.02)** (0.00)*** (0.05)**
MKBK -0.04 0.858 1.49 0.657
(0.99) (0.82) (0.71) (0.87)
ASST 0.0000833 -0.000365 -0.000546 -0.000721
(0.94) (0.76) (0.66) (0.55)
45
CASH 43.2 53.1 45.2 16.6
(0.48) (0.42) (0.5) (0.81)
LEVERAGE 17.9 36.7 33.9 17.4
(0.74) (0.53) (0.57) (0.77)
CASHxLowMB 164.2 159.9 160 171.1
(0.15) (0.18) (0.19) (0.16)
N 887 783 764 729
R2 0.0529 0.0693 0.0748 0.0715
46
References
Barber, B.M. and J.D. Lyon, 1996, “Detecting Abnormal Operating Performance: The
Empirical Power and Specification of Tests-Statistics,” Journal of Financial Economics
41, 359-399.
Barber, B.M. and J.D. Lyon, 1997, “Detecting Long-Horizon Abnormal Stock Returns:
The Empirical Power and Specification of Tests-Statistics,” Journal of Financial
Economics 43, 341-368.
Banyi, M., E.A. Dyl, and K.M. Kahle, 2005, “Measuring Share Repurchases”, Working
Paper.
Bartov, E., 1991, “Open-Market Stock Repurchase as Signals for Earnings and Risk
Changes,” Journal of Accounting and Economics 14, 275-294.
Bhattacharya, S., 1979, “Imperfect Information, Dividend Policy, and „the Bird in the
Hand‟ Fallacy,” Bell Journal of Economics 10, 259-270.
Bhattacharya, U. and A.K., Dittmar, 2004, "Costless Versus Costly Signaling In Capital
Markets: Theory And Evidence," Working Paper.
Brav, A, J.R. Graham, C.R. Harvey, and R. Michaely, 2005, “Payout Policy in the 21st
Century,” Journal of Financial Economics 77, 483-527.
Chan, K., D. Ikenberry, and I. Lee, 2003, “Economic Sources of Gain in Stock
Repurchases,” Working Paper.
Chan, K., D. Ikenberry, I. Lee, and Y. Wang, 2005, “Share Repurchases as a Tool to
Mislead Investors: Evidence from Earning Quality and Stock Performance,” European
Financial Management Association Conference, Stockholm, Sweden, June 2006.
Comment, R. and G.A. Jarrell, 1991, “The Relative Signaling Power of Dutch-Auction
and Fix-Price Self-Tender Offers and Open-Market Share Repurchases,” Journal of
Finance 46, 1243-1271.
Denis, J. David, and Gregory B. Kadlec, 1994, “Corporate Events, Trading Activity, and
the Estimation of Systematic Risk: Evidence from Equity Offerings and Share
Repurchases”, Journal of Finance 49, 1787-1811.
Dittmar, A.K., 2000, “Why Do Firms Repurchase Stocks?” Journal of Business 73, 331-
355.
Easterbrook, F.H., 1984, “Two Agency-Cost Explanations of Dividends,” American
Economic Review 74, 650-659.
47
Fama, E.F. and K.R. French, 1992, “The Cross-Section of Expected Stock Returns,”
Journal of Finance 47, 427-465.
Fama, E.F. and K.R. French, 1993, “Common Risk Factors in the Returns on Stocks and
Bonds,” Journal of Financial Economics 33, 3-56.
Fama, E.F. and K.R. French, 2001, “Disappearing Dividends: Changing Firm
Characteristics or Lower Propensity to Pay?” Journal of Financial Economics 60, 3-43.
Gong, Guojin, Henock Louis, and Amy X. Sun, 2008, “Earnings Management and Firm
Performance Following Open-Market Repurchases”, Journal of Finance 63, 947-986.
Grullon, G. and R. Michaely, 2002, “Dividends, Share Repurchases and the Substitution
Hypothesis,” Journal of Finance 62, 1649-1684.
Grullon, G. and R. Michaely, 2004, “The Information Content of Share Repurchase
Programs,” Journal of Finance 59, 651-680.
Ikenberry, D., J. Lakonishok, and T. Vermaelen, 1995, “Market Underreaction to Open
Market Share Repurchases,” Journal of Financial Economics 39, 181-208.
Ikenberry, D., J. Lakonishok, and T. Vermaelen, 2000, “Share Repurchases in Canada:
Performance and Strategic Trading,” Journal of Finance 55, 2373-2397.
Jagannathan, M., C.P. Stephens, and M.S. Weisbach, 2000, “Financial Flexibility and the
Choice between Dividends and Stock Repurchases,” Journal of Financial Economics 57,
355-384.
Jagannathan, M., and C.P. Stephens, 2003, “Motives for Multiple Open-Market
Repurchase Programs,” Financial Management 32, 71-91.
Jensen, M.C., 1986, “Agency Costs of Free Cash Flow, Corporate Finance, and
Takeovers,” American Economic Review 76, 323-329.
Li, K. and W. McNally, 2007, “The Information Content of Canadian Open Market
Repurchase Announcements,” Managerial Finance 33, 65-80.
Lie, E., 2000, “Excess Funds and Agency Problems: An Empirical Study of Incremental
Cash Disbursements”, Review of Financial Studies 13, 219-247.
Lie, E., 2005, “Operating Performance Following Open Market Share Repurchase
Announcements,” Journal of Accounting & Economics 39, 411-436.
Massa, M., Z. Rehman, and T. Vermaelen, 2007, “Mimicking Repurchases,” Journal of
Financial Economics 84, 624-666.

48
Maxwell, W.F. and C.P. Stephens, 2003, “The Wealth Effects of Repurchases on
Bondholders,” Journal of Finance 58, 895-919.
Miller, M and K. Rock, 1985, “Dividend Policy under Asymmetric Information,” Journal
of Finance 40, 1031-1051.
Peyer U. and T. Vermaelen, 2005, “The Nature and Persistence of Buyback Anomalies,”
Working Paper.
Stephens, C. and M. Weisbach, 1998, “Actual Share Reacquisitions in Open Market
Repurchases Programs,” Journal of Finance 53, 313-333.
Vermaelen, T., 1981, “Common Stock Repurchases and Market Signaling,” Journal of
Financial Economics 9, 139-18.
Vermaelen, T., 1984, “Repurchase Tender Offers, Signaling and Managerial Incentives,”
Journal of Financial and Quantitative Analysis 19, 163-181.