Information and Scheduling: What's available and how does it change Jennifer M. Schopf Argonne...
26
Information and Information and Scheduling: Scheduling: What's available and how What's available and how does it change does it change Jennifer M. Schopf Jennifer M. Schopf Argonne National Lab Argonne National Lab
-
date post
22-Dec-2015 -
Category
Documents
-
view
220 -
download
3
Transcript of Information and Scheduling: What's available and how does it change Jennifer M. Schopf Argonne...
Information and Information and Scheduling: Scheduling:
What's available and how What's available and how does it changedoes it change
Jennifer M. SchopfJennifer M. Schopf
Argonne National LabArgonne National Lab

Oct 20, 2003 2
Information and SchedulingInformation and Scheduling
How a scheduler work is closely tied to the information available
Choice of algorithm dependent on accessible data

Oct 20, 2003 3
This TalkThis Talk
What approaches expect form information What data is actually available, and some
open questions How data changes What to do about changing data

Oct 20, 2003 4
NBNB
I’m speaking (pessimistically) from my own background
We’ve heard some talks earlier today (for example PACE) which address some of these problems
I still think these are interesting open issues to think about

Oct 20, 2003 5
Information systemsInformation systems(NOTE: taken from my standard MDS2 talk)(NOTE: taken from my standard MDS2 talk)
Information is always old– Time of flight, changing system state
– Need to provide quality metrics Distributed system state is hard to obtain
– Information is not contemporaneous (thanks j.g.)
– Complexity of global snapshot Components will fail Scalability and overhead
– Approaches are changed for scalability, this will affect the information available
Oct 20, 2003 6
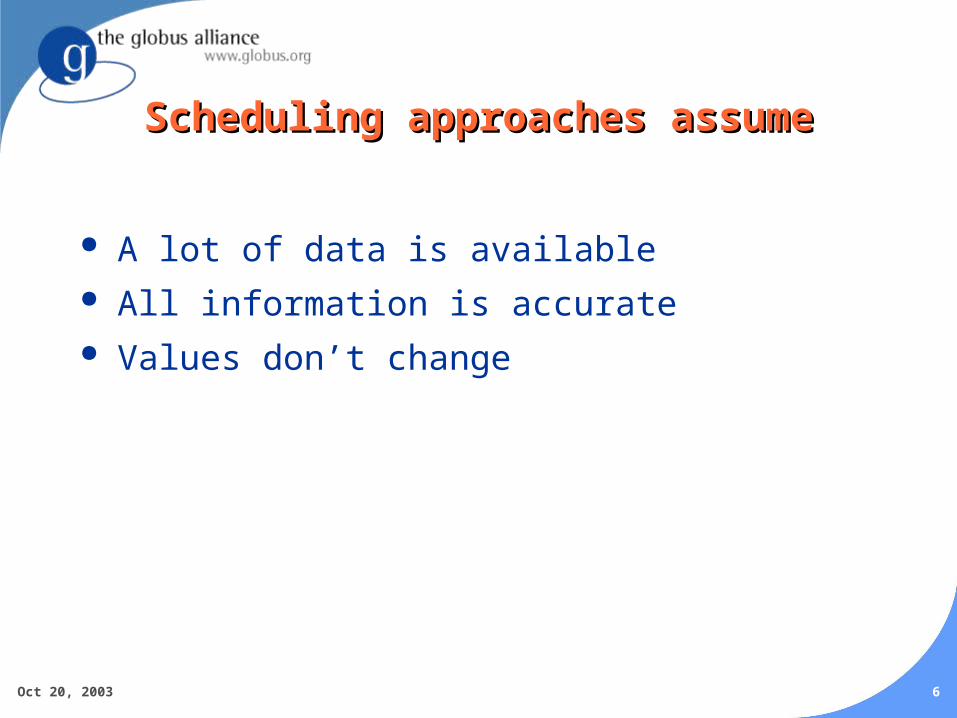
Scheduling approaches assumeScheduling approaches assume
A lot of data is available All information is accurate Values don’t change

Oct 20, 2003 9
What some people expectWhat some people expect
Perfect bandwidth info Number of operations in an application Scalar value of computer “power” Mapping of “power” to applications Perfect load information

Oct 20, 2003 10
Bandwidth dataBandwidth data
Network Weather Service (Wolski, UCSB)– 64k probe BW data– Latency data– Predictions
Pinger (Les Cotrell, SLAC)– Create long term baselines for expectations on
means/medians and variability for response time, throughput, packet loss
Predicting TCP performance– Allen Downey– http://allendowney.com/research/tcp/
But what do Grid applications need?

Oct 20, 2003 11
Perfect Bandwidth DataPerfect Bandwidth Data
64 k probes don’t look like large file transfers
LBL-ANL GridFTP (approximately 400 transfers at irregular intervals) end-to-end bandwidth and NWS (approximately 1,500 probes every five minutes) probe bandwidth for the two-week August’01 dataset.

Oct 20, 2003 12
Predicting Large File TransfersPredicting Large File Transfers
Vazhkudai and Schopf: use GridFTP logs and some background data - NWS, ioStat (HPDC 2002)– Error rate of ~15%
M. Faerman A. Su, R. Wolski, and F. Berman (HPDC 99)– Similar results for SARA data
Hu and Schopf: use an AI learning technique on GridFTP log files only (not published yet)– Picks best place to get a file from 60-80% of time,
using averages only gives you ~50% “best chosen” This topic needs much more study!

Oct 20, 2003 13
Data GenerallyData GenerallyAvailable From an ApplicationAvailable From an Application
What some scheduling approaches want:– Number of ops in an application
– Exact execution time on a platform
– Perfect models of applications

Oct 20, 2003 14
Application DataApplication DataCurrently AvailableCurrently Available
Bad models of applications No models of applications
– Some work (Propehsy, Taylor at Texas A&M) does logging to create models
Many interesting applications have non-deterministic run times
User estimates of application run time (historically) off by 20%+
We need to be able to figure out ways to do predictions of application run times WITHOUT models

Oct 20, 2003 15
Scalar value of computer “power”Scalar value of computer “power”
MDS2 gives me:– CPU vendor, model and version
– CPU speed
– OS name, release and version
– RAM size
– Node count
– CPU count Where is “compute power” in this data?

Oct 20, 2003 16
What is compute “power”What is compute “power”
I could get benchmark data, but what’s the right benchmark(s) to use?
Computer “power” simply isn’t scalar, especially in a Grid environment
Goal is really to understand how an application will run on a machine
Given three different benchmarks, 3 different platforms will perform very differently – one best on BM1, another best on BM2

Oct 20, 2003 17
Mapping “power” to applicationsMapping “power” to applications
Many scheduling approaches assume “power” is a scalar – just multiply it by the set application time and we’re set
Only problem:– Power isn’t a scalar
– No one knows absolute application run times
– Mapping will NOT be straight forward
We need a way to estimate application time on a contended system

Oct 20, 2003 18
Perfect Load InformationPerfect Load Information
MDS2 gives me:– Basic queue data
– Host load 5/10/15 min avg
– Last value only

Oct 20, 2003 19
Load PredictionsLoad Predictions
Network weather service– 12+ prediction techniques
– Work on any time series
– Expect regularly arriving data Only a prediction of the next value
– *I* want to know what load is going to be like in 20 mins
– Or the AVERAGE over the next 20 mins?

Oct 20, 2003 20
Information and SchedulingInformation and Scheduling
What approaches expect us to have What we actually have access to How it changes What to do about changing data

Oct 20, 2003 21
Dedicated SOR ExperimentsDedicated SOR Experiments
Platform- 2 Sparc 2’s. 1 Sparc 5, 1 Sparc 10 10 mbit ethernet connection Quiescent machines and network Prediction within 3% before memory spill

Oct 20, 2003 22
Non-dedicated SOR resultsNon-dedicated SOR results
Available CPU on workstations varied from .43 to .53

Oct 20, 2003 23
SOR with Higher VarianceSOR with Higher Variancein CPU Availabilityin CPU Availability

Oct 20, 2003 24
Improving predictionsImproving predictions
Available CPU has range of 0.48 +/- 0.05 Prediction should also have a range

Oct 20, 2003 25
Scheduling needsScheduling needsto consider varianceto consider variance
Conservative Scheduling: Using Predicted Variance to Improve Scheduling Decisions in Dynamic Environments
– Lingyun Yang, Jennifer M. Schopf, Ian Foster
– To appear at SC'03, November 15-21, 2003, Phoenix, Arizona, USA
– www.mcs.anl.gov/~jms/Pubs/lingyun-SC-scheduling.pdf

Oct 20, 2003 26
Scheduling with VarianceScheduling with Variance
Summary: Scheduling with variance can give better mean performance and less variance in overall execution time

Oct 20, 2003 27
Lessons:Lessons:
We need work predicting large file transfers – NOT bandwidth
We need to be able to figure out ways to do predictions of application run times WITHOUT models
We need predictions over time periods – not just a next value
We need a way to represent “power” of a machine, that takes variance into account
We need a way to map power to application behavior We need better scheduling approaches that take
variance into account

Oct 20, 2003 28
Contact InformationContact Information
Jennifer M. Schopf [email protected] www.mcs.anl.gov/~jms
– Links to some of the publications mentioned
– Links to the co-edited book “Grid resource Management: State of the Art and Future Trends”