
Informatics Solutions for Smart Metering Systems …revistaie.ase.ro/content/76/03 - Oprea,...
15
28 Informatica Economică vol. 19, no. 4/2015 DOI: 10.12948/issn14531305/19.4.2015.03 Informatics Solutions for Smart Metering Systems Integration Simona-Vasilica OPREA, Ion LUNGU The Bucharest University of Economic Studies, Romania [email protected], [email protected] In this paper different aspects regarding smart metering systems integration have been de- picted. Smart metering systems, renewable energy sources integration and advanced tariff sys- tems implementation require informatics solution that could automatically collect and process data, forecast the behavior of electricity consumers, analyze trends regarding electricity prices, optimize the consumption of consumers, provide friendly interfaces, etc. They are advanced technologies that represent solutions for insufficient conventional primary energy sources, gas emissions, dependency on energy sources located outside European Union and issues related to energy efficiency. This paper mainly describes several informatics solutions correlated with operational requirements for smart metering system and our proposal for simplified architec- ture of smart metering systems, with three distinct levels (base level, middle level and top level) and load profile calculation methods. Keywords: Operational Requirements, Internet of Things, Architecture of Smart Metering Sys- tems, Renewables Integration, Load Profile, Data Warehouse Introduction Smart grid concept is not a new one; it has been defined since October 1997 by three pio- neers Khoi Vu, Miroslav M. Begovic, Damir Novosel in Grids get smart protection and control, published in IEEE Journal Computer Applications in Power [1]. Since 1997, thou- sands of papers, books and thesis have been written. Smart grids include modern systems and equipment governed by informatics technol- ogy that collect data and take decisions based on electricity consumers and prosumers in or- der to improve efficiency, reliability, eco- nomic aspects and sustainability of generation, transmission, distribution and energy supply of electricity consumers. The most known smart grid components are protections through relays and automatics, En- ergy Management System/Supervisory Con- trol And Data Acquisition EMS/SCADA, smart meters, integrated communication sys- tems, decision support systems and advanced interfaces. Smart metering systems allow electricity con- sumers to have an active role, by managing programmable consumption, by using storage equipment and supplying as prosumers the na- tional grid with electricity produced by small size wind generators or solar panels according to the electricity price fluctuation. Smart metering systems allows grid operators and suppliers to better plan their resources, re- duce energy losses, estimate necessary energy that should be acquired in order to cover losses, eliminate costs regarding meters read- ing and integrate a higher volume of renewa- ble energy sources. In Romania, there are 9,000,000 electricity consumers, out of which 8,380,000 household electricity consumers, 600,000 small and me- dium size non-household electricity consum- ers and 20,000 big non-household electricity consumers. Only 75,000 consumers have smart metering with automatic reading (AMR – automatic meter reading) and approximately 15,300 consumers have complex smart meters (AMI – advanced metering infrastructure and AMM – advanced metering management) [2]. Meters communicate with concentrators and central points of network operators by optic fi- bre installed on overhead lines PLC (Power Line Communication), GPRS (General Packet Radio Service), etc. Only 1% of Romanian electricity consumers have installed smart me- ters. European strategies regarding integration of renewable energy sources and implementation of smart metering systems have been taken 1
Transcript of Informatics Solutions for Smart Metering Systems …revistaie.ase.ro/content/76/03 - Oprea,...
28 Informatica Economică vol. 19, no. 4/2015
DOI: 10.12948/issn14531305/19.4.2015.03
Informatics Solutions for Smart Metering Systems Integration
Simona-Vasilica OPREA, Ion LUNGU The Bucharest University of Economic Studies, Romania
[email protected], [email protected] In this paper different aspects regarding smart metering systems integration have been de-picted. Smart metering systems, renewable energy sources integration and advanced tariff sys-tems implementation require informatics solution that could automatically collect and process data, forecast the behavior of electricity consumers, analyze trends regarding electricity prices, optimize the consumption of consumers, provide friendly interfaces, etc. They are advanced technologies that represent solutions for insufficient conventional primary energy sources, gas emissions, dependency on energy sources located outside European Union and issues related to energy efficiency. This paper mainly describes several informatics solutions correlated with operational requirements for smart metering system and our proposal for simplified architec-ture of smart metering systems, with three distinct levels (base level, middle level and top level) and load profile calculation methods. Keywords: Operational Requirements, Internet of Things, Architecture of Smart Metering Sys-tems, Renewables Integration, Load Profile, Data Warehouse
Introduction Smart grid concept is not a new one; it has
been defined since October 1997 by three pio-neers Khoi Vu, Miroslav M. Begovic, Damir Novosel in Grids get smart protection and control, published in IEEE Journal Computer Applications in Power [1]. Since 1997, thou-sands of papers, books and thesis have been written. Smart grids include modern systems and equipment governed by informatics technol-ogy that collect data and take decisions based on electricity consumers and prosumers in or-der to improve efficiency, reliability, eco-nomic aspects and sustainability of generation, transmission, distribution and energy supply of electricity consumers. The most known smart grid components are protections through relays and automatics, En-ergy Management System/Supervisory Con-trol And Data Acquisition EMS/SCADA, smart meters, integrated communication sys-tems, decision support systems and advanced interfaces. Smart metering systems allow electricity con-sumers to have an active role, by managing programmable consumption, by using storage equipment and supplying as prosumers the na-tional grid with electricity produced by small size wind generators or solar panels according
to the electricity price fluctuation. Smart metering systems allows grid operators and suppliers to better plan their resources, re-duce energy losses, estimate necessary energy that should be acquired in order to cover losses, eliminate costs regarding meters read-ing and integrate a higher volume of renewa-ble energy sources. In Romania, there are 9,000,000 electricity consumers, out of which 8,380,000 household electricity consumers, 600,000 small and me-dium size non-household electricity consum-ers and 20,000 big non-household electricity consumers. Only 75,000 consumers have smart metering with automatic reading (AMR – automatic meter reading) and approximately 15,300 consumers have complex smart meters (AMI – advanced metering infrastructure and AMM – advanced metering management) [2]. Meters communicate with concentrators and central points of network operators by optic fi-bre installed on overhead lines PLC (Power Line Communication), GPRS (General Packet Radio Service), etc. Only 1% of Romanian electricity consumers have installed smart me-ters. European strategies regarding integration of renewable energy sources and implementation of smart metering systems have been taken
1
Informatica Economică vol. 19, no. 4/2015 29
DOI: 10.12948/issn14531305/19.4.2015.03
over into Romanian legislation as national tar-gets. For implementation of smart metering systems, Romanian National Regulatory Au-thority approved gradually implementation of these systems by grid operators so that until 2020, about 80% of energy consumers should benefit from smart metering systems. 2 Operational Requirements of Smart Me-ters and Informatics Solutions One important integration issue of smart me-tering systems consists in interoperability of these systems and their architecture. We should consider that smart metering systems usually belong to different grid operators; therefore a proper approach is to implement an open standard communication protocol. Interoperability of smart metering systems could be performed by setting minimal opera-tional requirements. These requirements were established by several regulations at European level [3]. They have been taken over into na-tional level [4]. Operational requirements have been divided into five categories: requirements for electric-
ity consumers, grid operators, suppliers, secu-rity and data protection, distributed produc-tion. The first category includes supplying updates of records or other information such as elec-tricity price. Based on updated information, consumers can change behaviour: reduction of the peak consumption, increasing of off-peak consumption as a consequence of finan-cial incentives. Electricity consumers’ behav-iour influences grid investment due to flatten-ing of load curve, renewable energy sources integration, greenhouse emissions reduction, etc. Information updates should be performed at certain intervals so that to allow consumer to react. It is recommended to update readings at 15 minutes. For grid operators, smart metering systems should allow remote readings that will reduce operators’ expenses regarding meters reading and billing based on real consumption. Also, smart metering systems should allow bidirec-tional communication and provide sufficient readings so that operators could better plan their resources (i.e. grid capacity).
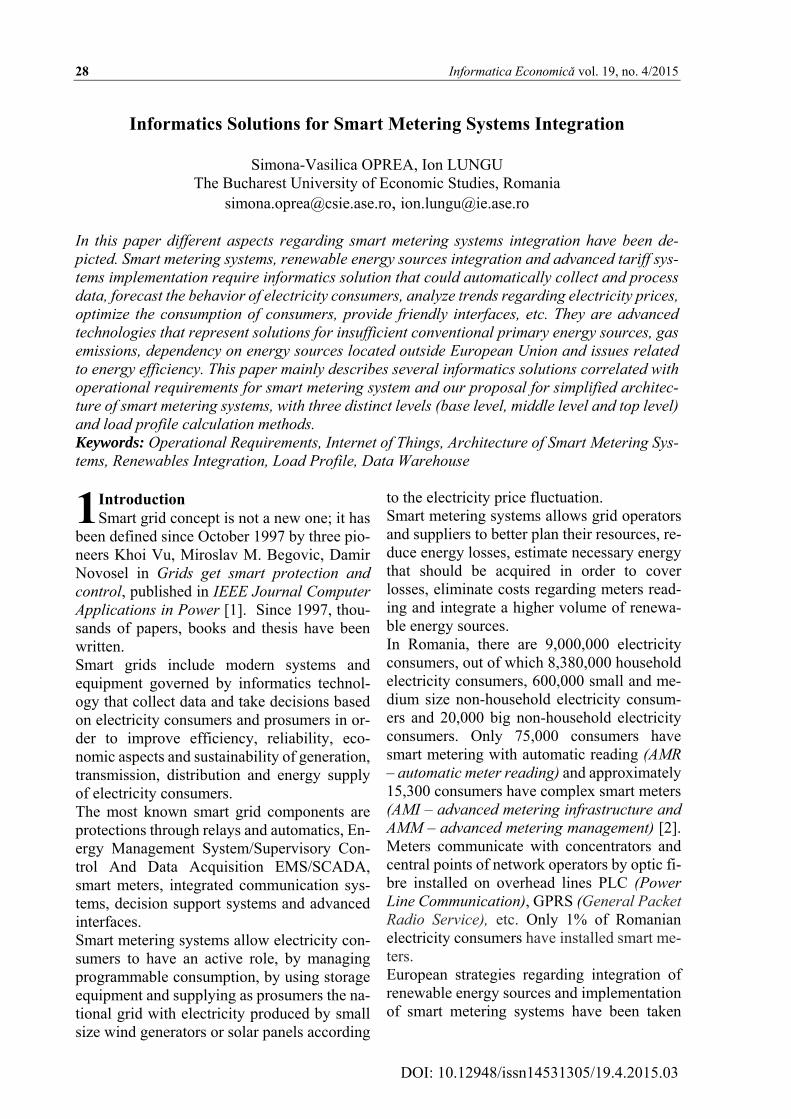
Fig. 1. Informatics solutions for smart metering data
After ETL process has been performed, these data could be stored into a data warehouse.
For each consumer could be set queries and reports. Results of these analyses are provided
30 Informatica Economică vol. 19, no. 4/2015
DOI: 10.12948/issn14531305/19.4.2015.03
to electricity consumers. Data processed as strategic reports is provided to top level man-agers of grid operators. For this task, business intelligence tools are recommended (data mining, OLAP) as in Figure 1. From the electricity supplying point of view, smart metering systems should be correlated with advanced tariff systems, so that to inform
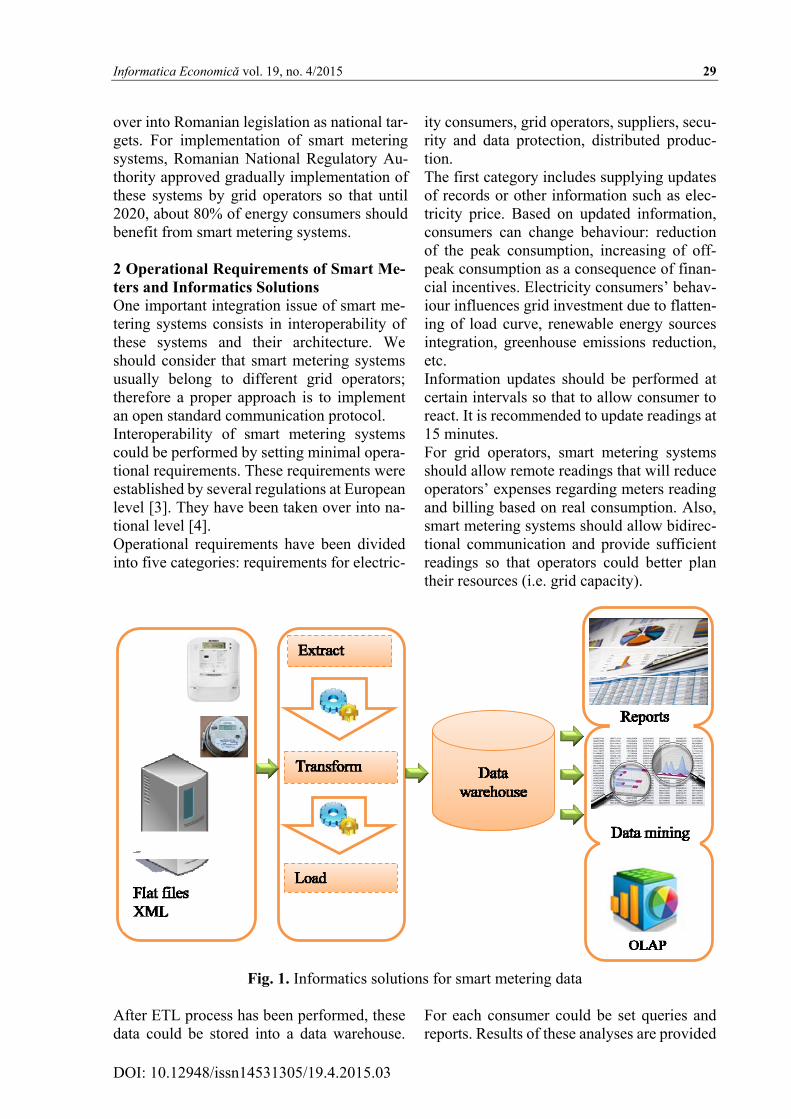
consumers regarding tariff options. Without advanced tariff systems, requirements at the electricity consumers’ level could not reach the target. Smart metering systems should al-low remote connection/disconnection of re-ceivers by sensors and Internet of Things means, Figure 2, which will provide cost re-duction.
Fig. 2. Internet of Things concept
The advanced tariff systems are also involved into electricity consumption optimization tools. The most known advanced tariff sys-tems are: time-of-use tariff, critical peak pric-ing tariff, real time tariff, etc. As for security and data protection require-ments, these are essential for both grid opera-tors due to the decisions they take based on metering data and consumers that are not will-ing to disclose private information regarding their electricity consumption. Smart metering systems should be able to detect frauds. This will also reduce commercial losses. In terms of distributed generation require-ments, smart metering systems should also al-low, apart from consumption of electricity from the grid, generation and supplying of electricity of local sources (small wind tur-bines, solar panels) to the grid. Smart meter-ing systems should also allow metering of re-active energy. This way, local distributed gen-eration is encouraged. Local generation has several advantages such as lower loading of
national grids, losses reduction due to long distances transmission and distribution, re-placement of conventional sources with re-newable energy ones, reaching national tar-gets regarding RES integration, environment protection, etc. The most difficult requirement is related to frequency and availability of updates to the electricity consumers. This operational re-quirement will enhance reactions from con-sumers’ side. From pilot projects experiences, incentives for consumers should be efficient, otherwise, they will be not interested to manage consumption and most of the operational requirements of smart metering systems will become useless. 3 Smart Metering System Architecture Smart metering systems are electronic devices that measure electricity consumption, allow secured bidirectional data transmission from/to electricity consumers and supply more
Informatica Economică vol. 19, no. 4/2015 31
DOI: 10.12948/issn14531305/19.4.2015.03
information than a regular meter, by using tel-ecommunications. Smart metering systems contain subsystems for metering, subsystems for data transmission and subsystems for data management that are provided by meters. Smart metering systems hourly (or even at 15 minutes) measure electricity consumption us-ing metering electronic devices, transmit rec-orded data and send it to unified and complex data management system. Heterogeneity of metering devices imposes data integration components by using universal standards that allow loading and validating data in a central-ized manner. According to [5] and [6], these components are part of advanced metering infrastructure – AMI that measures, collects, analyses energy
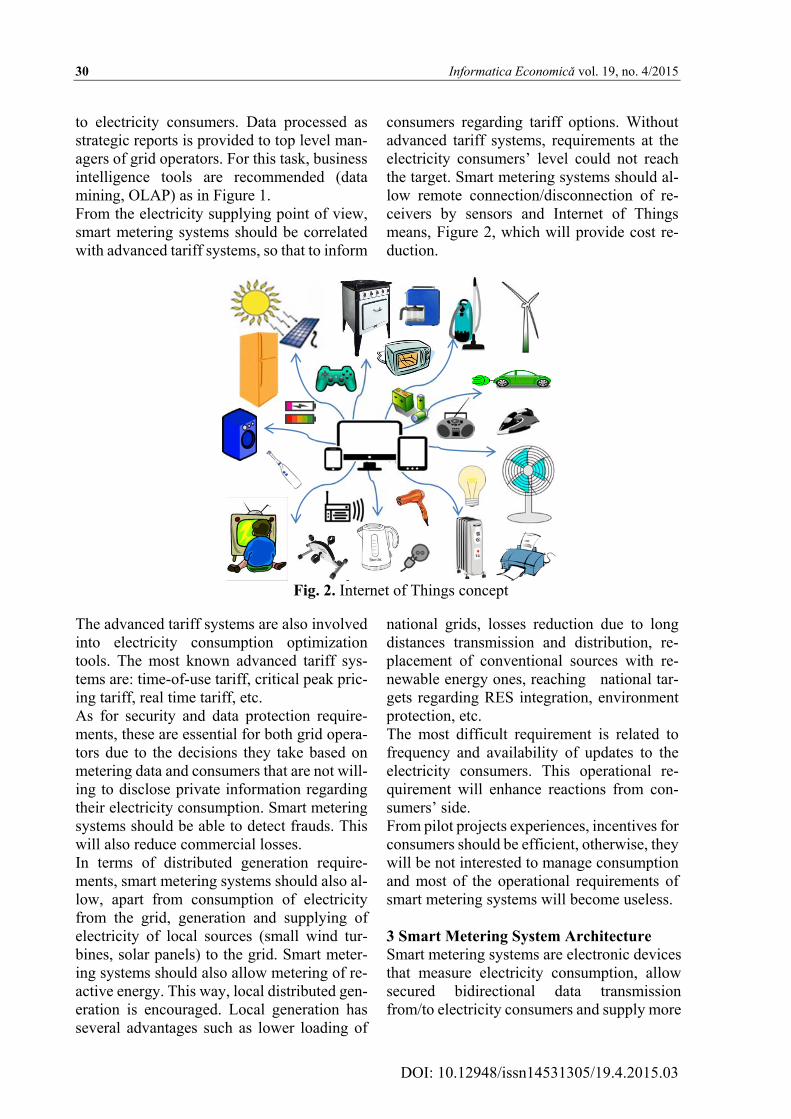
consumption and facilitate communications with metering devices. AMI includes hard-ware components, telecommunication net-works, interfaces, controllers for electricity consumers, software components for meter data management – MDM. According to [7], the most important advanced architecture and infrastructure for smart metering systems are: Roadmap E-Energy/Smart Grid, NIST IOP Roadmap, IEC SMB SG 3, BMWi E-Energy Program, BDI initiative – Internet der Energy, Microsoft SERA, CIGRE D2.24, European Union Mandate CEN/CENELEC M/441, etc. Starting from common characteristics of these architectures, in Figure 3 we present simpli-fied architecture of smart metering systems.
Fig. 3. Simplified architecture for SMS
By integration with grid operators and elec-tricity suppliers’ informatics systems and by analyses facilities, smart metering systems could be included into management infor-mation systems – MIS. According to [8], MIS are necessary for current tactic decision assis-tance for short term control and planning. MIS architecture is structured on four distinct lev-els, according to [8] and [9]:
Data level – represent data sources level, database management system level and metadata dictionaries level. In order to or-ganize data for data processing, it is nec-essary to follow a couple of stages: collec-tion and validation of data from several sources, data cleansing and transforming, data loading into databases or data ware-houses;
32 Informatica Economică vol. 19, no. 4/2015
DOI: 10.12948/issn14531305/19.4.2015.03
Models level – represent the level of com-puting models and data analyses that are necessary for management requirements. As for obtaining models mathematic, sta-tistics methods, data mining algorithms, predictive analyses could be used, etc.;
Interfaces level – contains applications and tools for data dynamic analyses pre-sented into an interactive form with flexi-ble analyses facilities;
Telecommunications level – contains the set of interconnection elements for previ-ous levels and includes computer net-works, communication devices and sup-port for distributed software.
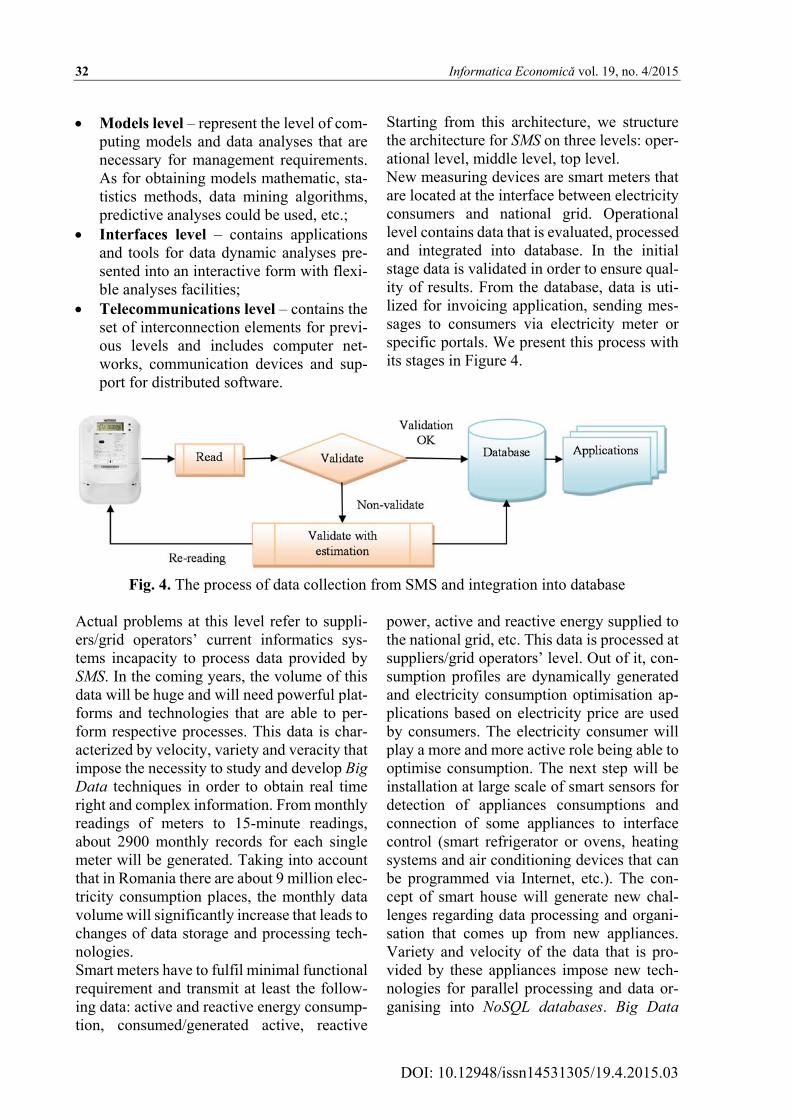
Starting from this architecture, we structure the architecture for SMS on three levels: oper-ational level, middle level, top level. New measuring devices are smart meters that are located at the interface between electricity consumers and national grid. Operational level contains data that is evaluated, processed and integrated into database. In the initial stage data is validated in order to ensure qual-ity of results. From the database, data is uti-lized for invoicing application, sending mes-sages to consumers via electricity meter or specific portals. We present this process with its stages in Figure 4.
Fig. 4. The process of data collection from SMS and integration into database
Actual problems at this level refer to suppli-ers/grid operators’ current informatics sys-tems incapacity to process data provided by SMS. In the coming years, the volume of this data will be huge and will need powerful plat-forms and technologies that are able to per-form respective processes. This data is char-acterized by velocity, variety and veracity that impose the necessity to study and develop Big Data techniques in order to obtain real time right and complex information. From monthly readings of meters to 15-minute readings, about 2900 monthly records for each single meter will be generated. Taking into account that in Romania there are about 9 million elec-tricity consumption places, the monthly data volume will significantly increase that leads to changes of data storage and processing tech-nologies. Smart meters have to fulfil minimal functional requirement and transmit at least the follow-ing data: active and reactive energy consump-tion, consumed/generated active, reactive
power, active and reactive energy supplied to the national grid, etc. This data is processed at suppliers/grid operators’ level. Out of it, con-sumption profiles are dynamically generated and electricity consumption optimisation ap-plications based on electricity price are used by consumers. The electricity consumer will play a more and more active role being able to optimise consumption. The next step will be installation at large scale of smart sensors for detection of appliances consumptions and connection of some appliances to interface control (smart refrigerator or ovens, heating systems and air conditioning devices that can be programmed via Internet, etc.). The con-cept of smart house will generate new chal-lenges regarding data processing and organi-sation that comes up from new appliances. Variety and velocity of the data that is pro-vided by these appliances impose new tech-nologies for parallel processing and data or-ganising into NoSQL databases. Big Data
Informatica Economică vol. 19, no. 4/2015 33
DOI: 10.12948/issn14531305/19.4.2015.03
technologies for smart metering industry are presented in [10], [11]. All data collected from sensors are processed based on a standard flow [12]. Data collected from meters, sensors and smart appliances are transmitted via telecommunication system to the main server where cleansing and pro-cessing by Apache Hadoop clusters or data-base in memory take place. After data cleans-ing and validation, this is transmitted to the analytic server where models and algorithms are applied in order to obtain consumption profiles, optimisation and other computation regarding energy requirements, electricity prices, etc. Information is analysed via ad-vanced analytic tools.
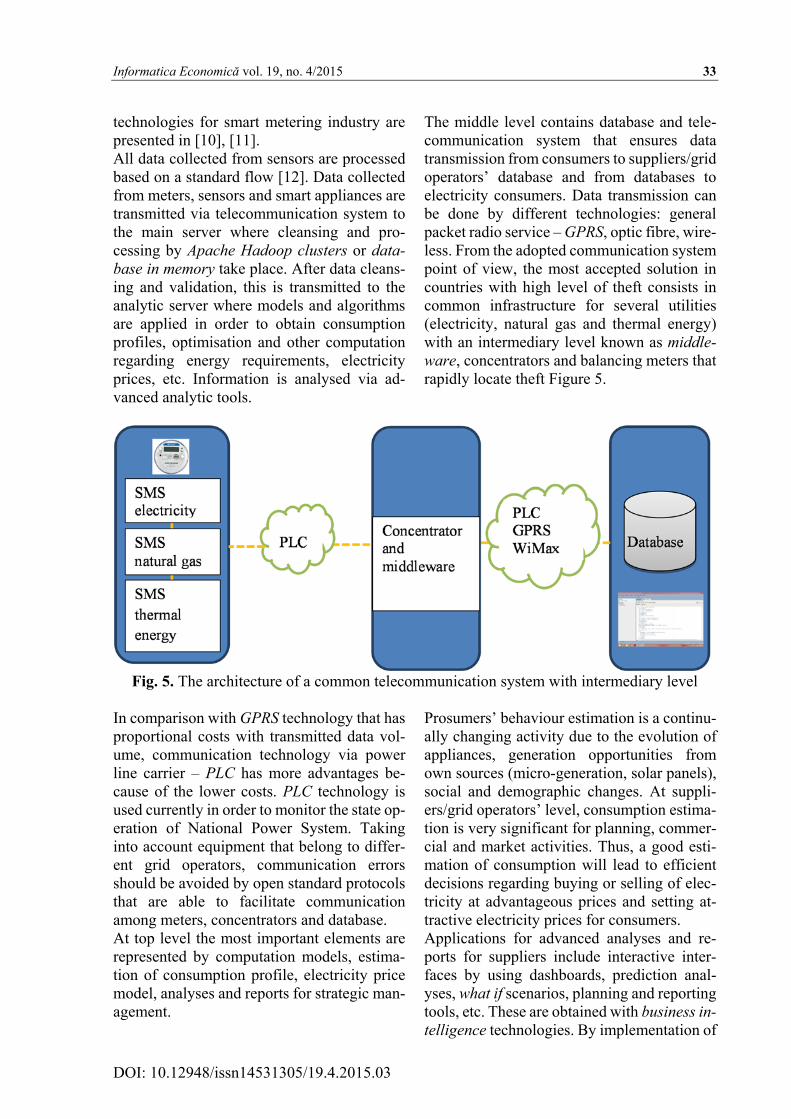
The middle level contains database and tele-communication system that ensures data transmission from consumers to suppliers/grid operators’ database and from databases to electricity consumers. Data transmission can be done by different technologies: general packet radio service – GPRS, optic fibre, wire-less. From the adopted communication system point of view, the most accepted solution in countries with high level of theft consists in common infrastructure for several utilities (electricity, natural gas and thermal energy) with an intermediary level known as middle-ware, concentrators and balancing meters that rapidly locate theft Figure 5.
Fig. 5. The architecture of a common telecommunication system with intermediary level
In comparison with GPRS technology that has proportional costs with transmitted data vol-ume, communication technology via power line carrier – PLC has more advantages be-cause of the lower costs. PLC technology is used currently in order to monitor the state op-eration of National Power System. Taking into account equipment that belong to differ-ent grid operators, communication errors should be avoided by open standard protocols that are able to facilitate communication among meters, concentrators and database. At top level the most important elements are represented by computation models, estima-tion of consumption profile, electricity price model, analyses and reports for strategic man-agement.
Prosumers’ behaviour estimation is a continu-ally changing activity due to the evolution of appliances, generation opportunities from own sources (micro-generation, solar panels), social and demographic changes. At suppli-ers/grid operators’ level, consumption estima-tion is very significant for planning, commer-cial and market activities. Thus, a good esti-mation of consumption will lead to efficient decisions regarding buying or selling of elec-tricity at advantageous prices and setting at-tractive electricity prices for consumers. Applications for advanced analyses and re-ports for suppliers include interactive inter-faces by using dashboards, prediction anal-yses, what if scenarios, planning and reporting tools, etc. These are obtained with business in-telligence technologies. By implementation of
34 Informatica Economică vol. 19, no. 4/2015
DOI: 10.12948/issn14531305/19.4.2015.03
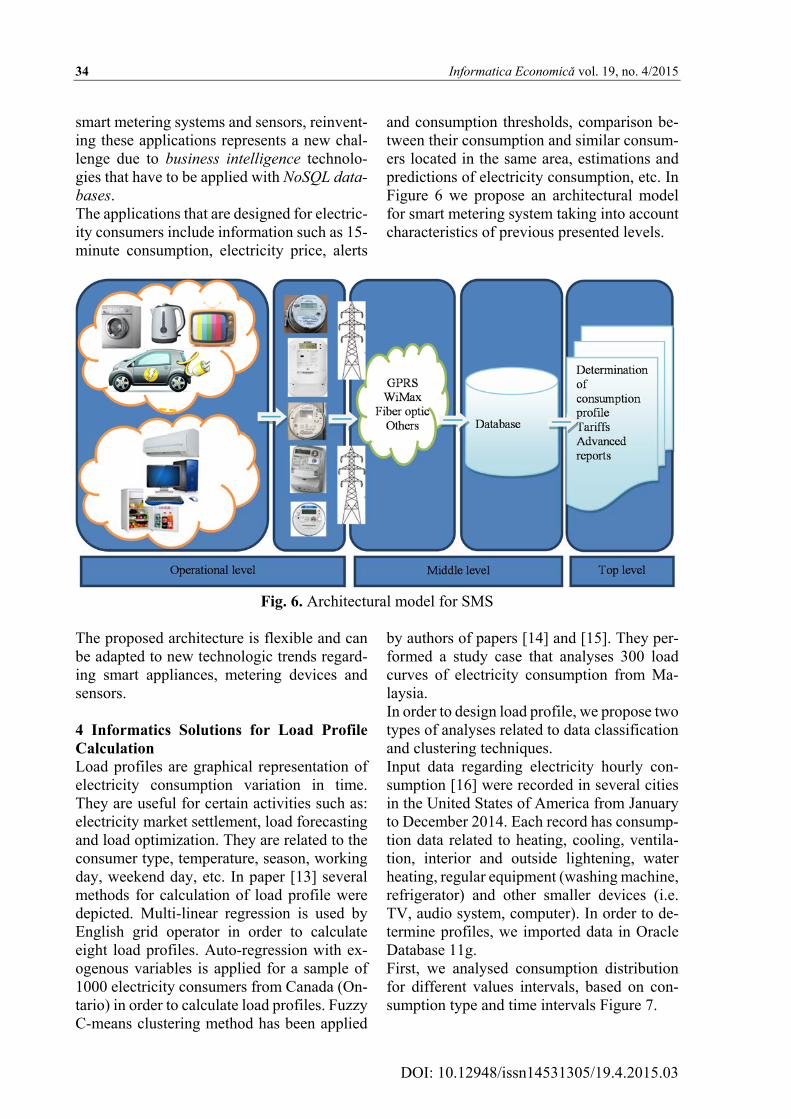
smart metering systems and sensors, reinvent-ing these applications represents a new chal-lenge due to business intelligence technolo-gies that have to be applied with NoSQL data-bases. The applications that are designed for electric-ity consumers include information such as 15-minute consumption, electricity price, alerts
and consumption thresholds, comparison be-tween their consumption and similar consum-ers located in the same area, estimations and predictions of electricity consumption, etc. In Figure 6 we propose an architectural model for smart metering system taking into account characteristics of previous presented levels.
Fig. 6. Architectural model for SMS
The proposed architecture is flexible and can be adapted to new technologic trends regard-ing smart appliances, metering devices and sensors. 4 Informatics Solutions for Load Profile Calculation Load profiles are graphical representation of electricity consumption variation in time. They are useful for certain activities such as: electricity market settlement, load forecasting and load optimization. They are related to the consumer type, temperature, season, working day, weekend day, etc. In paper [13] several methods for calculation of load profile were depicted. Multi-linear regression is used by English grid operator in order to calculate eight load profiles. Auto-regression with ex-ogenous variables is applied for a sample of 1000 electricity consumers from Canada (On-tario) in order to calculate load profiles. Fuzzy C-means clustering method has been applied
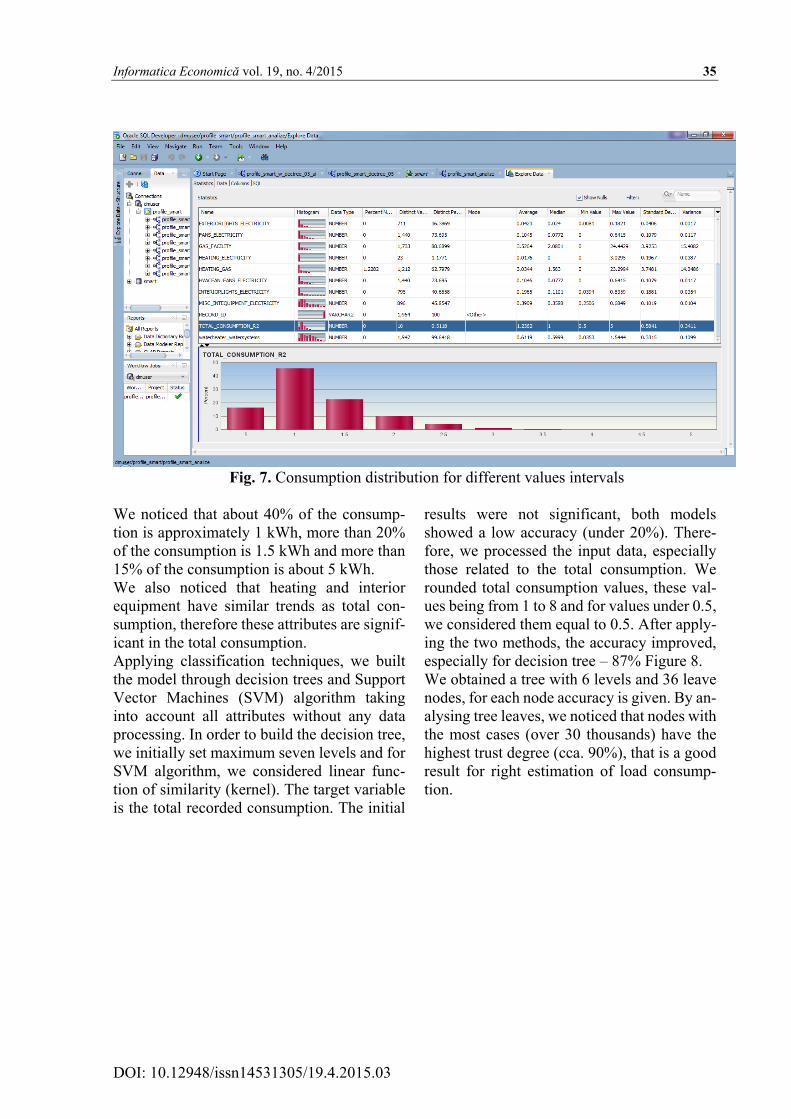
by authors of papers [14] and [15]. They per-formed a study case that analyses 300 load curves of electricity consumption from Ma-laysia. In order to design load profile, we propose two types of analyses related to data classification and clustering techniques. Input data regarding electricity hourly con-sumption [16] were recorded in several cities in the United States of America from January to December 2014. Each record has consump-tion data related to heating, cooling, ventila-tion, interior and outside lightening, water heating, regular equipment (washing machine, refrigerator) and other smaller devices (i.e. TV, audio system, computer). In order to de-termine profiles, we imported data in Oracle Database 11g. First, we analysed consumption distribution for different values intervals, based on con-sumption type and time intervals Figure 7.
Informatica Economică vol. 19, no. 4/2015 35
DOI: 10.12948/issn14531305/19.4.2015.03
Fig. 7. Consumption distribution for different values intervals
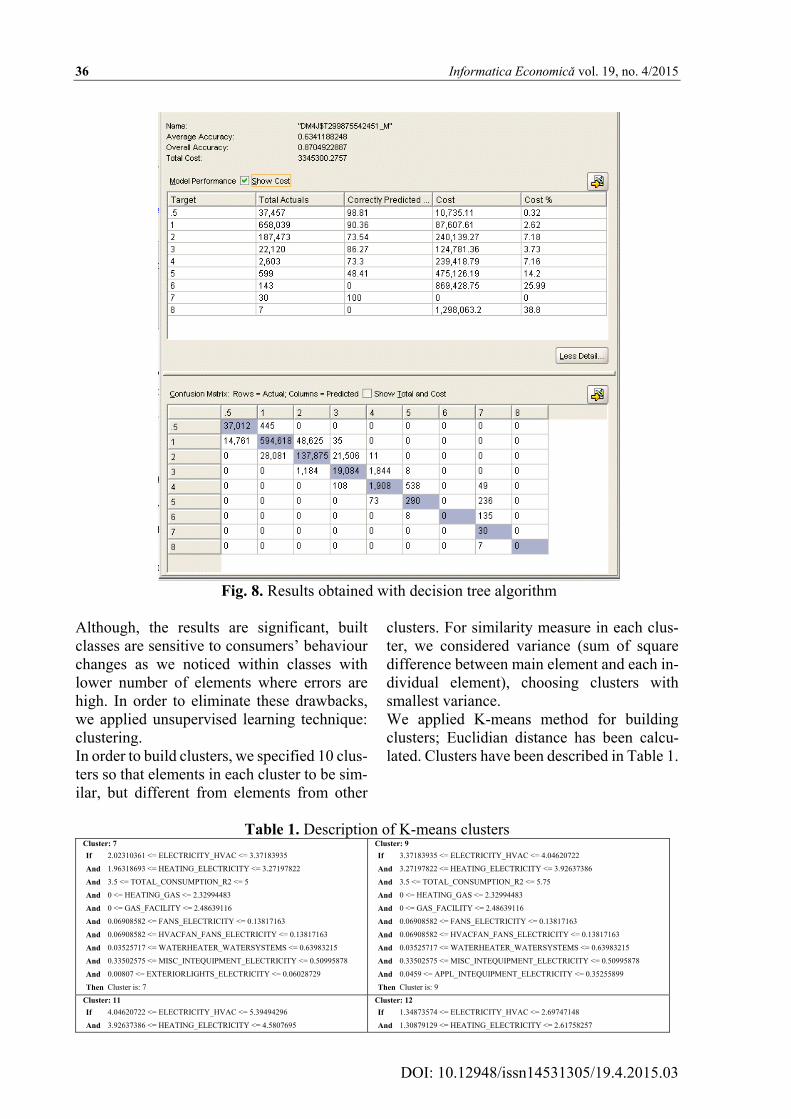
We noticed that about 40% of the consump-tion is approximately 1 kWh, more than 20% of the consumption is 1.5 kWh and more than 15% of the consumption is about 5 kWh. We also noticed that heating and interior equipment have similar trends as total con-sumption, therefore these attributes are signif-icant in the total consumption. Applying classification techniques, we built the model through decision trees and Support Vector Machines (SVM) algorithm taking into account all attributes without any data processing. In order to build the decision tree, we initially set maximum seven levels and for SVM algorithm, we considered linear func-tion of similarity (kernel). The target variable is the total recorded consumption. The initial
results were not significant, both models showed a low accuracy (under 20%). There-fore, we processed the input data, especially those related to the total consumption. We rounded total consumption values, these val-ues being from 1 to 8 and for values under 0.5, we considered them equal to 0.5. After apply-ing the two methods, the accuracy improved, especially for decision tree – 87% Figure 8. We obtained a tree with 6 levels and 36 leave nodes, for each node accuracy is given. By an-alysing tree leaves, we noticed that nodes with the most cases (over 30 thousands) have the highest trust degree (cca. 90%), that is a good result for right estimation of load consump-tion.
36 Informatica Economică vol. 19, no. 4/2015
DOI: 10.12948/issn14531305/19.4.2015.03
Fig. 8. Results obtained with decision tree algorithm
Although, the results are significant, built classes are sensitive to consumers’ behaviour changes as we noticed within classes with lower number of elements where errors are high. In order to eliminate these drawbacks, we applied unsupervised learning technique: clustering. In order to build clusters, we specified 10 clus-ters so that elements in each cluster to be sim-ilar, but different from elements from other
clusters. For similarity measure in each clus-ter, we considered variance (sum of square difference between main element and each in-dividual element), choosing clusters with smallest variance. We applied K-means method for building clusters; Euclidian distance has been calcu-lated. Clusters have been described in Table 1.
Table 1. Description of K-means clusters
Cluster: 7
If 2.02310361 <= ELECTRICITY_HVAC <= 3.37183935
And 1.96318693 <= HEATING_ELECTRICITY <= 3.27197822
And 3.5 <= TOTAL_CONSUMPTION_R2 <= 5
And 0 <= HEATING_GAS <= 2.32994483
And 0 <= GAS_FACILITY <= 2.48639116
And 0.06908582 <= FANS_ELECTRICITY <= 0.13817163
And 0.06908582 <= HVACFAN_FANS_ELECTRICITY <= 0.13817163
And 0.03525717 <= WATERHEATER_WATERSYSTEMS <= 0.63983215
And 0.33502575 <= MISC_INTEQUIPMENT_ELECTRICITY <= 0.50995878
And 0.00807 <= EXTERIORLIGHTS_ELECTRICITY <= 0.06028729
Then Cluster is: 7
Cluster: 9
If 3.37183935 <= ELECTRICITY_HVAC <= 4.04620722
And 3.27197822 <= HEATING_ELECTRICITY <= 3.92637386
And 3.5 <= TOTAL_CONSUMPTION_R2 <= 5.75
And 0 <= HEATING_GAS <= 2.32994483
And 0 <= GAS_FACILITY <= 2.48639116
And 0.06908582 <= FANS_ELECTRICITY <= 0.13817163
And 0.06908582 <= HVACFAN_FANS_ELECTRICITY <= 0.13817163
And 0.03525717 <= WATERHEATER_WATERSYSTEMS <= 0.63983215
And 0.33502575 <= MISC_INTEQUIPMENT_ELECTRICITY <= 0.50995878
And 0.0459 <= APPL_INTEQUIPMENT_ELECTRICITY <= 0.35255899
Then Cluster is: 9
Cluster: 11
If 4.04620722 <= ELECTRICITY_HVAC <= 5.39494296
And 3.92637386 <= HEATING_ELECTRICITY <= 4.5807695
Cluster: 12
If 1.34873574 <= ELECTRICITY_HVAC <= 2.69747148
And 1.30879129 <= HEATING_ELECTRICITY <= 2.61758257
Informatica Economică vol. 19, no. 4/2015 37
DOI: 10.12948/issn14531305/19.4.2015.03
And 5 <= TOTAL_CONSUMPTION_R2 <= 6.5
And 0 <= HEATING_GAS <= 2.32994483
And 0 <= GAS_FACILITY <= 2.48639116
And 0.06908582 <= FANS_ELECTRICITY <= 0.20725745
And 0.06908582 <= HVACFAN_FANS_ELECTRICITY <= 0.20725745
And 0.03525717 <= WATERHEATER_WATERSYSTEMS <= 0.63983215
And 0.00807 <= EXTERIORLIGHTS_ELECTRICITY <= 0.06028729
And 0.33502575 <= MISC_INTEQUIPMENT_ELECTRICITY <= 0.50995878
Then Cluster is: 11
And 2 <= TOTAL_CONSUMPTION_R2 <= 4.25
And 0 <= HEATING_GAS <= 2.32994483
And 0 <= GAS_FACILITY <= 2.48639116
And 0 <= FANS_ELECTRICITY <= 0.06908582
And 0 <= HVACFAN_FANS_ELECTRICITY <= 0.06908582
And 0.03525717 <= WATERHEATER_WATERSYSTEMS <= 0.63983215
And 0.33502575 <= MISC_INTEQUIPMENT_ELECTRICITY <= 0.5974253
And 0.00807 <= EXTERIORLIGHTS_ELECTRICITY <= 0.06028729
Then Cluster is: 12
Cluster: 13
If 0.67436787 <= ELECTRICITY_HVAC <= 2.02310361
And 0.65439564 <= HEATING_ELECTRICITY <= 1.96318693
And 0 <= HEATING_GAS <= 2.32994483
And 0 <= GAS_FACILITY <= 2.48639116
And 0 <= FANS_ELECTRICITY <= 0.06908582
And 0 <= HVACFAN_FANS_ELECTRICITY <= 0.06908582
And 1.25 <= TOTAL_CONSUMPTION_R2 <= 3.5
And 0.03525717 <= WATERHEATER_WATERSYSTEMS <= 0.63983215
And 0.29129249 <= MISC_INTEQUIPMENT_ELECTRICITY <= 0.68489181
And 0.00807 <= EXTERIORLIGHTS_ELECTRICITY <= 0.06028729
Then Cluster is: 13
Cluster: 15
If 0.5 <= TOTAL_CONSUMPTION_R2 <= 2
And 0 <= HEATING_GAS <= 9.31977932
And 0 <= GAS_FACILITY <= 9.94556464
And 0 <= ELECTRICITY_HVAC <= 0.67436787
And 0 <= FANS_ELECTRICITY <= 0.27634326
And 0 <= COOLING_ELECTRICITY <= 0.33052529
And 0 <= HEATING_ELECTRICITY <= 0.65439564
And 0 <= HVACFAN_FANS_ELECTRICITY <= 0.27634326
And 0.03525717 <= WATERHEATER_WATERSYSTEMS <= 1.24440713
And 0.00807 <= EXTERIORLIGHTS_ELECTRICITY <= 0.07769305
Then Cluster is: 15
Cluster: 16
If 0.67436787 <= ELECTRICITY_HVAC <= 2.69747148
And 0.66105059 <= COOLING_ELECTRICITY <= 1.98315177
And 0.20725745 <= FANS_ELECTRICITY <= 0.48360071
And 0.20725745 <= HVACFAN_FANS_ELECTRICITY <= 0.48360071
And 2 <= TOTAL_CONSUMPTION_R2 <= 4.25
And 0 <= HEATING_GAS <= 2.32994483
And 0 <= GAS_FACILITY <= 2.48639116
And 0.18640092 <= WATERHEATER_WATERSYSTEMS <= 0.63983215
And 0.26494213 <= APPL_INTEQUIPMENT_ELECTRICITY <= 0.44017584
And 0.24755923 <= MISC_INTEQUIPMENT_ELECTRICITY <= 0.50995878
Then Cluster is: 16
Cluster: 17
If 0 <= HEATING_GAS <= 2.32994483
And 0 <= GAS_FACILITY <= 2.48639116
And 0 <= ELECTRICITY_HVAC <= 1.34873574
And 0 <= COOLING_ELECTRICITY <= 0.66105059
And 0.03525717 <= WATERHEATER_WATERSYSTEMS <= 0.7909759
And 0.24755923 <= MISC_INTEQUIPMENT_ELECTRICITY <= 0.55369204
And 1.25 <= TOTAL_CONSUMPTION_R2 <= 2.75
And 0.00807 <= EXTERIORLIGHTS_ELECTRICITY <= 0.11250458
And 0.03936766 <= INTERIORLIGHTS_ELECTRICITY <= 0.51730445
And 0.06908582 <= FANS_ELECTRICITY <= 0.27634326
Then Cluster is: 17
Cluster: 18
If 5.39494296 <= ELECTRICITY_HVAC <= 6.7436787
And 5.23516515 <= HEATING_ELECTRICITY <= 6.54395643
And 6.5 <= TOTAL_CONSUMPTION_R2 <= 8
And 0 <= GAS_FACILITY <= 2.48639116
And 0.13817163 <= FANS_ELECTRICITY <= 0.20725745
And 0.13817163 <= HVACFAN_FANS_ELECTRICITY <= 0.20725745
And 0.03525717 <= WATERHEATER_WATERSYSTEMS <= 0.63983215
And 0.00807 <= EXTERIORLIGHTS_ELECTRICITY <= 0.02547576
And 0.33502575 <= MISC_INTEQUIPMENT_ELECTRICITY <= 0.46622552
And 0.0459 <= APPL_INTEQUIPMENT_ELECTRICITY <= 0.26494213
Then Cluster is: 18
Cluster: 19
If 4.72057509 <= ELECTRICITY_HVAC <= 6.06931083
And 4.5807695 <= HEATING_ELECTRICITY <= 5.88956079
And 5.75 <= TOTAL_CONSUMPTION_R2 <= 7.25
And 0 <= HEATING_GAS <= 2.32994483
And 0 <= GAS_FACILITY <= 2.48639116
And 0.13817163 <= FANS_ELECTRICITY <= 0.20725745
And 0.13817163 <= HVACFAN_FANS_ELECTRICITY <= 0.20725745
And 0.03525717 <= WATERHEATER_WATERSYSTEMS <= 0.63983215
And 0.00807 <= EXTERIORLIGHTS_ELECTRICITY <= 0.06028729
And 0.33502575 <= MISC_INTEQUIPMENT_ELECTRICITY <= 0.50995878
Then Cluster is: 19
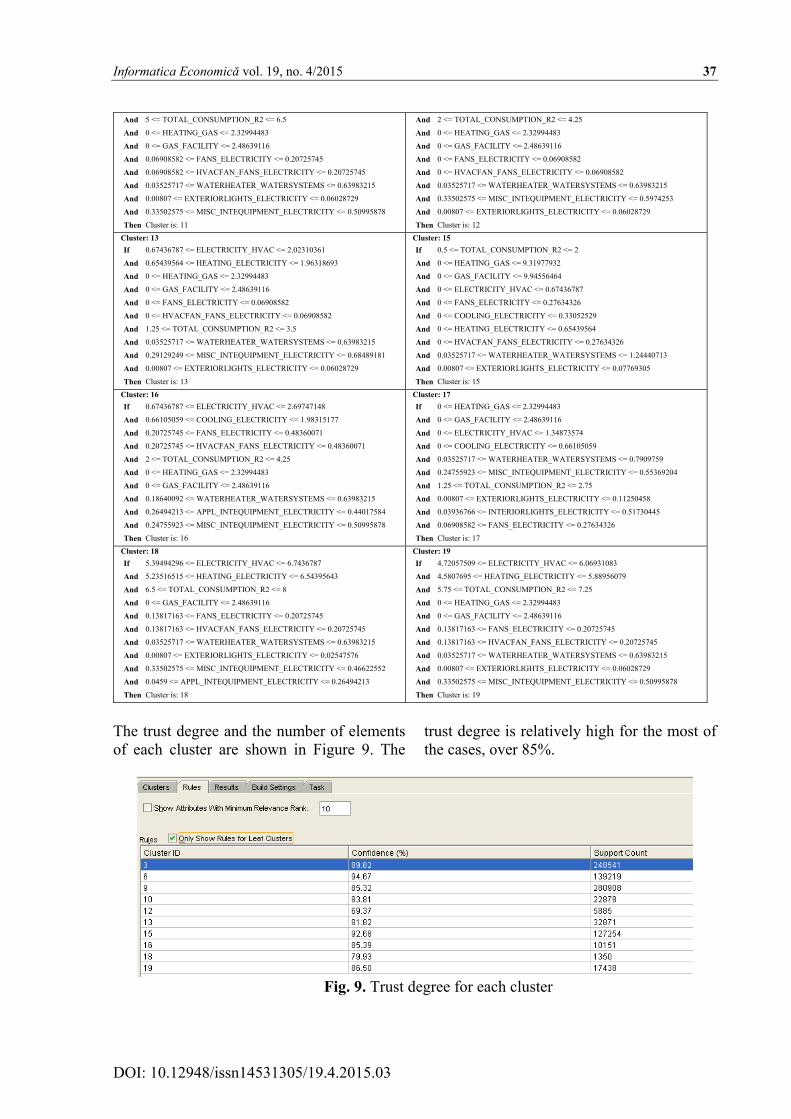
The trust degree and the number of elements of each cluster are shown in Figure 9. The
trust degree is relatively high for the most of the cases, over 85%.
Fig. 9. Trust degree for each cluster
38 Informatica Economică vol. 19, no. 4/2015
DOI: 10.12948/issn14531305/19.4.2015.03
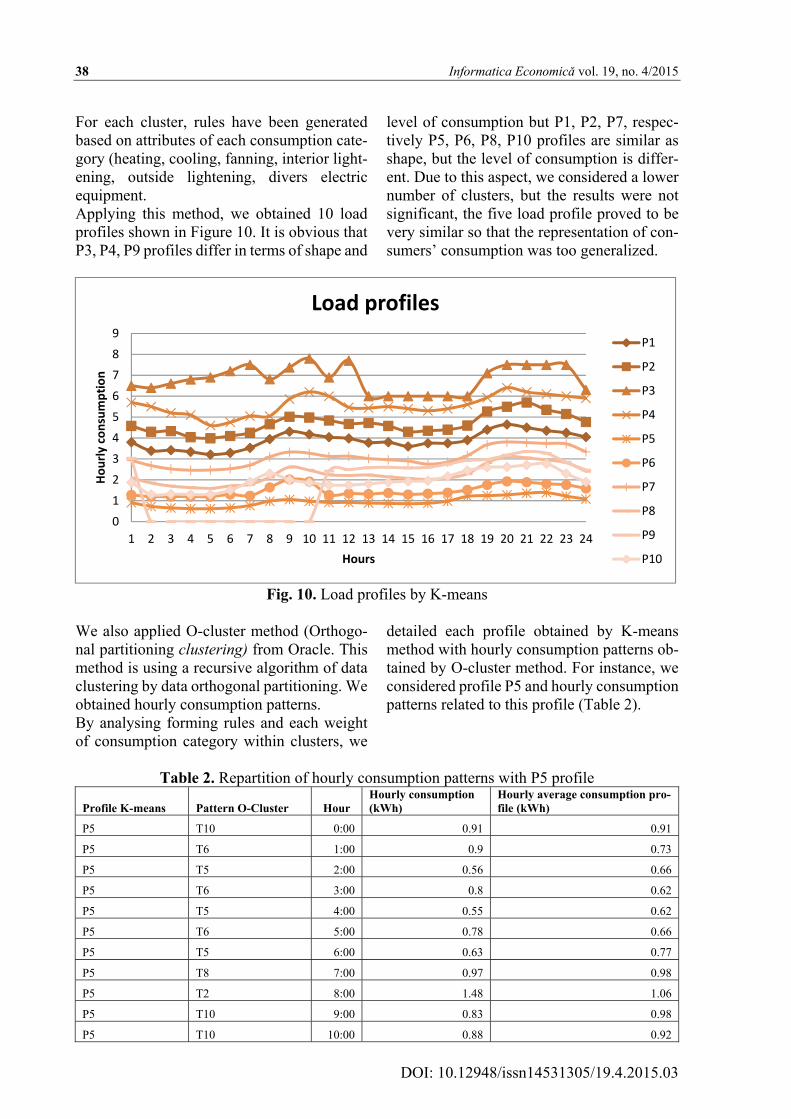
For each cluster, rules have been generated based on attributes of each consumption cate-gory (heating, cooling, fanning, interior light-ening, outside lightening, divers electric equipment. Applying this method, we obtained 10 load profiles shown in Figure 10. It is obvious that P3, P4, P9 profiles differ in terms of shape and
level of consumption but P1, P2, P7, respec-tively P5, P6, P8, P10 profiles are similar as shape, but the level of consumption is differ-ent. Due to this aspect, we considered a lower number of clusters, but the results were not significant, the five load profile proved to be very similar so that the representation of con-sumers’ consumption was too generalized.
Fig. 10. Load profiles by K-means
We also applied O-cluster method (Orthogo-nal partitioning clustering) from Oracle. This method is using a recursive algorithm of data clustering by data orthogonal partitioning. We obtained hourly consumption patterns. By analysing forming rules and each weight of consumption category within clusters, we
detailed each profile obtained by K-means method with hourly consumption patterns ob-tained by O-cluster method. For instance, we considered profile P5 and hourly consumption patterns related to this profile (Table 2).
Table 2. Repartition of hourly consumption patterns with P5 profile
Profile K-means Pattern O-Cluster Hour Hourly consumption (kWh)
Hourly average consumption pro-file (kWh)
P5 T10 0:00 0.91 0.91
P5 T6 1:00 0.9 0.73
P5 T5 2:00 0.56 0.66
P5 T6 3:00 0.8 0.62
P5 T5 4:00 0.55 0.62
P5 T6 5:00 0.78 0.66
P5 T5 6:00 0.63 0.77
P5 T8 7:00 0.97 0.98
P5 T2 8:00 1.48 1.06
P5 T10 9:00 0.83 0.98
P5 T10 10:00 0.88 0.92
0
1
2
3
4
5
6
7
8
9
1 2 3 4 5 6 7 8 9 10 11 12 13 14 15 16 17 18 19 20 21 22 23 24
Hourly consumption
Hours
Load profiles
P1
P2
P3
P4
P5
P6
P7
P8
P9
P10
Informatica Economică vol. 19, no. 4/2015 39
DOI: 10.12948/issn14531305/19.4.2015.03
P5 T2 11:00 1.3 0.92
P5 T10 12:00 0.9 0.89
P5 T3 13:00 1.25 0.87
P5 T10 14:00 0.89 0.86
P5 T3 15:00 1.2 0.88
P5 T3 16:00 1.24 0.98
P5 T10 17:00 1.07 1.21
P5 T2 18:00 1.6 1.25
P5 T11 19:00 1.12 1.28
P5 T3 20:00 1.36 1.36
P5 T3 21:00 1.3 1.39
P5 T4 22:00 1.17 1.22
P5 T4 23:00 1.13 1.08
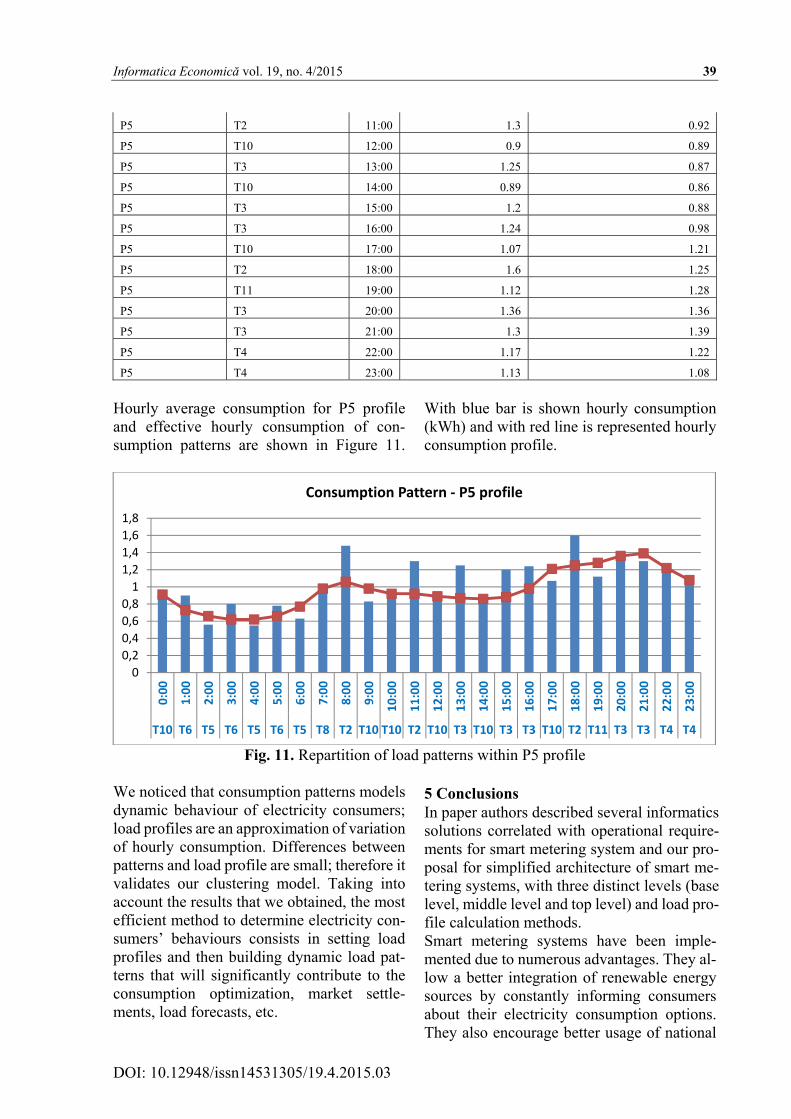
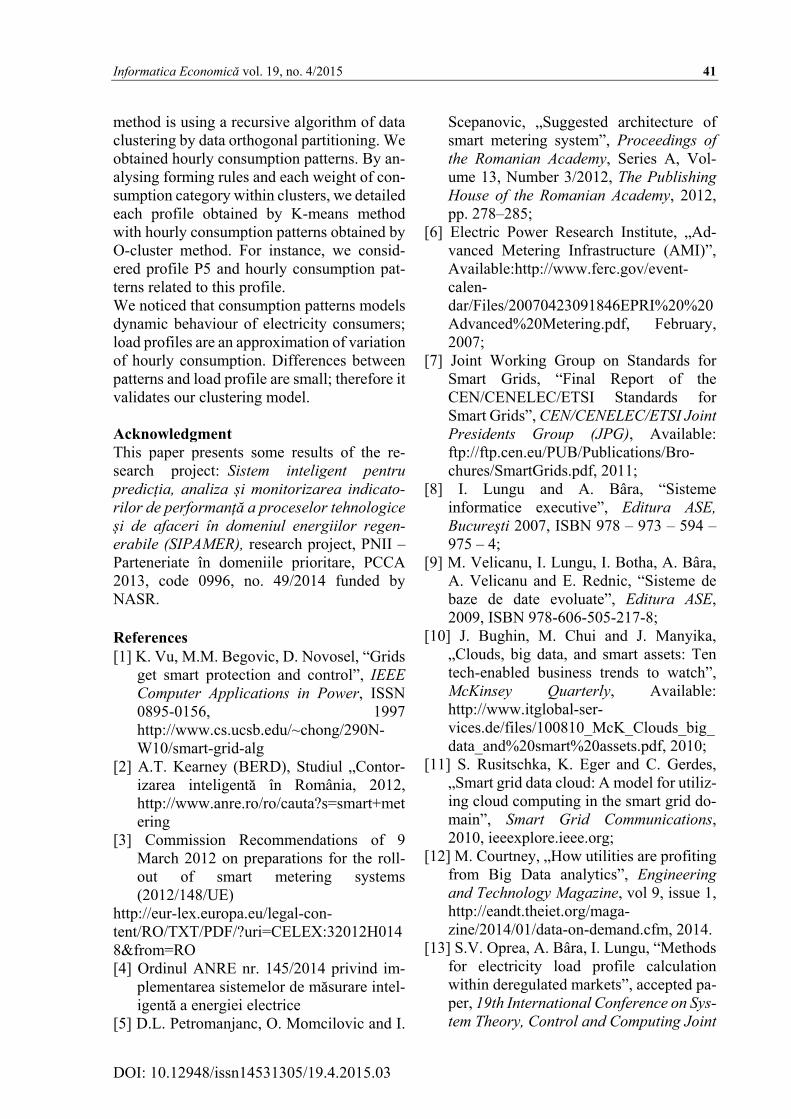
Hourly average consumption for P5 profile and effective hourly consumption of con-sumption patterns are shown in Figure 11.
With blue bar is shown hourly consumption (kWh) and with red line is represented hourly consumption profile.
Fig. 11. Repartition of load patterns within P5 profile
We noticed that consumption patterns models dynamic behaviour of electricity consumers; load profiles are an approximation of variation of hourly consumption. Differences between patterns and load profile are small; therefore it validates our clustering model. Taking into account the results that we obtained, the most efficient method to determine electricity con-sumers’ behaviours consists in setting load profiles and then building dynamic load pat-terns that will significantly contribute to the consumption optimization, market settle-ments, load forecasts, etc.
5 Conclusions In paper authors described several informatics solutions correlated with operational require-ments for smart metering system and our pro-posal for simplified architecture of smart me-tering systems, with three distinct levels (base level, middle level and top level) and load pro-file calculation methods. Smart metering systems have been imple-mented due to numerous advantages. They al-low a better integration of renewable energy sources by constantly informing consumers about their electricity consumption options. They also encourage better usage of national
0
0,2
0,4
0,6
0,8
1
1,2
1,4
1,6
1,8
0:00
1:00
2:00
3:00
4:00
5:00
6:00
7:00
8:00
9:00
10:00
11:00
12:00
13:00
14:00
15:00
16:00
17:00
18:00
19:00
20:00
21:00
22:00
23:00
T10 T6 T5 T6 T5 T6 T5 T8 T2 T10 T10 T2 T10 T3 T10 T3 T3 T10 T2 T11 T3 T3 T4 T4
Consumption Pattern ‐ P5 profile
40 Informatica Economică vol. 19, no. 4/2015
DOI: 10.12948/issn14531305/19.4.2015.03
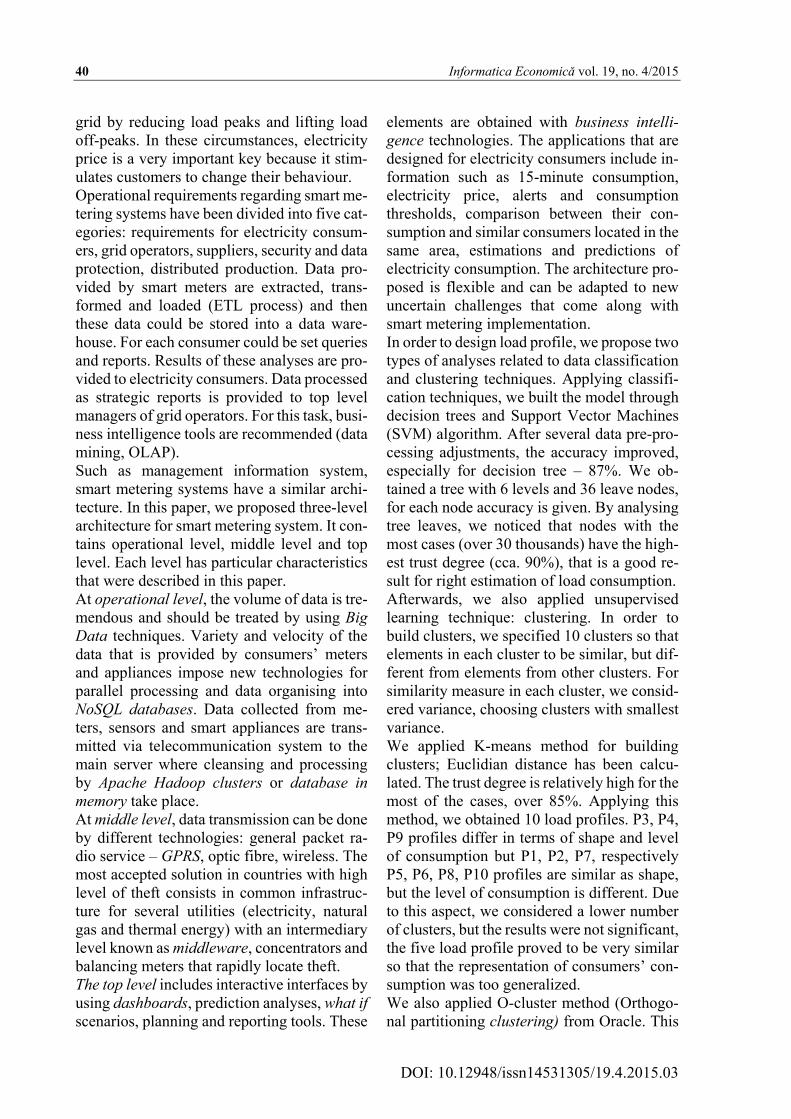
grid by reducing load peaks and lifting load off-peaks. In these circumstances, electricity price is a very important key because it stim-ulates customers to change their behaviour. Operational requirements regarding smart me-tering systems have been divided into five cat-egories: requirements for electricity consum-ers, grid operators, suppliers, security and data protection, distributed production. Data pro-vided by smart meters are extracted, trans-formed and loaded (ETL process) and then these data could be stored into a data ware-house. For each consumer could be set queries and reports. Results of these analyses are pro-vided to electricity consumers. Data processed as strategic reports is provided to top level managers of grid operators. For this task, busi-ness intelligence tools are recommended (data mining, OLAP). Such as management information system, smart metering systems have a similar archi-tecture. In this paper, we proposed three-level architecture for smart metering system. It con-tains operational level, middle level and top level. Each level has particular characteristics that were described in this paper. At operational level, the volume of data is tre-mendous and should be treated by using Big Data techniques. Variety and velocity of the data that is provided by consumers’ meters and appliances impose new technologies for parallel processing and data organising into NoSQL databases. Data collected from me-ters, sensors and smart appliances are trans-mitted via telecommunication system to the main server where cleansing and processing by Apache Hadoop clusters or database in memory take place. At middle level, data transmission can be done by different technologies: general packet ra-dio service – GPRS, optic fibre, wireless. The most accepted solution in countries with high level of theft consists in common infrastruc-ture for several utilities (electricity, natural gas and thermal energy) with an intermediary level known as middleware, concentrators and balancing meters that rapidly locate theft. The top level includes interactive interfaces by using dashboards, prediction analyses, what if scenarios, planning and reporting tools. These
elements are obtained with business intelli-gence technologies. The applications that are designed for electricity consumers include in-formation such as 15-minute consumption, electricity price, alerts and consumption thresholds, comparison between their con-sumption and similar consumers located in the same area, estimations and predictions of electricity consumption. The architecture pro-posed is flexible and can be adapted to new uncertain challenges that come along with smart metering implementation. In order to design load profile, we propose two types of analyses related to data classification and clustering techniques. Applying classifi-cation techniques, we built the model through decision trees and Support Vector Machines (SVM) algorithm. After several data pre-pro-cessing adjustments, the accuracy improved, especially for decision tree – 87%. We ob-tained a tree with 6 levels and 36 leave nodes, for each node accuracy is given. By analysing tree leaves, we noticed that nodes with the most cases (over 30 thousands) have the high-est trust degree (cca. 90%), that is a good re-sult for right estimation of load consumption. Afterwards, we also applied unsupervised learning technique: clustering. In order to build clusters, we specified 10 clusters so that elements in each cluster to be similar, but dif-ferent from elements from other clusters. For similarity measure in each cluster, we consid-ered variance, choosing clusters with smallest variance. We applied K-means method for building clusters; Euclidian distance has been calcu-lated. The trust degree is relatively high for the most of the cases, over 85%. Applying this method, we obtained 10 load profiles. P3, P4, P9 profiles differ in terms of shape and level of consumption but P1, P2, P7, respectively P5, P6, P8, P10 profiles are similar as shape, but the level of consumption is different. Due to this aspect, we considered a lower number of clusters, but the results were not significant, the five load profile proved to be very similar so that the representation of consumers’ con-sumption was too generalized. We also applied O-cluster method (Orthogo-nal partitioning clustering) from Oracle. This
Informatica Economică vol. 19, no. 4/2015 41
DOI: 10.12948/issn14531305/19.4.2015.03
method is using a recursive algorithm of data clustering by data orthogonal partitioning. We obtained hourly consumption patterns. By an-alysing forming rules and each weight of con-sumption category within clusters, we detailed each profile obtained by K-means method with hourly consumption patterns obtained by O-cluster method. For instance, we consid-ered profile P5 and hourly consumption pat-terns related to this profile. We noticed that consumption patterns models dynamic behaviour of electricity consumers; load profiles are an approximation of variation of hourly consumption. Differences between patterns and load profile are small; therefore it validates our clustering model. Acknowledgment This paper presents some results of the re-search project: Sistem inteligent pentru predicția, analiza și monitorizarea indicato-rilor de performanță a proceselor tehnologice și de afaceri în domeniul energiilor regen-erabile (SIPAMER), research project, PNII – Parteneriate în domeniile prioritare, PCCA 2013, code 0996, no. 49/2014 funded by NASR. References [1] K. Vu, M.M. Begovic, D. Novosel, “Grids
get smart protection and control”, IEEE Computer Applications in Power, ISSN 0895-0156, 1997 http://www.cs.ucsb.edu/~chong/290N-W10/smart-grid-alg
[2] A.T. Kearney (BERD), Studiul „Contor-izarea inteligentă în România, 2012, http://www.anre.ro/ro/cauta?s=smart+metering
[3] Commission Recommendations of 9 March 2012 on preparations for the roll-out of smart metering systems (2012/148/UE)
http://eur-lex.europa.eu/legal-con-tent/RO/TXT/PDF/?uri=CELEX:32012H0148&from=RO [4] Ordinul ANRE nr. 145/2014 privind im-
plementarea sistemelor de măsurare intel-igentă a energiei electrice
[5] D.L. Petromanjanc, O. Momcilovic and I.
Scepanovic, „Suggested architecture of smart metering system”, Proceedings of the Romanian Academy, Series A, Vol-ume 13, Number 3/2012, The Publishing House of the Romanian Academy, 2012, pp. 278–285;
[6] Electric Power Research Institute, „Ad-vanced Metering Infrastructure (AMI)”, Available:http://www.ferc.gov/event-calen-dar/Files/20070423091846EPRI%20%20Advanced%20Metering.pdf, February, 2007;
[7] Joint Working Group on Standards for Smart Grids, “Final Report of the CEN/CENELEC/ETSI Standards for Smart Grids”, CEN/CENELEC/ETSI Joint Presidents Group (JPG), Available: ftp://ftp.cen.eu/PUB/Publications/Bro-chures/SmartGrids.pdf, 2011;
[8] I. Lungu and A. Bâra, “Sisteme informatice executive”, Editura ASE, Bucureşti 2007, ISBN 978 – 973 – 594 – 975 – 4;
[9] M. Velicanu, I. Lungu, I. Botha, A. Bâra, A. Velicanu and E. Rednic, “Sisteme de baze de date evoluate”, Editura ASE, 2009, ISBN 978-606-505-217-8;
[10] J. Bughin, M. Chui and J. Manyika, „Clouds, big data, and smart assets: Ten tech-enabled business trends to watch”, McKinsey Quarterly, Available: http://www.itglobal-ser-vices.de/files/100810_McK_Clouds_big_data_and%20smart%20assets.pdf, 2010;
[11] S. Rusitschka, K. Eger and C. Gerdes, „Smart grid data cloud: A model for utiliz-ing cloud computing in the smart grid do-main”, Smart Grid Communications, 2010, ieeexplore.ieee.org;
[12] M. Courtney, „How utilities are profiting from Big Data analytics”, Engineering and Technology Magazine, vol 9, issue 1, http://eandt.theiet.org/maga-zine/2014/01/data-on-demand.cfm, 2014.
[13] S.V. Oprea, A. Bâra, I. Lungu, “Methods for electricity load profile calculation within deregulated markets”, accepted pa-per, 19th International Conference on Sys-tem Theory, Control and Computing Joint

42 Informatica Economică vol. 19, no. 4/2015
DOI: 10.12948/issn14531305/19.4.2015.03
Conference SINTES 19, SACCS 15, SIM-SIS 19, October 14 - 16, 2015, Cheile Gradistei - Fundata Resort, Romania
[14] K.L. Lo, Z. Zakaria, M.H. Sohod, “De-termination of Consumers’ Load Profiles based on Two-stage Fuzzy C-Means”, Proceedings of the 5th WSEAS Int. Conf. on Power Systems and Electromagnetic Compatibility, Corfu, Greece, (pp. 212-217), 2005
[15] Md. Jahangir Hossain, A.N.M. Enamul Kabir, Md. Mostafizur Rahman, Borhan
Kabir, Md Rafiqul Islam, “Determination of Typical Load Profile of Consumers Us-ing Fuzzy C-Means Clustering Algo-rithm”, International Journal of Soft Com-puting and Engineering (IJSCE) ISSN: 2231-2307, Volume-1, Issue-5, 2011
[16] Office of Energy Efficiency & Renewa-ble Energy (EERE), OpenEI, http://en.openei.org/datasets/dataset/com-mercial-and-residential-hourly-load-pro-files-for-all-tmy3-locations-in-the-united-states, consultat în septembrie 2015
Simona-Vasilica OPREA (b. July 14, 1978) is an Assistant at the Economic Informatics Department at the Faculty of Cybernetics, Statistics and Economic Informatics from the Bucharest University of Economic Studies of Bucharest. She has graduated the Polytechnic University in 2001, holds a Master Diploma in Infrastructure Management Program, Yokohama National University, Japan in 2007 and a PhD diploma from 2009. She is the author of over 25 articles. Domains of competence: wind power plant operation, investment opportunity
analysis, studies of prognosis, etc.
Ion LUNGU (b. October 9, 1950) is a Professor at the Economic Informatics Department at the Faculty of Cybernetics, Statistics and Economic Informatics from the Academy of Economic Studies of Bucharest. He has graduated the Faculty of Economic Cybernetics in 1974, holds a PhD diploma in Economics from 1983. He is the author of 22 books in the domain of economic informat-ics, 57 published articles. He participated in more than 20 research projects. He is a CNCSIS expert evaluator and member of the scientific board for the
ISI indexed journal Economic Computation and Economic Cybernetics Studies and Research. He is also a member of INFOREC professional association and honorific member of Economic Independence academic association.