INFORMAL-FORMAL CAREGIVER RELATIONSHIPS WITHIN CARE ...
18
INFORMAL-FORMAL CAREGIVER INFORMAL-FORMAL CAREGIVER INFORMAL-FORMAL CAREGIVER RELATIONSHIPS WITHIN CARE NETWORKS OF OLDER ADULTS. INFORMAL-FORMAL CAREGIVER RELATIONSHIPS WITHIN CARE NETWORKS OF OLDER ADULTS. MARIANNE JACOBS, MSc. 1 1 PROF. DR. MARJOLEIN BROESE VAN GROENOU 1 , PROF. DR. PETER GROENEWEGEN 2 1 VU UNIVERSITY, DEPARTMENT OF SOCIOLOGY 2 VU UNIVERSITY, DEPARTMENT OF ORGANIZATION SCIENCES
Transcript of INFORMAL-FORMAL CAREGIVER RELATIONSHIPS WITHIN CARE ...
INFORMAL-FORMAL CAREGIVER INFORMAL-FORMAL CAREGIVER INFORMAL-FORMAL CAREGIVER RELATIONSHIPS WITHIN CARE NETWORKS OF OLDER ADULTS.
INFORMAL-FORMAL CAREGIVER RELATIONSHIPS WITHIN CARE NETWORKS OF OLDER ADULTS.
MARIANNE JACOBS, MSc.11PROF. DR. MARJOLEIN BROESE VAN GROENOU1,
PROF. DR. PETER GROENEWEGEN2
1VU UNIVERSITY, DEPARTMENT OF SOCIOLOGY2VU UNIVERSITY, DEPARTMENT OF ORGANIZATION SCIENCES

BACKGROUNDBACKGROUND
Rising demand for long-term care for older adults
Shifting responsibilities in both informal and formal care
Policy in Western countries aimed at cooperation: ‘A good connection
between informal and formal caregivers is in the interest of all parties
involved’ (Ministry of Health, Welfare and Sport).
Research (e.g. Jody Gittell: Cooperation is a prerequisite for a good
quality of care)
Mixed care networks
2 Informal-formal caregiver relationships within care networks of older adults.

3 Informal-formal caregiver relationships within care networks of older adults.
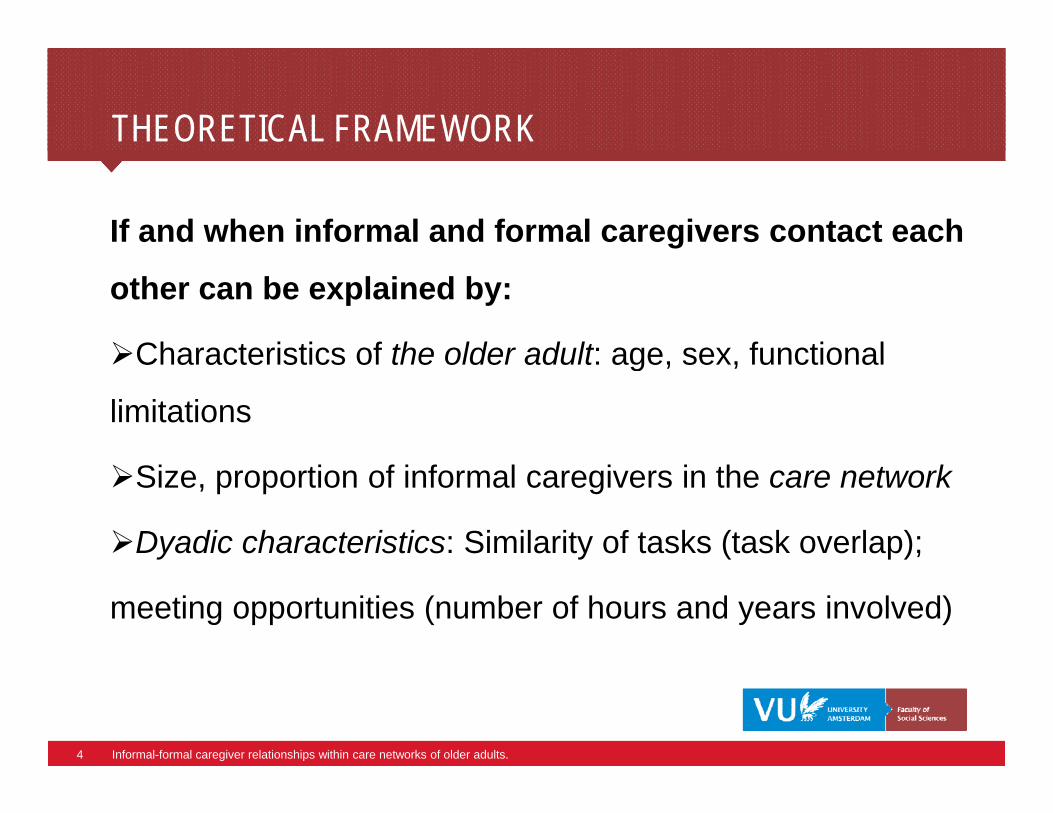
THEORETICAL FRAMEWORKTHEORETICAL FRAMEWORK
If and when informal and formal caregivers contact each
other can be explained by:
Characteristics of the older adult: age sex functionalCharacteristics of the older adult: age, sex, functional
limitations
Size, proportion of informal caregivers in the care network
Dyadic characteristics: Similarity of tasks (task overlap);
meeting opportunities (number of hours and years involved)
4 Informal-formal caregiver relationships within care networks of older adults.

SAMPLESAMPLE
- 119 older adults identified via eight homecare organizations and three voluntary care organizations inorganizations and three voluntary care organizations in Amsterdam and surroundings
- 75 older adults eventually participated:- They were cognitively able to participate in a face-to-face interview- They were aged 65 or older- They received care from at least two types of the following caregivers:
informal caregivers, formal caregivers or volunteers.
- 94 informal caregivers and 102 formal caregivers are interviewed as wellinterviewed as well
5 Informal-formal caregiver relationships within care networks of older adults.

METHODS: EGO-NETWORK OLDER ADULTMETHODS: EGO-NETWORK OLDER ADULT
> For each caregiver:a b
• Relationship to older adult (e.g. partner, nurse))
• Hours of careOLDER
f
• Duration
T pe of care (task
ADULTc
• Type of care (task overlap) e
Faculty of Social Sciences6 Informal-formal caregiver relationships within care networks of older adults.
d

METHODS: CAREGIVING NETWORKMETHODS: CAREGIVING NETWORK
> Cooperation with other caregivers: a b Informal
caregiver
Formalcaregiver
g
> Frequency of contact with..
caregiver
> How well can you cooperate with.. OLDER
fp
> How often do you experience friction
ADULTc
pwith..
e
Faculty of Social Sciences7 Informal-formal caregiver relationships within care networks of older adults.
d

VARIABLESVARIABLES
Older adult and network: Formal and informal caregiver:
Sex & Age
IADL and ADL limitations
Perceived control of the care
Relationship
Hours
DurationPerceived control of the care
Number of caregivers
Proportion informal CG
Duration
Number of tasks
Task overlapProportion informal CG Task overlap
Dependent variable: Contact with other CG (yes/no)
8 Informal-formal caregiver relationships within care networks of older adults.
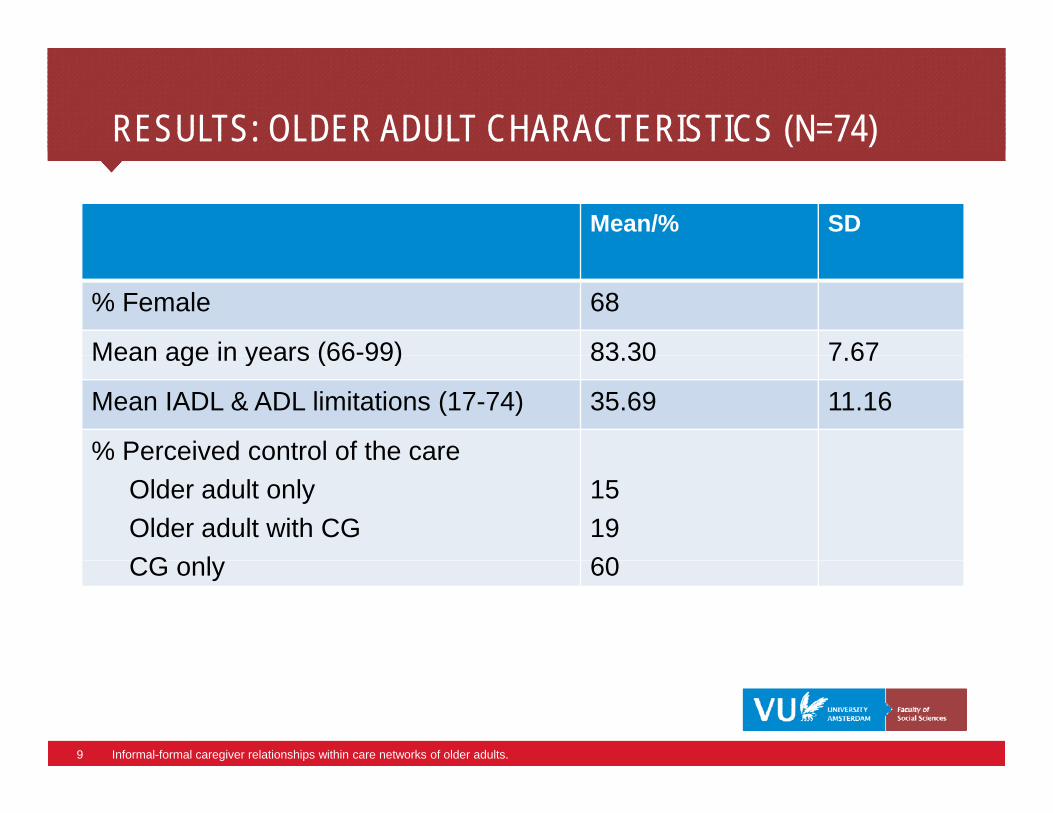
RESULTS: OLDER ADULT CHARACTERISTICS (N=74)RESULTS: OLDER ADULT CHARACTERISTICS (N=74)
Mean/% SD
% Female 68
Mean age in years (66-99) 83 30 7 67Mean age in years (66 99) 83.30 7.67
Mean IADL & ADL limitations (17-74) 35.69 11.16
% Perceived control of the care% Perceived control of the careOlder adult onlyOlder adult with CGCG l
151960CG only 60
9 Informal-formal caregiver relationships within care networks of older adults.

RESULTS: NETWORK CHARACTERISTICSRESULTS: NETWORK CHARACTERISTICS
Mean SD
Number of informal CGs (1-9) 2.97 2.05
N b f f l CG (1 18) 5 82 3 75Number of formal CGs (1-18) 5.82 3.75
Total number of CGs (2-22) 8.80 4.42
Proportion of informal CGs (0.08-0.83) 0.36 0.19
10 Informal-formal caregiver relationships within care networks of older adults.
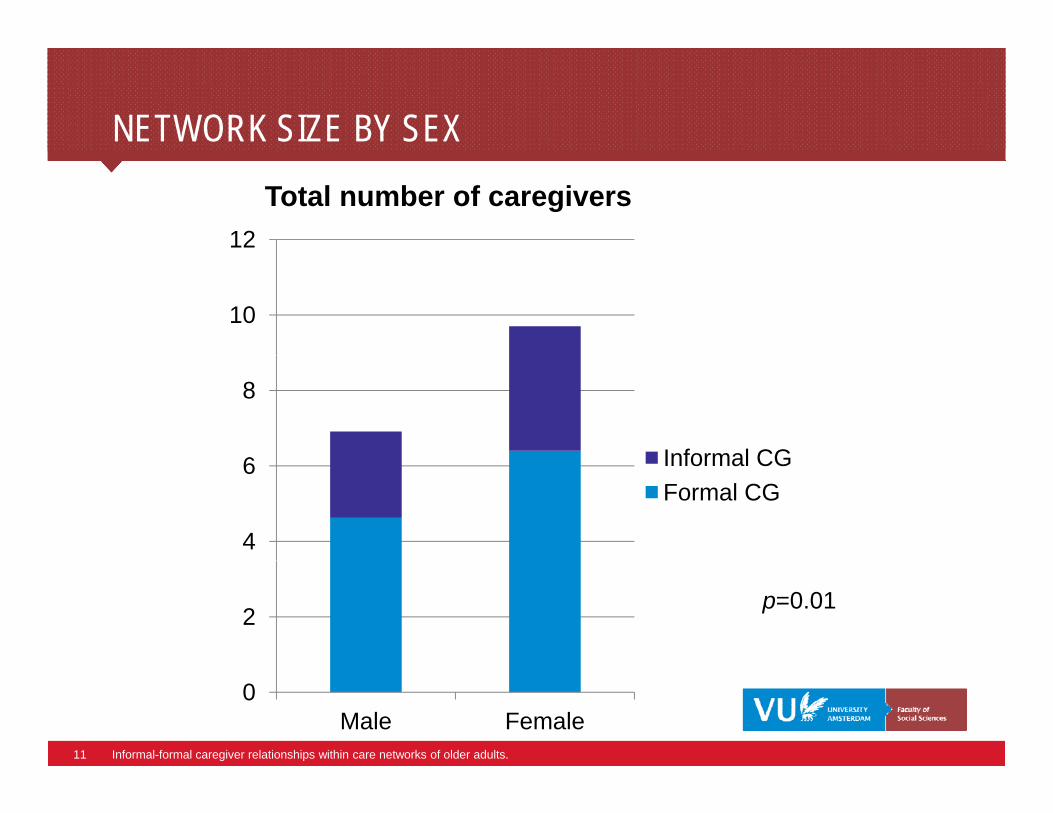
NETWORK SIZE BY SEX NETWORK SIZE BY SEX
12
Total number of caregivers
10
6
8
Informal CG
4
6 Informal CGFormal CG
2p=0.01
11 Informal-formal caregiver relationships within care networks of older adults.
0Male Female

RESULTS: INFORMAL- AND FORMAL CAREGIVER CHARACTERISTICSRESULTS: INFORMAL- AND FORMAL CAREGIVER CHARACTERISTICS
Contact30%
No contact70%
P-value
Relation informal CG1 Partner and children (in law)2 Oth f il
64.330 7
35.769 3
<0.012 Other family3 Friends/neighbours/acquintances4 Volunteers
30.724.52.1
69.375.597.9
Relation formal CG1 Household carer 22.0 78.0 <0.012 Personal carer3 Nurse4 Other
33.336.819 2
66.763.280 8
12 Informal-formal caregiver relationships within care networks of older adults.
4 Other 19.2 80.8

RESULTS: INFORMAL- AND FORMAL CAREGIVER CHARACTERISTICSRESULTS: INFORMAL- AND FORMAL CAREGIVER CHARACTERISTICS
Contact30%
No contact70%
P-value
Mean hours informal CG (0-112) 12.62 4.52 <0.01
Mean duration informal CG in years (0-32)
6.59 4.65 <0.01
Mean hours formal CG (0-21.75) 4.26 4.04 0.54
Mean duration formal CG in years (0- 3.70 4.01 0.47ea du at o o a CG yea s (034)
3 0 0 0
% Task overlap (vs. not) 31.6 21.4 0.01
13 Informal-formal caregiver relationships within care networks of older adults.
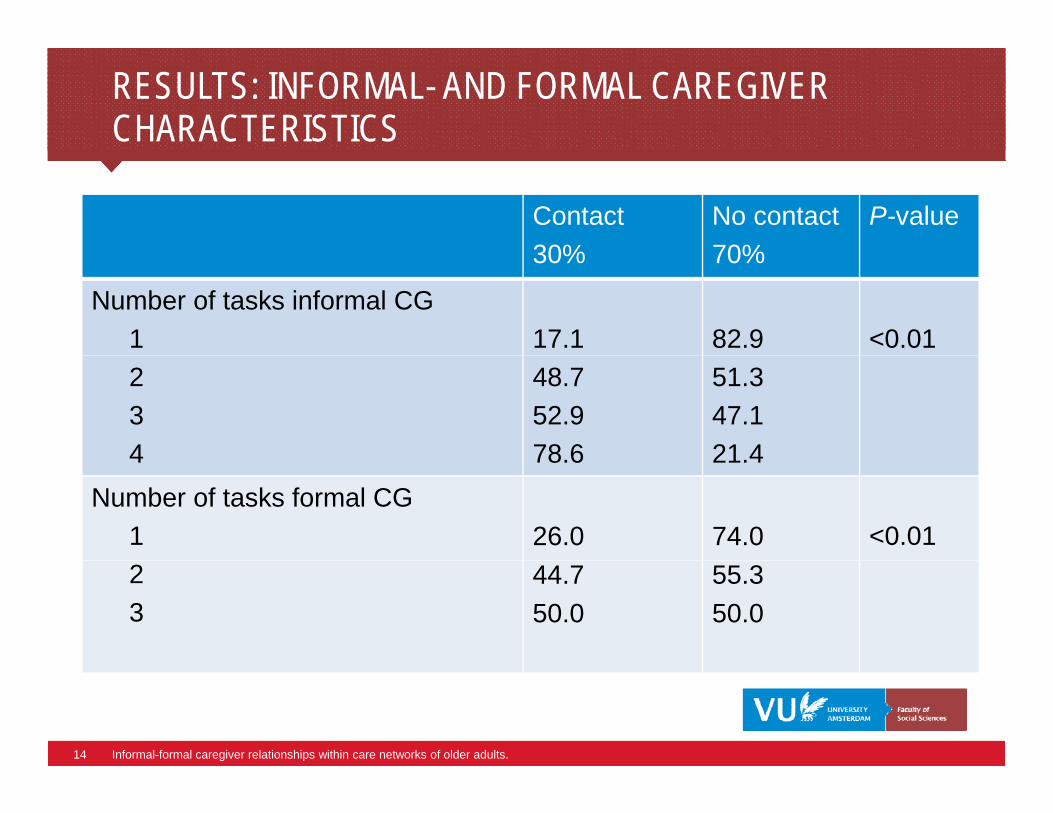
RESULTS: INFORMAL- AND FORMAL CAREGIVER CHARACTERISTICSRESULTS: INFORMAL- AND FORMAL CAREGIVER CHARACTERISTICS
Contact30%
No contact70%
P-value30% 70%
Number of tasks informal CG1 17.1 82.9 <0.01234
48.752.978 6
51.347.121 44 78.6 21.4
Number of tasks formal CG1 26.0 74.0 <0.0123
44.750.0
55.350.0
14 Informal-formal caregiver relationships within care networks of older adults.

RESULTS: MULTILEVEL REGRESSION ANALYSIS (N DYADS=508)RESULTS: MULTILEVEL REGRESSION ANALYSIS (N DYADS=508)
Model 1 Model 3
IADL and ADL limitations older adult 0.043** 0.031
Total number of caregivers -0.101* -0.077
Proportion informal caregivers -4.531*** -3.010
Number of tasks informal caregiver (1-2+) 1.944***g ( )
Number of tasks formal caregiver (1-2+) 1.682**
Informal CG=partner or child 1 360**
*p<0.05 **p<0.01 ***p<0.001N B only significant results showed
Informal CG=partner or child 1.360**
N.B. only significant results showed
15 Informal-formal caregiver relationships within care networks of older adults.

CONCLUSIONCONCLUSION
Large networks with high percentage of formal caregivers Large networks with high percentage of formal caregivers
Contact in few formal-informal relationships
Number of tasks matter The more tasks one caregiver
performs, the higher the chance (s)he will get in contact
ith th iwith other caregivers
16 Informal-formal caregiver relationships within care networks of older adults.

DISCUSSIONDISCUSSION
Policy need for central informal and formal caregiverPolicy need for central informal and formal caregiver
Policy: more tasks per formal caregiver (i.e. less task
differentiation) characteristics of care/voluntary
organization matter as well (see presentation of Marieke van
Wieringen)Wieringen)
17 Informal-formal caregiver relationships within care networks of older adults.

THANK YOU FOR YOUR ATTENTIONTHANK YOU FOR YOUR ATTENTION
More information:[email protected]
Faculty of Social Sciences
j @www.fsw.vu.nl/zorgnetwerk
18 Informal-formal caregiver relationships within care networks of older adults.