Infographic UAE a bridge to South East Asia
1
Telecoms and sound apparatus Gold, non-monetary Road vehicles Non metallic mineral manuf. Misc. manufactured articles 26 19 18 17 14 2015 2014 2013 5.5% 4.2% 4.5% Misc. manufactured articles Gas Gold, non monetary Non metallic mineral manuf. Petroleum and related products 7% 200 26 25 20 9 TOP SOUTH EAST ASIAN DESTINATIONS India 47.2 Thailand 20.9 Taiwan 50 Singapore 19.1 Indonesia 1.9 Malaysia 5.4 Philippines 1.7 Vietnam 0.4 UAE Sources: UNCTAD, IHS Global Insight, Euler Hermes USD bn BB1 EULER HERMES COUNTRY GRADE GDP GROWTH FORECASTS 6% of the world's proved oil reserves 98 bn Liberal and diversifying economy Strong logistics and infrastructure Weaknesses Vulnerability to energy market volatility High complexity in collecting payment Political risk in the Middle East Region Strengths KEY SUPPLIERS 2015 EXPECTED EXPORTGROWTH 2015 EXPECTED IMPORTGROWTH TOP 5 EXPORT FLOWS BY PRODUCT (in USD bn) TOP 5 IMPORT FLOWS BY PRODUCT (in USD bn) +6.0% +7.0% KEY DESTINATIONS Total exports USD 379 bn in 2013 United Arab Emirates A bridge to South East Asia
-
Upload
muriel-de-boisseson -
Category
Business
-
view
86 -
download
0
Transcript of Infographic UAE a bridge to South East Asia
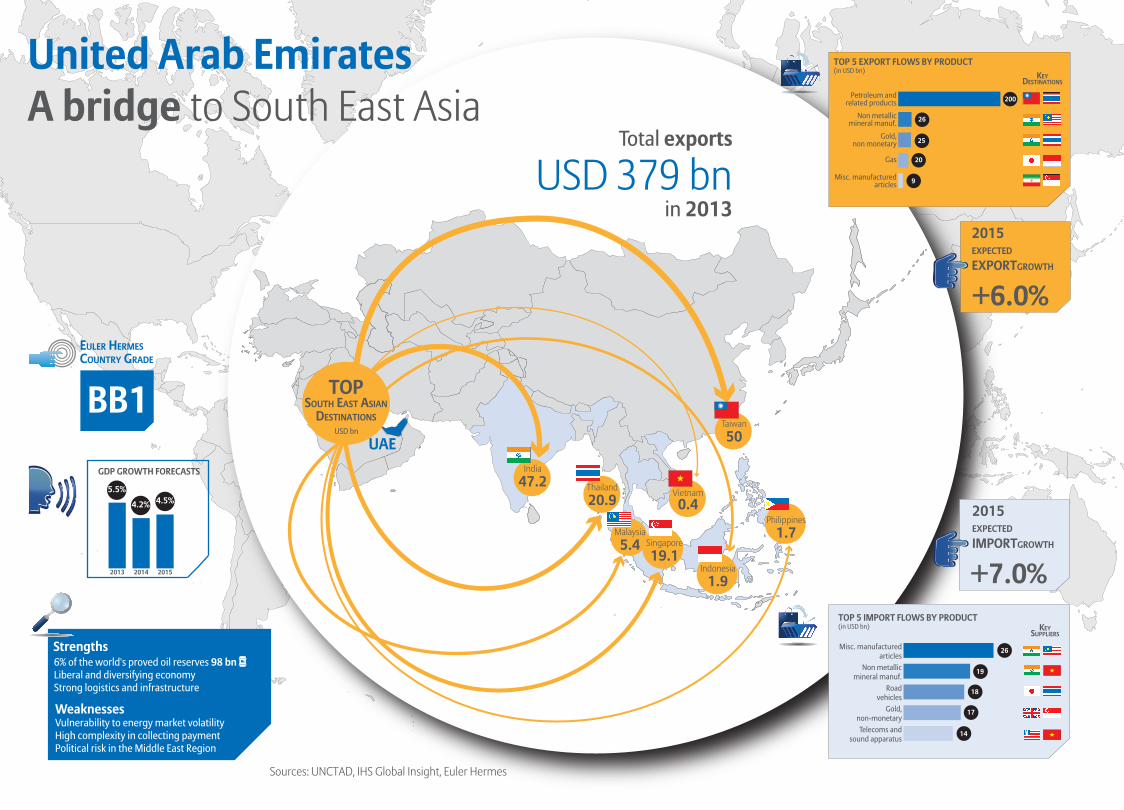
Telecoms andsound apparatus
Gold,non-monetary
Roadvehicles
Non metallicmineral manuf.
Misc. manufacturedarticles
26
19
18
17
14
201520142013
5.5%
4.2% 4.5%
Misc. manufacturedarticles
Gas
Gold,non monetary
Non metallicmineral manuf.
Petroleum andrelated products
7%
200
26
25
20
9
TOPSOUTH EAST ASIAN
DESTINATIONS
India47.2 Thailand
20.9
Taiwan50
Singapore19.1
Indonesia1.9
Malaysia5.4
Philippines1.7
Vietnam0.4
UAE
Sources: UNCTAD, IHS Global Insight, Euler Hermes
USD bn
BB1
EULER HERMESCOUNTRY GRADE
GDP GROWTH FORECASTS
6% of the world's proved oil reserves 98 bn Liberal and diversifying economyStrong logistics and infrastructure
Weaknesses Vulnerability to energy market volatilityHigh complexity in collecting paymentPolitical risk in the Middle East Region
StrengthsKEY
SUPPLIERS
2015EXPECTED
EXPORTGROWTH
2015EXPECTED
IMPORTGROWTH
TOP 5 EXPORT FLOWS BY PRODUCT(in USD bn)
TOP 5 IMPORT FLOWS BY PRODUCT(in USD bn)
+6.0%
+7.0%
KEYDESTINATIONS
Total exports
USD 379 bnin 2013
United Arab EmiratesA bridge to South East Asia