Influencing food environments for healthy diets · Influencing food environments for healthy diets...
154
INFLUENCING FOOD ENVIRONMENTS FOR HEALTHY DIETS
Transcript of Influencing food environments for healthy diets · Influencing food environments for healthy diets...
INFLUENCING FOOD ENVIRONMENTS FOR HEALTHY DIETS

Influencing food environments for healthy diets
FOOD AND AGRICULTURE ORGANIZATION OF THE UNITED NATIONSRome, 2016
The designations employed and the presentation of material in this information product do not imply the expression of any opinion whatsoever on the part of the Food and Agriculture Organization of the United Nations (FAO) concerning the legal or development status of any country, territory, city or area or of its authorities, or concerning the delimitation of its frontiers or boundaries. The mention of specific companies or products of manufacturers, whether or not these have been patented, does not imply that these have been endorsed or recommended by FAO in preference to others of a similar nature that are not mentioned.
The views expressed in this information product are those of the author(s) and do not necessarily reflect the views or policies of FAO.
ISBN 978-92-5-109518-8
© FAO, 2016
FAO encourages the use, reproduction and dissemination of material in this information product. Except where otherwise indicated, material may be copied, downloaded and printed for private study, research and teaching purposes, or for use in non-commercial products or services, provided that appropriate acknowledgement of FAO as the source and copyright holder is given and that FAO’s endorsement of users’ views, products or services is not implied in any way.
All requests for translation and adaptation rights, and for resale and other commercial use rights should be made via www.fao.org/contact-us/licence-request or addressed to [email protected].
FAO information products are available on the FAO website (www.fao.org/publications) and can be purchased through [email protected].
iii
Contents
FOREWORDKostas Stamoulis and Anna Lartey ..............................................................................vii
ACKNOWLEDGEMENTS ...........................................................................ix
CONTRIBUTORS’ BIOGRAPHIES ...............................................................xi
INTRODUCTION: Influencing food environments for healthy dietsAnna Lartey, Günter Hemrich and Leslie Amoroso ........................................................1
CHAPTER 1: Influencing food environments for healthy diets through the production of diversified foodsRoseline Remans ......................................................................................................15
CHAPTER 2: Influencing food environments for healthy diets through food safetyDelia Grace .............................................................................................................43
CHAPTER 3: Influencing food environments for healthy diets through food labellingJanice Lee Albert .....................................................................................................77
CHAPTER 4: Influencing food environments for healthy diets through food-based dietary guidelinesCarlos Gonzalez Fischer and Tara Garnett ...............................................................107
INFLUENCING FOOD ENVIRONMENTS FOR HEALTHY DIETS
iv
Figures
Figure 1: Conceptual framework for the links between food systems, food environments and diet quality ...............................................................................7
Figure 2: Global land area harvested per food group .......................................21
Figure 3: Changes in food production and supply from 1960 to 2010 at the global scale ...........................................................................................................23
Figure 4: Patterns of change over time in production diversity (green) and supply diversity (blue) for individual country case studies ................................25
Figure 5: Supply diversity as a function of production diversity per income category ................................................................................................................25
Figure 6: Framework for understanding food environments and food safety ...47
Figure 7: Pathways through which unsafe food could lead to worse nutrition and health .............................................................................................................48
Figure 8: Recommended steps for developing and implementing FBDG ......110
Figure 9: Components of food environments and the main influences on each component ................................................................................................113
Figure 10: Three main paths by which food-based dietary guidelines can affect the food environment and, in turn, consumption patterns ....................114
Figure 11: Map showing (in green) the 83 countries with dietary guidelines included in this analysis ......................................................................................118
Figure 12: Summary of the most common messages in the guidelines by income level ........................................................................................................122
v
Boxes
Box 1: The causes of FBD and their relative importance ....................................50
Box 2: Informal markets: the dairy sector in Kenya .............................................58
Box 3: Precautionary allergen labelling ..............................................................60
Box 4: Fresh, local and natural but not necessarily safe ....................................61
Box 5: Process of developing FBDG ...................................................................110
Box 6: What is the food environment? ...............................................................112
Box 7: Food and the environment .....................................................................114
Box 8: Sustainable diets ......................................................................................116
Tables
Table 1: Low-risk diet study versus global availability. If everyone in the world had the minimum risk diet, how would that compare to world food availability? ............................................................................................................18
Table 2: Agricultural diversification interventions with an evidence base reporting positive effects on enhanced nutrition outcomes ..............................30
Table 3: Classification of countries with and without dietary guidelines, according to their income level following World Bank classification ...............119

vii
Foreword
The current global nutrition situation indicates that malnutrition, in all its forms (undernutrition, micronutrient deficiencies, overweight and obesity) is widespread. Malnutrition causes cultural, social and economic cost to nations, and is a major impediment to development and the realization of full human potential.
While there has been some progress in reducing undernourishment from over one billion people in the 1990s to 793 million in 2015 (FAO/IFAD/WFP – SOFI, 2015), an estimated two billion people suffer from micronutrient deficiencies or “hidden hunger” (FAO - SOFA, 2013), while more than 1.9 billion adults are overweight, of whom over 600 million are obese (WHO, 2014). Increasingly low- and middle-income countries are facing the consequences of malnutrition ranging from an increased risk of premature death to serious chronic health conditions, such as the prevalence of diet-related non-communicable diseases. Changes in diets in recent decades, associated with changing lifestyles, rising incomes and increased consumption of highly processed foods together with reductions in physical activity levels, are believed to be associated with this transition. Underlying the current nutrition situation is the problem of unhealthy diets.
The Second International Conference on Nutrition (ICN2) was organized jointly by the Food and Agriculture Organization of the United Nations (FAO) and the World Health Organization (WHO) and held at FAO Headquarters in Rome, Italy, from 19 to 21 November 2014. Two outcome documents of ICN2 - the Rome Declaration on Nutrition and the Framework for Action - were endorsed by FAO and WHO Members. They committed to establishing national policies aimed at preventing malnutrition in all its forms and transforming food systems to make safe and diversified healthy diets available to all. The 2030 Agenda and its Sustainable Development Goals and the United Nations Decade of Action on Nutrition (2016-2025) provide the opportunity for joint action towards coherent policies and programmes to achieve internationally agreed goals and to implement coherent policies to address malnutrition in all its forms.
ICN2 stressed the importance of a food system approach – from production to processing, storage, transportation, marketing, retailing and consumption – as key to promoting healthy diets and improving nutrition, given that isolated interventions have limited impact. Food environments mediate between broader food systems, and individual diets.
INFLUENCING FOOD ENVIRONMENTS FOR HEALTHY DIETS
viii
Anna LarteyDirector
Nutrition and Food Systems DivisionFood and Agriculture Organization of
the United Nations
Kostas StamoulisAssistant Director-General a.i.
Economic and Social Development Department
Food and Agriculture Organization ofthe United Nations
Food environments comprise the foods available to people in their surroundings as they go about their everyday lives and the nutritional quality, safety, price, convenience, labelling and promotion of these foods. Food environments play an important role in shaping diets because they provide the choices people have when they make decisions about what to eat. A healthy food environment is one that creates the conditions that enable and encourage people to access and choose healthy diets.
This publication, prepared by the Nutrition and Food Systems Division of FAO, focuses on Influencing food environments for healthy diets specifically through four areas: the production of diversified foods, food safety, food labelling and food-based dietary guidelines. The Introduction on influencing food environments for healthy diets sets the scene.
The publication is a useful resource for all countries as they develop policies and programmes to make healthy diets an easier choice for their citizens. The book also serves a variety of audiences, including policy-makers, programme planners and implementers and the private sector.
ix
Acknowledgements
This book has been developed by the Nutrition and Food Systems Division (ESN) of FAO as a direct follow-up activity to the Second International Conference on Nutrition (ICN2). We wish to thank all those who contributed to the preparation of this publication, with their expertise, time and energy.
First and foremost we would like to acknowledge with gratitude all the authors: Janice Albert, Tara Garnett, Carlos Gonzalez Fischer, Delia Grace and Roseline Remans for their expertise and hard work in preparing the papers as well as for their dedication, cooperation and commitment in meeting our various requests. Special thanks go to Corinna Hawkes whose constructive and valuable technical comments, inputs and suggestions have helped to improve the quality of each of the papers.
Special acknowledgment goes to Anna Lartey, Director, Nutrition and Food Systems Division, for her continuing support at all stages in the publication of this work, Günter Hemrich, Deputy Directory ad interim, Nutrition and Food Systems Division, for his constructive comments and Leslie Amoroso, Programme Officer, Nutrition and Food Systems Division, for technical liaison with the authors and for coordinating the preparation and publishing of this work.
Special thanks are due to Janice Meerman, Consultant, Nutrition and Food Systems Division, Fergus Mulligan, Editor, Davide Cascella, Graphic Designer, and Chiara Deligia, Communication Consultant, Nutrition and Food Systems Division.
Our warm thanks are extended to Giuseppina Di Felice, Secretary and Indre Baublyte, Office Assistant both of the Nutrition and Food Systems Division, and Milica Beokovic for administrative support.
FAO’s Nutrition and Food Systems Division is particularly grateful to the Government of Italy for its financial support in the preparation of this publication.

xi
Contributors’ Biographies
Janice Albert has worked for over 30 years on nutrition, food policy,
agriculture, public health and adult education at local, national and
international levels. As an officer of the Food and Agriculture Organization
of the United Nations, she promoted dietary guidelines, international
standards for nutrition labelling, independent scientific advice on nutrition
and conservation of biodiversity through projects, conferences and
publications. She has carried out research on food labelling since the
1990s. She holds a doctorate in food policy and applied nutrition from the
Tufts University Friedman School of Nutrition Science and Policy, as well as
master’s degrees in human ecology/population sciences and international
agricultural development from the Harvard School of Public Health and
the University of California, Davis, respectively. After residing in Europe for
25 years, she returned to the United States in 2015. She lives in Oakland,
California where she is an independent consultant on food and nutrition
issues.
Leslie Amoroso is the Programme Officer of the Nutrition and Food Systems
Division, Food and Agriculture Organization of the United Nations (FAO),
Rome, Italy.
Tara Garnett is based at the Environmental Change Institute at the University
of Oxford and is a Fellow of the Oxford Martin School. She has worked on
food issues for over 20 years, first in the NGO community and, since 2005
within the academic sector. Her work centres on the interactions among
food, climate, health and broader sustainability issues. She has a particular
interest in livestock as a sector where many of these converge and in
addition runs the Food Climate Research Network (FCRN), which she set
up in 2005. The FCRN is a network of thousands of individuals who share a
common interest in food system sustainability, spanning diverse disciplines
and sectors and drawn from over 70 countries worldwide. The FCRN provides
accessible, policy relevant and integrative knowledge on food systems, and
a safe neutral space for diverse stakeholders to engage in the contested
food arena – through its membership, its much used website, and via the
workshops it runs.
INFLUENCING FOOD ENVIRONMENTS FOR HEALTHY DIETS
xii
Carlos Gonzalez Fischer is a Food Climate Research Network associate and
an ecologist interested in reconciling food production with environmental
sustainability. He has been studying the relationships between agriculture,
society and the environment for the last 12 years. He started describing land
use changes in the Río de la Plata Grasslands, working with the Argentine
Wildlife Fund (Argentine WWF). Later on he moved to the University of Buenos
Aires, to study the effects of those changes on small mammal groupings in
the Pampas. In 2013, having transferred to the UK, he started working for the
charity Compassion in World Farming, as it began to integrate its work on
farm animal welfare with broader sustainability concerns. Working at the
interface between civil society, academia and policy has reinforced his
conviction of the need to look at both food consumption and production,
and this has become the focus of his work. He is now back in Argentina,
working on these issues with the Study Group on Agroecosystems Biodiversity
(GEBA), at the Ecology, Genetics and Evolution Department of the University
of Buenos Aires.
Delia Grace is an epidemiologist and veterinarian with 20 years’ experience
in developing countries. She leads research on zoonoses and food-borne
disease at the International Livestock Research Institute in Kenya. Her
research interests include emerging diseases, participatory epidemiology,
gender studies and animal welfare. Her career has spanned the private
sector, field-level community development and aid management, as well
as research. She received the Trevor Blackburn award for contributions to
animal health and welfare in developing countries and the Gregg medal
for academic achievement. She has been involved as an expert in several
processes developing evidence for the World Health Organization, the
Committee on World Food Security High Level Panel of Experts, and the
World Organisation for Animal Health. She has lived and worked in Asia, west
and east Africa and authored or co-authored more than 100 peer-reviewed
publications as well as providing training courses, briefs, films, articles and
blog posts.
xiii
Günter Hemrich is the Deputy Director ad interim of the Nutrition and Food
Systems Division, Food and Agriculture Organization of the United Nations
(FAO), Rome, Italy.
Anna Lartey is the Director of the Nutrition and Food Systems Division, Food
and Agriculture Organization of the United Nations (FAO), Rome, Italy.
Roseline Remans is a bio-engineer and research scientist with Bioversity
International and the Earth Institute of Columbia University. Based in Addis
Ababa since 2013, her research focuses on biodiversity in food systems
and synergies and trade-offs between human nutrition, agriculture and the
environment in low-income settings. She received her PhD in biosystems
engineering with field work in Central America, from the KULeuven in 2007.
She then joined the Agriculture and Food Security Center at Columbia
University in New York as a Marie Curie research fellow. As a cross-disciplinary
researcher, she closely collaborates with several international and local
development agencies, communities, ministries, and universities to embed
research into the ground realities and contribute to research capacity
building. She has published widely across the nutrition, agriculture, and
environment field and leads several research in development projects in
Africa.

INFLUENCING FOOD ENVIRONMENTS FOR HEALTHY DIETS
Anna Lartey, Günter Hemrich and Leslie Amoroso
INTRODUCTION:

INTRODUCTION: INFLUENCING FOOD ENVIRONMENTS FOR HEALTHY DIETS
3
OVERVIEW
Food environments may be thought of as all the foods which are available and accessible to people in the settings in which they go about their daily lives. That is, the range of foods in supermarkets, small retail outlets, wet markets, street food stalls, coffee shops, tea houses, school canteens, restaurants and all the other venues where people procure and eat food. Food environments differ enormously depending on context. They can be extensive and diverse, with a seemingly endless array of options and price ranges, or they can be sparse, with very few foods on offer. Because they determine what foods consumers can access at a given time, at what price and with what degree of convenience, food environments both constrain and prompt food choices.
Food environments are influenced by the food systems which supply them, and vice versa. Food systems encompass the entire range of activities, peoples and institutions involved in the production, processing, marketing, consumption and disposal of food (FAO, 2013).They include but are not limited to food supply chains. Making food systems nutrition-sensitive can contribute to addressing all forms of malnutrition, as food systems determine whether the foods needed for good nutrition are available, affordable, acceptable and of adequate quantity and quality. How closely food systems and food environments are interrelated and interdependent, and the degree to which external factors affect nutrition outcomes, varies from setting to setting.
Many of today’s food systems and food environments are challenged in supporting food choices consistent with healthy diets and good nutrition outcomes. Consumers are not making choices that are consistent with nutrition and health, and poor diet is now the number one risk factor for death and disability worldwide (GBD, 2015). Food systems which do not enable healthy diets are increasingly recognized as an underlying cause of malnutrition (GLOPAN, 2016), and malnutrition, irrespective of form, has a huge cost. Economic costs associated with undernutrition are estimated at US$1-2 trillion per year, about 2-3 per cent of global GDP (FAO, 2013); the global economic cost of obesity and associated diet-related non-communicable diseases is estimated at US$2 trillion per year, about 2.8 per cent of global GDP (McKinsey, 2014).
As a result, calls are growing for food system reforms to provide safe, diverse, nutrient-rich foods in adequate quantities to everyone, everywhere (FAO, 2013; FAO, 2014; IFPRI, 2015; World Bank, 2016; GLOPAN, 2016). Directives specific to the United Nations include: the Second International Conference on Nutrition (ICN2), jointly held by FAO and WHO in 2014, which highlighted the need for governments to “review national policies and investments and to integrate nutrition objectives into food and agriculture policies, to
INFLUENCING FOOD ENVIRONMENTS FOR HEALTHY DIETS
4
enhance healthy diets”1 (FAO, 2014); Agenda 2030 and the Sustainable Development Goals (SDGs);2 and the United Nations Decade of Action on Nutrition 2016-2025.
The urgency of these calls to action is underpinned by rapid population growth, climate change and urbanization, which will put heavy pressure on food systems over the next 20 years (GLOPAN, 2016).
As the UN organization whose mandate includes both agriculture and nutrition, the Food and Agriculture Organization of the United Nations (FAO) provides normative guidance, policy advice and practical tools for making food systems work better for nutrition. This publication is part of a growing portfolio of knowledge products providing empirical evidence and practical suggestions for achieving this objective through influencing food environments. Because they play such an important role in consumer food choices, influencing food environments for promoting healthy diets is an emerging strategy to address today’s nutrition challenges. The interventions covered in this publication - production diversification, food safety, food labelling, and food-based dietary guidelines - have been identified by the ICN2 Framework for Action as possible entry points for improving food systems and food environments to deliver healthy diets.
This Introduction provides a conceptual framework for explaining the linkages between food systems, food environments and healthy diets. Understanding these interrelationships is critical for making food systems work for improved nutrition and for influencing food environments to better support food choices.
1 ICN2 Framework for Action, Recommendation No.8
2 Most explicitly under Goal 2: End hunger, achieve food security and improved nutrition, and promote sustainable agriculture
INTRODUCTION: INFLUENCING FOOD ENVIRONMENTS FOR HEALTHY DIETS
5
LINKING FOOD SYSTEMS, FOOD ENVIRONMENTS AND DIETS
Food systems encompass the entire range of activities involved in the production, processing, marketing, consumption and disposal of goods that originate from agriculture, forestry or fisheries,3 including the inputs needed and the outputs generated at each of these steps. Food systems also involve the people and institutions that initiate or inhibit change in the system as well as the sociopolitical, economic and technological environment in which these activities take place (FAO, 2013). 4
Food systems are influenced by global, regional and national trends in politics and economics such as deregulation, market liberalization and agricultural development agendas. In many countries, the net effect of these trends has been a shift towards “long chain” models where food is transported and traded long distances post-farmgate (GLOPAN, 2016). In these long food chains, raw ingredients are routinely transformed into processed products. For example, chicken parts are ground up and combined with vegetable oils and refined carbohydrates to become chicken nuggets and fruits are used as ingredients in processed foods and beverages high in sugars or other sweeteners (Hawkes et al., 2012).
Food systems are also shaped by food culture and consumer preferences. This is because consumer demand affects supply. The food values and beliefs which underlie people’s food choices influence which foods are produced and how they are processed, procured and eaten. Food choices, however, are also shaped by food systems. The relationship is bi-directional. This two-way street is best viewed at consumer level via food environments, which are often described as the “interface” or “link” between food systems and diets.
Herforth and Ahmed describe food environments as the range of foods which are available, affordable, convenient and desirable to people in a given context (Herforth and Ahmed, 2015), while Hawkes et al. describe the concept as comprised of the everyday prompts which nudge consumers’ food choices in particular directions, and which contribute to dietary habits
3 For the purposes of this publication, the focus is primarily on foods derived from agricultural production.
4 The High Level Panel of Experts (HLPE) definition of food systems also includes socioeconomic and environmental outcomes of food systems: “A food system gathers all the elements (environment, people, inputs, processes, infrastructures, institutions, etc.) and activities that relate to the production, processing, distribution, preparation and consumption of food, and the outputs of these activities, including socioeconomic and environmental outcomes” (HLPE 2014).
INFLUENCING FOOD ENVIRONMENTS FOR HEALTHY DIETS
6
and preferences that can have long-term impacts, especially in children (Hawkes et al., 2015). Both of these definitions trace a clear trajectory from food systems to food environments to diet choices, with implications for nutrition.
For example, in food environments where fruits are not readily available or affordable, consumers’ choices will be constrained, in that the option to eat a banana or similar food does not exist, or is prohibitively costly. Conversely, in food environments where fruit is common and sold at low prices, people may be prone to consume more than they would otherwise. Some of the most important factors behind these circumstances are rooted in broader food systems. A case in point is the trend toward “long chain” models described above. Driven in part by decades of heavy research and investment in staple cereals, oilseeds, vegetable oil technologies, cheaper animal-source foods and consequent underinvestment in coarse grains, fruits, legumes, and vegetables (Pingali, 2015; Popkin, 2011), this trend has resulted in food environments with similarities to the “low or no fruit” hypothetical above, where nutritious options are neither available nor affordable. In many contexts, highly processed foods may also be more available and accessible than nutritious options.
This pattern can be assessed in terms of price shifts and sales, both of which have been well-documented in a range of countries. For example, a study of price changes between 1990 and 2009-2012 in Brazil, China, Mexico, South Korea and the United Kingdom showed that fruit and vegetable prices rose across the board, while prices of processed foods decreased in the majority of cases (Wiggins and Keats, 2015). Similarly, survey data from 79 middle- and high-income countries shows substantial increases in the sale of highly processed products over the last three decades (Monteiro et al., 2013). Consequences include proliferation of food environments in which consumers are prompted to purchase highly processed foods of low nutritional value more often and to purchase nutritious foods less.
Figure 1 provides a conceptual framework for explaining these and related links between food systems, food environments, consumer choices and diet. Four food supply subsystems comprise the entire “farm to fork” food chain, namely agricultural production; food storage, transportation, and trade; food transformation; and food retail and provisioning. These subsystems influence the food environments in which people make their dietary choices.
INTRODUCTION: INFLUENCING FOOD ENVIRONMENTS FOR HEALTHY DIETS
7
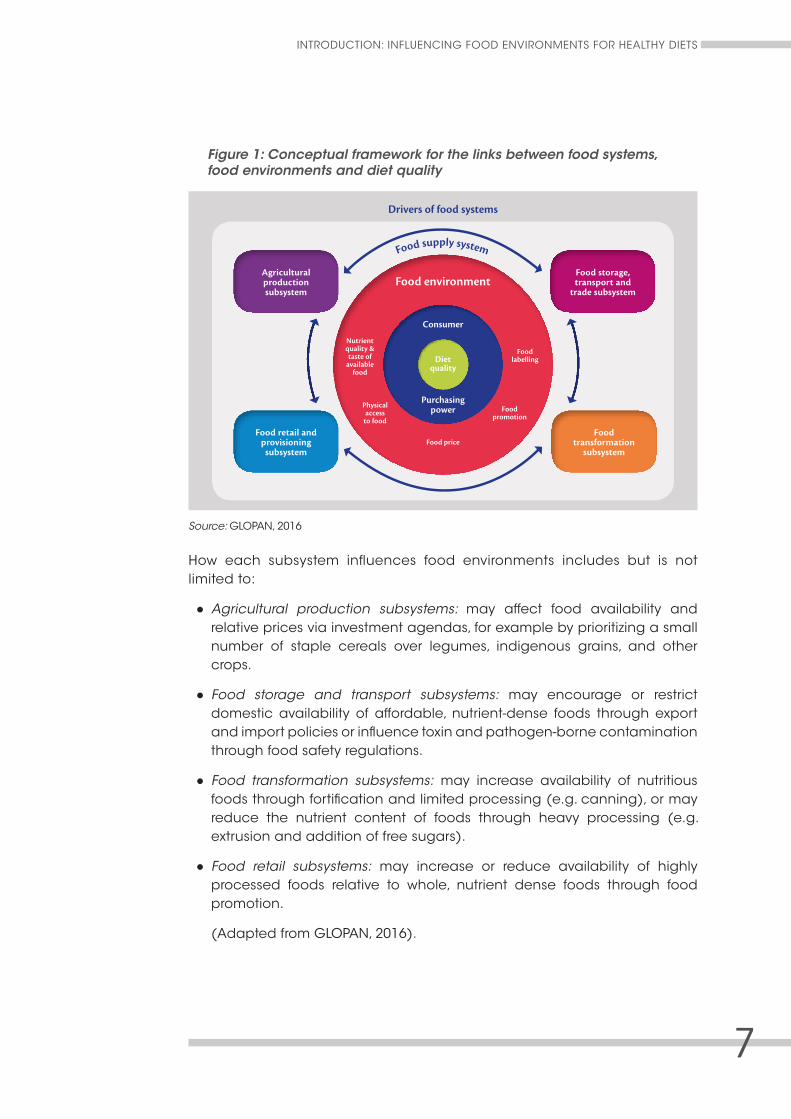
Figure 1: Conceptual framework for the links between food systems, food environments and diet quality
Drivers of food systems
Food storage, transport and
trade subsystem
Food transformation
subsystem
Diet quality
Physical access
to food
Food price
Food promotion
Food labelling
Nutrient quality & taste of
available food
Purchasing power
Consumer
Food environment
Food retail and provisioning subsystem
Agricultural production subsystem
Food supply system
Source: GLOPAN, 2016
How each subsystem influences food environments includes but is not limited to:
● Agricultural production subsystems: may affect food availability and relative prices via investment agendas, for example by prioritizing a small number of staple cereals over legumes, indigenous grains, and other crops.
● Food storage and transport subsystems: may encourage or restrict domestic availability of affordable, nutrient-dense foods through export and import policies or influence toxin and pathogen-borne contamination through food safety regulations.
● Food transformation subsystems: may increase availability of nutritious foods through fortification and limited processing (e.g. canning), or may reduce the nutrient content of foods through heavy processing (e.g. extrusion and addition of free sugars).
● Food retail subsystems: may increase or reduce availability of highly processed foods relative to whole, nutrient dense foods through food promotion.
(Adapted from GLOPAN, 2016).
INFLUENCING FOOD ENVIRONMENTS FOR HEALTHY DIETS
8
Food environments mitigate the impact of these subsystems on individual diet choice and diet quality via a variety of factors, including food labelling, food promotion, food prices, physical access and nutrient quality and taste. Different individuals within the same food environment are affected differently by these features. For example some people are more affected by food labelling than others, and some people are more responsive to advertisements (food promotion) than others. Preferences are further affected by purchasing power, which is key to whether an individual is willing and able to pay a premium for certain foods. In food environments where nutritious foods are more expensive, purchasing power is critical to assuring healthy diets (Darmon and Drewnoski, 2015).
Improved alignment between all these components – the four food subsystems and various food environment features – is central to food system reform, with the unifying objective being better support for food choices consistent with healthy diets. Food environments supporting healthy diets can be defined as those which make such diets available, affordable and appealing to people, with healthy diets themselves defined as:
- adequate, comprising sufficient food for a healthy life;
- diverse, containing a variety of foods, including plenty of fruits and vegetables, legumes and whole grains;
- low in food components of public health concern: sugars and salt consumed in moderation (with all salt iodised) and fats being unsaturated rather than saturated or trans-fats.
Additionally, according to the World Health Organization (WHO), the hallmarks of a healthy diet are abundant, diverse plant foods, limited or no highly processed foods such as sugar-sweetened beverages and processed meats and appropriate consumption of other nutritious foods aligned with dietary needs for life stage (WHO, 2015).
High-quality diets also need to be safe so they do not cause food-borne disease.
Multiple initiatives are currently working to reshape food systems and associated food environments to promote healthy diets. Some focus on strategies to align health objectives more closely with the market signals which drive the supply subsystems described in Figure 1. Others focus on increasing accountability and strengthening partnerships with private sector actors within these subsystems. Still others focus on altering food environments features at consumer level to make healthy behaviour easier and more of the default, thereby relying less on individual willpower and more on changes in environment and social norms.
INTRODUCTION: INFLUENCING FOOD ENVIRONMENTS FOR HEALTHY DIETS
9
Various organizations have published reports detailing actions for reforming the food system and influencing the food environment (FAO, 2013; World Bank, 2016; MGI, 2014; GLOPAN, 2016). Across the board, goals include altering relative food prices to make healthy diets more affordable and competitive, and increasing consumers’ exposure to healthy food choices while decreasing exposure to highly processed foods.
IN THIS PUBLICATION
The following chapters provide empirical evidence and proposals for influencing food environments for healthy diets. In line with the food supply subsystems and food environment features covered under Figure 1, a wide range of entry points are discussed.
Chapter 1 provides a detailed review of evidence to date regarding reductions in production diversity, highlighting distortions in global food production and supply trends and the consequent failure of agricultural systems to meet nutritional needs. While the contributions of specialization to sector productivity and overall economic growth are acknowledged, the need to offset specialization’s negative effects on food environments is emphasized. (The issues discussed in this chapter fall under the “agricultural production subsystem” shown in Figure 1.)
Chapter 2 provides an original and much needed analysis of the role of food safety in creating healthy food environments. Safe food is an essential component of a healthy food environment. However, nutrition and food safety objectives are not always well aligned. In particular, the most nutritious foods are the most risky and most labelling and information approaches are not well suited to ensuring food safety. This chapter discusses the range of opportunities available to improve food safety - technology, value chain innovations and restructuring of food safety governance - while cautioning that such efforts may actually end up having anti-nutrition effects, most notably in poor and middle-income country settings where tightened food safety requirements can seriously reduce availability of perishable, nutrient-dense foods such as milk. (The issues discussed in this chapter apply across subsystems and are especially relevant to transportation, transformation and retail.)
INFLUENCING FOOD ENVIRONMENTS FOR HEALTHY DIETS
10
Chapter 3 reviews the most recent evidence about the effectiveness of nutrition information on food labels. The range of foods that can carry a label is enormous, from whole foods like milk, to sliced, packaged bread, fruit juices, potato chips, etc. Labels can contribute to a healthy food environment by:
1. providing information to the consumer about the content of foods;
2. drawing consumer attention to the benefits and risks of particular nutrients
or ingredients of public health concern;
3. motivating manufacturers to produce foods which have healthier nutrition
profiles. (The issues discussed under this chapter are most relevant to the
food retail subsystem and to features of the immediate food environment.)
Chapter 4 discusses results of a global review of food-based dietary guidelines (FBDGs). Over the last two decades, an increasing number of countries have developed specific FBDGs. These guidelines are intended to set out the official dietary “vision” or “infrastructure” for the country, creating the nutritional steer for public food and nutrition, health and agricultural policies and nutrition education programmes. FBDGs can, in theory, influence the food environment by informing policy as well as individuals and industry. In practice, the review finds that in many countries, links between FBDGs and policies affecting the food environment are not readily apparent. (The issues discussed in this chapter are relevant across all four subsystems as well as food environment features.)
Each of these entry points has the potential to improve the health of food environments. Some, such as product labelling, are directly and obviously related to consumer choice. Others, such as agricultural production diversification, are less obviously linked but still fundamental, not least in terms of implications for the relative prices of healthy versus unhealthy foods.5 When leveraged in tandem, these strategies have the potential to promote healthy diets across multiple dimensions of the food system.
The opportunities for influencing food systems and food environments are enormous and largely uninvestigated. This publication is best viewed as an exploration of entry points for which the evidence base is growing, rather than an exhaustive review of the options. Further inquiries into additional entry points, not least accountability mechanisms for both the public and private sectors, are urgently needed.
5 It is important to note that in contexts where short food chains predominate, production diversification is directly linked to diet quality: Kumar, Harris and Rawat, 2015; Jones, Shrinivas and Bezner-Kerr, 2014; Dillon, McGee and Oseni, 2015; Hoddinott, Headey and Dereje, 2015; Sibhatu, Krishna and Quam, 2015; Demeke et al., 2016.
INTRODUCTION: INFLUENCING FOOD ENVIRONMENTS FOR HEALTHY DIETS
11
REFERENCES
Darmon, N. & Drewnowski, A. 2015. Contribution of food prices and diet cost to socioeconomic disparities in diet quality and health: a systematic review and analysis. Nutrition Reviews. 73: 643-660.
FAO. 2013. The state of food and agriculture: food systems for better nutrition. Rome (available at www.fao.org/docrep/018/i3300e/i3300e00.htm).
FAO. 2014. Second International Conference on Nutrition. Conference Outcome Document: Framework for Action, from Commitments to Action. Rome (available at www.fao.org/3/a-mm215e.pdf).
GBD (Global Burden of Disease Study). 2013. Collaborators: Forouzanfar, M.H., Alexander, L., Anderson, H.R., Bachman, V.F., Biryukov, S., Brauer, M., Burnett, R., Casey, D., Coates, M.M., Cohen, A., et al., 2015. Global, regional and national comparative risk assessment of 79 behavioural, environmental and occupational and metabolic risks or clusters of risks in 188 countries, 1990–2013: a systematic analysis for the Global Burden of Disease Study. 2013. The Lancet. 386: 2287-323, doi: 10.1016/S0140–6736(15)00128-2.
GLOPAN (Global Panel on Agriculture and Food Systems for Nutrition). 2014. How can agriculture and food system policies improve nutrition? Technical Brief: London, GLOPAN.
GLOPAN (Global Panel on Agriculture and Food Systems for Nutrition). 2016. Food systems and diets: Facing the challenges of the 21st century. London, GLOPAN.
Hawkes, C., Friel, S., Lobstein, T. & Lang, T. 2012. Linking agricultural policies with obesity and noncommunicable diseases: a new perspective for a globalising world. Food Policy. 37: 343–353.
Hawkes, C., Smith, T.G., Jewell, J., Wardle, J., Hammond, R.A., Friel, S., Thow, A.M. & Kain, J. 2015. Smart food policies for obesity prevention. The Lancet. 385: 2410-21.
Herforth, A. & Ahmed, S. 2015. The food environment, its effects on dietary consumption, and potential for measurement within agriculture-nutrition interventions. Food Security. 7(3): 505-520.
HLPE (High Level Panel of Experts). 2014. Food losses and waste in the context of sustainable food systems. A report by the High Level Panel of Experts on Food Security and Nutrition of the Committee on World Food Security. Rome, HLPE.
INFLUENCING FOOD ENVIRONMENTS FOR HEALTHY DIETS
12
IFPRI (International Food Policy Research Institute). 2015. Global nutrition report: actions and accountability to advance nutrition and sustainable development. Washington DC, IFPRI.
MGI (McKinsey Global Institute). 2014. Overcoming obesity: an initial economic analysis. MGI.
Monteiro, C., Moubarac J., Cannon, G., Ng, S. & Popkin, B. 2013. Ultra-processed products are becoming dominant in the global food system. Obesity Revs. 14(S2): 21-28.
Pingali, P. 2015. Agricultural policy and nutrition outcomes – getting beyond the preoccupation with staple grains. Food Sec. 7:585-591.
Popkin, B. 2011. Agricultural policies, food and public health. EMBO Rep. 2011; 12:11–18.
WHO. 2015. Healthy Diet Fact Sheet. 394 (available on www.who.int/mediacentre/factsheets/fs394/en/).
Wiggins, S. & Keats, S. 2015. The rising cost of a healthy diet: changing relative prices of foods In high-income and emerging economies. London, Overseas Development Institute.
World Bank. 2016. Future of food: shaping the global food system to deliver improved nutrition and health. Washington DC, World Bank.


INFLUENCING FOOD ENVIRONMENTS FOR HEALTHY
DIETS THROUGH THE PRODUCTION OF DIVERSIFIED
FOODS
Roseline Remans
CHAPTER 1:

1. INFLUENCING FOOD ENVIRONMENTS FOR HEALTHY DIETS THROUGH THE PRODUCTION OF DIVERSIFIED FOODS
17
INTRODUCTION
A rapid transition in diet and activity patterns is occurring globally, paralleled by major climatic, demographic and socio-economic changes. While a substantial population share in low- and middle-income countries (LMICs) remains chronically undernourished and micronutrient deficient, a rapidly growing share suffer from excess weight and obesity and diet-related non-communicable diseases (NCD) (Lim et al., 2012). These twin challenges are linked, as global, national, and sub-national food systems do not provide appropriate nutritious, diverse and safe foods for healthy lives for all.
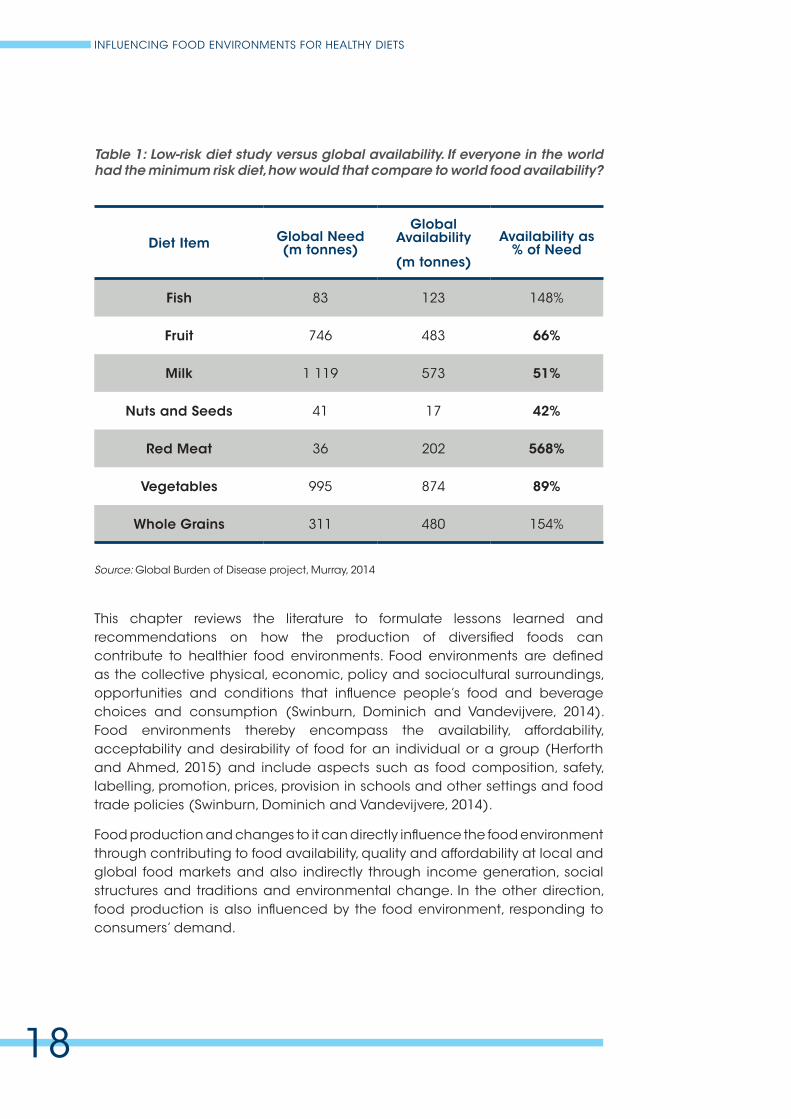
A recent analysis by the Institute for Health Metrics and Evaluation (IHME) suggests that in contrast to caloric supply, the current global food system is not meeting the requirements to produce, let alone access, adequate amounts of certain food groups such as nuts and seeds, fruits and vegetables, to deliver a “minimum risk” diet globally (Table 1, Murray, 2014). Similarly, Siegel et al. (2014) show that current supply of fruits and vegetables in most countries in the world is inadequate to meet the dietary needs of the population. On the other hand, the supply of cereals at 154 percent exceeds the global need and red meat is produced at 568 percent of the amount the global population needs for a healthy low risk diet (Table 1, Murray, 2014). These numbers do not take into account access or preference but they provide some insight into the failure of current production systems to meet nutritional needs even without considering access issues. While much of the global discussion and agenda is on whether we can produce enough food for 9 billion people in 2050, these insights call for system changes, not so much on how to produce more with less (Foley et al., 2011; West et al., 2014) but more on how to change production systems for food availability to meet nutritional needs locally and globally.
INFLUENCING FOOD ENVIRONMENTS FOR HEALTHY DIETS
18
Table 1: Low-risk diet study versus global availability. If everyone in the world had the minimum risk diet, how would that compare to world food availability?
This chapter reviews the literature to formulate lessons learned and recommendations on how the production of diversified foods can contribute to healthier food environments. Food environments are defined as the collective physical, economic, policy and sociocultural surroundings, opportunities and conditions that influence people’s food and beverage choices and consumption (Swinburn, Dominich and Vandevijvere, 2014). Food environments thereby encompass the availability, affordability, acceptability and desirability of food for an individual or a group (Herforth and Ahmed, 2015) and include aspects such as food composition, safety, labelling, promotion, prices, provision in schools and other settings and food trade policies (Swinburn, Dominich and Vandevijvere, 2014).
Food production and changes to it can directly influence the food environment through contributing to food availability, quality and affordability at local and global food markets and also indirectly through income generation, social structures and traditions and environmental change. In the other direction, food production is also influenced by the food environment, responding to consumers’ demand.
Diet Item Global Need (m tonnes)
Global Availability
(m tonnes)
Availability as % of Need
Fish 83 123 148%
Fruit 746 483 66%
Milk 1 119 573 51%
Nuts and Seeds 41 17 42%
Red Meat 36 202 568%
Vegetables 995 874 89%
Whole Grains 311 480 154%
Source: Global Burden of Disease project, Murray, 2014
1. INFLUENCING FOOD ENVIRONMENTS FOR HEALTHY DIETS THROUGH THE PRODUCTION OF DIVERSIFIED FOODS
19
Considering this definition we first explore trends in food production diversity and its relationship to the food environment and consumption patterns. This helps us to better understand and contextualise entry points for action. Second, we review mechanisms and pathways for diversifying food production and how such diversification can lead to healthier food environments in different settings and at different scales. Finally, we formulate short cross-cutting, thought-provoking recommendations for creating a healthy food environment through the production of diversified foods.
TRENDS IN PRODUCTION DIVERSITY AND RELATIONSHIP TO FOOD ENVIRONMENT AND DIETS
Production diversity: what and why?
Agricultural biodiversity or agrobiodiversity is the diversity of crops and their wild relatives, trees, livestock, fish, microbes and other species that contribute to agricultural production. This diversity exists at the ecosystem, species and genetic level and is the result of interactions between people and the environment over thousands of years.
Agrobiodiversity is increasingly identified as key to sustainability of food systems. The International Panel of Experts on Sustainable Food Systems states as one of their principles that “Food systems must be fundamentally reoriented around principles of diversity, multi-functionality and resilience”. The recently agreed Sustainable Development Goals (SDGs) include several goals closely associated with the status of agrobiodiversity. Goal 2 aims to “end hunger, achieve food security and improved nutrition and promote sustainable agriculture”, which requires effective access to agrobiodiversity. Target 2.5 focuses on genetic diversity in food production systems. Goals 3 (healthy lives), 12 (sustainable consumption and production patterns) and 13 (combatting climate change) also depend on food system biodiversity.
In addition, the Aichi Biodiversity Targets, used in the flagship publications of the global Convention on Biological Diversity (CBD), contain several targets on agrobiodiversity including Target 7 on biodiversity in agricultural landscapes, Target 13 on genetic diversity of cultivated plants and Target 14 on ecosystem services contributing to human health. These agriculture-related Aichi Targets are considered central to tackling the broader biodiversity challenge.
INFLUENCING FOOD ENVIRONMENTS FOR HEALTHY DIETS
20
In general, it is believed that changes in agro-ecological production systems from diversified systems towards ecologically more simple cereal-based systems contribute to poor dietary quality, micronutrient deficiencies and resulting malnutrition (Frison et al., 2006; Graham et al., 2007; DeClerck et al., 2011). While there is no consistent or comprehensive way to track and evaluate the effect of changes in agrobiodiversity, several global, national and subnational trends in production diversity can be identified which we discuss below as related to changing food environments.
For agricultural production and diversity to influence the food environment and ultimately diets, markets and value chains play a critical and growing role in connecting producers, food chain actors, and consumers, in setting food prices and in bringing diversity to scale. Even in societies that are considered mainly subsistence farming systems, households depend on local food markets to sell, buy and exchange food products and often on national and international markets to cope with seasonal food availability gaps. In more commercial and globally connected settings, market mechanisms form main drivers for food production, food availability, accessibility and acceptability.
A key challenge is how to make a diversity of healthy and sustainable options the easy default choice in local and global food markets accessible to all, including vulnerable population groups. This is a systems question and calls for changes in the food environment at the production, institutional, market and consumer level. This chapter focuses on the production level, but in relation to this broader food system and with special attention to the critical role and related challenges and opportunities that markets play in linking agricultural production to the food environment.
Global trends
Khoury et al. (2014) elegantly demonstrated that our global food supply is becoming more and more homogeneous: one finds the same food species and even varieties of these species everywhere. This increasing homogeneity of the global food supply has sparked a scientific and policy debate on implications for food and nutrition security.
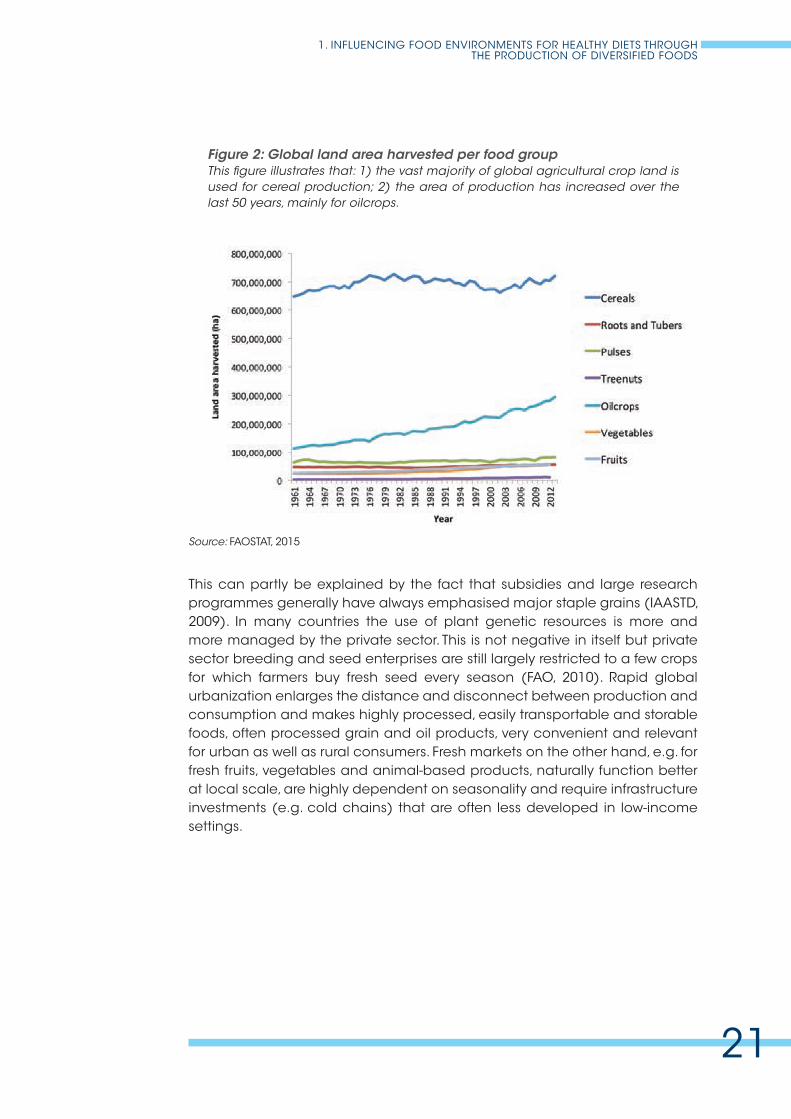
An analysis of food crop diversity over the last several decades shows that crops with the greatest increase in geographical spread and supply quantity are particularly energy-dense and micronutrient-poor species that increase the risk of diet-related health and disease problems (Khoury et al., 2014; Murray, 2014) (Figure 2). Examples are oil crops, sugar crops and major staples such as rice and wheat. Treenuts and vegetables, which are largely health-protective, are represented in the top 10, showing some growth in land cover and production amount but with rates much lower than seed crops and they continue to be underproduced to meet global need (Murray, 2014; Siegel et al., 2014).
1. INFLUENCING FOOD ENVIRONMENTS FOR HEALTHY DIETS THROUGH THE PRODUCTION OF DIVERSIFIED FOODS
21
Figure 2: Global land area harvested per food groupThis figure illustrates that: 1) the vast majority of global agricultural crop land is used for cereal production; 2) the area of production has increased over the last 50 years, mainly for oilcrops.
This can partly be explained by the fact that subsidies and large research programmes generally have always emphasised major staple grains (IAASTD, 2009). In many countries the use of plant genetic resources is more and more managed by the private sector. This is not negative in itself but private sector breeding and seed enterprises are still largely restricted to a few crops for which farmers buy fresh seed every season (FAO, 2010). Rapid global urbanization enlarges the distance and disconnect between production and consumption and makes highly processed, easily transportable and storable foods, often processed grain and oil products, very convenient and relevant for urban as well as rural consumers. Fresh markets on the other hand, e.g. for fresh fruits, vegetables and animal-based products, naturally function better at local scale, are highly dependent on seasonality and require infrastructure investments (e.g. cold chains) that are often less developed in low-income settings.
Source: FAOSTAT, 2015
INFLUENCING FOOD ENVIRONMENTS FOR HEALTHY DIETS
22
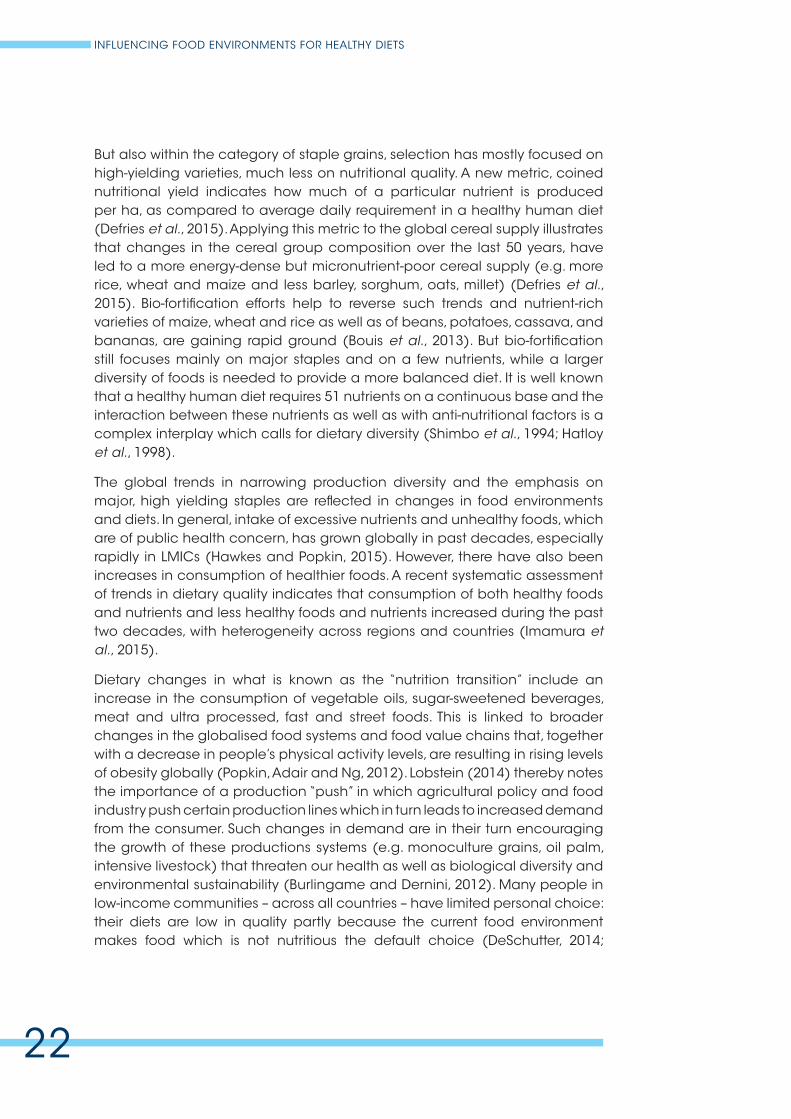
But also within the category of staple grains, selection has mostly focused on high-yielding varieties, much less on nutritional quality. A new metric, coined nutritional yield indicates how much of a particular nutrient is produced per ha, as compared to average daily requirement in a healthy human diet (Defries et al., 2015). Applying this metric to the global cereal supply illustrates that changes in the cereal group composition over the last 50 years, have led to a more energy-dense but micronutrient-poor cereal supply (e.g. more rice, wheat and maize and less barley, sorghum, oats, millet) (Defries et al., 2015). Bio-fortification efforts help to reverse such trends and nutrient-rich varieties of maize, wheat and rice as well as of beans, potatoes, cassava, and bananas, are gaining rapid ground (Bouis et al., 2013). But bio-fortification still focuses mainly on major staples and on a few nutrients, while a larger diversity of foods is needed to provide a more balanced diet. It is well known that a healthy human diet requires 51 nutrients on a continuous base and the interaction between these nutrients as well as with anti-nutritional factors is a complex interplay which calls for dietary diversity (Shimbo et al., 1994; Hatloy et al., 1998).
The global trends in narrowing production diversity and the emphasis on major, high yielding staples are reflected in changes in food environments and diets. In general, intake of excessive nutrients and unhealthy foods, which are of public health concern, has grown globally in past decades, especially rapidly in LMICs (Hawkes and Popkin, 2015). However, there have also been increases in consumption of healthier foods. A recent systematic assessment of trends in dietary quality indicates that consumption of both healthy foods and nutrients and less healthy foods and nutrients increased during the past two decades, with heterogeneity across regions and countries (Imamura et al., 2015).
Dietary changes in what is known as the “nutrition transition” include an increase in the consumption of vegetable oils, sugar-sweetened beverages, meat and ultra processed, fast and street foods. This is linked to broader changes in the globalised food systems and food value chains that, together with a decrease in people’s physical activity levels, are resulting in rising levels of obesity globally (Popkin, Adair and Ng, 2012). Lobstein (2014) thereby notes the importance of a production “push” in which agricultural policy and food industry push certain production lines which in turn leads to increased demand from the consumer. Such changes in demand are in their turn encouraging the growth of these productions systems (e.g. monoculture grains, oil palm, intensive livestock) that threaten our health as well as biological diversity and environmental sustainability (Burlingame and Dernini, 2012). Many people in low-income communities – across all countries – have limited personal choice: their diets are low in quality partly because the current food environment makes food which is not nutritious the default choice (DeSchutter, 2014;
1. INFLUENCING FOOD ENVIRONMENTS FOR HEALTHY DIETS THROUGH THE PRODUCTION OF DIVERSIFIED FOODS
23
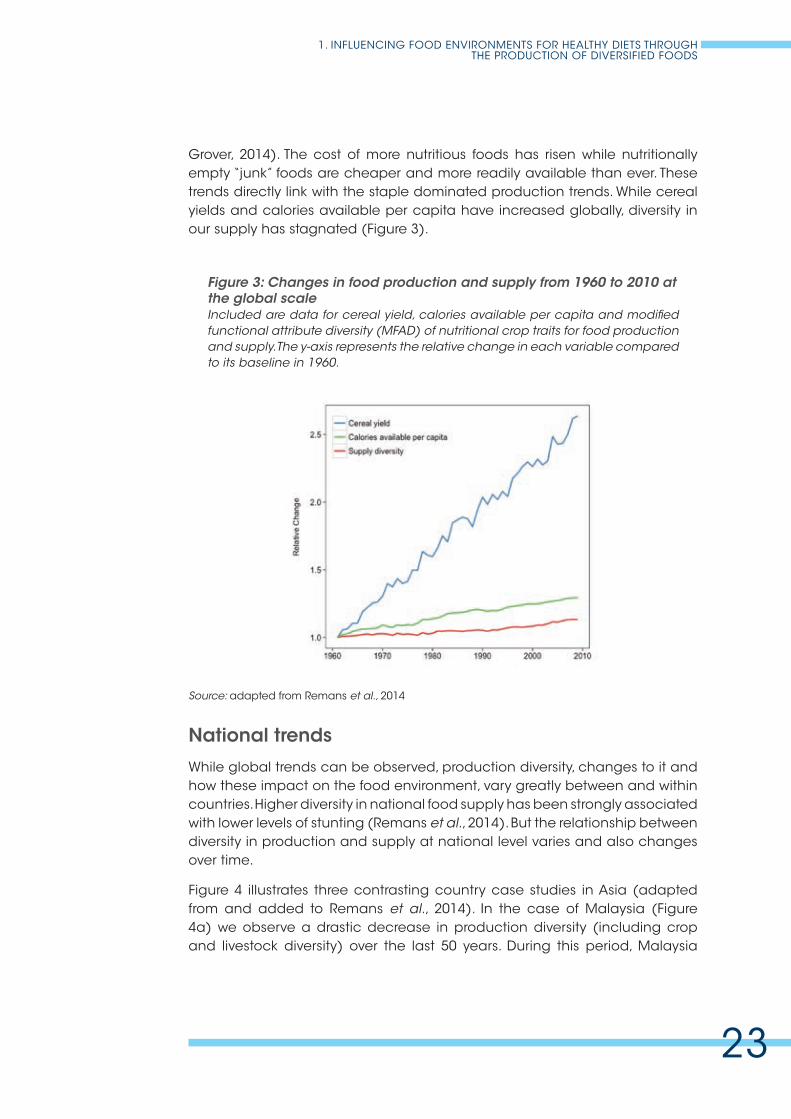
Grover, 2014). The cost of more nutritious foods has risen while nutritionally empty “junk” foods are cheaper and more readily available than ever. These trends directly link with the staple dominated production trends. While cereal yields and calories available per capita have increased globally, diversity in our supply has stagnated (Figure 3).
Figure 3: Changes in food production and supply from 1960 to 2010 at the global scaleIncluded are data for cereal yield, calories available per capita and modified functional attribute diversity (MFAD) of nutritional crop traits for food production and supply. The y-axis represents the relative change in each variable compared to its baseline in 1960.
National trends
While global trends can be observed, production diversity, changes to it and how these impact on the food environment, vary greatly between and within countries. Higher diversity in national food supply has been strongly associated with lower levels of stunting (Remans et al., 2014). But the relationship between diversity in production and supply at national level varies and also changes over time.
Figure 4 illustrates three contrasting country case studies in Asia (adapted from and added to Remans et al., 2014). In the case of Malaysia (Figure 4a) we observe a drastic decrease in production diversity (including crop and livestock diversity) over the last 50 years. During this period, Malaysia
Source: adapted from Remans et al., 2014
INFLUENCING FOOD ENVIRONMENTS FOR HEALTHY DIETS
24
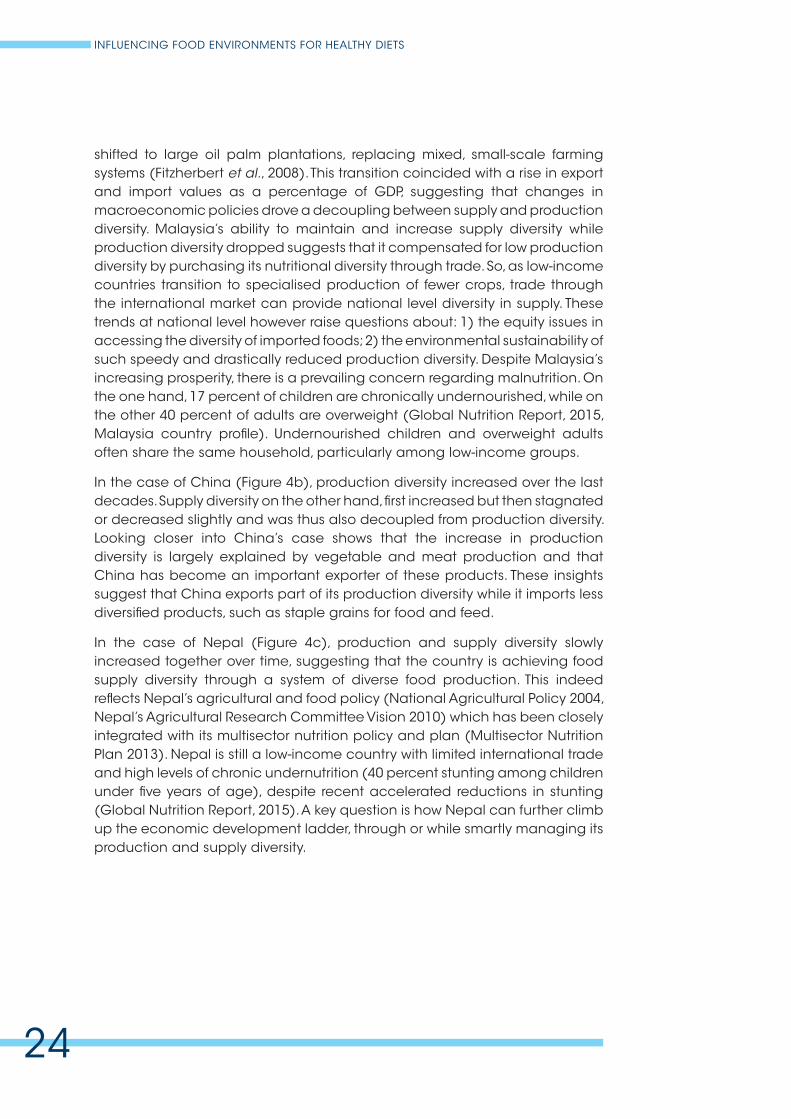
shifted to large oil palm plantations, replacing mixed, small-scale farming systems (Fitzherbert et al., 2008). This transition coincided with a rise in export and import values as a percentage of GDP, suggesting that changes in macroeconomic policies drove a decoupling between supply and production diversity. Malaysia’s ability to maintain and increase supply diversity while production diversity dropped suggests that it compensated for low production diversity by purchasing its nutritional diversity through trade. So, as low-income countries transition to specialised production of fewer crops, trade through the international market can provide national level diversity in supply. These trends at national level however raise questions about: 1) the equity issues in accessing the diversity of imported foods; 2) the environmental sustainability of such speedy and drastically reduced production diversity. Despite Malaysia’s increasing prosperity, there is a prevailing concern regarding malnutrition. On the one hand, 17 percent of children are chronically undernourished, while on the other 40 percent of adults are overweight (Global Nutrition Report, 2015, Malaysia country profile). Undernourished children and overweight adults often share the same household, particularly among low-income groups.
In the case of China (Figure 4b), production diversity increased over the last decades. Supply diversity on the other hand, first increased but then stagnated or decreased slightly and was thus also decoupled from production diversity. Looking closer into China’s case shows that the increase in production diversity is largely explained by vegetable and meat production and that China has become an important exporter of these products. These insights suggest that China exports part of its production diversity while it imports less diversified products, such as staple grains for food and feed.
In the case of Nepal (Figure 4c), production and supply diversity slowly increased together over time, suggesting that the country is achieving food supply diversity through a system of diverse food production. This indeed reflects Nepal’s agricultural and food policy (National Agricultural Policy 2004, Nepal’s Agricultural Research Committee Vision 2010) which has been closely integrated with its multisector nutrition policy and plan (Multisector Nutrition Plan 2013). Nepal is still a low-income country with limited international trade and high levels of chronic undernutrition (40 percent stunting among children under five years of age), despite recent accelerated reductions in stunting (Global Nutrition Report, 2015). A key question is how Nepal can further climb up the economic development ladder, through or while smartly managing its production and supply diversity.
1. INFLUENCING FOOD ENVIRONMENTS FOR HEALTHY DIETS THROUGH THE PRODUCTION OF DIVERSIFIED FOODS
25
Figure 4: Patterns of change over time in production diversity (green) and supply diversity (blue) for individual country case studiesDiversity is expressed as Shannon diversity.
Source: FAOSTAT, 2015 and adapted from Remans et al., 2014
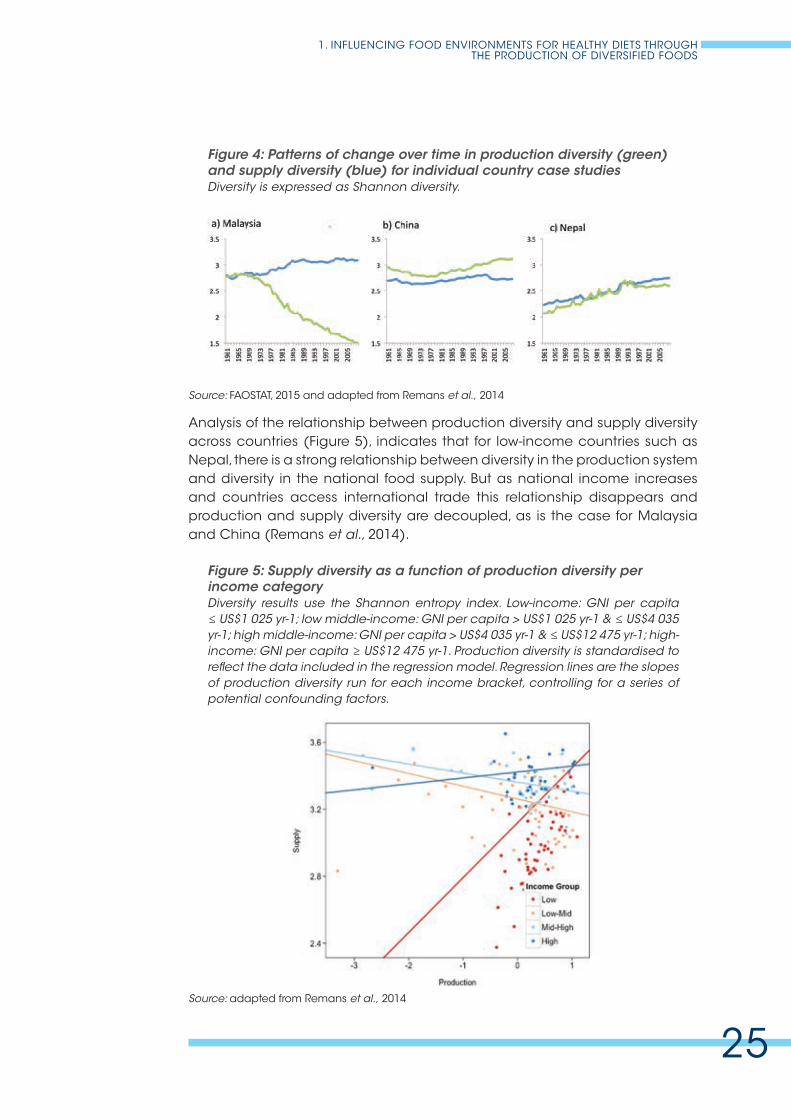
Analysis of the relationship between production diversity and supply diversity across countries (Figure 5), indicates that for low-income countries such as Nepal, there is a strong relationship between diversity in the production system and diversity in the national food supply. But as national income increases and countries access international trade this relationship disappears and production and supply diversity are decoupled, as is the case for Malaysia and China (Remans et al., 2014).
Figure 5: Supply diversity as a function of production diversity per income categoryDiversity results use the Shannon entropy index. Low-income: GNI per capita ≤ US$1 025 yr-1; low middle-income: GNI per capita > US$1 025 yr-1 & ≤ US$4 035 yr-1; high middle-income: GNI per capita > US$4 035 yr-1 & ≤ US$12 475 yr-1; high-income: GNI per capita ≥ US$12 475 yr-1. Production diversity is standardised to reflect the data included in the regression model. Regression lines are the slopes of production diversity run for each income bracket, controlling for a series of potential confounding factors.
Source: adapted from Remans et al., 2014
INFLUENCING FOOD ENVIRONMENTS FOR HEALTHY DIETS
26
Subnational and household trends
At subnational and household level, data on production diversity, changes to them and the relationship to the food environment, are often scattered, project-bound and difficult to compare. But some national and cross-country studies have recently been published identifying a number of general trends.
Several household studies show that on-farm production diversity is positively associated with dietary diversity in some situations, but not in all (Sibhatu et al., 2015; Jones et al., 2014; Luckett et al., 2015; Hirvonen and Hoddinott, 2014). When production diversity is already high the association is not significant or even turns negative because of foregone income benefits from specialisation (Sibhatu et al., 2015). Analysis of other factors reveals that market access has positive effects on dietary diversity which are larger than those of increased production diversity. Market transactions and market access also tend to reduce the role of farm diversity for household nutrition (Sibhatu et al., 2015; Hirvonen and Hoddinott, 2015; Luckett et al., 2015).
Interestingly this relationship between production and consumption diversity at household level and its dependance on market access is similar to that at national level described above, where the relationship between production and supply diversity weakens as access to international markets increases.
Although farmer specialisation can foster transitions out of poverty and strengthen local markets the effects of landscape specialisation on food environment and consumption patterns are much less studied. When entire landscapes transition to intensified commercial agriculture, there is risk, particularly in low-income settings, for markets to export nutritious or cash products and mainly import highly processed, easily transported products that contribute to undesirable nutrition transitions (Tshirley et al., 2014). United States rural food deserts, with low access to fresh, nutritious foods, overlap with highly intensified agriculture areas (Dutko et al., 2012).
Several countries, e.g. Ethiopia and Tanzania, apply an agricultural growth corridor, targeting large agricultural intensification investments to high potential areas. These investments are reflected by a substantial rise in agricultural productivity in these areas and support economic growth (Bachewe et al., 2015). But some preliminary studies indicate that this intensification is paired with a reduction in production diversity at species, genetic, household and landscape level (Duriaux and Baudron, 2015). In this case households in the more intensified, less diverse landscapes, but with better access to main markets and roads, had lower diet diversity compared with households in landscapes that are still more diverse (Duriaux and Baudron, 2015). It is not that in these more diverse areas every farmer is growing everything, but at the landscape level the accumulated production diversity is significantly larger.
1. INFLUENCING FOOD ENVIRONMENTS FOR HEALTHY DIETS THROUGH THE PRODUCTION OF DIVERSIFIED FOODS
27
There have also been several case studies from around the world that find a positive association between forests and different aspects of nutrition (Dounias et al., 2007; Powell, Hall and Johns, 2011; Johnston, Jacob and Brown, 2013). Ickowitz et al. (2014) use data from 21 African countries on children’s diets from the demographic and health surveys and MODIS data on tree cover. Their findings suggest that children in Africa who live in areas with more tree cover have more diverse and nutritious diets. They also find an inverted-U shaped relationship between tree cover and fruit and vegetable consumption. While much of the concern voiced by scientists decrying the expansion of agriculture into forests centres around loss of biodiversity (Foley et al., 2011; Gibbs et al., 2010; Green et al., 2005; Phalan et al., 2011), the study by Ickowitz and colleagues suggests that deforestation might also have a long-term negative impact on the food environment and nutrition. The drivers underpinning this relationship still need more research, but several pathways are hypothesised including access to wild foods, higher soil fertility, seasonality coping strategies, access to grazing land in the forest, access to fruit trees, social cohesiveness and the remote, subsistence setting of forest communities.
Farm and landscape diversity also plays a role in supporting the sustainability of agricultural and food systems. Agro-ecological research demonstrates that systems diversity can stimulate long-term productivity, stability, ecosystem services to and from agricultural lands and resilience to shocks (e.g. pests and diseases, climate, or price shocks) (Wood et al., 2015). Trade-offs between maintaining diversity at the field, landscape, or national scale for nutritional, economic, and environmental outcomes, therefore need careful consideration in food system recommendations, not only for short-term nutritional outcomes but also for long-term sustainability goals.
In terms of remote settings, strengthening market access to compensate for low production diversity, is easier said than done. Luckett et al. (2015) showed that isolated farms in Malawi have the lowest nutritional functional diversity and are regions where market-driven solutions are least likely, certainly over the short term. This same study showed that proximity to extension services in remote locations had significant impacts on increasing nutritional diversity of production systems and diets. Identifying which food group or functional group is missing from a whole diet perspective and strengthening capacity through extension services is a complementary and sometimes faster route than market integration for increasing dietary diversity of isolated rural households or communities.
Understanding these trends in production diversity at different scales and their relationship to the food environment can help design and target food production and food system interventions to specific contexts and across scales: production or market-based, or a combination; farm, subnational, national and/or global scale.
INFLUENCING FOOD ENVIRONMENTS FOR HEALTHY DIETS
28
MECHANISMS FOR CREATING A HEALTHY FOOD ENVIRONMENT THROUGH THE PRODUCTION OF DIVERSIFIED FOODS
In this section we review and discuss mechanisms for contributing to healthier food environments – i.e. food availability, accessibility, acceptability and desirability – through the production of diversified foods. We build on two main points from the previous sections. First, at a global level even without considering access issues we are producing too many cereals, oil crops, sugar and red meat and too few vegetables, fruits, legumes and nuts (Table 1). This global trend has increased over the last 50 years and is contributing to the nutrition transition with undesirable health outcomes. To create a healthier global food environment there is therefore a need to diversify particularly towards more fruits, vegetables, legumes and nuts and increase the availability, affordability and desirability of those food groups throughout the year. Second, dependent on market penetration, diversity in the local production system, at farm, landscape, or country level, leads to either greater or lesser diversity in local food availability and consumption.
Markets play a key role in diversifying the food environment. Increased access to markets sometimes develops alongside a reduction in local production diversity. Often, two distinct options emerge: agricultural intensification on the one hand, with a focus on maximising productivity and linking to national and international markets and the option of diversification on the other hand, with a focus on diversified livelihoods and minimised risk. The impact of these two options however, needs to be considered more holistically in relation to the relative trade-offs in terms of income, nutrition and environment that may result. An increasing number of studies show that species diversity, with adequate management practices, can stimulate productivity as well as stability, ecosystem services, nutritional functions and resilience in agricultural (and natural) ecosystems (Wood et al., 2015), thereby bringing multiple benefits.
One of the top 100 questions of importance to global agriculture is: under which environmental and institutional conditions will increasing agrobiodiversity at farm and landscape levels result in increased livelihood opportunities and income? (Pretty et al., 2010). We consider this particular question below while reviewing diversification mechanisms and pathways and searching for synergies while avoiding or minimising trade-offs between nutrition,
1. INFLUENCING FOOD ENVIRONMENTS FOR HEALTHY DIETS THROUGH THE PRODUCTION OF DIVERSIFIED FOODS
29
economic development and the environment. Strengthening markets and diversifying production can be complementary, if consumers, markets and related institutions demand and support a diversity of products. In addition, we try to place diversification within the dynamics of modern food systems, characterised by a growing population, rapid urbanisation, supermarket revolutions and agricultural landscapes in transition. Rural-urban linkages thereby comprise the framework of our food systems. In that context, we explore how production diversification can benefit both rural and urban diets.
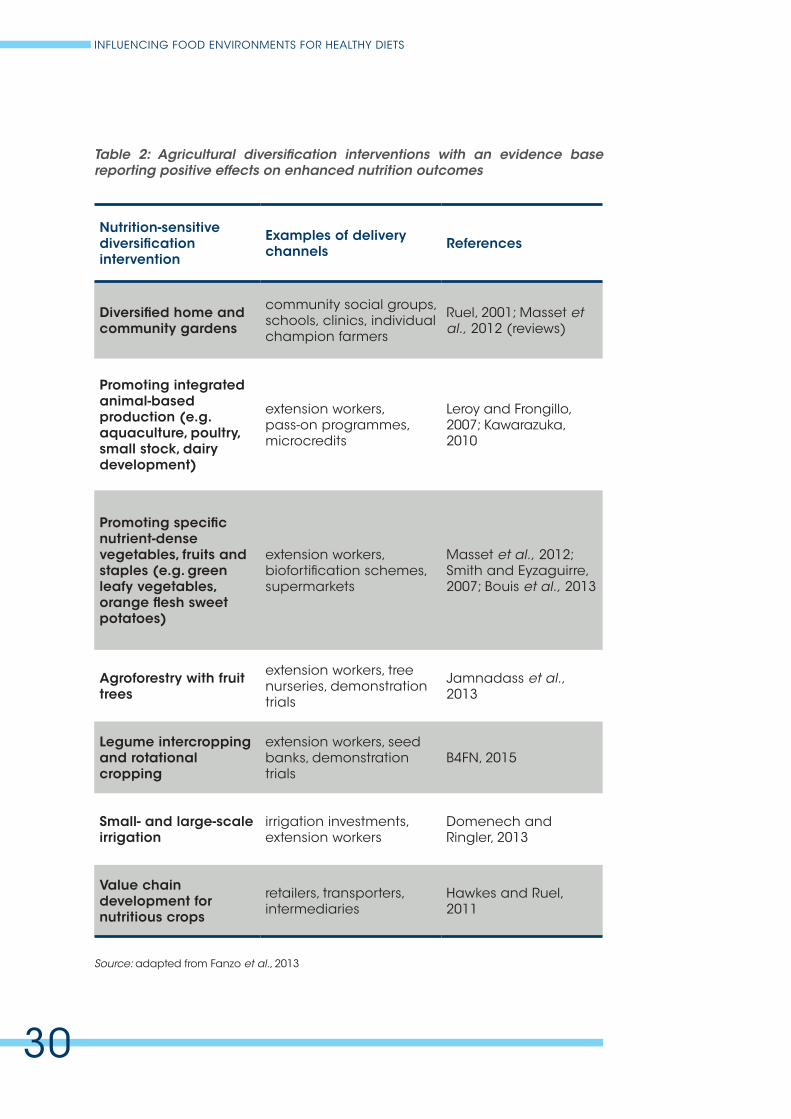
In the agriculture-nutrition literature, promising diversification interventions/ programmes have been identified with a positive impact on diets and nutrition (Fanzo et al., 2013; Fanzo et al., 2014; Masset et al., 2012; Ruel and Anderman, 2013, Table 2). One of the most studied interventions here includes diversified home and community gardens. Numerous studies have recorded the positive effects on diet diversity and women’s income generation from such gardens across a variety of settings (Ruel, 2001; Masset et al., 2012). The promotion of local animal production (including aquaculture, small-scale fisheries, dairy development, poultry and animal husbandry) and specific vegetables and fruits (e.g. African green leafy vegetables) has increased consumption of these specific products but the overall effect on the diet remains unclear (Leroy and Frongillo, 2007; Kawarazuka, 2010). Other studies have shown the positive effect of agroforestry and legume intercropping on diet diversity (Jamnadass et al., 2013; Biodiversity for Nutrition and Health Project 2013).
In addition to improving nutrition, these practices also enhance the availability of other ecosystem services such as soil erosion control and soil fertility. Exploring genetic diversity, to select and breed nutrient-dense biofortified varieties, e.g. of beans, has also proven a particularly efficient way to increase intake of specific micronutrients. Small-scale irrigation using for example water harvesting techniques to collect irrigation water can facilitate many of the agricultural diversification activities mentioned above and thereby improve nutrition outcomes (Domenech and Ringler, 2013). Finally value chain development for nutritious foods strengthening the linkages between production, consumption and demand for them is considered key to ensure diversified production enters into the food environments and leads to diversified diets (Hawkes and Ruel, 2011).
INFLUENCING FOOD ENVIRONMENTS FOR HEALTHY DIETS
30
Table 2: Agricultural diversification interventions with an evidence base reporting positive effects on enhanced nutrition outcomes
Nutrition-sensitive diversification intervention
Examples of delivery channels References
Diversified home and community gardens
community social groups, schools, clinics, individual champion farmers
Ruel, 2001; Masset et al., 2012 (reviews)
Promoting integrated animal-based production (e.g. aquaculture, poultry, small stock, dairy development)
extension workers, pass-on programmes, microcredits
Leroy and Frongillo, 2007; Kawarazuka, 2010
Promoting specific nutrient-dense vegetables, fruits and staples (e.g. green leafy vegetables, orange flesh sweet potatoes)
extension workers, biofortification schemes, supermarkets
Masset et al., 2012; Smith and Eyzaguirre, 2007; Bouis et al., 2013
Agroforestry with fruit trees
extension workers, tree nurseries, demonstration trials
Jamnadass et al., 2013
Legume intercropping and rotational cropping
extension workers, seed banks, demonstration trials
B4FN, 2015
Small- and large-scale irrigation
irrigation investments, extension workers
Domenech and Ringler, 2013
Value chain development for nutritious crops
retailers, transporters, intermediaries
Hawkes and Ruel, 2011
Source: adapted from Fanzo et al., 2013
1. INFLUENCING FOOD ENVIRONMENTS FOR HEALTHY DIETS THROUGH THE PRODUCTION OF DIVERSIFIED FOODS
31
Combining this growing evidence from the agriculture-nutrition literature with insights on trends in food system diversity we suggest here five approaches that can contribute to a healthy food environment through production of diversified foods. Across all these five approaches, gender, the engagement of women and men and consideration of their power relationships, will be crucial for the success of each approach (Herforth and Harris, 2014).
The innovative garden approach
While considered by some as old fashioned, home, institutional and community gardens are gaining new and widespread traction inspired partly by the agriculture-nutrition evidence base, but also by a global environmental sustainability movement that promotes locally grown foods and diversity. In addition to the rural, more traditional homestead, school and community gardens, the recent increase in urban gardens, particularly in the Global North, aims to contribute to sustainable urban development and healthy diets particularly the consumption of local vegetables, fruits and smallstock. Community gardens also serve more and more as an educational tool, social meeting and empowerment place (e.g. school gardens and gardens for health at clinics). Innovative garden approaches can increase the availability, affordability and desirability of fresh nutritious foods directly for the producing households and communities as well as reaching to a larger population through local markets.
Mixed and integrated farming systems
A defining characteristic of smallholder production is the often intricate ways in which landholders organise production systems with a view to food and nutrition security (Fanzo, Remans and Termote, 2016). For example, flooded rice paddies are used as fish ponds which provide households with protein; fallow fields are used for grazing which provides sources of milk and dung; tree crops are often inter-cropped with beneath-canopy subsistence crops. In many such cases, inter-cropping and livestock-crop rotation practices can represent seasonal coping strategy needs in contexts where income streams and food availability vary within annual cropping cycles and additionally can provide robust ways to satisfy micronutrient and protein needs which might be expensive or otherwise difficult to access via the market.
Diversity through mixed and integrated farming systems is not only important for nutrient-related outcomes but can benefit multiple aspects of the food system and thereby also influence nutrition also more indirectly. Species diversity has been shown to stimulate productivity, stability, ecosystem services and resilience in natural and in agricultural ecosystems (Cadotte, Dinnage and Tilman, 2012; Gamfeldt et al., 2013; Zhang, Chen and Reich, 2012; Kremen
INFLUENCING FOOD ENVIRONMENTS FOR HEALTHY DIETS
32
and Miles, 2012; Wood et al., 2015). Crop plants that depend on pollinators are key sources of vitamins A and C and folic acid and on-going pollinator decline may exacerbate current challenges to accessing a nutritionally adequate diet (Myers et al., 2014; Chaplin-Kramer et al., 2014). In general, increasing the number of species in a community or system will expand the number of functions provided by that community and reinforce the stability of provision of those functions (DeClerck et al., 2011).
Small-scale integrated farming is often labour and knowledge intensive. With many young people moving from rural areas to the cities and a competing globalised food supply from large-scale industrialised agriculture, small-scale farmers and mixed farms are more and more under economic and social pressure. At the same time agriculture is under the increasing pressures of climate change, biodiversity loss and natural resource scarcity. There is a growing trend to recognise and empower farming’s importance not just in terms of food security and livelihood generation but human health, environmental sustainability, economic growth and cultural identity. This multifunctional character of agriculture (IAASTD, 2009) can also attract youth, new science and application, to engage in innovative forms of mixed and integrated agriculture, as is increasingly observed in parts of Europe and the United States.
A key question is how these small-scale integrated farmers can efficiently connect to markets and increase the local economic return and affordability of production diversity.
Michelson (2016) analyses the process and effect on small farmers of big retailers sourcing more directly from them, with a case study in China and Nicaragua in the horticulture sector. As developing nations liberalise their markets and open their economies to foreign direct investment, international capital flows into the agrifood sector. A key feature of these investments is the transformation of agricultural marketing systems, the services and activities involved in bringing an agricultural product from the farm to the consumer. Big retailers and large supermarkets play a key role in this and increasingly source directly from farmers to increase efficiency, traceability and coordination. Michelson finds that a subset of small farmers indeed is able to escape from poverty by contracting with big retailers, this is particularly so for farmers in high potential areas connected with roads, electricity, water etc.
1. INFLUENCING FOOD ENVIRONMENTS FOR HEALTHY DIETS THROUGH THE PRODUCTION OF DIVERSIFIED FOODS
33
Balancing specialisation and diversification at farm and landscape scale
Farmer specialisation can foster transitions out of poverty and strengthen local markets but trade-offs are also possible and observed. The so called “curse of the cash crops”, points to how specialisation into high-value cash crops, mainly for sale, can lead to negative effects on food and nutrition security. A case study in Ghana (Anderman et al., 2014) showed that households which mainly focused on cash crop production as a livelihood strategy, oilpalm and cacao in this case, had lower dietary diversity and lower overall food security than households in the same area who diversified more into food crops and allocated less land to cash crops. The study happened in a particular context, where prices at local food markets had recently increased, partly because of the global economic and food crisis of 2008 and partly because of the inflow of Chinese migrants working in the local gold mine industry. This while the supply of food from local production to the local markets was decreasing rather than increasing because farmers had been dedicating more land to cash crops as well as to gold mining.
As discussed above the effects of whole landscape specialisation on food environment and consumption patterns might come with several additional risks such as vulnerability to climate change, pests and diseases and soil erosion and degradation. Forests and tree cover also play an important role in landscape management for food and nutrition security and overall sustainability of the food environment as also discussed above.
Searching for a balance between specialisation and diversification at farm and landscape scale to foster synergies between income, nutrition, labour and environmental outcomes is a difficult but key process in creating a healthy food environment through multifunctional agriculture. Best-bet options depend on the market, agro-ecological and institutional context. New decision-support tools, including multiobjective modeling and spatial ecosystem service mapping and trade-off models (e.g. Groot and Rossing, 2011; Groot, Oomen and Rossing, 2012), have been developed and tested to support such decisions at farm, community, subnational and/or national level.
INFLUENCING FOOD ENVIRONMENTS FOR HEALTHY DIETS
34
Making markets work to stimulate production diversity and benefit the poor
Most investments in value chain strengthening in low-income settings have focused on value chains of major staple and cash crop products, much less on facilitating a diversity of more nutritious products that penetrate local, rural-urban and global markets and make these more affordable and desirable (Stoian, Donovan and Eias, 2015). Two recent implementation models are examples that take a whole-diet market-based approach to strengthen value chains for a diversity of products. One model is called the Marketplace for nutritious foods (GAIN). The Marketplace empowers local social entrepreneurs who have promising ideas to increase access to nutritious foods in the local markets with seed funding, business capacity and networking. A selection of ideas goes through a peer-review, where local entrepreneurs submit ideas to a regional multi-stakeholder committee.
Another approach to stimulate production diversity through market-based approaches is the multichain approach (Stoian, Donovan and Eias, 2015). A multichain approach aims to strengthen multiple value chains simultaneously and leverage synergies between those to benefit livelihoods and whole diets. Agrifood value chains serve as a vehicle for connecting the producers of such foods with consumers in peri-urban and urban areas. Nutrition-sensitive value chains can reach low-income consumers if the food is affordable and culturally acceptable. This requires effective forward and backward linkages in the value chain, an enabling environment of public and private policies and institutions and increased efficiencies to ensure that producer prices provide sufficient incentive for quality and sustainable production.
These two examples have potential to strengthen local markets, in combination with a process of globalisation. Globalisation also offers key opportunities for production and market diversification. Some previously so-called underutilised crops, such as quinoa, African green leafy vegetables and a variety of fruits, can now be found in markets across the globe, spurring demand for these crops. Strengthening local markets and enabling global markets should go hand in hand.
1. INFLUENCING FOOD ENVIRONMENTS FOR HEALTHY DIETS THROUGH THE PRODUCTION OF DIVERSIFIED FOODS
35
Genetic resource management: combining in-situ and ex-situUnderpinning all the diversity described above are plant and animal genetic resources. Managing those genetic resources in terms of conservation and access for use and innovation is crucial for creating an enabling and inspiring environment for food production diversification.
Ex-situ conservation continues to represent the most significant and widespread means of conserving plant genetic resources for food and agriculture (FAO, 2010). But in-situ conservation that also allows evolutionary selection processes is gaining more and more ground, particularly in the context of strengthening local food systems, for resilience and cultural diversity (FAO, 2010).
CONCLUDING RECOMMENDATIONS
The review of this topic leads to the formulation of five cross-cutting recommendations to create a healthy food environment through the production of diverse foods.
1. Monitor trends in agrobiodiversity, in production, markets and consumption, at sub-national, national and global trends. Agrobiodiversity in different components of the food system can be linked to better nutrition, resilience, biodiversity conservation and also to productivity and income, in the short and the long term. For these reasons, it is important to understand what is happening with our food system diversity.
2. Invest through context-appropriate ways in production and value chains of fruits, vegetables, legumes, nuts and some integrated animal-based products. The world and many local food environments are falling short in these products that are needed to provide healthy diets for all.
3. Include multi-functionality of agriculture into considerations of specialisation versus diversification at farm, landscape and national scale.
4. Aim to strengthen local fresh food markets in combination with national and global markets for a diversity of products and stimulate demand and supply for fresh produce simultaneously.
5. Conserve, explore and use the genetic diversity of local and global food systems.
INFLUENCING FOOD ENVIRONMENTS FOR HEALTHY DIETS
36
REFERENCES
Anderman, T.L., Remans, R., Wood, S., DeRosa, K. & DeFries, R. 2014. Synergies and trade-offs between cash crop production and food security: a case study in rural Ghana. Food Sec. 1-14.
Bachewe, F.N., Berhane, G., Minten, B. & Taffesse, A.S. 2015. Agricultural growth in Ethiopia (2004-2014): Evidence and Drivers.
Biodiversity for Nutrition and Health Project, available at www.b4fn.org/.
Bouis, H.E., Hotz, C., McClafferty, B., Meenakshi, J.V. and Pfeiffer, W.H. 2013. Biofortification: a new tool to reduce micronutrient malnutrition. Food Nutr. Bull. 32(1 Suppl):S31-40.
Burlingame, B. & Dernini, S. 2012. Sustainable diets and biodiversity: directions and solutions for policy, research and action. FAO and Bioversity International, EarthScan. Abingdon.
Cadotte, M.W., Dinnage, R. & Tilman, D. 2012. Phylogenetic diversity promotes ecosystem stability. Ecology 93, S223–S233.
Chaplin-Kramer, R., Dombeck, E., Gerber, J., Knuth, K.A., Mueller, N.D., Mueller, M., Ziv, G., Klein, A.M. 2014. Global malnutrition overlaps with pollinator-dependent micronutrient production. Proc. Biol. Sci. 281: 1794.
DeClerck, F.A.J., Fanzo, J., Palm, C., Remans, R. 2011. Ecological approaches to human nutrition. Food Nutr. Bull. 32, S4–13.
DeFries, R., Fanzo, J., Remans, R., Palm, C., Wood, S. & Anderman, T.L. 2015. Global nutrition. Metrics for land-scarce agriculture. Science 17, 349:238-40.
DeSchutter, O. 2014. Final report: the transformative potential of the right to food. New York, United Nations Human Rights Council.
Domenech, L. & Ringler, C. 2013. The impact of irrigation on nutrition, health, and gender. Washington DC, The International Food Policy Research Institute (IFPRI).
Dounias, E, Selzner, A., Koizumi, M. & Levang, P. 2007. From sago to rice, from forest to town. The consequences of sedentarization on the nutritional ecology of Punan former hunter-gatherers of Borneo. Food Nut. Bull., 28 pp. S294–S302.
Duriaux, J.Y. & Baudron, F. 2015. Landscape mosaics and rural livelihoods along an intensification gradient in Arsi-Negele, Ethiopia. The New Agrarian Change. Technical project report, September 2015.
1. INFLUENCING FOOD ENVIRONMENTS FOR HEALTHY DIETS THROUGH THE PRODUCTION OF DIVERSIFIED FOODS
37
Dutko, P, Ver Ploeg, M. & Farrigan, T. 2012. Characteristics and influential factors of food deserts. US Department of Agriculture, Economic Research Service, ERR-1401.
Fanzo, J., Curran, S., Remans, R., Mara, V., Sanchez, J., Cisewski D., Denning G. & Fracassi, P. 2014. Simulating potential of nutrition-sensitive investments. Technical study for the scaling-up nutrition movement. New York, Columbia University.
Fanzo, J., Hunter, D., Borelli T. & Matei, F. 2013. Diversifying foods and diets. Using agricultural biodiversity to improve nutrition and health. New York, Routledge.
Fanzo, J., Remans, R. & Termote, C. 2016. Smallholders, agro-biodiversity and mixed cropping and livestock systems. Pritchard, B, et al. eds. Routledge Handbook on Food and Nutrition security. Chapter 32. forthcoming.
FAO. 2010. The second report on the state for the world’s plant genetic resources for food and agriculture. Commission on genetic resources for food and agriculture. UN Food and Agriculture Organization. Rome.
Fitzherbert, E., Struebig, M., Morel, M.J., Danielsen, A., Bruhl, F., Donald, C.A. & Phalan, B. 2008. How will oil palm expansion affect biodiversity? Trends Ecol. Evol. 23, 538–545.
Foley, J.A, et al. 2011. Solutions for a cultivated planet. Nature 478: 337-342.
Frison, E.A., Smith, I.F., Johns, T., Cherfas, J. & Eyzaguirre, P.B. 2006. Agricultural biodiversity, nutrition, and health: making a difference to hunger and nutrition in the developing world. Food Nutr. Bull. 27, 167–179.
Gamfeldt, L., Snäll, T., Bagchi, R., Jonsson, M., Gustafsson, L., Kjellander, P. et al. 2013. Higher levels of multiple ecosystem services are found in forests with more tree species. Nat. Commun. 4, 1340.
Gibbs, H.K., Ruesch, A.S., Achard, F., Clayton, M.K., Holmgren, P.K., Ramankutty, N. & Foley, J.A. 2010. Tropical forests were the primary sources of new agricultural land in the 1980s and 1990s. Proc. Nat. Acad. Sc. USA 107: 16732–16737.
Global Alliance for Improved Nutrition (GAIN). The marketplace for nutritious foods, available at www.gainhealth.org/knowledge-centre/project/mar-ketplace-for-nutritious-foods/.
Global Nutrition Report. 2015. Washington DC, IFPRI.
Graham, R.D., Welch, R.M., Saunders, D.A., Ortiz-Monasterio, I., Bouis, H.E., Bonierbale, M., de Haan, S., Burgos, G., Thiele, G., Liria, R. et al. 2007. Nutritious subsistence food systems. Adv. Agron. 92, 1–74.
INFLUENCING FOOD ENVIRONMENTS FOR HEALTHY DIETS
38
Green R.E., Cornell, S.J., Scharlemann, J.P.W. & A. Balmford, A. 2005. Farming and the fate of wild nature. Science, 307: 550–555.
Groot, J.C.J., Oomen, G.J.M. & Rossing, W.A.H. 2012. Multi-objective optimization and design of farming systems. Ag. Systems, 110, 63–77.
Groot, J.C.J. & Rossing, W.A.H. 2011. Model-aided learning for adaptive management of natural resources: an evolutionary design perspective. Methods in Ecol. and Evol., 2(6), 643–650.
Grover, A. 2014. Report of the Special Rapporteur on the right of everyone to the enjoyment of the highest attainable standard of physical and mental health: Unhealthy foods, non-communicable diseases and the right to health. Human Rights Council.
Hatloy, A., Torheim, L. & Oshaug, A. 1998. Food variety a good indicator of nutritional adequacy of the diet? A case study from an urban area in Mali, West Africa. Eur. J. Clin. Nutr. 52, 891–898.
Hawkes, C., Popkin, B.M. 2015. Can the sustainable development goals reduce the burden of nutrition-related non-communicable diseases without truly addressing major food system reforms? BMC Med. 16;13:143.
Hawkes, C. & Ruel, M. 2011. Value chains for nutrition. 2020 Conference Paper 4, International Food Policy and Research Institute, 2011.
Herforth, A. & Ahmed, S. 2015. The food environment, its effects on dietary consumption, and potential for measurement within agriculture-nutrition interventions. Food Sec 7: 505–520.
Herforth, A. & Harris, J. 2014. Understanding and applying primary pathways and principles. Brief #1. Improving nutrition through agriculture technical brief series. Arlington: USAID/Strengthening Partnerships, Results, and Innovations in Nutrition Globally (SPRING) Project.
Hirvonen, K. & Hoddinott, J. 2014. Agricultural Production and Children’s Diets: Evidence from rural Ethiopia. Ethiopia Strategy Support Program Working Paper, No 69.
International Assessment of Agricultural Knowledge, Science and Technology for Development. 2009. Washington DC, Island Press.
Ickowitz, A., Powell, B., Salim, M.A. & Sunderland, T. 2014. Dietary quality and tree cover in Africa. Global Environ.Change 24: 287-294.
1. INFLUENCING FOOD ENVIRONMENTS FOR HEALTHY DIETS THROUGH THE PRODUCTION OF DIVERSIFIED FOODS
39
Imamura, F., Micha, R., Khatibzadeh, S., Fahimi, S., Shi, P., Powles, J. & Mozaffarian, D.2015. Global Burden of Diseases Nutrition and Chronic Diseases Expert Group (NutriCoDE). Dietary quality among men and women in 187 countries in 1990 and 2010: a systematic assessment. Lancet Glob. Health. Mar; 3(3):e132-42.
Jamnadass, R., Place, F., Torquebiau, E., Malézieux, E., Iiyama, M., Sileshi, G.W., Kehlenbeck, K., Masters, E., McMullin, S., Weber, J.C. & Dawson, I.K. 2013. Agroforestry, food and nutritional security. ICRAF Working Paper No. 170. Nairobi, World Agroforestry Centre. DOI, available at http://dx.doi.org/10.5716/WP13054.PDF.
Johnston, K., Jacob, A., Brown, M. 2013. Forest cover associated with improved child health and nutrition: evidence from the Malawi Demographic and Health Survey and satellite data. Global Health: Science and Practice, 1 (2),237–248.
Jones, A., Schrinivas, A. & Bexner-Kerr, R. 2014. Farm production diversity is associated with greater household dietary diversity in Malawi: findings from nationally representative data. Food Pol. 46: 1-12.
Kawarazuka, N. 2010. The contribution of fish intake, aquaculture and small-scale fisheries to improving food and nutrition security: a literature review. The WorldFish Center Working Paper No.2106. Penang, Malaysia, The WorldFish Center.
Khoury, C.K., Bjorkman, A.D., Dempewolf, H., Ramirez-Villegas, J., Guarino, L., Jarvis, A., Rieseberg & L.H., Struik, P.C. 2014. Increasing homogeneity in global food supplies and the implications for food security. Proc. Ntnl. Acad. Sci. USA 111, 4001–4006.
Kremen, C. & Miles, A. 2012. Ecosystem services in biologically diversified versus conventional farming systems: benefits, externalities, and trade-offs. Ecol. Soc. 17, 40.
Leroy, J.L. & Frongillo, E.A. 2007. Can interventions to promote animal production ameliorate undernutrition? Jnl Nutr.137 (10): 2311-6.
Lim, S.S., Vos, T. & Flaxman A.D., et al. 2012. A comparative risk assessment of burden of disease and injury attributable to 67 risk factors and risk factor clusters in 21 regions, 1990-2010: a systematic analysis for the Global Burden of Disease Study 2010. Lancet 380 (9859):2224-60.
Lobstein, T. 2014. Creating Demand. Presentation at Oxford University, available at www.wphna.org/Oxford2014/wp-content/uploads/2014/09/Lobstein_OxfordWPHNA+1.pdf.
INFLUENCING FOOD ENVIRONMENTS FOR HEALTHY DIETS
40
Luckett, B.G., DeClerck, F.A., Fanzo, J., Mundorf, A.R.& Rose, D. 2015. Application of the Nutrition Functional Diversity indicator to assess food system contributions to dietary diversity and sustainable diets of Malawian households. Pub. Health Nutr. 18:2479-87.
Masset, E, Haddad, L., Cornelius, A. & Isaza-Castro, J. 2012. Effectiveness of agricultural interventions that aim to improve nutritional status of children: systematic review. Brit. Med. Jnl, v.344. Open access, available at www.bmj.com/content/344/bmj.d8222.
Michelson, H. 2016. Small farmers, big retailers: are new sourcing strategies a path to inclusion? The Chicago Council on Global Affairs, Research paper, February.
Murray, C. 2014. Metrics for healthy and sustainable food systems. Presentation at the EAT Forum, Stockholm. May.
Myers, S.S., Zanobetti, A., Kloog, I., Huybers, P., Leakey, A.D., Bloom, A.J., Carlisle, E., Dietterich, L.H, Fitzgerald, G., Hasegawa, T., Holbrook, N.M., Nelson, R.L., Ottman, M.J., Raboy, V., Sakai, H., Sartor, K.A., Schwartz, J., Seneweera, S., Tausz, M.. & Usui, Y. 2014. Increasing CO2 threatens human nutrition. Nature 5; 510(7503): 139-42.
Phalan B. A., Balmford, R.E., Green, J.P.W. & Scharlemann. 2011. Minimising the harm to biodiversity of producing more food globally. Food Pol., 36: S62–S71.
Popkin, B.M., Adair, L.S., Ng, S.W. 2012. Global nutrition transition and the pandemic of obesity in developing countries. Nutr. Rev. 70: 3-21.
Powell, B., Hall, J. & T. Johns, T. 2011. Forest cover, use and dietary intake in the East Usambara Mountains, Tanzania Intl For. Rev., 13.
Pretty, J., Sutherland, W. J., Ashby, J., Auburn, J., Baulcombe, D., Bell, M., Burke, J. 2010. The top 100 questions of importance to the future of global agriculture. Intnl Jnl of Ag. Sustainability, 8(4), 219–236. doi:10.3763/ijas.2010.0534.
Remans, R., Wood, S.A., Saha, N., Anderman, T.L. & DeFries, R.S. 2014. Measuring nutritional diversity of national food supplies. Global Food Sec. 3 (3), 174-182.
Ruel, M., 2001. Can food-based strategies help reduce vitamin A and iron deficiencies? a review of recent evidence. Washington DC, International Food Policy Research Institute.
1. INFLUENCING FOOD ENVIRONMENTS FOR HEALTHY DIETS THROUGH THE PRODUCTION OF DIVERSIFIED FOODS
41
Ruel, M.T., Alderman, H. and the Maternal and Child Nutrition Study Group. 2013. Nutrition-sensitive interventions and programs: how can they help accelerate progress in improving maternal and child nutrition? Lancet 382: 536 - 551.
Shimbo, S., Kimura, K., Imai, Y., Yasumoto, K., Yamamoto, K., et al. 1994. Number of food items as an indicator of nutrient intake. Ecol. Food Nutr. 32, 197–206.
Sibhatu, K., Krishna, V.V. & Qaim, M. 2015. Production diversity and diet diversity in smallholder farmer households. Proc. Natnl Acad. Sci. USA 112: 10657–10662.
Siegel, K.R., Ali, M.K., Srinivasiah, A., Nugent, R.A. & Narayan, K.M.V. 2014. Do we produce enough fruits and vegetables to meet global health needs? PLoS ONE 9(8): e104059.
Smith, I.F. & Eyzaguirre, P. 2007. African leafy vegetables: their role in the World Health Organization’s Global Fruit and Vegetable Initiative. African Jnl of Food Ag. Nut. and Dev. 7: 1684-5374.
Stoian, D., Donovan, J. & Eias, M. 2015. Extended abstract in response to agri-gender call for papers and write-shop – linking livelihoods and gender with value chain development: the case for a multi-chain approach to rural poverty reduction.
Swinburn, B., Dominich, C. H., & Vandevijvere, S. 2014. Benchmarking food environments: experts’ assessments of policy gaps and priorities for the New Zealand government. Auckland: University of Auckland.
Tschirley, D., Reardon, T., Dolislager, M. & Snyder, T. 2014. The rise of a middle class in East and Southern Africa. Implications for food system transformation. WIDER Working Paper 2014/119.
West, P.C., et al. 2014. Leverage points for improving global food security and the environment. Science 345: 325-328.
Wood, S.A., Karp, D.S., DeClerck, F.A., Kremen, C., Naeem, S. & Palm, C.A . 2015. Functional traits in agriculture: agrobiodiversity and ecosystem services. TREE 30(9): 531–539.
Zhang, Y., Chen, H.Y.H. & Reich, P.B. 2012. Forest productivity increases with evenness, species richness and trait variation: a global meta-analysis. Jnl Ecol. 100, 742–749.

INFLUENCING FOOD ENVIRONMENTS FOR HEALTHY DIETS THROUGH FOOD SAFETY
Delia Grace
CHAPTER 2:

2. INFLUENCING FOOD ENVIRONMENTS FOR HEALTHY DIETS THROUGH FOOD SAFETY
45
THE CONCEPT OF A HEALTHY FOOD ENVIRONMENT
In recent decades there has been growing interest in how the food and nutrition environment (hereafter called the “food environment”) affects nutrition outcomes. The food environment has been defined as the collective physical, economic, policy and sociocultural context that influences people’s consumption choices and nutritional status (Vandevijvere and Swinburn, 2014). It includes all the determinants of consumption that are not clearly individual factors (e.g. attitudes, beliefs and skills). It makes intuitive sense that food environments are powerful drivers of nutrition and health outcomes and this has led to a surge in research, policy formulation and interventions aimed at supporting healthy food environments.
Recent systematic reviews summarise: how food environments are assessed (Kirkpatrick et al., 2014; Lamb et al., 2015); how food environments are associated with diet and nutrition outcomes (Caspi et al., 2012; Engler-Stringer et al., 2014); and how they can be positively modified (Roy et al., 2015). These reviews find that food environments can be assessed along various dimensions (including geographic, organizational and access) using a range of direct and indirect measures. They find that initiatives to create more supportive food environments vary from light touch (e.g. calorie labelling on restaurant menus) to heavy (e.g. restricting calorie-rich food) and tend to show a significant (but often small to moderate) improvement in behaviour and health outcomes. However, most studies have been carried out in developed countries where the main interest is in ameliorating obesogenic environments, limiting their global applicability. Many studies had methodological weaknesses making it difficult to draw strong conclusions on causality. Previous reviews have not considered the role of food safety in creating a healthy food environment.
FOOD ENVIRONMENTS AND FOOD SAFETY
Food safety issues can affect health directly by making people sick (primary disease pathway) and indirectly by influencing people to change their food consumption behaviour (secondary consumption pathway). This in turn can have additional indirect effects such as reducing the income of people in agrifood chains or making food provision programmes more reluctant to provide food perceived to be risky. A third pathway is through control attempts, either condemnation of unsafe food or control in animal hosts, which can have additional affects such as reducing food availability.
INFLUENCING FOOD ENVIRONMENTS FOR HEALTHY DIETS
46
What is the relative importance of the three pathways (disease, food fears and disease control)? The influence of food safety on non-health, indirect pathways is difficult to assess, but a thought experiment would suggest disease, disease control and indirect effects on income are most important in developing countries and food fears are most important in developed countries.
In developing countries food-borne disease (FBD) accounts for around 31 million disability-adjusted life years (DALYs) and causes 410 000 deaths annually (Havelaar et al., 2015) but malnutrition accounts for 85 million DALYs and is the direct cause of 300 000 deaths (IMHE, 2012). If consumption of fresh animal source food (ASF) and produce were tripled, without accompanying action to improve safety, then the burden of FBD would be likely to double or triple too, substantially offsetting the health benefits from improved nutrition. In developing countries, there are around 50-200 million people in pastoralist families and 2 billion in smallholder mixed farms. Food safety scares and the government disease control responses to them (such as occurred during the avian influenza outbreak, the Rift Valley fever outbreak and melamine contamination incidents) have adversely affected the livelihoods of tens of millions of small farmers and pastoralists and hence their ability to consume home-grown food and to buy nutritious food (food scares section).
In developed countries FBD account for around half a million DALYs and 7 000 deaths a year whereas the health burden attributed to overweight/obesity is 36 million DALYs (WHO, 2009). Here, a nutritional goal might be to double the amount of fresh produce and slightly reduce ASF. Even if FBD doubled this would still be negligible in comparison to the benefits of reduction in diseases associated with overweight/obesity (assuming the behaviour was effective). Likewise, only a small proportion of the population is involved in farming and malnutrition is rare, so food safety scares would have a minor effect on health through the income pathway.
This chapter reviews the critical role food safety plays in ensuring a healthy food environment and provides recommendations on how food safety can contribute to it, using examples from developed and developing countries and the three “food safety to health pathways”. It uses the International Network for Food and Obesity/non-communicable diseases Research, Monitoring and Action Support (INFORMAS) framework (Swinburn et al., 2013, see Figure 6).
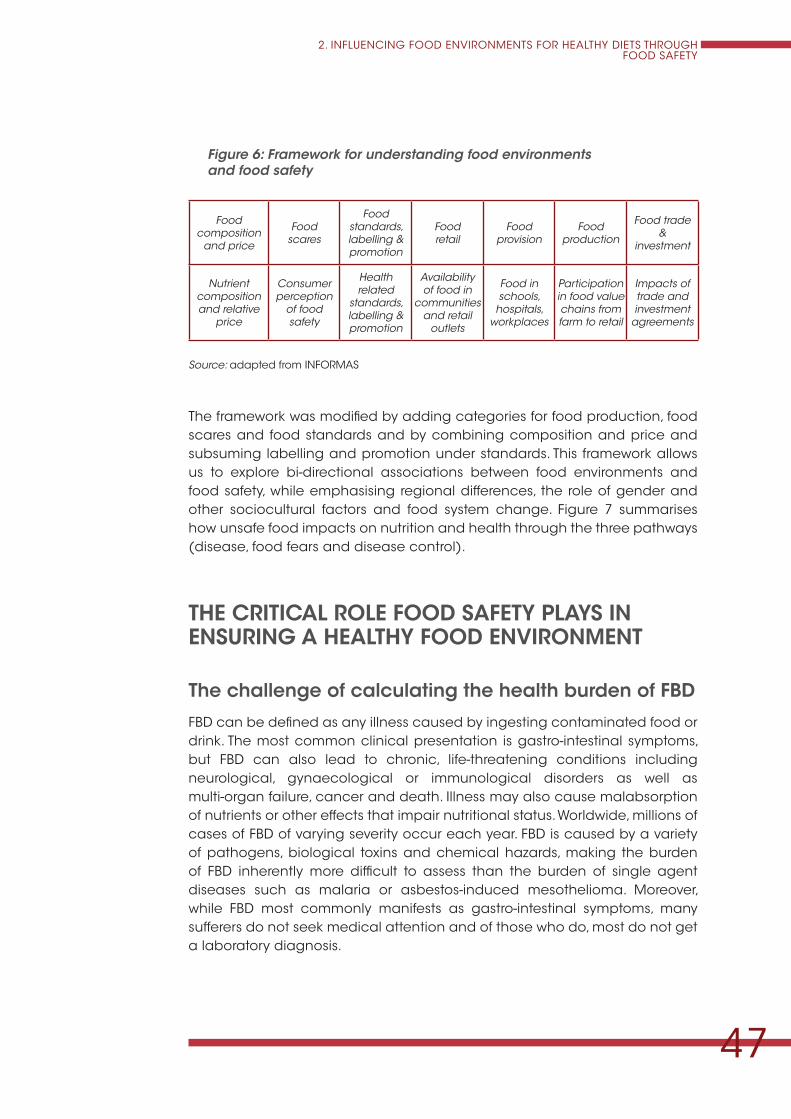
2. INFLUENCING FOOD ENVIRONMENTS FOR HEALTHY DIETS THROUGH FOOD SAFETY
47
Figure 6: Framework for understanding food environments and food safety
Food composition
and price
Food scares
Food standards, labelling & promotion
Food retail
Food provision
Food production
Food trade &
investment
Nutrient composition and relative
price
Consumer perception
of food safety
Health related
standards, labelling & promotion
Availability of food in
communities and retail
outlets
Food in schools,
hospitals, workplaces
Participation in food value chains from farm to retail
Impacts of trade and investment
agreements
Source: adapted from INFORMAS
The framework was modified by adding categories for food production, food scares and food standards and by combining composition and price and subsuming labelling and promotion under standards. This framework allows us to explore bi-directional associations between food environments and food safety, while emphasising regional differences, the role of gender and other sociocultural factors and food system change. Figure 7 summarises how unsafe food impacts on nutrition and health through the three pathways (disease, food fears and disease control).
THE CRITICAL ROLE FOOD SAFETY PLAYS IN ENSURING A HEALTHY FOOD ENVIRONMENT
The challenge of calculating the health burden of FBD
FBD can be defined as any illness caused by ingesting contaminated food or drink. The most common clinical presentation is gastro-intestinal symptoms, but FBD can also lead to chronic, life-threatening conditions including neurological, gynaecological or immunological disorders as well as multi-organ failure, cancer and death. Illness may also cause malabsorption of nutrients or other effects that impair nutritional status. Worldwide, millions of cases of FBD of varying severity occur each year. FBD is caused by a variety of pathogens, biological toxins and chemical hazards, making the burden of FBD inherently more difficult to assess than the burden of single agent diseases such as malaria or asbestos-induced mesothelioma. Moreover, while FBD most commonly manifests as gastro-intestinal symptoms, many sufferers do not seek medical attention and of those who do, most do not get a laboratory diagnosis.
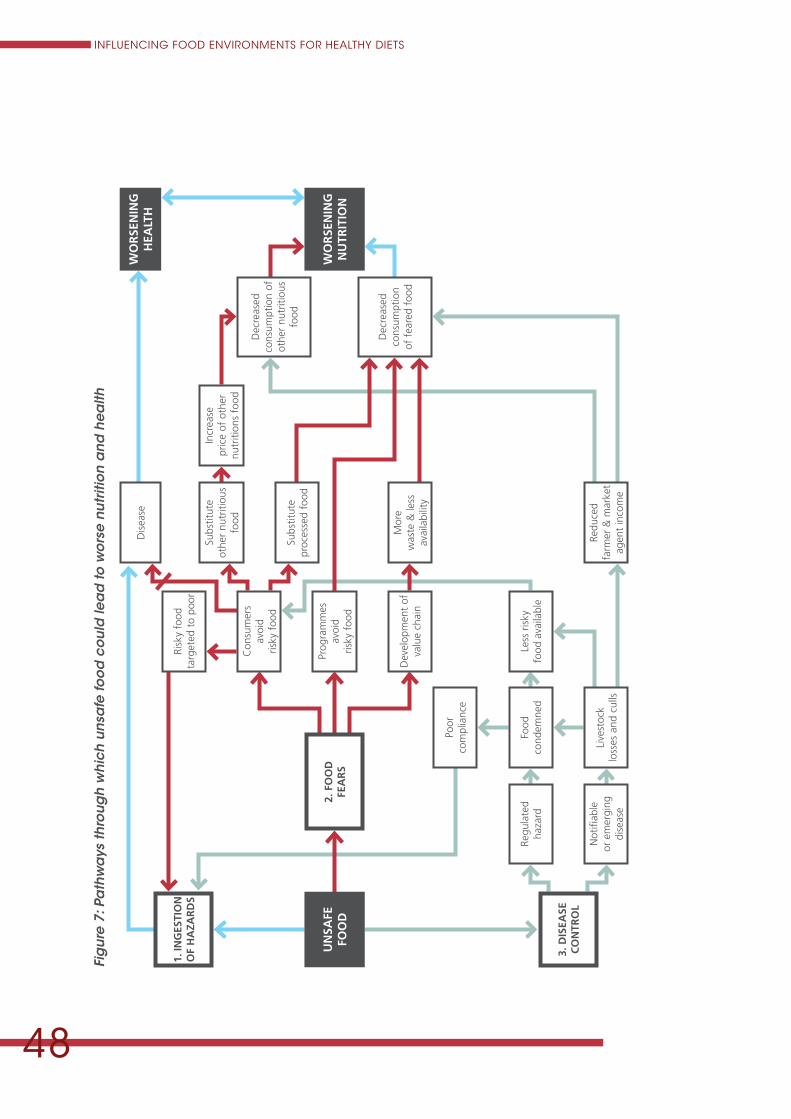
INFLUENCING FOOD ENVIRONMENTS FOR HEALTHY DIETS
48
Fig
ure
7: P
ath
wa
ys th
roug
h w
hich
uns
afe
foo
d c
oul
d le
ad
to w
ors
e nu
triti
on
and
hea
lth
Less
ris
ky
food
ava
ilabl
e
Dev
elop
men
t of
va
lue
chai
n
Prog
ram
mes
avoi
d ris
ky f
ood
Incr
ease
pr
ice
of o
ther
nu
triti
ons
food
Dec
reas
ed
cons
umpt
ion
of f
eare
d fo
od
Dec
reas
ed
cons
umpt
ion
of
othe
r nu
triti
ous
food
Dis
ease
1. IN
GES
TIO
N
OF
HA
ZAR
DS
WO
RSE
NIN
G
NU
TRIT
ION
WO
RSE
NIN
G
HEA
LTH
3. D
ISEA
SE
CO
NTR
OL
Subs
titut
e ot
her
nutr
itiou
s fo
od
Subs
titut
e pr
oces
sed
food
Mor
e w
aste
& le
ss
avai
labi
lity
Con
sum
ers
avoi
d ris
ky f
ood
Food
co
ndem
ned
Live
stoc
k lo
sses
and
cul
ls
2. F
OO
D
FEA
RS
Risk
y fo
od
targ
eted
to
poor
Not
ifiab
le
or e
mer
ging
di
seas
e
Regu
late
d ha
zard
Poor
co
mpl
ianc
e
UN
SAFE
FO
OD
Redu
ced
farm
er &
mar
ket
agen
t in
com
e
2. INFLUENCING FOOD ENVIRONMENTS FOR HEALTHY DIETS THROUGH FOOD SAFETY
49
Even when a diagnosis is obtained the source attribution may be unclear as many FBD can also be acquired through contact with animals and people or from water or contaminated objects.
Despite these assessment challenges there have been considerable advances in understanding the burden of FBD, with robust estimates from several developed countries in the last decade (United States, Canada, Netherlands, United Kingdom, Australia, Greece) (Scallen et al., 2011; Thomas et al., 2013; Mangen et al., 2014; Tam et al., 2012; Kirk et al., 2014; Gkoga et al., 2011). There are few studies on food-borne diarrhoea in developing countries, with most coming from South-East Asia and relying on the opinion of victims to determine if the disease is food-borne. The studies that exist find acute gastro-intestinal disease is common (around one in two people a year) and around one third of cases (12–55 percent) were attributed to food (Bureau of Epidemiology, 2004; Ho et al., 2010; Chen et al., 2013; Sang et al., 2014).
The first global and comprehensive estimate of the burden of FBD was undertaken by the Foodborne Disease Epidemiology Reference Group (FERG) initiative of the World Health Organization (WHO) and reported in December 2015 (Havelaar et al., 2015). This found that the burden of FBD had been currently greatly underestimated; that most of the burden is due to microbial pathogens and food-borne parasites (rather than chemical hazards); and that the greatest burden of FBD falls on developing countries, with the highest incidences in Africa. Because FERG estimates are based on nationally reported data and on attribution models that extrapolate from health records to estimate burden, the methods are not directly comparable to epidemiological studies. However, there is broad agreement between these and other assessments on the extent and composition of the burden (Grace, 2015). In summary, microbial pathogens are by far the most important in terms of the global health burden, macro-parasites are significant but less important, chemicals and toxins even less and allergens almost negligible (Box 1). However, there is greater uncertainty about the health burden of chemical hazards.
INFLUENCING FOOD ENVIRONMENTS FOR HEALTHY DIETS
50
Box 1: The causes of FBD and their relative importance
Microbial pathogens are responsible for the great majority (79 percent) of the FBD burden: 584 million cases of illness, around 450 000 deaths and 26 million DALYs each year. The most important pathogens were Salmonella spp., toxigenic Escherichia coli, Norovirus and Campylobacter in that order (Havelaar et al., 2015).
Food-borne macro-parasites were responsible for around 13 million cases, 45 000 deaths and 6 million DALYs each year. Most important were the tapeworms responsible for cysticercosis; fish associated fluke (common in South-East Asia); and roundworms which are sometimes food-borne and are widespread in poor countries (Havelaar et al., 2015).
Chemicals are responsible for 3 percent of the overall FBD (220 000 cases, 20 000 deaths and one million DALYs). These include aflatoxins, fungal toxins that contaminate mainly staple crops and dairy products in tropical and sub-tropical developing countries; they are also associated with stunting in children but the relationship has not been established as causal. The associated burden of aflatoxins is around 900 000 DALYs. Dioxins are responsible for around 240 000 DALYs and cassava cyanide 18 000 DALYs (Havelaar et al., 2015).
Around 11-26 million people in Europe suffer from food allergies (Mills et al., 2007). The most serious, but relatively rare, manifestation is anaphylaxis. In the United States it has been estimated that food allergy is responsible for 30 000 anaphylaxis episodes a year, leading to 3 000 hospitalisations and 100 deaths (Pawanker et al., 2013). Extrapolated globally, this would imply several thousand deaths.
These estimates are conservative and likely under-estimate the total incidence. For example, Havelaar et al. (2015) predict just one in ten Africans experience FBD each year. Yet countries such as the United States, Australia and Greece with well assessed FBD experience twice or quadruple this figure. Given that food is massively more contaminated in Africa it is not plausible that the incidence of FBD is substantially less than developed countries.
The agents of FBD are also influenced by diets, climate and agro-ecosystem. For example, in Japan people eat large amounts of fish and shellfish often raw and Vibrio parahaemalyticus (a bacterium living in brackish salt water) has been a major cause of illness (FAO and WHO, 2011) but disease caused by this bacterium is less important in inland countries where little fish is eaten.
2. INFLUENCING FOOD ENVIRONMENTS FOR HEALTHY DIETS THROUGH FOOD SAFETY
51
Vulnerability to FBD
Certain groups are more vulnerable to FBD, summarised by the acronym YOMPI: the Young, the Old, the Malnourished, the Pregnant and the Immunosuppressed (Grace, 2015). In the United Kingdom, for example, one in four people belong to YOMPI groups and are at higher risk from FBD (Lund and O’Brien, 2011). In developing countries there are important interactions between malnourishment and FBD. One multi-country study found 25 percent of the stunting burden was attributable to repeated episodes of diarrhoea (Checkley et al., 2008). Each additional episode in the first 24 months of life increases the risk of stunting by roughly 5 percent (Black et al., 2008). Other studies suggest diarrhoea is less important in contributing to stunting (Richard et al., 2013).
Gender and FBD
There has been little research on the intersection between gender and food safety but FBD can have important implications for women’s resilience and vulnerability.
Firstly, food safety has direct implications for women’s health. Pregnant and lactating women are especially vulnerable to a range of FBD, especially listeriosis and toxoplasmosis.
Secondly, culture affects the relative consumption of risky foods. Populations who do not eat pork will tend to have lower incidence of pork specific diseases such as cysticercosis or trichinellosis and those who drink raw milk, eat raw eggs or under-done meat, will be at greater risk of diseases associated with these foods.
There are many taboos around consumption of food, especially nutritious food; for example, meat is the main target of proscriptions for pregnant women (Fessler, 2002). These taboos tend to protect from some FBD but have the disadvantage of worsening women’s nutrition status. In some cultures there may be systematic differences in consumption between men and women, even in the absence of formal taboos. In Nigeria and Somalia women consumed more low value offal and men more high value muscle meat (FSNAU, 2010; Grace et al., 2012). Offal consumption has been found to be a risk factor for diarrhoea (Stafford et al., 2008; Grace et al., 2012). In Africa men have more access to meat because they are more likely to frequent bars that serve meat and alcohol (Roesel and Grace, 2014). Consumption in these places is associated with increased risk. A similar pattern is seen with fish-borne disease in China, Viet Nam and Korea. Men eat more often in restaurants than women and have a significantly higher rate of fish-borne fluke (Han et al., 2013).
INFLUENCING FOOD ENVIRONMENTS FOR HEALTHY DIETS
52
Thirdly, food safety has implications for women’s livelihoods. Women have an important (sometimes a dominant) role in many traditional food value chains but as chains modernise, partly driven by food safety concerns, women may be excluded (Grace et al., 2015).
Lastly, women are risk managers in the realms of food consumption, preparation, processing, selling and to a lesser extent production. Because of these links gender analysis is important when assessing and designing interventions to improve food environments by enhancing food safety.
Trends in FBD
As described earlier most FBD is caused by pathogens and in recent history there has been an overall dramatic decline in infectious diseases, while non-communicable diseases and especially diseases associated with being overweight and obesity, have trended upwards. From this perspective we might hope for a decline in FBD. However, the European Union and United States have seen no change or a deterioration in the number of cases of most (but not all) FBDs over the last five (European Union) or ten (United States) years (EFSA, 2012; CDC, 2014). At the same time global estimates suggest large declines in some diseases that are mainly transmitted by food (e.g. non-cholera salmonellosis and campylobacteriosis); while other food transmitted diseases show little change (e.g. cysticercosis, IMHE, 2012) Given on the one hand there is no obvious FBD decline in countries with good records and on the other there is an estimated global decline in some diseases mainly transmitted by food, it is difficult to draw over-arching conclusions about trends in FBD.
ASSOCIATIONS BETWEEN FOOD SAFETY AND HEALTHY FOOD ENVIRONMENTS
The INFORMAS framework of food environments
In this section, analysis is based on the International Network for Food and Obesity/non-communicable diseases Research, Monitoring and Action Support (INFORMAS) framework to explore associations between food environments and food safety (Swinburn et al., 2013).
2. INFLUENCING FOOD ENVIRONMENTS FOR HEALTHY DIETS THROUGH FOOD SAFETY
53
Food composition, price and safety
Food composition is a major determinant of price and also of safety. Most of the burden of FBD is associated with fresh animal source food (ASF) and vegetables and these are more expensive than staple foods. In developing countries, the higher price of more risky ASF and vegetables benefits health through reducing disease but is disadvantageous in reducing consumption of nutritious foods. In developed countries the misperception that higher priced food is safer has little effect on disease and a mixed effect on nutrition.
Disease pathway
In countries where good data exist most FBD results from consuming animal source foods (ASF, i.e. fresh meat, milk, eggs, fish) and to a lesser degree, fresh produce (fresh fruits and vegetables) (Grace, 2015). In developing countries, less fresh food (ASF and produce) is eaten but it is usually more contaminated so these foods are probably also important causes of illness. Avoiding ASF and produce would reduce the health burden associated with the disease pathway.
In emerging markets modern processed food may also be risky because food safety governance is less established (Grace and McDermott, 2015). A meta-review of studies of acute food poisoning sourced in China found food additives were responsible for 10 percent of incidents, 3 percent of illnesses and 12 percent of deaths (Xue and Zhang, 2013). In developed countries modern processed food is not commonly associated with FBD because processing often removes hazards and because adulteration and contamination of processed food is rare.
In developing countries many people eat traditionally processed foods (e.g. fermentation, smoking, long cooking). While this processing may potentially reduce FBD risk little is known about the degree of risk mitigation. One study in Ethiopia found that traditional fermentation reduced the risk of Staphylococcus aureus contamination 200-fold (Makita et al., 2012).
Also in developing countries there are often perceptions that cheaper food is at higher risk of FBD and there is some evidence that this is true. Domestic food is also likely to be safer than imported products. Avoiding these foods will reduce disease although less food may be purchased, reducing the nutritional benefits. In developed countries, even discount and cheap food is relatively safe, because of well-implemented public and private food safety standards.
INFLUENCING FOOD ENVIRONMENTS FOR HEALTHY DIETS
54
Nutrition pathway
National surveys in Europe and North America show that public concern over food safety is high and rising, yet not always rational. Consumers and policy-makers typically have a high concern over chemicals present in food whereas expert assessments find that the incidence of biological hazards is much higher (97 percent versus 3 percent in the FERG assessment). Local and organic food is often perceived to be safer, yet studies find no difference between organic and conventional products in terms of contamination with pathogenic bacteria at risk of exceeding maximum allowed limits (Smith-Spangler et al., 2012).
There are few nationally representative surveys of food safety concerns in developing countries. However, smaller studies show high levels of worry and that the priorities of developing country citizens are similar to those in the United States and Europe. A collection of studies from seven countries found food safety was always a concern for consumers and often the single most important concern about food (Jabbar et al., 2010). As in developed countries there was disproportionate concern over chemicals in food. This lack of alignment between what people worry about and what makes them sick or kills them is well documented. It can be explained by the psychology of risk perception which finds ordinary people are especially concerned by hazards perceived as un-natural, which they do not have control over and which they believe are present in food because this serves the interests of large companies (Slovic, 1987; Slovic, 2000).
Where food safety concerns motivate consumers to purchase higher priced foods we would expect them to buy smaller amounts. This would have nutritional benefits in the case of red and processed meat and full fat dairy and disadvantages in the case of fruit, vegetables, seafood, white meat and low fat dairy products.
Traditional food processing has effects on nutritional qualities. Fermentation reduces lactose which can be beneficial where large proportions of the population are lactose intolerant. On the other hand boiling vegetables for long periods degrades vitamin C.
2. INFLUENCING FOOD ENVIRONMENTS FOR HEALTHY DIETS THROUGH FOOD SAFETY
55
Food scares
Food scares have a minor effect on health through the disease pathway but a potentially important effect on health through nutrition pathways and, in developing countries, through disease control pathways. These two pathways also have indirect nutrition impacts via income. It seems plausible that reducing food scares could increase consumption of risky (but also nutritious) foods and that animal disease control that did not involve mass culling could improve nutrition. However, there is limited direct evidence for this.
Disease pathway
It is often not realised that outbreaks of FBD represent only a small proportion of the total cases of food-borne disease in a community. For example, the United States Centers for Disease Control (CDC) estimate 48 million cases of FBD occur annually in the United States but only around 30 000 cases per year were reported as outbreaks, less than a tenth of 1 percent of the total (www.cdc.gov/features/dsfoodborneoutbreaks/). Because most feared food diseases cause relatively few illnesses and deaths the effect of consumers avoiding feared foods generally has few health benefits.
Nutrition pathway
FBD outbreaks often receive huge media attention and cause large declines in purchase of a particular food, although this tends to return to pre-scare levels weeks or months later. Food avoidance may generalise: for example during a 2006 United States outbreak, consumers were advised to avoid bagged spinach, which led to them avoiding all spinach as well as other leafy greens (Arnade et al., 2009). Similar reactions are seen in developing countries. When the media in Viet Nam initially reported pig diseases the majority of consumers stopped eating pork, shifted to chicken or went to outlets perceived to be safer but more expensive (ILRI, 2010). Similarly, assessments during the Rift Valley fever outbreaks in Kenya found that consumers asked to see butchers’ certificates and demand for ruminant meat dropped as consumers switched to poultry (ILRI, 2007).
INFLUENCING FOOD ENVIRONMENTS FOR HEALTHY DIETS
56
When feared foods are perceived as unacceptable this reduces the overall amount of food available, with adverse effects on consumer nutrition. The extent of the impact depends on the quantity of food avoided and the duration of the behaviour change. The 2011 European E. coli outbreak was initially wrongly attributed to Spanish cucumbers and led to €200 million loss in production (Karch et al., 2012). Most food scares in emerging economies are associated with fresh foods and some argue that repeated scares over fresh food safety prompt switches to packaged and processed food (Grace and McDermott, 2015).
In countries where large numbers of people are involved in agrifood value chains, food safety scares may adversely impact livelihoods and nutrition. Smallholders and value chain actors can lose income when customers avoid unsafe food. Management of the Rift Valley fever outbreak in Kenya in 2006 included a trading ban that removed red meat from markets for several months. The complex impacts of disease and control included: a temporary reduction in available red meat; livestock traders and butchers experienced heavy loss and went out of business; a sharp temporary decline in the price of red meat and a corresponding increase in the price of white meat (Rich and Wanyoike, 2010).
Disease control pathway
During food scares in developed countries, most unsafe food is recalled and destroyed. The Spanish cucumber scare is said to have cost €51 million in produce withdrawal in addition to €200 million in lost production by developed countries. In developing countries there is less capacity to remove all unsafe food and there is some evidence that when food is impounded it can find its way back to consumers.
Most impacts of food scares in developing countries appear to be the result of control interventions aimed at the animal reservoir of disease which can result in large numbers of animals being destroyed. A 2006 avian influenza outbreak resulted in mass removal of chickens in Lower Egypt: Upper Egypt was not affected. Decreased dietary diversity, reduced poultry consumption, substitution of nutritious foods by sugary foods paralleled the reduction in household fowl rearing occurred in Lower Egypt but not Upper Egypt. Lower Egypt experienced a significant rise in childhood stunting (24 percent) while Upper Egypt experienced a decline in such stunting (25 percent) even though Upper Egypt had higher poverty than Lower Egypt (48 percent vs 11 percent respectively) (Kavle et al., 2015). Culling poultry adversely affected children’s nutrition.
2. INFLUENCING FOOD ENVIRONMENTS FOR HEALTHY DIETS THROUGH FOOD SAFETY
57
Food standards, labelling, promotion and food safety
Food standards have an important but not decisive influence in reducing FBD in developed countries, their impact is hard to judge. They do not have an important effect on nutrition but have potential benefits and risks in developed countries.
Disease pathway
While there are few legal restrictions on selling food which is not nutritious, in most countries it is nonetheless illegal to sell unsafe food. In developed countries there is great concern over food safety and market agents selling unsafe food are likely to be detected and suffer severe penalties. Unsurprisingly private standards are often more stringent than public. As a result, most food sold in markets is safe and there is a low risk of FBD, albeit of some concern.
In developing countries there is also much concern over food safety but very little capacity to identify unsafe food or impose market or legal penalties on those who sell it. The large, heterogeneous, mainly informal food sectors of developing countries with millions of un-organised, largely untrained and un-monitored participants makes it difficult to ensure food safety. As a result, most food sold in markets is unsafe and there is a high burden of FBD. There are several challenges to the use of standards as a tool to improve food safety in developing countries:
● Most risky food is sold in the informal sector but there is insufficient capacity to monitor and enforce standards among millions of small-scale retailers.
● When governance is poor and resources scarce there is pressure for compliance with regulation enforcement abused by officials as income generation.
● Most customers do not trust official standards and their intuition is generally correct.
● It is often politically unacceptable to have a standard for domestic food that is not very onerous but achievable.
● Most standards derive from a public health perspective which aims to reduce hazards but does not take into account other objectives such as increasing availability of nutritious foods.
INFLUENCING FOOD ENVIRONMENTS FOR HEALTHY DIETS
58
Nutrition pathway
In developed countries current food safety standards probably have little impact on consumption of food as all food is supposed to meet certain standards and most does. In developing countries enforcing standards generally means moving towards agro-industrial production and formal sector marketing. This can be both anti-poor and anti-nutrition as the formal sector usually offers a lower price to farmers and sells food at a higher price to consumers. In Kenya, for example, milk from the formal sector costs double that of milk from the informal sector and is available from fewer sources (Box 2). Theoretically the formal sector is better able to comply with standards, empirically but this is not always the case (next section).
Box 2: Informal markets: the dairy sector in Kenya
When 5 percent of milk fails to meet standards, there is a problem with the milk. When 50 percent does not meet standards, there is a problem with standards. In developing countries perishable food is mostly sold in informal markets and often does not meet national food safety standards. In Kenya, milk offers significant nutritional value to poor consumers at prices they can afford and the country’s per capita consumption of milk is among the highest in Africa: 86 percent of milk is sold through the informal sector. Government regulation in informal markets has not improved food safety in the past and formalisation does not guarantee safe food. New approaches, based on gradual improvements and an inclusive path to formalisation, show greater promise.
Available at http://pubs.iied.org/17316IIED
Disease control pathway
In developed countries food that does not meet certain standards is regularly removed from the food chain. However, a relatively small amount of harvested food is rejected. In Ontario, Canada 0.5 percent of carcasses were condemned (Atlon et al., 2010), similar to France, 0.7 percent (Dupuy et al., 2014), though less than in Switzerland, 1–2 percent (Vial and Reist, 2014). Although much food in developing countries has hazards at levels higher than acceptable standards, most countries do not systematically or comprehensively test for
2. INFLUENCING FOOD ENVIRONMENTS FOR HEALTHY DIETS THROUGH FOOD SAFETY
59
such hazards and are therefore not able to enforce regulations. A survey of African countries suggested that most small ruminant and a substantial minority of bovine meat was not inspected (Grace et al., 2015). However, for the small amount of meat that is inspected condemnation rates tend to be lower than developed countries, although disease incidences are higher. For example, in Ghana the condemnation rate for whole carcases was 0.06 percent (Atawalna et al., 2015), 0.2 percent in Iran and 0.6 percent in Zambia (Phiri, 2006).
Providing information and promoting food on the basis of safety is relatively uncommon and not likely to influence health either through the disease or nutrition pathway. There are economic challenges to labelling food as being safe.
Providing information on nutritional content has been one of the most widely used approaches to supporting a healthy food environment. However, it is rarely applied to food safety, (with the exception of precautionary allergen labelling, see Box 3) and as a result is not a salient part of the food safety environment. Consumers in developed and developing countries both report food safety as one of their greatest concerns (Grace, 2015) and many studies have found that consumers in developing countries express theoretical willingness to pay more for safer foods (Jabbar, Baker and Fadiga, 2010). A smaller number of experimental studies show that consumers will pay more for food identified as safer, at least in the short term (Roy et al., 2010).
However, while there are few legal restrictions on selling food which is not nutritious, in most countries it is illegal to sell unsafe food. This creates problems in labelling food as “more safe” and by implication other food as “less safe”. Economic explanations for the reluctance to use food safety as a marketing tool, are: consumers expect food to be safe and hence will not pay a premium; supermarkets maximise profits by not separating products according to safety; and, competing on food safety will undermine consumer confidence in all types of food sold, reducing the market for that food (Russo, Perito and DiFonzo, 2011).
The same issues apply to marketing food as safe, there being few examples of marketing on safety either from developed or developing countries. At the same time, food safety considerations have powerfully affected food purchasing and consumption. For example, the melamine scandal in China led to demand for “foreign” baby milk, as this was perceived to be safer.
INFLUENCING FOOD ENVIRONMENTS FOR HEALTHY DIETS
60
Box 3: Precautionary allergen labelling
(Allen et al., 2014)
Precautionary allergen labelling (PAL) is widespread in high-income countries and increasing in middle-income countries. The effectiveness of PAL is poorly described. In high-income countries PAL is common but much of the food so labelled does not actually contain allergens. Many food-allergic consumers ignore PAL and those who do not, spend more time identifying foods and pay more than non-allergic customers.
The current situation in many countries does not benefit either the allergic consumer or food manufacturers who are potentially liable for an allergic reaction resulting from cross-contamination. Countries that have introduced legislation based on allergen thresholds with regards to PAL (i.e. Japan and Switzerland) may have improved the usefulness of such labelling to the allergic consumer but further data are needed to substantiate this.
Food retail and food safety
In developed countries modern retail is overall associated with more processed food which may well create an unhealthy nutrition environment, but is generally safe. Some types of modern retail are also associated with higher availability of fresh foods. In developing countries, modern processed food may be less safe and the relative safety of food from modern retail and traditional outlets is not clear.
Disease pathway
In developed countries, most food is sold through full-line supermarkets, hypermarkets and supercentres, convenience stores and discounters: the so-called modern retail sector. Popular opinion holds that modern retail has led to a shift toward an unhealthy, unjust and polluted food system (Taillie and Jaacks, 2015). On the other hand it is also argued that intensive agroindustry is necessary to meet food demand. For example, FAO reports: “As it stands, there are no technically or economically viable alternatives to intensive production for providing the bulk of the livestock food supply for growing cities” (FAO, 2011). While modern retail in developing countries has largely succeeded in delivering safe food, the European Union and United States have seen little improvement in FBD in recent years (EFSA, 2012; CDC, 2014). Generally, food sold through modern retail outlets is safe and safer than alternatives such as farmers’ markets.
2. INFLUENCING FOOD ENVIRONMENTS FOR HEALTHY DIETS THROUGH FOOD SAFETY
61
In the case of restaurants, reliance on processed food and automation is associated with greater safety. CDC statistics show that from 1998 to 2014, eating in “sit-down” restaurants, led to 26 350 illnesses and eight deaths. By comparison, fast food restaurants, which sell many more meals, were the source of only 5 624 illnesses and three deaths (Box 4).
Box 4: Fresh, local and natural but not necessarily safe
The United States food chain Chipotle expanded its market by advertising its food as fresh, local, antibiotic- and GMO-free. However, as the company 2014 report recognised, this actually increased the risk of disease.
“We may be at a higher risk for food-borne illness outbreaks than some competitors due to our use of fresh produce and meats rather than frozen, and our reliance on employees cooking with traditional methods rather than automation.” A series of FBD outbreaks in 2015 resulted in major economic losses, the centralisation of some food processing and the installation of aggressive, high technology, food safety protocols.
Most food in developing countries is sold through the traditional or informal sector (Gomez and Ricketts, 2013). This is especially the case for fresh food where in most countries more than 90 percent is sold in informal markets, including farm gate purchase (Roesel and Grace, 2014). Given the rapid spread of modern retail in Europe and Latin America it was thought that this model would soon predominate in emerging markets and developing countries. This has not proven the case for a variety of demand and supply side factors and it is likely that traditional retail will continue to be important in developing countries, especially in Africa and south Asia for decades to come. There is also persistent opposition to supermarketisation and globalisation in some countries: India continues to present strong opposition from domestic retailers and political parties to the entry of foreign supermarkets, who believe it will cause major job losses in a sector that is mostly dominated by small, family run shops (Hawkes, Thow and Grace, 2015).
Nutrition pathway
In developing countries there is also a common perception that food sold through modern retail outlets is safer than traditional, domestic food. These perceptions are not borne out by the evidence (Roesel and Grace, 2014) and by making consumers pay more for equally safe food they decrease nutrition benefits without disease reduction benefits.
INFLUENCING FOOD ENVIRONMENTS FOR HEALTHY DIETS
62
Food production and food safety
Assuring the safety of food grown and consumed by farm households is challenging and there are trade-offs between encouraging healthy food environments through greater home production of fresh vegetables and ASF and assuring food safety.
Worldwide there are around 500 million family farms out of a total of 570 million (FAO, 2014). Especially in developing countries family farms typically consume some of their products and market others while also buying food from local markets. Generally, there is no food safety regulation for home produced and consumed food. The very short food chain, low use of agricultural chemicals by subsistence farmers and the absence of bulking steps that allow cross-contamination would tend to reduce the risk of FBD in home produced food. However, home produced food can be risky. In some communities, animals which are sick or have just died may be consumed. A survey found that 63 percent of farmers in Tanzania reported that when they found birds sick with Newcastle disease they killed and ate them (Wyatt and Grace, 2013).
Even in the absence of standards some farmers seem to prefer to consume better quality food and market poorer quality produce (Hoffman and Gatobu, 2014). In other cases market integration may lead to consumption of the worst quality food. Milk rejected from co-operatives was taken home and consumed by the household (Roesel and Grace, 2014). Similarly, some farmers who receive training and participate in export markets extend good practices to their own production, Kenya horticulture, in others they do not: groundnut growers in Malawi and fishers in Chile (Unnevehr and Rohnchi, 2014).
People participating in food value chains may have improved access to the food handled in that chain: for example, workers in Egyptian fish farms received fish as part of their wages (El Tholth et al., 2015). However, value chain agents may also have more access to un-marketable and unsafe food. Butchers in Nigeria who consumed meat that was not sold during the day reported high levels of diarrhoea in the following two weeks (Grace et al., 2012).
2. INFLUENCING FOOD ENVIRONMENTS FOR HEALTHY DIETS THROUGH FOOD SAFETY
63
Food provision and food safety
Attaining food safety and a healthy food environment through optimal food provisioning has trade-offs and ASF is potentially a significant barrier to optimising food provision.
Food provision is a potentially powerful way of creating a healthy food environment. School meals, subsidised or free government food provision programmes for the less well off and the charitable supply of food through foodbanks are examples of food provision strategies. Food provision is also vulnerable to trade-offs between food safety and nutritional quality. According to United Kingdom guidelines tinned and packaged foods are considered “low risk”, but if fresh or cooked ASF and vegetables are provided then more onerous registration and full compliance with food hygiene laws is required. This will naturally discourage provision of fresh food in favour of processed food.
Food-based approaches to improving undernutrition in developing countries have several advantages. From the point of view of health, animals share many pathogens with people and animal foods are more likely to contain hazards or contaminants that result in FBD. Also, ASFs are highly perishable and hence more difficult to preserve and distribute. As a result they require processing and it is necessary to link the ASF landscape to the food system in order to ensure that flows of key nutrients are not lost through processing. Moreover, concerns about food safety may reduce local sourcing of food for development programmes, entail additional costs to ensure local food meets standards or restrict sourcing from smallholder farmers who find it more difficult to meet standards (Meux, Pandora and Schneider, 2013).
Food trade and food safety
The relationship between attaining food safety and a healthy food environment through trade is complex. In developing countries traded foods are generally safer than traditional foods but may be more processed and less nutritious.
The implications of trade liberalisation on food safety are both positive and negative. Increased food trade may introduce new safety hazards, reintroduce previously controlled risks and spread contaminated food widely (Perry, Grace and Sones, 2010). The increased complexity of the food supply makes the source of food safety risks more difficult to trace (Ercsey-Ravasz et al., 2012). Yet for low-income countries, most imported food can be reliably considered of higher sanitary quality than food in the domestic markets (Hawkes, Thow and Grace, 2015).
INFLUENCING FOOD ENVIRONMENTS FOR HEALTHY DIETS
64
Disease control pathway
The Sanitary and Phytosanitary Agreement (SPS) of the World Trade Organization sets out the rules that members must follow when they set food safety measures that may affect international trade. This can be an opportunity for developing countries to upgrade national food safety programmes with assistance from international and bilateral agencies. On the other hand SPS measures lead to a greater reduction in developing country exports relative to those in developed countries (Unnevehr and Rohnchi, 2014) and within developing countries, a greater reduction in smallholder participation relative to larger farmers. In the 2000s both Kenya and Uganda saw major declines (60 percent and 40 percent respectively) in small farmers participating in exports of fruit and vegetables to Europe under Global GAP (Graffham, Karehu and MacGregor, 2007). At the same time, there is concern in developed countries this may result in insufficiently stringent regulations especially in areas with a high degree of uncertainty or disagreement (Silverglade, 2000).
RECOMMENDATIONS ON HOW FOOD SAFETY CAN CREATE A HEALTHY FOOD ENVIRONMENT
Food safety can contribute to a healthy food environment through direct and indirect pathways.
Reducing the disease pathway
Although FBD is higher than may be desired in developed countries and is a clear cause of individual suffering, it is not a major public health problem. Given high levels of consumer concern the agrifood sector has strong incentives for improving food safety and continuously does so. But FBD is a major public health concern in developing countries. There are few successful large-scale examples of improving food safety in developing countries but some evidence-based recommendations can be given: adopt a farm to fork approach; encourage use of appropriate technology; professionalise the informal sector; and improve food safety governance.
2. INFLUENCING FOOD ENVIRONMENTS FOR HEALTHY DIETS THROUGH FOOD SAFETY
65
A farm to fork approach is best for identifying control points An important principle of food safety management is that risks must be managed along the farm to fork (or boat to throat) pathway and that some risks are most effectively managed on farm. Brucellosis, tuberculosis, echinococcosis and cysticercosis are important FBD in many developing countries but are well controlled in most developed countries as a result of eradication campaigns targeted at the animal reservoir. The United Kingdom reversed an epidemic of Salmonella through legislation, food safety advice and an industry-led vaccination programme in broiler-breeder and laying poultry flocks (O’Brien, 2013). In Iceland, measures at production, retail level and in the household resulted in Campylobacter declines of more than 70 percent in broiler flocks and in human infections (Stern et al., 2003). Denmark reduced Salmonella by up to 95 percent in eggs, poultry and pork by monitoring herds and flocks, eliminating infected animals and differential processing depending on Salmonella status. This resulted in savings of US$25.5 million (Wegener et al., 2003). In all three of these success stories, control was along the value chain with an emphasis on reducing disease in the animal reservoir rather than the retail product.
Where the informal sector predominates, professionalise do not penalise The farm to fork control approaches detailed above are mainly applicable to industrialised countries with modern intensive farming systems and good enforcement capacity. Developing countries, where most of the high-risk foods are sold through the informal sector, need different approaches. Some of the most successful have combined capacity building of the informal sector with incentives to further motivate behaviour change. For example, until the late 1990s street food sold in South Africa was perceived as unsafe and most decision-makers believed it should be outlawed. Through a combination of evidence, policy advocacy and programmes to improve hygiene, opinion shifted. Health authorities no longer viewed street food as a nuisance, instead they promoted and improved it as a way to support livelihoods and nutrition (von Holy and Makhoane, 2006). In Kenya and the Indian state of Assam initiatives to train milk traders and provide an enabling policy environment were effective, economically attractive, scalable and sustainable. Currently, an estimated 6.5 million consumers are benefiting from safer milk sold by trained and certified traders in the two countries (Kaitibie et al., 2010; Lapar et al., 2014). In Kenya the main incentive was obtaining a certificate which reduced the costs associated with illegality while in Assam the major incentive was an improved public image and greater engagement with public service providers. It is also important that the public sector does not see food safety compliance as an income-raising opportunity.
INFLUENCING FOOD ENVIRONMENTS FOR HEALTHY DIETS
66
Encourage uptake of appropriate technology Where value chain actors are not using food safety technologies simple innovations such as food grade containers or chlorinated water can result in substantial improvements to food safety and quality. Other technologies are effective and affordable but are not commonly used: for example, adding lactoperoxidase to preserve milk; using chlorine washes to reduce bacteria on carcasses; and, using mycotoxin binders to reduce aflatoxins in animal feeds (Grace, 2015). In several of these cases technologies are not used in Europe or other developed countries because of secondary considerations which may be relevant to rich countries but are less so to poor countries.
Improve food safety governance The general consensus that most developing country governments are not able to ensure the safety of most food consumed in domestic markets has led to initiatives for re-structuring food safety governance. A single unified structure or an integrated system is likely to be more effective but when it is not possible because of historical or political reasons a national food control strategy can identify roles (FAO and WHO, 2005). More rational food safety governance systems are important but experience has shown that even when policies and regulations are good they rarely translate into implementation. In contrast, developed countries are generally better at ensuring food safety but there are concerns that food safety can be a barrier to other societal objectives such as creating healthy food environments. One size does not fit all where richer countries may focus on more punitive approaches aimed at the “well informed and ill intentioned” (e.g. while lower- and middle-income countries should focus on the “ill informed and well intentioned”). International governance of the safety of traded food is recognised as having many benefits but there is also need to improve the participation of developing countries in formulating trade policies.
2. INFLUENCING FOOD ENVIRONMENTS FOR HEALTHY DIETS THROUGH FOOD SAFETY
67
Improving the nutrition pathway
Although food safety is recognised as an integral part of food and nutrition security there is often little integration or even communication between the disciplines. There are few successful examples of improving the synergies between food safety and nutrition but some recommendations are possible.
Risk-based approaches rather than hazard-based Studies from developing countries show that hazards are commonly found in these foods but the risk is not always high. For example, milk in Kenya is often contaminated with bacteria but because more than 99 percent of milk is boiled the risk to consumers is not necessarily high (Grace et al., 2008). Focusing on risks to human health rather than the presence of hazards allows better resource allocation. Similarly people are very poor judges of risk and focusing on problems that have become major health issues rather than those which are more feared but actually pose less risk, will be more efficient (e.g. microbes are a higher priority than chemicals).
Holistic prioritisation When societies have multiple objectives they need to consider how attaining one desirable outcome affects attainment of others. Most developing countries aim to reduce childhood disease and stunting. To take the case of the Kenyan dairy sector, informal sector raw milk is around half the price of formal sector pasteurized milk and urban Kenyans spend around 22 percent of their household income on dairy products (Dominguez-Salas et al., 2014). Banning raw milk would have serious effects on household nutrition. Even where the risk of FBD from informal markets is substantial it is important to consider also the benefits of nutritious foods as well as the livelihoods of the hundreds of millions of women and men participating in informal value chains.
Disease control pathway
Costs of disease control Considerations of the costs and benefits of disease control should take into account their possible impacts on nutrition.
INFLUENCING FOOD ENVIRONMENTS FOR HEALTHY DIETS
68
CONCLUSIONS
There is reasonable evidence that most of the known burden of FBD comes from biological hazards; that most of the burden falls on developing countries; and most is the result of consumption of fresh, perishable foods sold in informal markets. The first global assessment of the problem estimates FBD caused 420 000 deaths and 33 million DALYs in 2010 (98 percent in developing countries), comparable to the effects of malaria, tuberculosis or HIV/AIDS.
Safe food is an essential component of a healthy food environment. However, nutritional and food safety objectives are not always well aligned. In particular, the most nutritious foods are the most risky and labelling and informational approaches are not well suited to ensuring food safety. On the other hand stated behaviour is much better aligned to revealed behaviour for food safety than for nutrition: even poor people will actively avoid food they believe to be unsafe and pay a premium when they believe it is safe. There are powerful, successful incentives for improved food safety in developed countries that developing countries have not yet harnessed effectively.
There are opportunities to improve food safety through technologies, value chain innovations and restructuring of food safety governance but the feasibility and effectiveness of these is not well understood. Efforts to improve food safety may have unanticipated ill effects including impaired nutrition. The widespread concern over food safety and growing evidence of the associated negative health implications and economic costs make it likely this area will receive greater attention in future.
2. INFLUENCING FOOD ENVIRONMENTS FOR HEALTHY DIETS THROUGH FOOD SAFETY
69
REFERENCES
Allen, K.J., Turner, P.J., Pawankar R. et al. 2014. Precautionary labelling of foods for allergen content: are we ready for a global framework? World Allergy Organization Jnl, 2014;7(1):10.
Alton, G.D., Pearl, D.L., Bateman, K.G., McNab, W.B. & Berke, O. 2010. Factors associated with whole carcass condemnation rates in provincially-inspected abattoirs in Ontario 2001-2007: implications for food animal syndromic surveillance. BMC Vet. Research, 6:42.
Arnade, C., Calvin, L. & Kuchler, F. 2009. Consumer response to a food safety shock: the 2006 food-borne illness outbreak of E. coli O157:H7 linked to spinach. Rev. of Ag. Econ., 31, (4), 734-750.
Atawalna, J., Gbordzi, M., Emikpe, B.O., Anyorigeyah, T., 2016, Whole carcass and organ condemnation and their associated financial losses in ruminants slaughtered at the Bolgatanga municipal abattoir of Ghana, Intl Jnl of Vet. Sc. 5 (1): 5-9.
Black, R.E., Allen, L.H., Bhutta, Z.A., Caulfield, L.E., de Onis, M., Ezzati, M. & Rivera, J. 2008. Maternal and child undernutrition: global and regional exposures and health consequences. Lancet, 371(9608), 243–60.
Bureau of Epidemiology. 2004. Situation of diarrhoeal diseases; Bureau of Epidemiology: Bangkok, Thailand.
Caspi, C.E., Sorensen, G., Subramanian, S.V. & Kawachi, I. 2012. The local food environment and diet: a systematic review. Health & place. 2012;18(5):1172-1187.
CDC. 2014. CDC Estimates of foodborne illness in the United States, Centers for Disease Control: Atlanta, USA.
Checkley, W., Buckley, G., Gilman, R.H., Assis, A.M., Guerrant, R.L., Morris, S.S., & Black, R.E. 2008. Multi-country analysis of the effects of diarrhoea on childhood stunting. Intnl Jnl of Epidemiology, 37(4), 816–830. doi:10.1093/ije/dyn099.
Chen, Y., Yan W.X., Zhou, Y.J., Zhen, SQ., Zhang, R.H. et al. 2013. Burden of self-reported acute gastrointestinal illness in China: a population-based survey. BMC Pub. Health, (13), 456.
Dominguez-Salas, P., Alarcon, P., Alonso, S., Colverson, K., Cornelsen, L., Ferguson, E., Fèvre, E.,Grace, D., Häsler, B. and Rushton, J. 2014. Leveraging food-based recommendations for women and children in Nairobi slums with animal source foods. Poster presented at the Emergency Nutrition Network Technical Meeting on Nutrition, Oxford, UK, 7-9 October 2014. Nairobi, ILRI.
INFLUENCING FOOD ENVIRONMENTS FOR HEALTHY DIETS
70
Dupuy, C., Demont, P., Ducrot, C., Calavas, D. & Gay, E. 2014. Factors associated with offal, partial and whole carcass condemnation in ten French cattle slaughterhouses. Meat Sci. June; 97(2):262-9.
EFSA. 2012. The European Union summary report on trends and sources of zoonoses, zoonotic agents and food-borne outbreaks in 2010, EFSA Jnl. 10(3):2597.
El Tholth, M., Fornace, K., Grace, D., Rushton, J. & Haesler, B. 2015. Characterisation of production, marketing and consumption patterns of farmed tilapia in the Nile Delta of Egypt. Food Pol., 51131-143.
Engler-Stringer, R., Le H, Gerrard A. & Muhajarine, N. 2014. The community and consumer food environment and children’s diet: a systematic review. BMC Pub. Health. May 29;14:522.
Ercsey-Ravasz, M., Toroczkai, Z., Lakner, Z. & Baranyi, J. 2012. Complexity of the international agro-food trade network and its impact on food safety. PLoS ONE 7(5): e37810.
FAO. 2011. Livestock in food security. FAO. Rome.
FAO. 2014. The state of food and agriculture 2014: Innovation in family farming. FAO. Rome.
FAO & WHO. 2005. Final report FAO/WHO Regional Conference on Food Safety for Africa, 3–6 October. FAO. Rome.
FAO & WHO. 2011. Risk assessment of Vibrio parahaemolyticus in seafood: interpretative summary and technical report. Microbiological Risk Assessment Series No. 16. FAO. Rome.
Fessler, D.M.T. 2002. Reproductive immunosuppression and diet: an evolutionary perspective on pregnancy sickness and meat consumption. Current Anthropology, 43(1), 19.
FSNAU, 2010. Offal consumption among the Somali population in Boroma, Burao and Bossaso towns. Food Security and Nutrition Analysis Unit, Somalia.
Gkogka, E., Reij, M.W., Havelaar, A.H., Zwietering, M.H. and Gorris, L.G.M. 2011. Risk-based estimate of effect of foodborne diseases on public health, Greece. Emerg. Infect. Dis., doi.org/10.3201/eid1709.101766.
Gómez, M.I. & Ricketts, K.D. 2013. Food value chain transformations in developing countries: selected hypotheses on nutritional implications. Food Pol., 2013, 42 139–150.
2. INFLUENCING FOOD ENVIRONMENTS FOR HEALTHY DIETS THROUGH FOOD SAFETY
71
Grace, D. 2015. Food safety in low and middle income countries. Intnl Jnl of Environ. Research and Pub. Health. 12(9), 10490–10507.
Grace, D. & McDermott, J. 2015. Food safety: reducing and managing scares. In 2014-2015 Global Food Policy Report. International Food Policy Research Institute: Washington, DC.
Grace D., Olowoye J., Dipeolu M., Odebode S. & Randolph T.F. 2012. The influence of gender and group membership on food safety: the case of meat sellers in Bodija market, Ibadan, Nigeria. Trop. Anim. Health Prod. 44 (Suppl 1):S53–9.
Grace, D., Omore, A., Randolph, T., Kang’ethe, E., Nasinyama, G.W. & Mohammed, T. 2008. Risk assessment for E. coli O157:H7 in marketed raw and fermented milk in selected African countries. Jnl of Food Protection, 27(2):257-263.
Grace, D., Roesel, K., Kang’ethe, E., Bonfoh, B., & Theis, S. 2015. Gender roles and food safety in 20 informal livestock and fish value chains. IFPRI Discussion Paper 1489. Washington, DC: International Food Policy Research Institute, available at http://ebrary.ifpri.org/cdm/ref/collection/p15738coll2/id/129860.
Graffham, A., Karehu, E., & MacGregor, J. 2007. Impact of EurepGAP on small-scale vegetable growers in Kenya. London.
Han, S., Zhang, X., Chen, R., Wen, J., Li, Y., Shu, J., Zhang, F. 2013. Trends in prevalence of clonorchiasis among patients in Heilongjiang Province, Northeast China 2009–2012: implications for monitoring and control. PLoS ONE, 8(11), e80173. doi:10.1371/journal.pone.0080173.
Havelaar, A.H., Kirk, M.D., Torgerson, P.R., Gibb, H.J., Hald, T., et al. 2015. World Health Organization global estimates and regional comparisons of the burden of foodborne disease in 2010. PLoS Med. 12(12): e1001923.
Hawkes C., Thow A.M. & Grace D. 2015. Trade liberalization, food, nutrition and health. In Richard Smith, Chantal Blouin, Zafar Mirza, Peter Beyer and Nick Drager (eds) Trade and health: towards building a national strategy. WHO, Geneva, Switzerland.
Ho, S.C., Chau, P.H., Fung, P.K., Sham, A., Nelson, E.A. & Sung, J. 2010. Acute gastroenteritis in Hong Kong: a population-based telephone survey. Epidemiol. Infect. 2010, 138(7), 982-991.
Hoffmann, V. and K. Gatobu. 2014. Growing their own: unobservable quality and the value of self-provisioning. Jnl of Dev. Ec. 106: 167-178.
INFLUENCING FOOD ENVIRONMENTS FOR HEALTHY DIETS
72
IMHE, 2-12, The Global Burden of Disease: Generating Evidence, Guiding Policy. Institute for Health Metrics and Evaluation: Seattle, Washington, USA.
International Livestock Research Institute. 2007. Learning the lessons of Rift Valley fever: improved detection and mitigation of outbreaks. Participatory assessment of Rift Valley fever surveillance and rapid response activities. Nairobi, available at https://cgspace.cgiar.org/handle/10568/32816.
International Livestock Research Institute. 2010. Demand for pork by Vietnamese consumers: implications for pro-poor livestock policy and development agenda in Vietnam. Project brief 1. Nairobi: ILRI, available at https://cgspace.cgiar.org/bitstream/handle/10568/2465/Demand_policy_brief.pdf?sequence=1.
Jabbar, M.A., Baker, D., Fadiga, M., & eds. 2010. Demand for livestock products in developing countries with a focus on quality and safety attributes: evidence from Asia and Africa. International Livestock Research Institute, Kenya.
Kaitibie, S., Omore, A., Rich, K., & Kristjanson, P. 2010. Kenyan dairy policy change: influence pathways and economic impacts. World Dev., 38(10), 1494–1505.
Karch, H., Denamur, E., Dobrindt, U., et al. 2012. The enemy within us: lessons from the 2011 European Escherichia coli O104:H4 outbreak. EMBO Molecular Med., 2012;4(9):841-848. doi:10.1002/emmm.201201662.
Kavle, J.A., El-Zanaty, F., Landry, M. & Galloway, R. 2015. The rise in stunting in relation to avian influenza and food consumption patterns in Lower Egypt in comparison to Upper Egypt: results from 2005 and 2008 demographic and health surveys. BMC Pub. Health, 2015;15:285.
Kirk, M., Ford, L., Glass, K. & Hall, G. 2014. Foodborne illness, Australia, circa 2000 and circa 2010. Emerg. Infect. Dis. 2014, 20(11), (1857–64).
Kirkpatrick, S.I., Reedy, J., Butler, E.N. et al. 2014. Dietary assessment in food environment research: a systematic review. Am. Jnl of Prev. Med., 46(1):94-102.
Lamb, K.E., Thornton, L.E., Cerin, E. & Ball K. 2015. Statistical approaches used to assess the equity of access to food outlets: a systematic review. AIMS Pub. Health, 2015, 2(3): 358-401.
Lapar, L., Deka, R., Lindahl, J., & Grace, D. 2014. Quality and safety improvements in informal milk markets and implications for food safety policy. In paper presented at 8th International Conference of the Asian Society of Agricultural Economists, Savar, Bangladesh, 14-17 February 2014.
Lund, B.M. & O’Brien, S.J. 2011. The occurrence and prevention of foodborne disease in vulnerable people. Foodborne Pathogens and Disease, 8(9), 961–973. doi:10.1089/fpd.2011.0860.
2. INFLUENCING FOOD ENVIRONMENTS FOR HEALTHY DIETS THROUGH FOOD SAFETY
73
Makita, K,, Dessisa, F., Teklu, A., Zewde, G. & Grace D. 2012, Risk assessment of staphylococcal poisoning due to consumption of informally-marketed milk and home-made yoghurt in Debre Zeit, Ethiopia. Intnl Jnl of Food Microbiology 53, 1–2, 135–141.
Mangen, M. J.J., Bouwknegt, M., Friesema, I.H.M., Haagsma, J.A., Kortbeek, L.M., Tariq, L. & Havelaar, A.H. 2014. Cost-of-illness and disease burden of food-related pathogens in the Netherlands, 2011. Intnl Jnl of Food Microbiology, 196, 84–93.
Méaux, S., Pantiora, E. & Schneider S. 2013. Aflatoxin management in the World Food Programme through P4P local procurement. In L. J. Unnevehr & D. Grace (eds). 2013. Aflatoxins: finding solutions for improved food safety. 2020 Vision Focus 20. Washington, DC.: International Food Policy Research Institute (IFPRI), available at http://dx.doi.org/10.2499/9780896296763.
Mills, E.N., Mackie, A.R., Burney, P., Beyer, K., Frewer, L., Madsen, C., Botjes, E., Crevel, R.W. & van Ree, R. 2007. The prevalence, cost and basis of food allergy across Europe. Allergy, 62:717-22.
O’Brien, S.J. 2013. The “decline and fall” of nontyphoidal salmonella in the United Kingdom. Clinical infectious diseases: an official publication of the Infectious Diseases Society of America, 56(5), 705–10. doi:10.1093/cid/cis967.
Pawankar, R., Canonica, G.W., Holgate, S.T., Lockey, R.F., Blaiss, M. 2013. The WAO White Book on Allergy. Update.
Perry, B.D., Grace, D. & Sones, K. 2013. Current drivers and future directions of global livestock disease dynamics. Proc. Natnl Acad. Sci. USA. December 24;110(52):20871-7. doi: 10.1073/pnas.1012953108. Epub 2011 May 16.
Phiri, A.M. 2006. Common conditions leading to cattle carcass and offal condemnations at 3 abattoirs in Western Province of Zambia and their zoonotic implications to consumers. Jnl South African Vet. Assoc., 77(1): 28–32.
Rich, K.M. & Wanyoike, F. 2010. An assessment of the regional and national socio-economic impacts of the 2007 Rift Valley fever outbreak in Kenya. Am. Jnl Trop. Med. Hyg. 83, 52–57.
Richard, S.A., Black, R.E., Gilman, R.H., Guerrant, R.L., Kang, G., Lanata, C.F., Mølbak, K., Rasmussen, Z.A., Sack, R.B., Valentiner-Branth, P. & Checkley, W. 2013. Diarrhea in early childhood: short-term association with weight and long-term association with length. Am. Jnl Epidemiol. October 1;178(7):1129-38.
Roesel, K., & Grace, D. 2014. Food safety and informal markets: animal products in sub-Saharan Africa. Routledge, available at https://cgspace.cgiar.org/handle/10568/42438.
INFLUENCING FOOD ENVIRONMENTS FOR HEALTHY DIETS
74
Roy, D., Birol, E., Deffner, K. & Karandikar, B. 2010. Developing country consumers’ demand for food safety and quality: Is Mumbai ready for certified and organic fruits? In J. W. Bennett & E. Birol (eds) Choice experiments in developing countries: implementation, challenges and policy implications. Edward-Elgar Publishing. Cheltenham, UK.
Roy, Rajshri et al. 2015. Food environment interventions to improve the dietary behavior of young adults in tertiary education settings: a systematic literature review. Jnl of Acad. of Nutr. and Dietetics, 115, 10, 1647-1681.e1.
Russo, C., Perito, M.A., & Di Fonzo, A. 2011. Our products are safe (don’t tell anyone!). Why don’t supermarkets advertise their private food safety standards? European Association of Agricultural Economists.
Sang, X.L., Liang, X.C., Chen, Y., Li, J.D., Li, J.G., Bai, L. & Sun, J.Y. 2014. Estimating the burden of acute gastrointestinal illness in the community in Gansu Province, northwest China, 2012-2013. BMC Pub. Health 2014, (14), 787.
Scallan, E., Hoekstra, R.M., Angulo, F.J., Tauxe, R.V., Widdowson, M.A. et al. 2011. Foodborne illness acquired in the United States – major pathogens. Emer. Infect. Dis. 17(1), 7–15.
Silverglade, B.A. 2000. The WTO agreement on sanitary and phytosanitary measures: weakening food safety regulations to facilitate trade? Food and Drug Law Jnl, 55:517–524.
Slovic, P. 1987. Perception of risk. Science, 236.
Slovic, P. 2000. The perception of risk. London, Earthscan.
Smith-Spangler, C., Brandeau, M.L., Hunter, G.E., Bavinger, J.C., Pearson, M., Eschbach, P.J., Sundaram, V., Liu, H., Schirmer, P., Stave, C., Olkin, I. & Bravata, D.M. 2012. Are organic foods safer or healthier than conventional alternatives? a systematic review. Ann. Intern. Med. September 4;157(5):348-66.
Stafford, R.J., Schluter, P.J., Wilson, A.J., Kirk, M.D., Hall, G., Unicomb, L. & OzFoodNet Working Group. 2008. Population-attributable risk estimates for risk factors associated with campylobacter infection, Australia. Emerging Infectious Disease, 14(6), 895–901.
Stern, N.J., Hiett, K.L., Alfredsson, G.A., Kristinsson, K.G., Reiersen, J., Hardardottir, H., Musgrove, M.T. 2003. Campylobacter spp. in Icelandic poultry operations and human disease. Epidemiology and Infection, 130(1), 23–3.
2. INFLUENCING FOOD ENVIRONMENTS FOR HEALTHY DIETS THROUGH FOOD SAFETY
75
Swinburn, B., Sacks, G., Vandevijvere, S., Kumanyika, S., Lobstein, T., Neal, B., Barquera, S., Friel, S., Hawkes, C., Kelly, B., L’Abbé, M., Lee, A., Ma, J., Macmullan, J., Mohan, S., Monteiro, C., Rayner, M., Sanders, D., Snowdon, W., Walker, C. and INFORMAS. 2013. INFORMAS (International Network for Food and Obesity/non-communicable diseases Research, Monitoring and Action Support): overview and key principles. Obesity Reviews, 14: 1.
Taillie, L.S. & Jaacks, L.M. 2015. Toward a just, nutritious, and sustainable food system: the false dichotomy of localism versus supercenterism. Jnl Nutr. July;145(7):1380-5.
Tam, C.C. et al. 2014. Costed extension to the Second Study of Infectious Intestinal Disease in the Community: identifying the proportion of foodborne disease in the UK and attributing foodborne disease by food commodity.
Thomas, M.K., Murray, R., Flockhart, L., Pintar, K., Pollari, F. et al. 2006. Estimates of the burden of foodborne illness in Canada for 30 specified pathogens and unspecified agents, circa. Foodborne Pathgen. Dis. 2013, 10(7), (639–48).
Unnevehr, L., & Ronchi, L. 2014. Food safety and developing markets: research findings and research gaps. Washington, DC: International Food Policy Research Institute.
Vandevijvere, S. & Swinburn, B., 2014. Towards global benchmarking of food environments and policies to reduce obesity and diet-related non-communicable diseases: design and methods for nation-wide surveys. BMJ Open. 15;4(5):e005339.
Vial F. & Reist, M. 2014. Evaluation of Swiss slaughterhouse data for integration in a syndromic surveillance system. BMC Vet. Research, 10:33.
Von Holy, A. & Makhoane, F.M. 2006. Improving street food vending in South Africa: achievements and lessons learned. Intnl Jnl of Food Microbiology, 111(2), 89–92.
Wegener, H. C., Hald, T., Wong, D. L. F., Madsen, M., Korsgaard, H., Bager, F. & Mølbak, K. 2003. Salmonella control programs in Denmark. Emerging Infectious Diseases, 9(7), 774–780.
WHO, 2009. Global health risks: mortality and burden of disease attributable to selected major risks. WHO, Geneva.
Wyatt, A., Grace, D., Alders, R., Bagnol, B., Young, M. & Msami, H. 2014. Newcastle disease control in Chamwino District, Tanzania: comparing different methods of vaccine delivery. Abstract of technical report. ILRI. Nairobi.
Xue, J. & Zhang, W. 2013. Understanding China’s food safety problem: an analysis of 2387 incidents of acute foodborne illness. Food Control, 30(1), 311–317.

INFLUENCING FOOD ENVIRONMENTS FOR
HEALTHY DIETS THROUGH FOOD LABELLING
Janice Lee Albert
CHAPTER 3:

3. INFLUENCING FOOD ENVIRONMENTS FOR HEALTHY DIETS THROUGH FOOD LABELLING
79
INTRODUCTION
At the 2014 Second International Conference on Nutrition (ICN2) there was a call to take actions that will change food environments to enable people to consume healthy diets. The Rome Declaration on Nutrition specifies a commitment to action that focuses on information and education in relation to food products:
We commit … to empower people and create an enabling environment for making informed choices about food products for healthy dietary practices and appropriate infant and young child feeding practices through improved health and nutrition information and education (FAO and WHO, 2014a).
The ICN2 Framework for Action highlighted food labelling as an area of action that could contribute to empowering people to choose nutritious food products. Leaders of governments, in cooperation with a range of stakeholders, were requested to consider two recommendations regarding labelling:
Recommendation 15: Explore regulatory and voluntary instruments – such as marketing, publicity and labelling policies, economic incentives or disincentives in accordance with Codex Alimentarius and World Trade Organization rules – to promote healthy diets.
Recommendation 19: Implement nutrition education and information interventions based on national dietary guidelines and coherent policies related to food and diets, through improved school curricula, nutrition education in the health, agriculture and social protection services, community interventions and point-of-sale information, including labelling (FAO and WHO, 2014b).
Aims and scope
A healthy food environment is one in which nutritious foods are available, affordable, acceptable and desirable to people and that makes people aware of the healthier options. Labels can contribute to a healthy food environment by: (1) providing information to the consumer about the content of foods; (2) drawing consumer attention to the benefits and risks of particular nutrients or ingredients of public health concern and; (3) motivating manufacturers to produce foods which have healthier nutrition profiles.
INFLUENCING FOOD ENVIRONMENTS FOR HEALTHY DIETS
80
The range of foods that carry a label is enormous, including minimally processed food products (e.g. milk) to processed (e.g. simple bread) and ultraprocessed food products (e.g. crisps/chips). There are many types of labels in the food environment, often competing for the consumer’s attention and space on the package (IOM, 2012). Food labels that are intended to assist consumers to select food products on the basis of their nutritional attributes are the focus of this chapter. These include: (1) nutrition fact declarations; (2) ingredient lists; (3) nutrient content claims and; (4) front of pack rating systems.
This chapter reviews the most recent evidence about the effectiveness of nutrition information on food labels to achieve the aims noted above. The limitations of current food labels are discussed as well. The chapter briefly explains evolving knowledge about the best ways to present nutrition information on packages and makes suggestions for actions by governments, international organizations, the food industry and the scientific community to improve food labels, as part of a comprehensive strategy to support individuals to consume healthy diets.
Definitions
For the purpose of this chapter a food label comprises the words, numbers, symbols and images found on or near the package. Food labels and labelling are defined by the Codex Alimentarius General Standard for the Labelling of Prepackaged Foods thus:
“Label” means any tag, brand, mark, pictorial or other descriptive matter, written, printed, stencilled, marked, embossed or impressed on, or attached to, a container of food.
“Labelling” includes any written, printed or graphic matter that is present on the label, accompanies the food, or is displayed near the food, including that for the purpose of promoting its sale or disposal (FAO and WHO, 2007).
It should be noted that advertising and promotions are closely related to labelling, often sending similar messages to consumers. They may affect how consumers interpret labels either reinforcing or detracting from the label message. Although relevant to labelling, advertising and promotions are beyond the scope of this chapter. In retail markets and food outlets there are opportunities to influence consumers to make healthier choices through displays at the point of purchase.
These point of purchase strategies can be effective, they are often governed by different policies, are usually temporary and therefore are not covered in this chapter. While advertising, promotions and displays are also not discussed, these types of communications can be very influential in the food environment.
3. INFLUENCING FOOD ENVIRONMENTS FOR HEALTHY DIETS THROUGH FOOD LABELLING
81
Roles of voluntary and mandatory labelling policies in providing information for healthier food choices
The ICN2 recommendation calls for regulatory and voluntary instruments to promote healthy diets. To create a healthy diet, consumers need to be able to choose combinations of specific foods that together comprise their diets. Labelling is an instrument that provides information to enable consumers to select specific foods. It is common for governments to implement both mandatory and voluntary label policies and both types of information appear on the same packages.
Voluntary labelling policies permit producers to use their discretion to disclose information or not in any format they prefer. Typically, a producer uses a claim on the label when it adds value to the brand and improves the reputation of the firm (Van Camp, de Souza Monteiro and Hooker, 2012). Consumers respond positively to the claims made on food labels and the anticipation of an increase in sales stimulates the producer to develop healthier products.
Voluntary nutrition labels are becoming widespread in every region (Popkin, Adair and Ng, 2012). For example, in Africa a recent study of food products in Botswana, Malawi, Mozambique, Namibia, Tanzania, Zambia, Zimbabwe, Egypt and Kenya found that nearly 70 percent of products carried nutrition information on labels (Kasapilaa and Shaarania, 2013).
Voluntary labels make consumers more aware of the benefits of a product; however, a limitation of voluntary labels is that they do not cover all foods, which prevents easy comparisons of products and they do not provide warnings to consumers about negative attributes of food products. Producers are reluctant to inform consumers about negative attributes and do not volunteer information that would discourage consumers from purchasing the product. Observers have found that under voluntary labelling conditions an insufficient number of products were labelled and/or producers did not adhere to labelling standards (Wang et al., 2011; Van Camp, de Souza Monteiro and Hooker, 2012; Kasapilaa and Shaarania, 2013).
Governments often turn to mandatory labelling policies to improve the quality of information in the market. Mandatory labelling typically covers a wider range of products than voluntary labelling and it requires producers to disclose both positive and negative information about the product. Mandatory labels may include warnings which assist consumers to avoid ingredients that may be risky. The requirement to place warnings on packages can stimulate producers to reformulate products to avoid negative perceptions. Mandatory labels usually have a standard format, which facilitates product comparison.
INFLUENCING FOOD ENVIRONMENTS FOR HEALTHY DIETS
82
The following sections discuss several types of labels which provide nutrition information on voluntary and mandatory bases: nutrition fact declaration, ingredient lists, nutrient claims and front of package labels. We describe each type of information and assess the evidence regarding the impact of each type of label. Through this analysis, it is evident that nutrition labels are evolving rapidly from provision of selected facts to general consumer guidance.
PROVIDING NUTRITITION INFORMATION TO CONSUMERS
Nutrition fact declarations
As of 2015, 66 governments have enacted mandatory nutrition labelling (World Cancer Research Fund, 2015). The Codex Alimentarius guidelines recommend mandatory nutrition labelling of energy value (calories), protein, available carbohydrate (i.e. dietary carbohydrate excluding dietary fibre), total fat, saturated fat, sodium and total sugars (CAC, 2013a). Information on protein and additional nutrients may be expressed as percentages of the nutrient reference values (NRV) where an NRV has been established. NRVs are a set of numerical values based on scientific data associated with nutrient requirements or with reducing the risk of diet-related non-communicable diseases (NCD). This information is usually presented in a panel on the back or side of the package in a standard format.
There have been extensive studies of consumers’ interest, understanding and use of nutrition fact declarations. The largest number of studies were in North America and Europe; however more research is emerging from Asia, Latin America and Africa (e.g. Ababio, Adi and Amoah, 2012; Norazmir, et al., 2012; Liu, Hoefkens and Verbeke, 2015). Although there are numerous studies, differences in study questions, methods and sampling make it difficult to make generalisations about consumer responses to labels worldwide.
Several authors have attempted to carry out systematic reviews and summary literature reviews (Cowburn and Stockley, 2005; Campos, Doxey and Hammond, 2011; Mandle et al., 2015). Similar findings across continents indicate that consumers are able to retrieve simple information from labels and they use the label to compare products. For example, consumers find information on sodium/salt, sugars and saturated fats which can help them avoid excessive consumption of these ingredients to prevent certain NCD (Saieh, et al., 2015). There is evidence that labels influence consumers to select foods that are lower in fat, cholesterol, trans-fatty acids, sodium and dietary fibre (e.g. Lin and Yen, 2008).
3. INFLUENCING FOOD ENVIRONMENTS FOR HEALTHY DIETS THROUGH FOOD LABELLING
83
In countries where nutrition fact declarations have been mandatory for some time there are high rates of consumer awareness of this information. For example, in the United States, which implemented the nutrition fact panel in 1994, an estimated 87 percent of people look at the labels sometimes and 56 percent actively seek nutrition information (Packaged Facts, 2015). In the European Union and Turkey, this type of label has not been mandatory until recently, yet 85 percent of the products surveyed contained back of pack nutrition information (Draper et al., 2011).
Limitations
Research shows there are serious limitations to the effectiveness of nutrition fact declarations. It is common for many study participants to report that they use labels, yet when researchers assess understanding of labels, the numbers of people who can accurately interpret information is much lower. Even educated people can find it difficult to do complex tasks and to understand how the data fit into their diets in spite of information on recommended daily intakes, nutrient reference values, etc.
Numerous researchers have observed that nutrition declarations are most often used by women, educated people and those with higher incomes, while other segments of the population are less likely to use them. A number of studies have focused on label use among low-income groups, people with low literacy and numeracy, ethnic and national minorities and found that these segments of the population are not being adequately served by the current labels (e.g. Signal et al., 2008). Some studies show variation in use of labels among different age groups yet there is not a consistent global pattern (Norazmir, et al., 2012). Nearly all studies have been conducted in urban settings, preventing comparisons between urban and rural consumers at this time. As obesity rates increase in rural areas there is a greater need to understand how rural people respond to labels.
Time has an effect on label use. For example, in China nutrition labels were introduced on a voluntary basis in 2008, followed by mandatory labelling in 2011. Researchers report that a large proportion of the population did not understand the information or use nutrition labels perhaps because they were not familiar with the new resource (Liu, Hoefkens and Verbeke, 2015). In the United States researchers found that interest in specific aspects of labels shifts over time and can decrease if there are no ongoing public awareness and education efforts, especially for young people (Todd and Variyam, 2008).
INFLUENCING FOOD ENVIRONMENTS FOR HEALTHY DIETS
84
Summary
To summarize, nutrition fact declarations provide relevant nutrition information about specific products to millions of consumers. In some regions consumers have come to expect this information on packages, helping them to compare products according to specific traits, to verify claims and presumably to select the products which are suitable for their needs. While many consumers “look at” and “read” nutrition fact declarations, far fewer consumers truly understand and use the information accurately.
To use the nutrition fact declarations accurately requires a degree of literacy and prior nutrition knowledge. Nutrition fact declarations have been criticised because they do not interpret the information and provide explicit guidance to consumers. Instead consumers who use labels often have prior knowledge and so can understand whether a particular nutrient in a certain quantity is beneficial or risky. The nutrition fact declarations do not provide a summary of the overall quality of the product in terms of nutrition. It is widely recognised that nutrient declarations alone are not sufficient to change dietary behaviours. Thus, nutrition fact declarations must be incorporated into broader public health nutrition strategies to be effective at the population level.
Ingredient lists
Ingredient lists are usually required on processed food packages and the Codex Alimentarius has long provided guidelines on this type of label (FAO, 2007). As a tool to contribute information in food environments, ingredient lists can help consumers to identify processed foods with significant amounts of ingredients that contribute to health (e.g. a beverage with a high proportion of fruit and soup comprised almost entirely of vegetables and legumes) as well as ingredients that should be reduced or avoided (e.g. trans-fatty acids in biscuits and cakes).
National dietary guidelines sometimes encourage consumers to check the ingredient lists for specific items. Some studies have included ingredient lists as a source of information but few have examined the potential to use these lists to improve diets, especially to verify the other information on the package and pick out important ingredients (Miller and Cassidy, 2015). One study in South Africa found that consumers used ingredient lists to identify allergenic substances, food additives and to assess the quality and purity of the product (Kempen et al., 2011).
3. INFLUENCING FOOD ENVIRONMENTS FOR HEALTHY DIETS THROUGH FOOD LABELLING
85
Limitations
Ingredient lists can be long and contain complex terms, requiring some nutrition knowledge to process the information. Of particular concern is the fact that numerous terms describe sodium, which is contained in a wide range of products (Martins et al., 2014). The multiple terms for sugars are another concern. Stimulated by the need to inform consumers about allergenic ingredients some investigators recommend that ingredient lists use terms that are simple, common words and that the lists be more visible and legible. Use of quantitative ingredient lists would add to the usefulness of this type of food label.
Evidence suggests there is a need to improve the language and presentation of the information to make it more accessible to the public. There is also a need to educate the public about the way ingredient lists are organized so they can make more informed comparisons of products.
Summary
Ingredient lists are a familiar way of conveying information accepted by the food industry and consumers. Through promotion of their use consumer awareness could be raised regarding the quality of processed foods. This could motivate manufacturers to reformulate their products to be able to make claims regarding the inclusion or omission of information on the ingredient list according to consumer demands. Typically, consumers use the lists to identify products that contain substances they wish or need to avoid. There is a need for research to better assess the degree to which consumers understand and use this type of label information. Improving the presentation of ingredient lists and educating the public to use this tool would contribute to information in the food environment.
INFLUENCING FOOD ENVIRONMENTS FOR HEALTHY DIETS
86
FOCUSING ATTENTION ON NUTRITIONAL BENEFITS THROUGH CLAIMS
Nutrient content and nutrient function claims
Nutrition claims usually appear on the front of packages, using specific nutritional properties to promote a product. Though nutrient content claims are voluntary, there are laws and standards that define criteria for the use of such labels. According to Codex Alimentarius standards, the only nutrition claims permitted relate to energy, protein, carbohydrate and fat and components, fibre, sodium and vitamins and minerals for NRVs established in the Codex Alimentarius Guidelines (CAC, 2013b). When making a nutrient claim the label should provide a nutrition fact panel in addition to information about the claim. Nutrient content claims are fairly common on products, for example, high in, source of, enriched/fortified with, low in, no added and free from. Nutrient function claims are also popular in many countries. For fortified foods, ensuring that labels are credible is an important aspect of consumer confidence in the products (Luthringer et al., 2015).
Claims on food products are common in affluent, middle- and low-income countries where food producers use this tool to boost the competitiveness of their products. The United States provides an example of the magnitude of the impact of this type of label. Researchers found that new food products introduced with health- and nutrition-related claims (e.g. low calorie, antioxidant, omega-3 fatty acids, gluten-free) accounted for 43.1 percent of all new food product introductions in the United States in 2010 (Martinez, 2013). In Africa, Kasapilaa and Shaarania (2013) provide examples of nutrient function claims: (1) vitamin A helps maintain good vision, normal growth and healthy immune system; (2) vitamin E helps maintain a healthy immune system; (3) iron is needed for blood formation and the proper functioning of the immune system; (4) calcium is essential for building strong bones and teeth; and (5) vitamin B9 (folic acid) is essential for the development of unborn babies.
Manufacturers use numerous claims to distinguish their products, extend product lines, respond to regulations and public health communications and enhance the image of their brand (Martinez, 2013). Assessments of the impact of these labels on purchases are confounded by the fact that claims are also used in media advertising. Advertising regulations may be less rigorous than label regulations and they affect purchase decisions before the consumer reaches the point of sale. In addition, marketers use many other means to promote products (e.g. store discounts) that are difficult to track. In spite of the complexities of analysing this type of label, the proliferation of labels and rapid growth in sales of products with such claims strongly suggests that industry claims are effective in motivating consumers who are interested in health (but not necessarily knowledgeable) to purchase their products.
3. INFLUENCING FOOD ENVIRONMENTS FOR HEALTHY DIETS THROUGH FOOD LABELLING
87
Evidence from research conducted by regulatory agencies and academic researchers does not indicate a clear impact of claims in terms of health. Studies from the 1990s suggested that claims could have a positive effect on consumption patterns in providing consumers with healthier choices (Martinez, 2013). More recent studies find a modest impact of claims on purchase decisions. A study in Australia and New Zealand found that products with claims had an insignificant impact on purchase intentions generally, although lower incomes, less nutrition knowledge and less formal education were associated with intention to purchase a product with a claim (Roy Morgan Research, 2008) and in the United States researchers found that women were influenced by nutrient content claims more often than men (Drewnowski et al., 2010).
Limitations
Some studies indicate that claims can mislead consumers to believe that a product is particularly healthy because the package has nutrient claims, although the overall nutritional quality of the product is lower than a consumer expects (Harris et al., 2011). Breakfast cereals are the focus of attention because claims are widely used on the large packages and these products are often marketed to children. They may contain good levels of vitamins and fibre but the sugar and sodium contents are excessive.
Summary
The ability to make claims that differentiate a product suggesting it is healthier than a competitor’s has been shown to motivate producers to develop products with better nutrient profiles. Experience shows that nutrient claims may be factual and draw consumers’ attention to products that are especially nutritious; however, claims can also mislead, causing consumers to purchase products that do not contribute to healthy diets.
Governments have authority to permit or prohibit voluntary nutrient and nutrient function claims on packages. A carefully designed policy regulating claims can have a positive impact on the food environment by encouraging the promotion of foods with healthy profiles that attract consumers. A combination of regulation and monitoring by stakeholders (e.g. consumer and industry associations) can help to ensure the credibility of claims on labels.
INFLUENCING FOOD ENVIRONMENTS FOR HEALTHY DIETS
88
Front of package rating systems
Front of package (FOP) labels have emerged in response to the quest for package information that summarises the nutritional quality of a product and is easier and faster for consumers to comprehend. FOP labels display information about calories and selected nutrients using symbols and rankings based on the nutritional quality of the product. Located on the part of the package that consumers readily see, the aim is to attract consumers’ attention even if the shopper is not seeking the information, while the signposting saves shoppers’ time if they are searching for the information (Van Kleefa and Dagevosb, 2015). The food industry, scientific associations and governments have developed various FOP rating systems that calculate a food product’s nutrient content and indicate a value to rate the overall contribution of the product to the person’s diet.
One of the oldest FOP systems that is widely known is the Nordic Keyhole, first developed by Sweden in 1989, adopted by Norway and Denmark in 2009 and Iceland in 2013 (Lagestrand Sjölin, 2013). This voluntary point of purchase symbol (a Green Keyhole) can be used to identify fresh foods and processed products that meet criteria set by the national authorities. The symbol is found on 1 500 unique products. A 2011 study found that in Sweden and Norway nearly all consumers (98 percent) knew about the keyhole, while 88 percent of Danish consumers and 29 percent of Icelanders knew the symbol (ibid.). In March 2015 a modified scheme went into effect with changes such as lower levels of salt, saturated fat and sugar and more whole grains (LaHart, 2015).
In June 2014 the governments of Australia and New Zealand announced a “Health Star rating system”, a front of pack labelling system that rates the overall nutritional profile of packaged food and assigns it a rating from half a star to 5 stars. The graphic is intended to facilitate comparisons of similar packaged foods in terms of saturated fat, sodium (salt), sugars and energy. The voluntary system was developed in collaboration with industry, public health and consumer groups (available at http://healthstarrating.gov.au). Early research on the system demonstrated that the rating system was consistent with Australian dietary guidelines. Interestingly, the study compared the Australia/New Zealand FOP with the Institute of Medicine (IOM) FOP system under discussion in the United States. This type of comparison of systems contributes to harmonisation of FOP at regional and international levels (Carrad et al., 2015).
In the United States there has been a dramatic increase in voluntary FOP labels since 2002 (IOM, 2012). In 2009 the US Food and Drug Administration established a Front of Package Initiative to address concerns that some FOP violated labelling regulations (available at www.fda.gov). The United States Congress requested a study to advise federal agencies in charge of food
3. INFLUENCING FOOD ENVIRONMENTS FOR HEALTHY DIETS THROUGH FOOD LABELLING
89
labelling about FOP. The experts convened by the IOM concluded that the nutrition fact panel is not sufficient to assist consumers in choosing healthy diets and recommended that a standardized, simple FOP which encourages healthy choices be developed (2012). The IOM established criteria for a FOP for the United States but did not recommend a particular format. An official FOP has not been announced.
In Europe labelling is more complex because 27 countries belong to the European Union and nearby countries trade with it. Each of these countries has different experiences with labelling yet they must adhere to general European Union legislation to sell products in the Union. In 2011 the EU implemented a new regulation covering many aspects of food labelling, including mandatory nutrition labelling (European Union, 2011). The legislation does not require a particular format for FOP. While there seems to be flexibility to develop FOP at the national level, there are some constraints as well. The legislation states:
The nutrition information provided should be simple and easily understood. To have the nutrition information partly in the principal field of vision, commonly known as the “front of pack”, and partly on another side on the pack, for instance the “back of pack”, might confuse consumers. Therefore, the nutrition declaration should be in the same field of vision. In addition, on a voluntary basis, the most important elements of the nutrition information may be repeated in the principal field of vision, in order to help consumers to easily see the essential nutrition information when purchasing foods. A free choice as to the information that could be repeated might confuse consumers. Therefore, it is necessary to clarify which information may be repeated (European Union, 2011).
In the United Kingdom where FOP are widely used on food products the Food Standards Agency and Department of Health, in collaboration with the British Retail Consortium, released guidelines for voluntary FOP, including detailed nutrition information and colour coding to help consumers to identify foods (green, amber and red) following a standardised format (UK Department of Health, 2013).
INFLUENCING FOOD ENVIRONMENTS FOR HEALTHY DIETS
90
Types of front of pack systems
Most FOP systems are implemented on a voluntary basis. Food industry associations or foundations and/or health associations led the development of some FOP, in collaboration with nutrition scientists. Governments sponsor other FOP systems, consulting with stakeholders. Three types of FOP label became prominent in the past decade: guideline daily amount (GDA), choices and the multiple traffic light (MTL). Researchers in Europe and North America have studied all three systems.
A large body of literature about FOP has emerged in the past decade but it is not feasible to summarise this research systematically in this paper. However, a few examples of studies are described below.
In a study focusing on the GDA in Germany, Sweden, France, Hungary, Poland and the United Kingdom researchers found that study participants were able to use this type of label to make product comparisons and they could understand the information on calories and key nutrients; however, the label did not provide motivation for shoppers (Grunert et al., 2010).
In the United States a study of white, middle- to high-income adults found that labels with multiple traffic lights and calorie information were more effective than simple traffic light or FOP labels in terms of ease of understanding and helping consumers to identify healthier products and evaluate the nutrition composition of foods (Roberto et al., 2012).
Emrich et al. (2014) compared several FOP formats and the nutrition fact declaration in Canada. They found that the group of mainly educated female study participants preferred the nutrition fact declaration to FOPs, perhaps reflecting the familiarity with this mandatory label and the lack of FOP consistency in the Canadian market. The participants recommended there should be one format for FOPs and among the formats studied, the traffic light was most effective.
Limitations
Although consumers may understand individual FOP labels in experimental settings and certain environments, research in several countries demonstrates that consumers have difficulties comparing products when the FOP systems have different colour schemes, text, symbols and measurements. The proliferation of FOP systems can confuse and overwhelm consumers and may demotivate them to follow label information. Standardized schemes that provide consistent information in the same format are recommended to promote healthy food choices (Draper et al., 2015).
3. INFLUENCING FOOD ENVIRONMENTS FOR HEALTHY DIETS THROUGH FOOD LABELLING
91
Most FOP schemes are voluntary. It is likely that this will benefit producers of healthier products and help consumers to choose products. However, it is unlikely that these systems will encourage consumers to avoid those with negative nutritional qualities because of the absence of guidance on all products.
Summary
There is general agreement on the need for labels that are simple to understand, requiring no prior knowledge of nutrition and easy for the consumer to find on the package; FOP can fulfil this need. There is evidence that colour FOPs attract a wider range of consumers than other labels, including those who are not seeking healthy products (Bix et al., 2015). Many experts believe that FOP should be interpretive, that is, provide guidance rather than merely giving facts, offer a scaled or ranked approach and use easy to remember names or identifiable symbols (Institute of Medicine, 2012).
Several governments have taken steps recently to standardise FOP, which should help to reduce confusion and facilitate comparisons. There is at present no recommended format in most countries although there is some evidence that consumers prefer traffic light FOP. Given that this type of label is not regulated as rigorously as nutrition fact declarations, there is a risk that FOP could mislead consumers if this becomes the main source of point of purchase information. There is a need for harmonisation of FOP formats among trading partners. At present, there is no Codex Alimentarius guidance on FOP nutrition rating systems.
As evidence emerges about the impact of FOP systems, including comparisons of the FOP options and the relationship between FOP and nutrition fact declarations, these data can guide policy decisions for labelling.
INFLUENCING FOOD ENVIRONMENTS FOR HEALTHY DIETS
92
MOTIVATING REFORMULATION AND PRODUCT DEVELOPMENT
The food industry produces hundreds of thousands of products with many ingredients being added and removed from the food supply in response to various drivers (e.g. Taparia and Koch, 2015). Three drivers can be consumer desire for healthier foods, public health recommendations and regulatory actions. The industry’s ability to innovate and reformulate products provides opportunities to improve the foods available for healthier diets.
In recent years large food companies have responded to public health concerns about sodium/salt and pledged to reduce its use in the United Kingdom and the United States (Kloss et al., 2015). In New Zealand and the Netherlands manufacturers have reformulated products in response to new logos on packages (Hawley et al., 2015). In the Netherlands, the Choices programme led to reformulation and new product development with a significant reduction in sodium, increases in dietary fibre, decreases in saturated fatty acids and added sugar. This led to lower caloric content in the reformulated dairy products, sandwich fillings and some snacks (Vyth et al., 2010).
Perhaps the clearest example of labelling regulations having an impact on the food environment is the case of trans-fatty acids. When regulations in the United States required labelling of trans-fatty acid contents in response to the evidence about heart disease and this particular type of manufactured fatty acid, the food industry quickly responded by removing trans-fatty acids from their products and claiming their products contained “no trans-fats” or were “trans-fat free” (Martinez, 2013). In Canada as well as the United States manufacturers removed trans-fatty acids from baked products in response to food labelling requirements (Martinez, 2013 and Hooker and Downs, 2014). The reformulation of products to reduce trans-fatty acids led to a 50 percent reduction in exposure to this harmful ingredient (Otite et al., 2013).
Limitations
An array of options exists for voluntary, co-regulatory and mandatory schemes that can lead to reformulation of products. However, long-term success depends upon commitment to achieve specific goals within a defined time frame and government willingness to intervene if the industry fails to make significant or timely progress (Reeve and Magnusson, 2015). Researchers found that efforts to reformulate were slow and varied among product categories (Otite et al., 2013).
3. INFLUENCING FOOD ENVIRONMENTS FOR HEALTHY DIETS THROUGH FOOD LABELLING
93
Reformulation to improve diets must avoid some mistakes and overcome some obstacles. When manufacturers remove an unhealthy ingredient from a product, it is critical that the ingredient which replaces it is a healthy one. This may seem obvious, yet experience with low fat products containing excessive amounts of sugar and trans-fatty acid-free products containing saturated fats suggests the need for better labelling of reformulated products that claim or carry logos implying the product is healthier than the conventional product. A second challenge is that reformulated products must meet consumer expectations in terms of taste and price if they are to choose repeat purchases and sustain the success of the product (Oostindjer, Amdam and Egelandsdal, 2015).
Summary
Food companies have volunteered to reformulate and develop new products to contribute to a healthier food supply in response to labelling policies, especially those relating to claims. They removed ingredients such as trans-fatty acids from the food supply quickly, without jeopardising the viability of their products. In the case of sodium and sugar, some advocate a more gradual reduction in these ingredients so that consumers become accustomed to a different taste. Nutrition education and dietary guidelines can incorporate information about reformulated products to raise consumers’ awareness of these options.
LABELLING WITHIN AN OVERALL STRATEGY TO EMPOWER CONSUMERS
The ICN2 Framework for Action Recommendation 19 includes food labelling within the context of nutrition education, national dietary guidelines and social services (FAO and WHO, 2014b). Together these interventions form a strategy to inform consumers on choosing a healthy diet. For those living in an environment with a variety of affordable nutritious foods, labels can be part of a strategy to empower consumers to choose foods that comprise a healthy diet. All too often, the food environment does not give sufficient access to nutritious, affordable foods which limits consumers’ power to choose those they need and desire. Where food budgets and food supplies are constrained, information to make the best use of food can be even more critical.
INFLUENCING FOOD ENVIRONMENTS FOR HEALTHY DIETS
94
Numerous researchers have observed that health consciousness and prior nutrition knowledge are associated with the ability to use label information properly (e.g. Miller and Cassidy, 2015). Without nutrition knowledge some consumers may not use them correctly or be misled by claims, which diminishes the intended impact on health and trust in all labels. Clearly, there is a need to improve labelling to reach those who are not yet motivated to select nutritious foods or lack the skills to use existing labels.
Over the past two decades many lessons regarding nutrition labelling have been learned and the emergence of FOP labels represents a desire to overcome the limitations of other nutrition label information. However, most FOP schemes are voluntary and do not cover a broad enough range of products to have a significant impact on food choices. The proliferation of FOP in some markets and the lack of standard formats hampers research to guide policy decisions regarding FOP. While FOP are likely to assist less educated consumers who have more difficulty with nutrition fact declarations, there is a risk that FOP could mislead consumers if not implemented with care. Standardised FOP mandatory labels would provide additional stimulus to the food industry to reformulate products and to remove products from the market that have particularly negative nutrition profiles.
Reformulation of products is another way to improve the food environment. Labelling policies have stimulated the food industry to reformulate or remove products from the market. However, reformulation of products may have a limited impact on consumers whose longstanding taste preferences lead them to consume foods high in sodium, sugar and fats. To influence taste preferences, a focus on children’s diets is needed as well as behaviour change techniques for adults who have become accustomed to unhealthy products.
A combined strategy of nutrition education, health promotion, behaviour change, improving supplies and affordability of nutritious foods, limitations on marketing of unhealthy foods to children and better labelling can contribute to empowering people to choose healthy diets (e.g. Vemula et al., 2013). While these actions are needed at local and national levels there is an international dimension to this challenge, discussed briefly below.
3. INFLUENCING FOOD ENVIRONMENTS FOR HEALTHY DIETS THROUGH FOOD LABELLING
95
INTERNATIONAL STANDARDS AND TRADE AGREEMENTS
Trade is often viewed as an opportunity to increase availability and access to a variety of foods, many of which can contribute to healthy diets. There are also experts who believe that trade can have negative impacts on diets (Popkin, Adair and Ng, 2012; Snowdon and Thow, 2013; PAHO, 2015). Undeniably, there is a strong desire for trade and economic growth in most countries, yet trade considerations should not thwart government efforts to improve food environments for healthier diets (Snowden and Thow, 2013; Rimpeekool et al., 2015). While the complex relationships between trade and nutrition are beyond the scope of this chapter, it is important to recognise that labelling can become the focus of discussion in this broader debate.
The ICN2 framework encourages governments to use labels to inform consumers and stimulate the availability of healthy products. The framework notes that this should be done “in accordance” with Codex Alimentarius and World Trade Organization (WTO) rules (FAO and WHO, 2014b). The Agreement on Technical Barriers to Trade (TBT) in the Uruguay Round of Multilateral Trade Negotiations in 19941 states that the Members desired:
…to ensure that technical regulations and standards, including packaging, marking and labelling requirements… do not create unnecessary obstacles to international trade… [The agreement recognised] that no country should be prevented from taking measures necessary to ensure the quality of its exports, or for the protection of human, animal or plant life or health, of the environment, or for the prevention of deceptive practices, at the levels it considers appropriate, subject to the requirement that they are not applied in a manner which would constitute a means of arbitrary or unjustifiable discrimination between countries where the same conditions prevail or a disguised restriction on international trade. (GATT, 1994)
The WTO uses Codex Alimentarius international standards and guidelines as benchmarks to guide and judge national regulations. Codex and the WTO provide for flexibility in setting different national standards, allowing countries to tailor regulations to specific needs and to set standards that are higher or lower than others. When a government considers mandatory labelling regulations not within Codex standards, the WTO requires it to follow notification procedures so that trading partners have the opportunity to comment on the labelling policy (WTO, 2014).
1 The World Trade Organization was established in 1995 as a result of the above-mentioned GATT agreement in 1994.
INFLUENCING FOOD ENVIRONMENTS FOR HEALTHY DIETS
96
Experience shows that it can take 3-10 years to approve Codex Alimentarius labelling standards. A number of national authorities need to take urgent actions to address problems such as obesity and diet-related NCD and cannot wait for Codex to develop new standards. They are taking action and their experiences will inform future Codex discussions. For example, Chile recently approved Decree 13 of 16 April 2015 requiring warning messages and a “stop sign” symbol on the front of food packaging containing excessive energy, sodium, sugar or saturated fats (FratiniVergano, 2015). When Chile notified the WTO of an earlier proposal for this law, a number of WTO members expressed concerns and Chile modified the proposed regulation (WTO, 2013). As Chile implements these regulations in 2016, new lessons about nutrition labelling and trade may be learned.
CONCLUSIONS AND SUGGESTIONS FOR ACTIONS
The prevalence of diet-related health problems leads policy-makers to search for tools to assist the public in choosing foods that lead to healthy diets. Worldwide, food labels are becoming a relatively popular tool because they reach the consumer at the point of purchase and focus on specific products; labelling can fulfill consumers’ right to information and allow them to apply their nutrition knowledge to the foods they choose. In terms of policy options, labels are less restrictive than food bans and less costly than taxes and subsidies. By necessity, developing and implementing labelling policies requires negotiation and collaboration among stakeholders; in building consensus, the strategies may be more sustainable.
The fact that millions of consumers in many countries use labels suggests this tool has the potential to have an impact at a universal level (Roberto and Khandpur, 2014). With additional efforts, the contribution of labels to improving information in the food environment is feasible. There is a growing consensus on the need for food labelling improvements. The following recommendations for actions are proposed.
3. INFLUENCING FOOD ENVIRONMENTS FOR HEALTHY DIETS THROUGH FOOD LABELLING
97
Actions for governments
In all countries there is a need to improve the design of labels to make them accessible and appealing to all types of people. Improving label legibility is a relatively quick way to improve the way consumers use nutrition information.
Special efforts are needed to reach groups with low literacy. Women are often the main household shoppers even though female literacy may be low in some societies. Labelling schemes must be understandable for illiterate people.
Among low-income groups, food choices and purchasing ability are very limited. Labelling should not lead to unjustified price increases or mislead consumers into thinking a labelled product is necessarily better than other products.
Labelling regulations and standards need to be enforced more rigorously to eliminate misleading information. Governments can encourage stakeholders and the public to report misleading labels.
Many countries have not adopted the current Codex Alimentarius guidelines on mandatory nutrition labelling in their domestic markets. It would be a step forward if governments take on board lessons learned from other countries in developing their policies.
There is a need for harmonisation of approaches, particularly regarding front of pack labels, to avoid consumer confusion and enable consumers to compare products. Mandatory FOP would enlarge the range of foods that are labelled and include warnings as well as encouraging messages.
Implementation needs a reasonable time period. Large companies with a range of products can respond to labelling policies strategically and labelling costs are relatively minor for them. Smaller firms that may produce a significant amount of food in a country can find it more difficult to comply with labelling policies (e.g. Intodia, 2011). Governments need to be attentive to the challenges small and medium enterprises face in complying with labelling policies and it may be necessary to make special provision for them.
INFLUENCING FOOD ENVIRONMENTS FOR HEALTHY DIETS
98
Actions for the food industry
Food industry associations could collaborate in developing labelling policies by sharing their knowledge of consumer behaviour as well as their scientific and technological research. They can provide realistic estimates of the impact of labelling on producers’ operating costs and profits.
Industry associations can provide advice and assistance to small and medium size enterprises to ensure compliance with labelling regulations. This could include assistance in understanding legal requirements, analysing food products, designing and making labels.
Within the food industry, companies have an interest in ensuring truthful and non-misleading labels to foster fair competition. The food industry can monitor labels to prevent false messages, to address this problem within their industry and through government authorities.
In markets and food outlets there are opportunities to influence consumers to make healthier choices. Beyond food package labels point of purchase displays have an impact (Bleich et al., 2014; Sonnenberg et al., 2013). The use of similar systems for food products and food outlets would reinforce the messages and contribute to improved information in the food environment.
Responsible use of nutrition information in advertising and refraining from marketing unhealthy products, particularly to children, will support other interventions to promote healthy diets.
Actions for international organizations
FAO and WHO may wish to obtain expert advice to examine the evidence regarding FOP labelling and make recommendations about best practices for developing FOP labels to assist national authorities. The Codex Committee on Food Labelling may consider work on harmonised approaches to front of pack systems.
To assist countries which have questions about labelling policies and trade restrictiveness, the WTO may wish to collaborate with FAO and WHO to provide best practice guidance on nutrition labels in relation to trade agreements.
Enforcing a labelling policy requires a competent food control system. Some countries will need assistance to strengthen their food control systems which could come from bilateral assistance, especially from trade partners and/or international capacity development.
3. INFLUENCING FOOD ENVIRONMENTS FOR HEALTHY DIETS THROUGH FOOD LABELLING
99
Actions for researchers
The research community has contributed greatly to our understanding of label use. Yet reviews often exclude articles not published in English. Inclusion of studies published in other languages would broaden the evidence base.
The quality of evidence would benefit from more longitudinal studies to document how consumer use of labels and reformulation of products changes over time. Research protocols could be recommended to compare study findings.
Implementing labelling policies requires an evidence base regarding public health and food supplies to set priorities. Researchers can contribute to creation of the evidence bases.
When special interest groups conduct research there is less confidence in the work, even when the quality is high. More independent objective research is needed to evaluate the effects of labelling policies.
There are few systematic reviews of labelling and therefore a need for a comprehensive and objective review of nutrition label research to guide policy decisions.
INFLUENCING FOOD ENVIRONMENTS FOR HEALTHY DIETS
100
REFERENCES
Ababio, P.F., Adi, D. & Amoah, M. 2012. Evaluating the awareness and importance of food labelling information among consumers in the Kumasi metropolis of Ghana. Food Control, 26, 571-574.
Bleich, S.N., Barry, C.L., Gary-Webb, T.L. & Herring B.J. 2014. Reducing sugar-sweetened beverage consumption by providing caloric information: how black adolescents alter their purchases and whether the effects persist. Am. Jnl of Pub. Health, 104: 2417–24.
Bix, L, Sundar, R.P., Bello, N.M., Peltier, C,. Weatherspoon, L.J. & Becker, M.W. 2015. To see or not to see: do front of pack nutrition labels affect attention to overall nutrition information? PLoS ONE,10(10): e0139732.
Campos, S. J. Doxey & Hammond, D. 2011. Nutrition labels on pre-packaged food: a systematic review. Pub. Health Nutrition, 14(8) 1496-1506.
Carrad, A.M., Yu Louie, J.C., Yeatman, H.R., Dunford, E.K., Neal, B. & Flood, V.M. 2015. A nutrient profiling assessment of packaged foods using two star-based front-of-pack labels. Pub. Health Nutrition, August.
Codex Alimentarius Commission. 2013a. Guidelines on Nutrition Labelling. (CAC/GL 2-1985).
Codex Alimentarius Commission. 2013b. Guidelines for the use of nutrition and health claims. (CAC/GL 23-1997).
Cowburn, G. & Stockley, L. 2005. Consumer understanding and use of nutrition labelling: a systematic review. Pub. Health Nutrition, 8, (1), 21-28.
Draper, A.K., Adamson, A.J., Clegg, S., Malam, S., Rigg M. & Duncan, S. 2011. Front-of-pack nutrition labelling: are multiple formats a problem for consumers. European Jnl of Pub. Health, 23, 3, 517-521.
Drewnowski, A., Moskowitz, H., Reisner, M. & Krieger. B. 2010. Testing consumer perception of nutrient content claims using conjoint analysis. Pub. Health Nutrition, 13(5), 688–694.
Emrich, T.E., Qi, Y., Mendoza, J.E., Lou, W., Cohen, J.E. & L’abbé, M.R. 2014. Consumer perceptions of the nutrition facts table and front-of-pack nutrition rating systems. Applied Physiology, Nutrition and Metabolism, 39: 417–24.
European Union. 2011. Regulation (EU) No 1169/2011 of the European Parliament and of the Council. Official Journal of the European Union, L 304, 54, 22 November, 18-41.
3. INFLUENCING FOOD ENVIRONMENTS FOR HEALTHY DIETS THROUGH FOOD LABELLING
101
FAO & WHO. 2007. Codex Alimentarius Food Labelling (Fifth edition), FAO. Rome.
FAO & WHO. 2014a. Conference Outcome Document: Rome Declaration on Nutrition, Second International Conference on Nutrition, FAO. Rome, 19-11 November.
FAO & WHO. 2014b. Conference Outcome Document: Framework for Action, Second International Conference on Nutrition, FAO. Rome, 19-11 November.
Feunekes, G.I., Gortemaker, I.A., Willems, A.A., Lion, R. & van den Kommer, M. 2008. Front-of-pack nutrition labelling: testing effectiveness of different nutrition labelling formats front-of-pack in four European countries. Appetite, 50:57-70.
FratiniVergano. 2015. Chile adopts warning statements in the form of a black STOP sign for “HFSS foods” (i.e. foods high in fat, salt or sugar). Trade Perspectives, 16, 11 September. FratiniVergano European lawyers.
General Agreement on Tariffs and Trade. 1994. Agreement on technical barriers to trade. Marrakesh Agreement establishing the World Trade Organization, Legal Texts: Results of the Uruguay Round of Multilateral Trade Negotiations, 15 April.
Grunert, K.G., Fernández-Celemín, L., Wills, J.M., Storcksdieck genannt Bonsmann, S. & Nureeva, L. 2010. Use and understanding of nutrition information on food labels in six European countries. Jnl of Pub. Health January. DOI 10.1007/s10389-009-0307-0.
Harris, J. L., Thompson, J.M., Schwartz M.B. & Brownell, K.D. 2011. Nutrition-related claims on children’s cereals: what do they mean to parents and do they influence willingness to buy? Pub. Health Nutrition: 14(12), 2207–2212 doi:10.1017/S1368980011001741.
Hawley, K.L., Roberto, C.A., Bragg, M.A., Liu, P.J., Schwartz M.B. & Brownell, K.D. 2012. The science on front-of-package food labels. Pub. Health Nutrition, March, 1- 10. doi:10.1017/S1368980012000754.
Hooker, N. & Downs, S. 2014. Trans-Border Reformulation: US and Canadian Experiences with trans fat. Intl Food and Agribusiness Man. Rev.17, Special Issue A:131-146.
Institute of Medicine. 2012. Front-of-package nutrition rating systems and symbols: promoting healthier choices. Washington DC, National Academies Press.
INFLUENCING FOOD ENVIRONMENTS FOR HEALTHY DIETS
102
Intodia, V. 2011. Mandatory nutrition labelling and implications for food companies in India. Asian Jnl of Food and Agro-Industry, 4(04), 255-260.
Kasapilaa, W. & Shaarania, S.M. 2013. A survey of nutrition labelling on packaged foodstuffs sold in Malawi: manufacturer practices and legislative issues. Food Control, 30:433-438.
Kempen, E., Bosman, M., Bouwer, C., Klein, R. & van der Merwe, D. 2011. An exploration of the influence of food labels on South African consumers’ purchasing behaviours. Intl Jnl of Consumer Studies, 35 (2011) 69–78.
Kloss, L., Meyer, J.D., Graeve, L. & Vetter, W. 2015. Sodium intake and its reduction by food reformulation in the European Union. NFS Jnl, 1 (2015) 9–19.
Lagestrand Sjölin, K. 2013. Nordic keyhole experience and challenges Sweden, Norway, Denmark, Iceland, healthy choices made easy. Presentation at the FAO & WHO information meeting on front of pack nutrition labelling. Charlottetown, 16 May.
LaHart, S. 2015. New rules make Nordic Keyhole food labelling scheme more strict. EU Food Law, 4 May, available at www.eurofoodlaw.com/labelling/new-rules-make-nordic-keyhole-food-labelling-scheme-more-strict-107011.htm.
Lin, B-H. & Yen, S.T. 2008. Consumer knowledge, food label use and grain consumption in the US, Applied Ec. 40, 437-448.
Liu, R., Hoefkens, C. & Verbeke, W. 2015. Chinese consumers’ understanding and use of a food nutrition label and their determinants. Food Quality and Preferences, 41:103-111.
Luthringer, C.L., Rowe, L.A., Vossenaar, M. Garretta, G.S. 2015. Regulatory monitoring of fortified foods: identifying barriers and good practices. Global Health: Science and Practice. 3, 3:446-461.
Mandle, J., Tugendhaft, A., Michalow, J. & Hofman, K. 2015. Nutrition labelling: a review of research on consumer and industry response in the global South. Global Health Action, Johannesburg.
Martinez, S.W. 2013. Introduction of new food products with voluntary health- and nutrition-related claims, 1989-2010, EIB-108, US Department of Agriculture, Economic Research Service, February, Washington, DC.
Martins, C.A., de Sousa, A.A., Veiros, M.B., González-Chica D.A. & Pacheco da Costa Proença, R. 2014. Sodium content and labelling of processed and ultra-processed food products marketed in Brazil. Pub. Health Nutrition: 1 of 9 doi: 10.1017/S136898001400173.
3. INFLUENCING FOOD ENVIRONMENTS FOR HEALTHY DIETS THROUGH FOOD LABELLING
103
Miller, L.M.S. & Cassady, D.L. 2015. The effects of nutrition knowledge on food label use: a review of the literature. Appetite, 92, 207-216.
Norazmir, M.N., Norazlanshah, H., Naqieyah, N. & Khairil Anuar, M.I. 2012. Understanding and use of food package nutrition label among educated young adults. Pakistan Jnl of Nutrition, 11 (10): 934-940.
Oostindjer M., Amdam, G.V., Egelandsdal, B. 2015. Getting Norway to eat healthier: what are the opportunities? Scandinavian Jnl of Pub. Health. February, 43: 66-75.
Otite F.O., Jacobson, M.F., Dahmubed, A. & Mozaffarian, D. 2013. Trends in trans fatty acids reformulations of US supermarket and brand-name foods from 2007 through 2011. Preventing Chronic Disease, 10:120198.
Packaged Facts. 2015. Health-conscious and ingredient-aware consumers want food nutritional labelling to be clean not just seen. Packaged Facts News Release, 21 May, Rockville, Maryland, Market Research Group, LLC.
PAHO. 2015. Ultra-processed food and drink products in Latin America: trends, impact on obesity, policy implications. Washington, DC.
Popkin, B.M., Adair, L.S. & Ng, S.W. 2012. NOW AND THEN: the global nutrition transition: the pandemic of obesity in developing countries. Nutrition Reviews, 70(1): 3–21.
Reeve, B. & Magnusson, R. 2015. Food reformulation and the (neo)-liberal state: new strategies for strengthening voluntary salt reduction programs in the UK and USA. Pub. Health, 129: 351-363.
Rimpeekool, W. S., Seubsman, S., Banwell, C., Kirk, M., Yiengprugsawan, V. & Sleigh, A. 2015. Food and nutrition labelling in Thailand: a long march from subsistence producers to international traders. Food Policy, 56: 59-66.
Roberto, C.A., Bragg, M.A., Seamans, M.J., Mechulan, R.L., Novak, N., Brownell, K.D. 2012. Evaluation of consumer understanding of different front-of-package nutrition labels, 2010–2011. Preventing Chron. Dis., 9:120015.
Roberto, C.A. & Khandpur, N. 2014. Improving the design of nutrition labels to promote healthier food choices and reasonable portion sizes. Intnl Jnl of Obesity, 38, 525-533.
Roy Morgan Research. 2008. An investigation into the impact of nutrition content claims on packaging in relation to consumer purchase intention, nutrition attitude and health benefits. Prepared for Food Standards Australia New Zealand, Brisbane.
INFLUENCING FOOD ENVIRONMENTS FOR HEALTHY DIETS
104
Saieh, C., Zehnder, C., Magdalena Castro, E. & Sanhueza, P. 2015. Etiquetado nutricional, ¿qué se sabe del contenido de sodio en los alimentos? Nutritional labelling, what is known about the sodium content in foods? Revista Médica Clínica Las Condes. 26 1: 113-118.
Signal, L., Lanumata, T., Robinson, J.A., Tavila, A., Wilton, J., Ni Mhurchu, C. 2008. Perceptions of New Zealand nutrition labels by Maori, Pacific and low-income shoppers. Pub. Health Nutrition, 11:706-13.
Snowdon, W. & Thow, A.M. 2013. Trade policy and obesity prevention: challenges and innovation in the Pacific Islands. Obesity Reviews, 14 (Suppl. 2), 150–158, November.
Sonnenberg, L., Gelsomin, E., Levy, D.E., Riis, J., Barraclough, S., Thorndike, A.N. 2013. A traffic light food labeling intervention increases consumer awareness of health and healthy choices at the point-of-purchase. Prev. Med., 57, 253–257.
Taparia, H. & Koch, P. 2015. A seismic shift in how people eat, The New York Times, 6 November.
Todd, J.E. & Variyam, J.N. 2008. The decline in consumer use of food nutrition labels, 1995-2006. Economic Research Report, 63. Economic Research Service, Washington, DC, US Department of Agriculture.
UK Department of Health. 2013. Guide to creating a front of pack (FoP) nutrition label for pre-packed products sold through retail outlets. June, London.
Van Camp, D., de Souza Monteiro, D.M. & Hooker, N.H. 2012. Stop or go? How is the UK food industry responding to front-of-pack nutrition labels? European Rev. of Ag. Econ., 39 (5) (2012):8 21–842.
Van Kleefa, E. & Dagevosb, H. 2015. The growing role of front-of-pack nutrition profile labelling: a consumer perspective on key issues and controversies. Critical Rev. in Food Sc. and Nutrn, 55 (3) 291-303.
Vemula, S., Gavaravarapu, S.R., Vardhana, Mendu, R., Mathur, P. & Avula, L. 2013. Use of food label information by urban consumers in India – a study among supermarket shoppers. Pub. Health Nutrition: 17(9), 2104–2114.
Vyth, E.L., Steenhuis, I.H.M., Roodenburg, A.J.C., Brug, J., Seidell, J.C. 2010. Front-of-pack nutrition label stimulates healthier product development: a quantitative analysis. Intl Jnl of Behavioral Nutrn and Physical Activity, 7:65.
Wang, S.Y., Chen, M., Liu, Z., Hong, Di., Sun, Y., Du, M., Su, C., Yu, Q., Liu, Y., Ren, J. Lu & Li, L. 2011. The changes of nutrition labelling of packaged food in Hangzhou in China during 2008, 2010. PLoS ONE, December, 6, 12 |e28443: 1-9.
3. INFLUENCING FOOD ENVIRONMENTS FOR HEALTHY DIETS THROUGH FOOD LABELLING
105
World Cancer Research Fund. 2015. International Nourishing Framework. Nutrition label standards and regulations on the use of claims and implied claims on foods. 29 July.
World Trade Organization. 2013. WTO 2013 news items: technical barriers to trade, formal meeting. Members continue to discuss “good practices” for technical regulations. 17 to 20 June.
World Trade Organization. 2014. The WTO agreements series Technical Barriers to Trade. Geneva.

CHAPTER 4:
INFLUENCING FOOD ENVIRONMENTS FOR HEALTHY DIETS THROUGH
FOOD-BASED DIETARY GUIDELINES
Carlos Gonzalez Fischer and Tara Garnett

4. INFLUENCING FOOD ENVIRONMENTS FOR HEALTHY DIETS THROUGH FOOD-BASED DIETARY GUIDELINES
109
INTRODUCTION
This chapter discusses the role that food-based dietary guidelines (FBDG) play in ensuring a healthy food environment – and how their impact could be increased. We provide an overview of existing national dietary guidelines around the world, analyse their current role in shaping the food environment and provide suggestions on how to improve their effectiveness.
What are food-based dietary guidelines?
FBDG are short, science-based, practical and accessible messages to guide people on healthy eating and associated healthy lifestyles that keep them well-nourished and healthy and can help prevent malnutrition in all its forms. Unlike recommended nutrient intakes – which are standards that apply worldwide – FBDG are tailored to the specific nutritional, geographical, economic and cultural conditions within which they operate. In many cases, the messages provided in dietary guidelines are illustrated with the aid of visual representations such as pyramids, plates or other diagrams, also known as food guides. These show the recommended relative contributions of different food groups to the diet.
Over the last two decades, an increasing number of countries have developed specific FBDG. These guidelines are intended to set out the official dietary “vision” for the country. In some cases they also set the nutritional steer for public food and nutrition, health and agricultural policies and nutrition education programmes.
How did the concept of national FBDG evolve?
The 1992 International Conference on Nutrition convened by the Food and Agriculture Organization and the World Health Organization, adopted a Plan for Action (FAO and WHO, 1992) calling for the dissemination of nutrition information, giving priority to breastfeeding and other sustainable food-based approaches that encourage dietary diversification through production and consumption of micronutrient-rich foods, including appropriate traditional foods. The Plan marked a change from policies driven by theoretical calculations on human nutrient requirements to those driven by the actual public health concerns of the day.
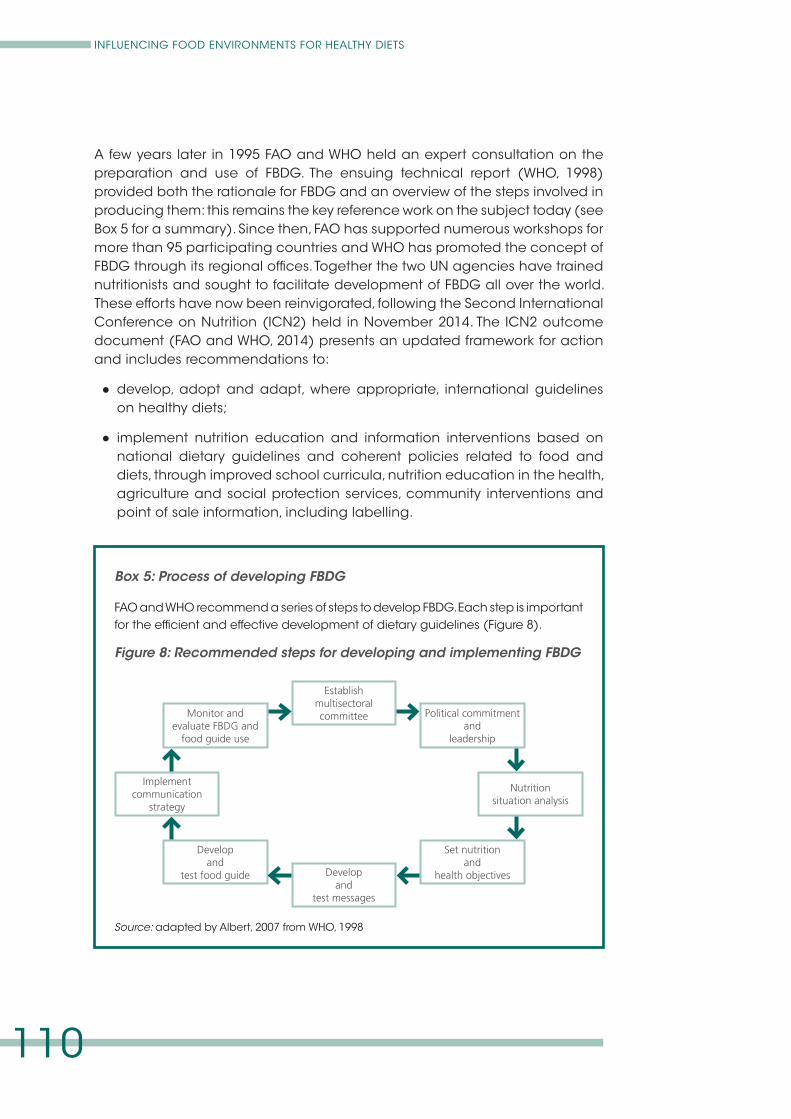
INFLUENCING FOOD ENVIRONMENTS FOR HEALTHY DIETS
110
Box 5: Process of developing FBDG
FAO and WHO recommend a series of steps to develop FBDG. Each step is important for the efficient and effective development of dietary guidelines (Figure 8).
A few years later in 1995 FAO and WHO held an expert consultation on the preparation and use of FBDG. The ensuing technical report (WHO, 1998) provided both the rationale for FBDG and an overview of the steps involved in producing them: this remains the key reference work on the subject today (see Box 5 for a summary). Since then, FAO has supported numerous workshops for more than 95 participating countries and WHO has promoted the concept of FBDG through its regional offices. Together the two UN agencies have trained nutritionists and sought to facilitate development of FBDG all over the world. These efforts have now been reinvigorated, following the Second International Conference on Nutrition (ICN2) held in November 2014. The ICN2 outcome document (FAO and WHO, 2014) presents an updated framework for action and includes recommendations to:
● develop, adopt and adapt, where appropriate, international guidelines on healthy diets;
● implement nutrition education and information interventions based on national dietary guidelines and coherent policies related to food and diets, through improved school curricula, nutrition education in the health, agriculture and social protection services, community interventions and point of sale information, including labelling.
Monitor and evaluate FBDG and
food guide use
Implement communication
strategy
Develop and
test food guide Develop and
test messages
Set nutrition and
health objectives
Nutrition situation analysis
Political commitment and
leadership
Establish multisectoral committee
Figure 8: Recommended steps for developing and implementing FBDG
Source: adapted by Albert, 2007 from WHO, 1998
4. INFLUENCING FOOD ENVIRONMENTS FOR HEALTHY DIETS THROUGH FOOD-BASED DIETARY GUIDELINES
111
Multisectoral committee
A first step in developing FBDG is the formation of a national committee which includes representatives of the leading ministries (e.g. health, agriculture, education, social welfare) and others who can assist in developing and promoting FBDG such as scientific societies, food industry associations and consumer organizations. While including a range of institutions is essential, experience shows that FBDG development is most successful when there is a leading individual who is able to dedicate time to advocating the concept of FBDG and coordinating the process.
Political support and commitment
Without political support and coordination, bureaucracies may fail to incorporate FBDG into their programmes or devote resources to developing and promoting FBDG. In a number of countries, Parliament approves the FBDG and the Prime Minister or President announces the guidelines.
Analysis of nutrition situation and setting objectives
The next steps are technical: nutritionists and other specialists analyse the nutrition situation and identify objectives. Using data such as health and census statistics, household expenditure and food consumption surveys, food balance sheets and the scientific literature, the technical analysis leads to identification of the nutrition issues which are significant for public health. Most countries do not have good, comprehensive data for formulating their FBDG and the lack of data can cause long delays in developing FBDG.
Testing of messages and food guides
The general public has difficulty understanding the words and concepts used by nutritionists. Even after the guidelines are developed, the text in public information campaigns may have to be modified so different audiences can understand them.
Some concepts commonly used by nutritionists are not easily conveyed to all sectors of the public. For example, dietary variety and portion size are basic concepts in nutrition but they are often misunderstood. Consumers may not understand the amounts conveyed by words such as sparingly, increase, moderate; visual symbols and common measurements can assist them. The testing of messages and food guides is a crucial step in formulating FBDG. Unfortunately, countries may omit this step due to lack of awareness of its importance or lack of resources for this type of research. Regardless of the amount of expertise and experience within a team, pre-testing the messages and food guides always brings valuable new information.
INFLUENCING FOOD ENVIRONMENTS FOR HEALTHY DIETS
112
Communication strategy and information dissemination
A major obstacle in implementing FBDG is that nearly all countries lack sufficient resources to develop and disseminate FBDG-related information. Without a communication strategy, the FBDG materials may not reach a wide audience and may have a very limited impact. Education and communication expertise, as well as nutrition expertise, are needed to formulate and implement FBDG successfully. FBDG must be widely distributed and community workers need training to use the materials.
Monitoring and evaluation
The process of disseminating FBDG and food guides should be assessed to ensure messages are reaching their audiences. Without evaluation, it is difficult to demonstrate that the messages and food guide impact on consumer awareness and to know whether knowledge, attitudes and behaviours are changing. The evaluations should take into consideration the environment and potential for change within realistic time frames. Expertise is necessary to conduct an evaluation of FBDG. Many countries do not implement this step.
Beyond individual food choice
Dietary guidelines provide individuals with the information needed to make healthier food choices. However, as is well recognised, food consumption practices are shaped by far more than individual knowledge. The food environment – including the availability, cost and accessibility of foods, as well as policies, societal norms and cultures – is a critical influence on eating habits (Box 6 and Figure 9).
Box 6: What is the food environment?
Food environments are defined as the collective physical, economic, policy and sociocultural surroundings, opportunities and conditions that influence people’s food and beverage choices and nutritional status. These include aspects such as food composition, food labelling, food promotion, food prices, food provision in schools and other settings, food availability and trade policies affecting food availability, price and quality.
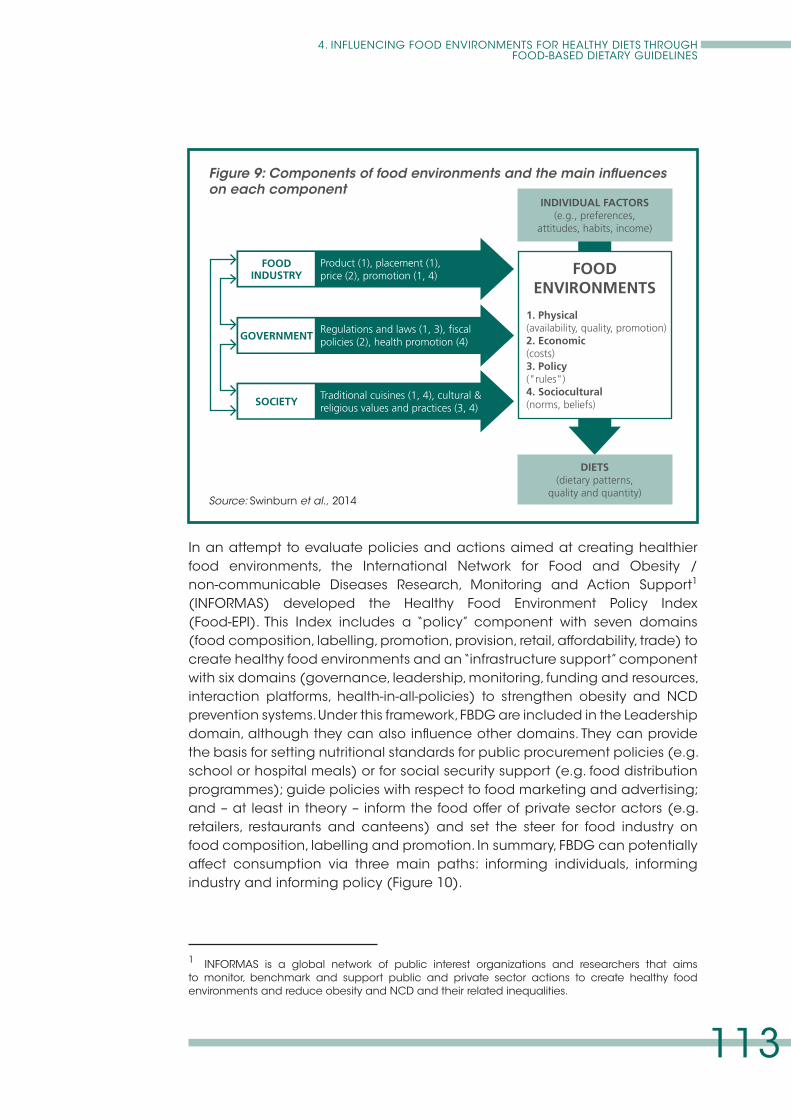
4. INFLUENCING FOOD ENVIRONMENTS FOR HEALTHY DIETS THROUGH FOOD-BASED DIETARY GUIDELINES
113
Figure 9: Components of food environments and the main influences on each component
Source: Swinburn et al., 2014
In an attempt to evaluate policies and actions aimed at creating healthier food environments, the International Network for Food and Obesity / non-communicable Diseases Research, Monitoring and Action Support1 (INFORMAS) developed the Healthy Food Environment Policy Index (Food-EPI). This Index includes a “policy” component with seven domains (food composition, labelling, promotion, provision, retail, affordability, trade) to create healthy food environments and an “infrastructure support” component with six domains (governance, leadership, monitoring, funding and resources, interaction platforms, health-in-all-policies) to strengthen obesity and NCD prevention systems. Under this framework, FBDG are included in the Leadership domain, although they can also influence other domains. They can provide the basis for setting nutritional standards for public procurement policies (e.g. school or hospital meals) or for social security support (e.g. food distribution programmes); guide policies with respect to food marketing and advertising; and – at least in theory – inform the food offer of private sector actors (e.g. retailers, restaurants and canteens) and set the steer for food industry on food composition, labelling and promotion. In summary, FBDG can potentially affect consumption via three main paths: informing individuals, informing industry and informing policy (Figure 10).
1 INFORMAS is a global network of public interest organizations and researchers that aims to monitor, benchmark and support public and private sector actions to create healthy food environments and reduce obesity and NCD and their related inequalities.
FOOD ENVIRONMENTS
1. Physical(availability, quality, promotion)2. Economic(costs)3. Policy("rules")4. Sociocultural(norms, beliefs)
INDIVIDUAL FACTORS(e.g., preferences,
attitudes, habits, income)
DIETS(dietary patterns,
quality and quantity)
FOOD INDUSTRY
GOVERNMENT
SOCIETY
Product (1), placement (1), price (2), promotion (1, 4)
Regulations and laws (1, 3), fiscal policies (2), health promotion (4)
Traditional cuisines (1, 4), cultural & religious values and practices (3, 4)
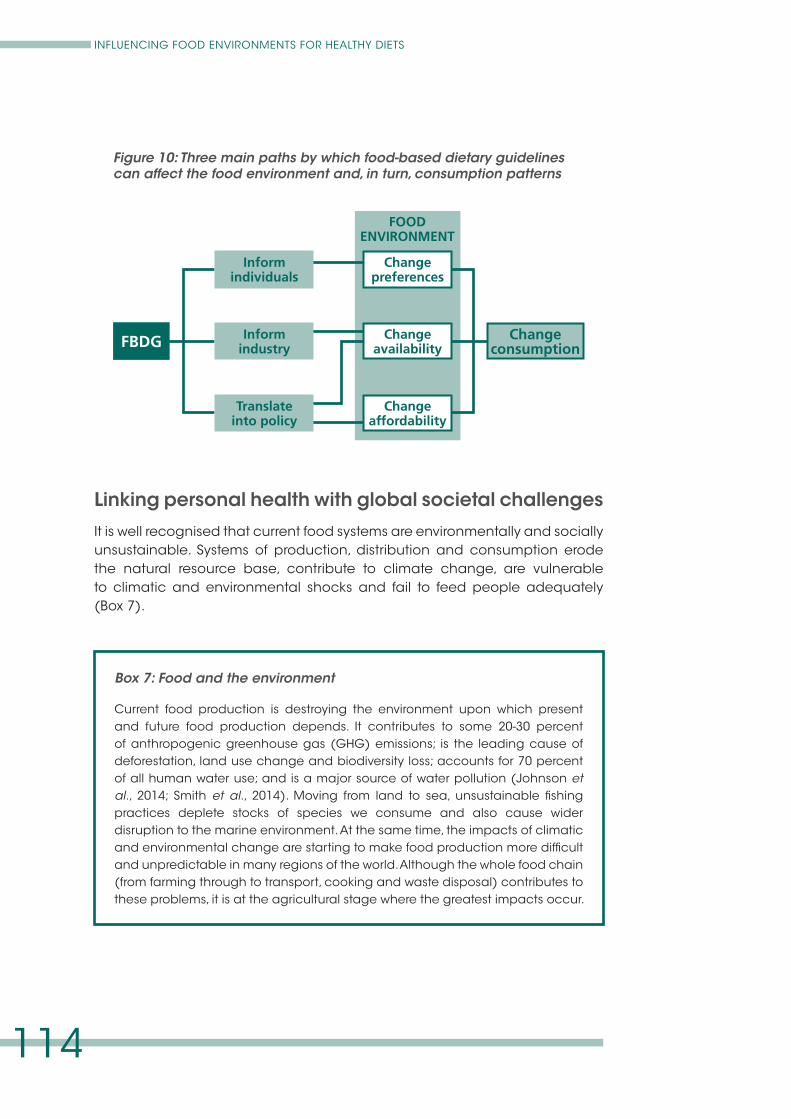
INFLUENCING FOOD ENVIRONMENTS FOR HEALTHY DIETS
114
Figure 10: Three main paths by which food-based dietary guidelines can affect the food environment and, in turn, consumption patterns
Box 7: Food and the environment
Current food production is destroying the environment upon which present and future food production depends. It contributes to some 20-30 percent of anthropogenic greenhouse gas (GHG) emissions; is the leading cause of deforestation, land use change and biodiversity loss; accounts for 70 percent of all human water use; and is a major source of water pollution (Johnson et al., 2014; Smith et al., 2014). Moving from land to sea, unsustainable fishing practices deplete stocks of species we consume and also cause wider disruption to the marine environment. At the same time, the impacts of climatic and environmental change are starting to make food production more difficult and unpredictable in many regions of the world. Although the whole food chain (from farming through to transport, cooking and waste disposal) contributes to these problems, it is at the agricultural stage where the greatest impacts occur.
Linking personal health with global societal challenges
It is well recognised that current food systems are environmentally and socially unsustainable. Systems of production, distribution and consumption erode the natural resource base, contribute to climate change, are vulnerable to climatic and environmental shocks and fail to feed people adequately (Box 7).
FOOD ENVIRONMENT
Change preferences
Change affordability
Inform individuals
Inform industry
Change availability
Translate into policy
Change consumptionFBDG
4. INFLUENCING FOOD ENVIRONMENTS FOR HEALTHY DIETS THROUGH FOOD-BASED DIETARY GUIDELINES
115
Both crop and livestock production generate environmental costs and in recent years the focus of attention has fallen in particular on the latter. The rearing of livestock for meat, eggs and milk generates some 14.5 percent of total global GHG emissions and utilises 70 percent of agricultural land (including a third of arable land, needed also for crop production). Grazing livestock and less directly the production of feed crops, are together the main agricultural drivers of deforestation, biodiversity loss and land degradation (Gerber et al., 2013).
The primary function of agriculture is to produce food to feed our growing population. But although in aggregate our food system generates enough food energy for our population of over 7 billion, it does not ensure adequate and affordable nutrition for all. About half the global population is inadequately or inappropriately nourished, once the combined burdens of hunger, micronutrient deficiencies and obesity are taken into account (Tulchinsky, 2010; FAO, IFAD and WFP, 2015; WHO, 2015). And although the food chain contributes economic value both at a national and international level, the distribution of that value is not even. Many of the world’s 1.3 billion smallholders and landless agricultural workers live on or below the poverty line.
Without action, all these problems are set to become acute. As our global population grows and becomes wealthier and more urbanised, it demands more resource intensive foods - in particular, animal products. This has the potential to cause further damage to the environment and exacerbate the problems of obesity and chronic diseases. Policy-makers, NGOs and the business community all agree that if we are to address our environmental problems, adapt to climate change and create a more food secure, nutrition-enhancing food future, the current food system needs to change. There is less agreement on what, exactly, should be done.
From a policy and industry perspective most of the focus in the past few decades has been on improving the environmental efficiency of production: to produce more food with less impact. In recent years, an increasing number of analysts have challenged this perspective, arguing that while production-side approaches may be necessary, they are not sufficient. To address environmental concerns sufficiently and tackle the twin problems of dietary insufficiency and excess, three additional approaches are suggested (Garnett, 2014).
First there is a need to address power imbalances in the food system: simply producing more food may not solve problems of affordability and access. Essential actions identified include efforts to address price and subsidy distortions, support and empower smallholder farmers and landless workers, agree better working conditions and fairer terms of trade and improve transport, storage and market infrastructure.
INFLUENCING FOOD ENVIRONMENTS FOR HEALTHY DIETS
116
Second, measures are needed to reduce the amount of food lost or wasted along the whole supply chain (one third of all food produced, FAO, 2011) which not only undermines food security but represents a waste of land, water and other inputs and the generation of unnecessary emissions.
Third, there is growing emphasis on the need for dietary change. What, and how much we eat directly affects what and how much is produced. The Intergovernmental Panel on Climate Change in its Fifth Assessment Report highlights the potential of demand side changes in reducing GHG emissions while a growing number of academics and civil society organizations are focusing on the role that widespread adoption of healthy and sustainable eating patterns can play in addressing both health and environmental challenges.
If we are to address our food security challenges today and also secure a viable food future for tomorrow’s generation, then food systems need to become more sustainable (Box 8).
Dietary guidelines can play a role in helping shape a more sustainable and health enhancing food system by providing guidance on dietary patterns that are not only consistent with nutritional requirements but also generate fewer environmental impacts. In recent years, some countries (Germany, Brazil, Sweden and Qatar) have started to integrate environmental sustainability concerns into their national dietary guidelines as discussed in more detail elsewhere (Gonzalez Fischer and Garnett, 2016).
Box 8: Sustainable diets
The 2010 International Scientific Symposium “Biodiversity and Sustainable Diets: United Against Hunger” organized jointly by FAO and Bioversity International, agreed a definition of sustainable diets.
Sustainable diets are “those diets with low environmental impacts which contribute to food and nutrition security and to healthy life for present and future generations. Sustainable diets are protective and respectful of biodiversity and ecosystems, culturally acceptable, accessible, economically fair and affordable; nutritionally adequate, safe and healthy; while optimising natural and human resources.”
4. INFLUENCING FOOD ENVIRONMENTS FOR HEALTHY DIETS THROUGH FOOD-BASED DIETARY GUIDELINES
117
METHODOLOGY
Our method was as follows. We undertook a web-based review of national dietary guidelines worldwide, using publicly available information. These included the guidelines themselves, associated food guides and other supporting documents, press releases about their publication and general literature on the topic including scientific papers and reports.
In carrying out this research we made use of FAO’s database on FBDG.2 The database presents a summary of each guideline, with information provided and approved by each country, which allowed us to access the guidelines (as they were not otherwise always easy to find) and helped us to learn about the process of development of the guidelines (not all countries publish information about their development).3
We also made use of local contacts for assistance and searched in the relevant country languages where we had the linguistic capacity (e.g. English, Spanish, French, German, Italian, Swedish, Estonian). Local contacts were, however, at times hard to locate and therefore language and cultural barriers made it difficult to look in depth at some of the guidelines. It follows from this observation that countries not represented in this study may indeed have guidelines which we did not find.
RESULTS AND DISCUSSION
General picture
Overall, we identified 83 countries with official dietary guidelines (Figure 11, Appendix 1). This includes the 80 countries in the FAO database plus three further countries: Bolivia, Colombia and France. At the time of conducting this research, at least 13 of those countries4 were in the process of renewing their guidelines and one country (Peru) was developing its first set.
2 Available at www.fao.org/nutrition/nutrition-education/food-dietary-guidelines/en/
3 The information in the database is provided and approved by the countries. Three countries included in the analysis are not present in the database: Bolivia, Colombia and France.
4 Austria, China, Estonia, Guyana, Israel, Italy, Hungary, Malta, Mongolia, Netherlands, Republic of Korea, United Kingdom and Uruguay.
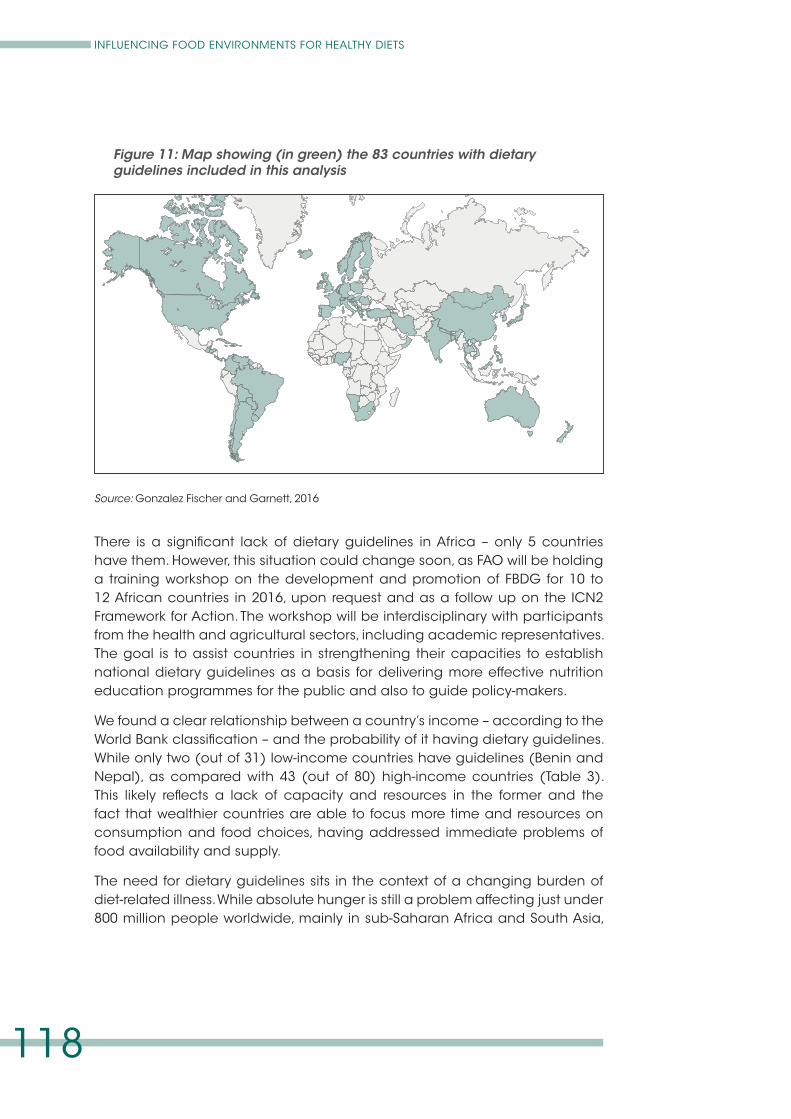
INFLUENCING FOOD ENVIRONMENTS FOR HEALTHY DIETS
118
Figure 11: Map showing (in green) the 83 countries with dietary guidelines included in this analysis
There is a significant lack of dietary guidelines in Africa – only 5 countries have them. However, this situation could change soon, as FAO will be holding a training workshop on the development and promotion of FBDG for 10 to 12 African countries in 2016, upon request and as a follow up on the ICN2 Framework for Action. The workshop will be interdisciplinary with participants from the health and agricultural sectors, including academic representatives. The goal is to assist countries in strengthening their capacities to establish national dietary guidelines as a basis for delivering more effective nutrition education programmes for the public and also to guide policy-makers.
We found a clear relationship between a country’s income – according to the World Bank classification – and the probability of it having dietary guidelines. While only two (out of 31) low-income countries have guidelines (Benin and Nepal), as compared with 43 (out of 80) high-income countries (Table 3). This likely reflects a lack of capacity and resources in the former and the fact that wealthier countries are able to focus more time and resources on consumption and food choices, having addressed immediate problems of food availability and supply.
The need for dietary guidelines sits in the context of a changing burden of diet-related illness. While absolute hunger is still a problem affecting just under 800 million people worldwide, mainly in sub-Saharan Africa and South Asia,
Source: Gonzalez Fischer and Garnett, 2016
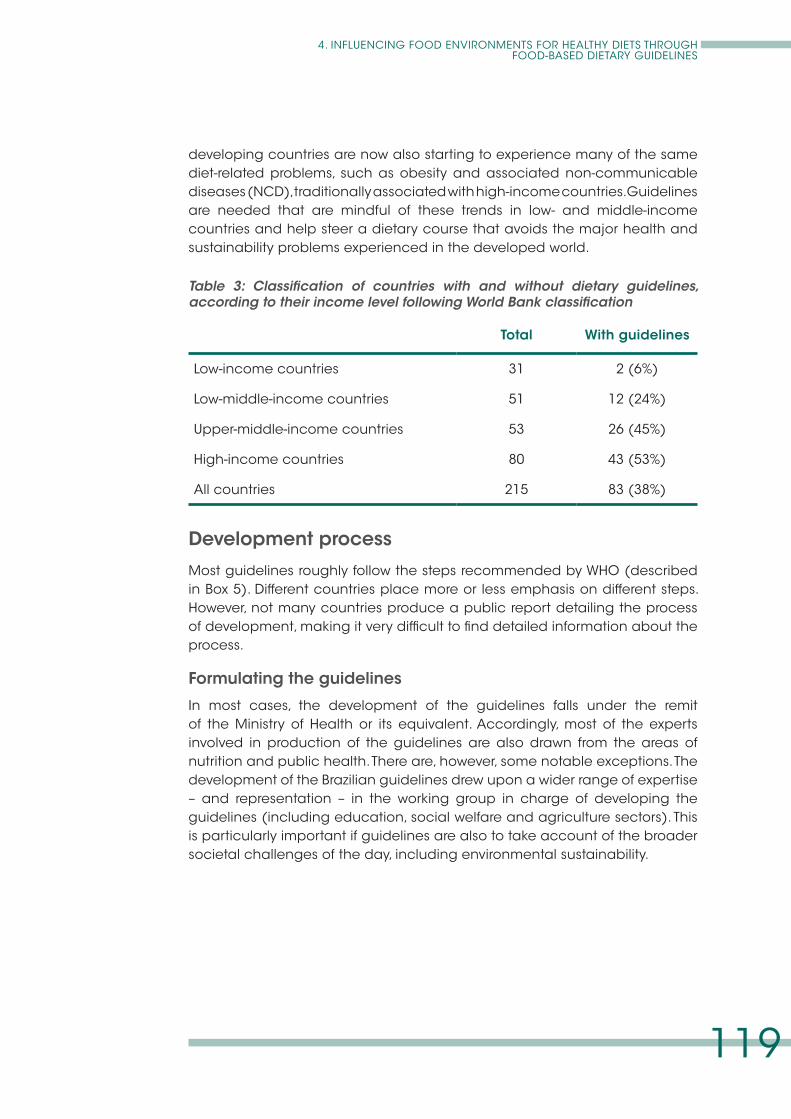
4. INFLUENCING FOOD ENVIRONMENTS FOR HEALTHY DIETS THROUGH FOOD-BASED DIETARY GUIDELINES
119
developing countries are now also starting to experience many of the same diet-related problems, such as obesity and associated non-communicable diseases (NCD), traditionally associated with high-income countries. Guidelines are needed that are mindful of these trends in low- and middle-income countries and help steer a dietary course that avoids the major health and sustainability problems experienced in the developed world.
Table 3: Classification of countries with and without dietary guidelines, according to their income level following World Bank classification
Total With guidelines
Low-income countries 31 2 (6%)
Low-middle-income countries 51 12 (24%)
Upper-middle-income countries 53 26 (45%)
High-income countries 80 43 (53%)
All countries 215 83 (38%)
Development process
Most guidelines roughly follow the steps recommended by WHO (described in Box 5). Different countries place more or less emphasis on different steps. However, not many countries produce a public report detailing the process of development, making it very difficult to find detailed information about the process.
Formulating the guidelines
In most cases, the development of the guidelines falls under the remit of the Ministry of Health or its equivalent. Accordingly, most of the experts involved in production of the guidelines are also drawn from the areas of nutrition and public health. There are, however, some notable exceptions. The development of the Brazilian guidelines drew upon a wider range of expertise – and representation – in the working group in charge of developing the guidelines (including education, social welfare and agriculture sectors). This is particularly important if guidelines are also to take account of the broader societal challenges of the day, including environmental sustainability.
INFLUENCING FOOD ENVIRONMENTS FOR HEALTHY DIETS
120
The literature reviews usually conducted to inform the development of the guidelines present a valuable opportunity to focus on research gaps. Traditionally, the reviews highlight the fact that some of the relationships between certain foods and health outcomes are not fully understood. Other identified gaps could be the trade-offs between health and other concerns (e.g. many guidelines recommend increased fish consumption to reduce the risk of cardiovascular disease but current production methods pose serious sustainability concerns and an increase in demand will exacerbate them). These country level reviews do not tend to consider evidence as to the role and impact of having guidelines per se – that is, evidence as to the effectiveness of guidelines is an area that is generally not investigated. A broader range of expertise is needed to identify and tackle these research gaps, drawing upon environmental disciplines (looking at the environmental impact of different foods) and social science (looking at consumer behaviour, as well as the social impacts of food production and consumption).
It is worth noting that when developing national guidelines it is often difficult to separate the scientific from the political process. For example, the most recent update (2015) of the United States guidelines does not incorporate sustainability into its guidance despite the recommendations of the Advisory Committee responsible for drafting them. The final decision to exclude sustainability reflected political judgement rather than any fundamental disagreement about the scientific evidence base.
Presentation and messaging
The presentation of the messages varies greatly. Some countries provide very short, simple, broad messages (e.g. Argentina) while others give detailed advice, including on specific quantities or the frequency with which each food should be eaten (e.g. United States). Some countries only present a visual food guide, in some cases accompanied by some top level messages (e.g. Germany), whereas others have simple messaging with a report describing the process behind the guidelines and the evidence on which the recommendations are based (e.g. Sweden).
4. INFLUENCING FOOD ENVIRONMENTS FOR HEALTHY DIETS THROUGH FOOD-BASED DIETARY GUIDELINES
121
Despite these differences the guidelines tend to present similar advice on most issues. The most common messages are on reducing salt intake and increasing fruit and vegetable consumption (present in 96 percent and 94 percent of the guidelines, respectively). Ninety-three percent of the guidelines advise people to cut down on fat or change the types of fats they eat (e.g. replacing animal fat with vegetable fat). The need to reduce sugar intake is explicitly mentioned in 86 percent. Finally, 80 percent of the guidelines mention the importance of a varied and balanced diet. Most guidelines that do not explicitly mention the latter nevertheless show a variety of foods in the plate, pyramid, or chosen image provided.
However there are also some significant differences among dietary guidelines. This is not surprising since FBDG speak to a country’s specific health, behaviour, culture and economic conditions. Only 54 percent of the guidelines advise people to moderate alcohol consumption and 51 percent make comments on food safety. Mention of these issues may reflect the prevalence of alcohol abuse and food-borne diseases in different countries or simply the way government departments are organised. Around 45 percent of the guidelines mention cooking or food preparation. Despite the high environmental impact associated with meat production and the recent WHO statement on the links between processed – and possibly red – meat, and cancer (Bouvard et al., 2015), only 20 out of 83 guidelines (24 percent) recommend reducing or limiting meat intakes, with some distinguishing between red and processed meat.5 Some guidelines mention maximum frequency, recommend the inclusion of vegetarian dishes in the weekly menu, or simply advise moderation.
In this regard, we found very few guidelines offering advice to vegetarians or other groups with specific dietary requirements. Exceptions include Sweden and Qatar who, for example, provide advice on plant-based alternatives to dairy products (both recommend choosing fortified products).
For a summary of the most common messages and their distributions among countries according to their national income levels, see Figure 12.
5 Note that the WHO’s International Agency for Research on Cancer (IARC) statement on the links between processed – and possibly red – meat and cancer was just recently released and it may be that government health departments who are currently silent on the subject will update their guidance.
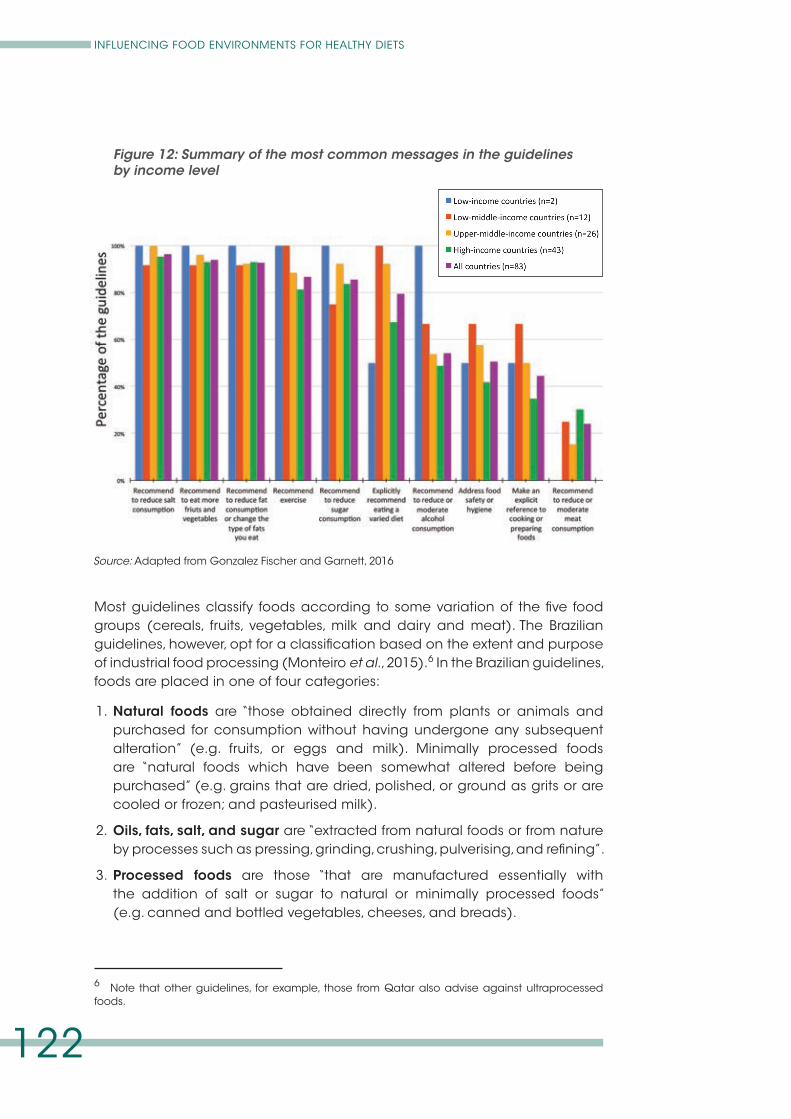
INFLUENCING FOOD ENVIRONMENTS FOR HEALTHY DIETS
122
Figure 12: Summary of the most common messages in the guidelines by income level
Most guidelines classify foods according to some variation of the five food groups (cereals, fruits, vegetables, milk and dairy and meat). The Brazilian guidelines, however, opt for a classification based on the extent and purpose of industrial food processing (Monteiro et al., 2015).6 In the Brazilian guidelines, foods are placed in one of four categories:
1. Natural foods are “those obtained directly from plants or animals and purchased for consumption without having undergone any subsequent alteration” (e.g. fruits, or eggs and milk). Minimally processed foods are “natural foods which have been somewhat altered before being purchased” (e.g. grains that are dried, polished, or ground as grits or are cooled or frozen; and pasteurised milk).
2. Oils, fats, salt, and sugar are “extracted from natural foods or from nature by processes such as pressing, grinding, crushing, pulverising, and refining”.
3. Processed foods are those “that are manufactured essentially with the addition of salt or sugar to natural or minimally processed foods” (e.g. canned and bottled vegetables, cheeses, and breads).
6 Note that other guidelines, for example, those from Qatar also advise against ultraprocessed foods.
Source: Adapted from Gonzalez Fischer and Garnett, 2016
4. INFLUENCING FOOD ENVIRONMENTS FOR HEALTHY DIETS THROUGH FOOD-BASED DIETARY GUIDELINES
123
4. Ultraprocessed foods are “products whose manufacture involves several stages and various processing techniques and ingredients, many of which are used exclusively by industry” (e.g. packaged salty oily snacks, confectionery, soft drinks, sweetened breakfast sticks, pre-prepared packaged pizzas and instant noodles).
Some guidelines also extend their advice into broader aspects of our relationship with food. For example, the Japanese and Brazilian guidelines advise that people eat in company (e.g. with the family) and take time to sit down and enjoy the meal. The Brazilian guidelines include advice to “be wary of food advertising and marketing”. Moving from food into other lifestyle areas, 86 percent of the guidelines analysed suggest that people should be physically active.
Furthermore, as mentioned, a few countries have started to integrate sustainability concerns into dietary guidelines. The German guidelines highlight win-wins between the environment and health, to make their recommendations more appealing. The Qatari guidelines include one that encourages people to eat in an “environmentally conscious way” (i.e. plant-based diets with fresh and seasonal ingredients). The Brazilian and Swedish guidelines have sustainability embedded throughout the advice, providing information on the environmental (Sweden) and socio-economic (Brazil) impacts of different foods. All four of the guidelines (Brazil, Germany, Sweden and Qatar) recommend choosing fish from sustainable sources.
Communication
It is noteworthy that finding guidelines for many countries was difficult, despite extensive web searches, even though we knew they existed since, for example, we had seen references to them in other documents. This means that their effectiveness as a form of guidance either for health professionals or the general population is likely to be limited.
This said, in its efforts to promote FBDG, FAO has a website7 that lists and catalogues those produced so far, summarising information about the main messages and how the guidelines have been developed. All the information is provided and approved by the member countries. This website represents a valuable resource for government officials who want to develop or update their own dietary guidelines and contribute more generally to raising policy-level awareness about FBDG. However it is unlikely to help with the public dissemination of specific guidelines inside each country. This observation underlines the importance not just of having guidelines but of effective national strategies for communication and dissemination.
7 Available at www.fao.org/nutrition/nutrition-education/food-dietary-guidelines/en/
INFLUENCING FOOD ENVIRONMENTS FOR HEALTHY DIETS
124
New media and internet communications have also led to a proliferation and redundancy of information, including past versions of the official guidelines, other official advice from the government (from different agencies and intended for different audiences) and unofficial advice, sometimes based on the official guidelines of the same country and sometimes on those of another country, or non-official guidelines. This makes it difficult to know what the latest and most “official” advice actually is. Once again this underlines the point that guidelines need to be clearly visible, signposted and communicated. It is worth noting too that in a world of mass media, well communicated guidelines have a critically important role to play in providing the public with evidence-based dietary information to counter the often inaccurate messages from advocates of fad diets.
Audience
Most countries produce a main set of guidelines appropriate to the needs of the general population; others provide separate guidelines for particular groups. For example, the “Dietary guidelines for Cuban people” are directed at the general public older than 2 years of age. But guidance on feeding children younger than 2 years is also provided, intended for healthcare providers and other relevant professionals. Canada has a separate set of guidelines for indigenous populations: First Nations, Inuit and Métis.
Although we could not ascertain the intended audience for all guidelines, the communication strategy of most of the guidelines does not seem to be aimed at the general public, but rather at health practitioners. We base this conclusion partly on the tone of the messaging, but mainly on the fact that for the average individual they are generally not easy to find. If we found it difficult, it is unlikely that a member of the general public will locate them. This calls for a communication strategy that includes very simple messaging aimed at the general public, backed up by more detailed information for those who choose to learn more, disseminated through a variety of traditional and new media outlets.
We could not find any examples of official guidelines aimed at retailers and caterers, the gatekeepers of food consumption. If available, these guidelines could set out what food should preferentially be retailed in shops, restaurants and canteens. Note that in some countries, out of home consumption represents a significant proportion of total food consumption.
4. INFLUENCING FOOD ENVIRONMENTS FOR HEALTHY DIETS THROUGH FOOD-BASED DIETARY GUIDELINES
125
Monitoring and evaluation
As emphasised by WHO (1998), it is essential that there are monitoring processes to evaluate the impact of the guidelines. Many countries invest considerable efforts in developing dietary guidelines but pay less attention to designing and implementing monitoring and evaluation processes. Among those that do, one common monitoring practice is via national food consumption surveys (much more common in high-income than low-income countries). These surveys provide useful background on what people eat and therefore what kind of dietary recommendations are needed. However, consumption surveys can require funding and staffing and poor countries might not be able to conduct them as regularly as needed.
Example: The Healthy Eating Index
The Healthy Eating Index (HEI) is a diet quality index that measures conformance with United States national dietary guidelines (Guenther et al., 2014). It was created in 1995 by the Center for Nutrition Policy and Promotion (CNPP) and has been regularly updated to reflect the new versions of the national dietary guidelines. The latest version, the HEI-2010, includes 12 components, 9 of which assess adequacy of the diet, including: 1) total fruit; 2) whole fruit; 3) total vegetables; 4) greens and beans; 5) whole grains; 6) dairy; 7) total protein foods; 8) seafood and plant proteins; and 9) fatty acids. The remaining 3, refined grains, sodium, and empty calories (i.e. energy from solid fats, alcohol and added sugars), assess dietary components that should be consumed in moderation. For all components, higher scores reflect better diet quality because the moderation components are scored such that lower intakes receive higher scores. The scores of the 12 components are added to yield a total score, which has a maximum value of 100.
The HEI can be used for a variety of applications, including: population monitoring; epidemiologic research; evaluations of the food environment; food assistance packages; nutrition interventions; and the relation between diet cost and diet quality. To monitor the diet quality of the United States population, the CNPP calculates the HEI based on data collected via 24 hour dietary recalls in national surveys.
INFLUENCING FOOD ENVIRONMENTS FOR HEALTHY DIETS
126
Some countries also try to estimate the reach of the guidelines by surveying how much people know about them and their messaging. For example, before starting to revise the nutritional advice for the 2015 dietary guidelines, the Swedish National Food Agency (NFA) conducted a survey of consumers’ and advisors’ knowledge of and acceptance of advice regarding healthy dietary habits. It also investigated how the NFA uses information and the target groups’ need for and expectations of advice regarding healthy dietary habits. The evaluation showed that the Swedes’ knowledge of how to eat to be healthy is high and that 87 percent think it is a good thing that the authorities provide nutritional advice.
However, because of the multitude of influences on people’s consumption patterns it is not possible to attribute particular changes in consumption definitively to the guidelines. The task of attribution is made easier when guidelines are explicitly used to inform particular interventions (e.g. school meal programmes – in this case it is relatively simple (provided there are sufficient resources) to assess how food consumption changes.
A missing step: translation into policy
Ensuring that the guidelines influence policy is vital if they are to affect food environments in a meaningful way. While this point is not explicitly made by FAO and WHO in its guidance on FBDG development (Box 5) if there are no clear links with policy, the guidelines will have a very limited effect, if any, on food consumption patterns.
Due to the time and resources available we were not able to conduct an in depth analysis of the impact of dietary guidelines on policies and implementation strategies in all countries. However, our overview indicated that links between the dietary guidelines and other policies are not readily apparent. Even professionals working in the countries in question – including those working in the institutions involved in developing the guidelines – were not sure about the nature of this relationship.
We did however find some instances where the guidelines were formally connected to school meals or other public procurement programmes. For example, the United States Dietary Guidelines form the basis of nutrition policy and programmes. Besides these school meals, they inform hospital meals, military rations and all the programmes from the Food and Nutrition Service of the Department of Agriculture (e.g. the Special Supplemental Nutrition Program for Women, Infants, and Children, WIC, see example below). In other cases, we found school meal programmes that were certainly compliant with the national guidelines (e.g. UK and Brazil) but the formal link between them was not apparent.
4. INFLUENCING FOOD ENVIRONMENTS FOR HEALTHY DIETS THROUGH FOOD-BASED DIETARY GUIDELINES
127
Example: WIC
The Special Supplemental Nutrition Program for Women, Infants, and Children (WIC) falls under the jurisdiction of the United States Department of Agriculture (USDA) Food and Nutrition Service (FNS).
The program provides Federal grants to states for supplemental foods, health care referrals and nutrition education for low-income, pregnant, breastfeeding and non-breastfeeding postpartum women and to infants and children up to age five who are found to be at nutritional risk.
WIC was established as a permanent program in 1974 and since 2009 the food packages are aligned with the Dietary Guidelines for Americans.
An analysis carried out by FAO (2014) in Latin America and the Caribbean found that 14 out of 24 countries had used the guidelines to define national policy, plans or programmes (e.g. embedding the guidelines in education and nutrition programmes) suggesting that while there has been some progress there is still some way to go. Further research is needed to understand the relationship between dietary guidelines and other policies such as public procurement and school meal standards and to identify how to strengthen the link and make it more explicit.
With well defined links to policy, the guidelines have greater scope to have a real impact on food consumption patterns. At the same time, the stronger the link with particular policy interventions, the stronger the risk that particular interest groups, who have a stake in which foods are specified in procurement contracts, will seek to influence the guidelines. This point helps explain the fierce debate about including sustainability in the most recent (2015) update of the United States guidelines and the subsequent decision not to include it.
INFLUENCING FOOD ENVIRONMENTS FOR HEALTHY DIETS
128
CONCLUSIONS AND RECOMMENDATIONS
Despite all the limitations and shortcomings described here, dietary guidelines are still a key component of a coherent food policy. At their best they provide an official, accessible and easy-to-understand steer on how people should eat and the direction of progress needed. To fulfil their potential, guidelines should be evidence-based and widely communicated to the general public and health professionals. Critically they also need to underpin and link to the development of policies and interventions, including but not limited to school meals, food aid, public procurement standards and regulations on food marketing and advertising.
An increasingly robust body of research now finds that a focus on health alone, while necessary, is not sufficient. Current food systems have a high negative environmental impact, low equity and high volatility; in other words, they are not sustainable (Box 7). Diets consistent with good health today can undermine the wellbeing of future generations and their ability to access and consume nutritious food. Thus it is essential to incorporate environmental and other societal considerations into the definition of a desirable dietary pattern.
Based on our analysis above our specific suggestions for developing dietary guidelines that help to create a healthy food environment are as follows. Guidelines should:
● Have frequent updates to include the latest nutritional evidence and adjust to the changing public health landscape;
● Display ownership by multiple government departments and be robust in the face of lobbying by interest groups;
● Develop via two distinct and independent processes:
- development based on the advice of scientists and professionals from a wide range of expertise, health, environment and socio-economic concerns;
- consultation with civil society and industry, considering their interests but subordinating this to the scientific evidence;
● Communicate with different audiences, in formats and levels of detail suitable to each audience: general public, health professionals and those working in the food sector.
4. INFLUENCING FOOD ENVIRONMENTS FOR HEALTHY DIETS THROUGH FOOD-BASED DIETARY GUIDELINES
129
● Be accessible but ambitious:
- they should consider current consumption patterns and the cultural context, so they do not “stretch” people unrealistically;
- they should promote a clear change in the consumption patterns needed to foster truly healthy and sustainable dietary patterns, by adopting and communicating a series of achievable step changes;
● Include advice for different population groups where relevant, including those who choose not to eat meat or animal products;
● Include advice beyond just what to eat to redefine our relationship with food, including:
- preferred settings to eat;
- cooking and food preparation;
- information on the environmental impact of different foods;
● Need promotion, everybody should know about them:
- effective communication of the guidelines not only helps to promote their message, but will counter inaccurate information from other sources (e.g. fad diets);
● Be informed and validated by monitoring food consumption, public awareness of the guidelines and the issues they raise:
- developing countries need a survey funding system;
● Have clear links to food policies that are actually implemented, e.g. school and hospital meals, food aid, public procurement, advertising regulations and industry standards:
- this should be a new step in the recommended process to develop the guidelines;
● Integrate sustainability concerns, to ensure that future generations will be able to enjoy sufficient and nutritious food.
INFLUENCING FOOD ENVIRONMENTS FOR HEALTHY DIETS
130
REFERENCES
Albert, J. 2007. Global patterns and country experiences with the formulation and implementation of food-based dietary guidelines. Ann. of Nutrn and Metabolism, 51 (Suppl. 2), 2-7. DOI: 10.1159/000103560.
Bouvard, V., Loomis, D., Guyton, K. Z., Grosse, Y., El Ghissassi, F., Benbrahim-Tallaa, L., Guha, N., Mattock, H. & Straif, K. on behalf of International Agency for Research on Cancer Monograph Working Group. 2015. Carcinogenicity of consumption of red and processed meat. The Lancet Oncology 16, 1599-1600. DOI: 10.1016/S1470-2045(15)00444-1.
FAO. 2011. Global food losses and food waste – extent, causes and prevention. FAO. Rome.
FAO. 2014. El estado de las alimentarias basadas en alimentos en América Latina y el Caribe. FAO. Rome.
FAO and WHO. 1992. International Conference on Nutrition: Final report of the International Conference on Nutrition. FAO and WHO. Rome.
FAO and WHO. 2014. Second International Conference on Nutrition: Conference Outcome Document: Framework for action. FAO. Rome.
FAO, IFAD and WFP. 2015. The state of food insecurity in the world 2015. Meeting the 2015 international hunger targets: taking stock of uneven progress. FAO. Rome.
Garnett, T. 2014. Changing what we eat: A call for research & action on widespread adoption of sustainable healthy eating. Food Climate Research Network, June, available at www. fcrn. org. uk/sites/default/files/fcrn_wellcome_gfs_changing_consumption_report_final.pdf
Gerber, P. J., Steinfeld, H., Henderson, B., Mottet, A., Opio, C., Dijkman, J., Falcucci, A. & Tempio, G. 2013. Tackling climate change through livestock: a global assessment of emissions and mitigation opportunities. FAO. Rome.
Gonzalez Fischer, C. & Garnett, T. 2016. Plates, pyramids, planets. Developments in national healthy and sustainable dietary guidelines: a state of play assessment. FAO/FCRN (available at: www.fao.org/3/a-i5640e.pdf).
Guenther, P. M., Kirkpatrick, S. I., Reedy, J., Krebs-Smith, S. M., Buckman, D. W., Dodd, K. W., Casavale, K. O. & Carroll, R. J. 2014. The Healthy Eating Index-2010 is a valid and reliable measure of diet quality according to the 2010 Dietary Guidelines for Americans. Jnl of Nutrn, jn-113.
4. INFLUENCING FOOD ENVIRONMENTS FOR HEALTHY DIETS THROUGH FOOD-BASED DIETARY GUIDELINES
131
Johnson, J. A., Runge, C. F., Senauer, B., Foley, J., & Polasky, S. 2014. Global agriculture and carbon trade-offs. Proc. of Nat. Acad. of Sciences, 111(34), 12342-12347.
Monteiro, C.A., Cannon, G., Moubarac, J.C., Martins, A.P.B., Martins, C.A., Garzillo, J., Canella, D.S., Baraldi, L.G., Barciotte, M., da Costa Louzada, M.L. & Levy, R.B. 2015. Dietary guidelines to nourish humanity and the planet in the twenty-first century. A blueprint from Brazil. Pub Health Nutrn, 18(13), 2311-2322.
Smith, P., Bustamante, M., Ahammad, H., Clark, H., Dong, H., Elsiddig, E.A., Haberl, H., Harper, R., House, J., Jafari, M. & Masera, O. 2014. Agriculture, forestry and other land use (AFOLU). In Climate change 2014: mitigation of climate change. Contribution of Working Group III to the Fifth Assessment Report of the Intergovernmental Panel on Climate Change. Cambridge.Cambridge University Press.
Swinburn, B., Dominick, C., & Vandevijvere, S. 2014. Benchmarking food environments: experts’ assessments of policy gaps and priorities for the New Zealand Government. Auckland. University of Auckland.
Tulchinsky T.H. 2010. Micronutrient deficiency conditions: global health issues. Pub. Health Reviews; 32:243-255.
WHO. 1998. Preparation and use of food-based dietary guidelines: report of a joint FAO/WHO consultation (No. 880). WHO. Geneva.
WHO. 2015. World health statistics 2015. WHO. Geneva.
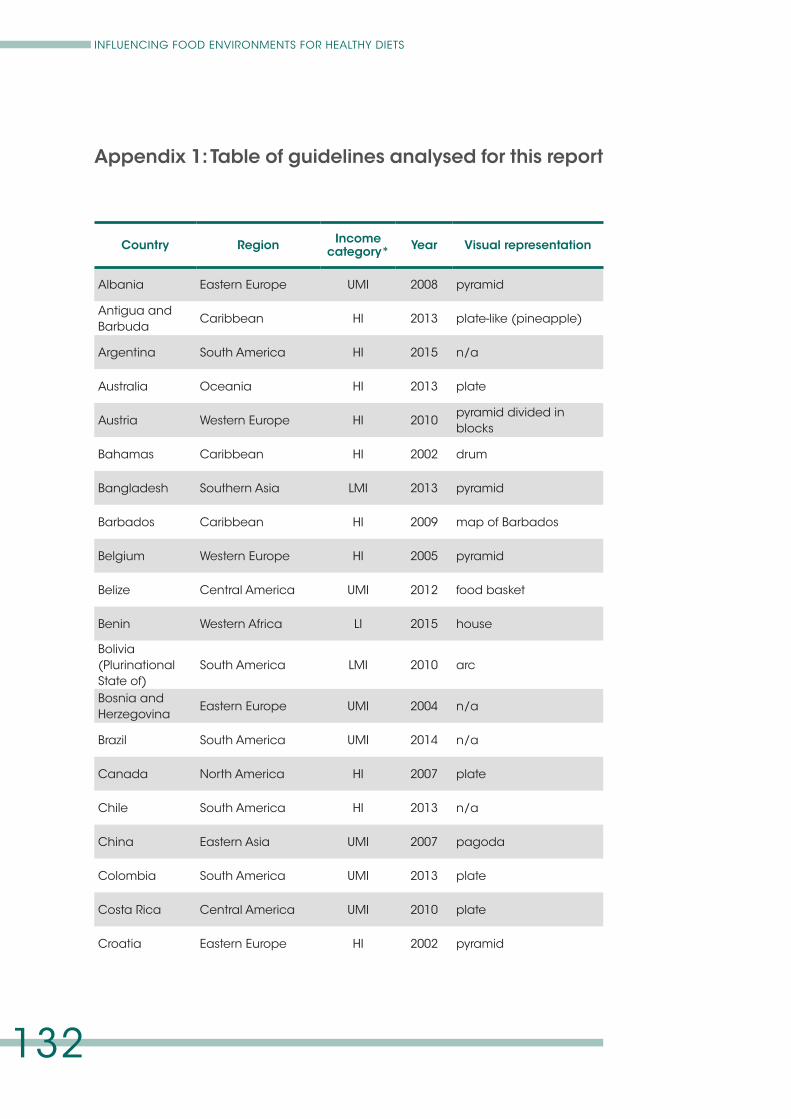
INFLUENCING FOOD ENVIRONMENTS FOR HEALTHY DIETS
132
Appendix 1: Table of guidelines analysed for this report
Country Region Income category* Year Visual representation
Albania Eastern Europe UMI 2008 pyramid
Antigua and Barbuda
Caribbean HI 2013 plate-like (pineapple)
Argentina South America HI 2015 n/a
Australia Oceania HI 2013 plate
Austria Western Europe HI 2010pyramid divided in blocks
Bahamas Caribbean HI 2002 drum
Bangladesh Southern Asia LMI 2013 pyramid
Barbados Caribbean HI 2009 map of Barbados
Belgium Western Europe HI 2005 pyramid
Belize Central America UMI 2012 food basket
Benin Western Africa LI 2015 house
Bolivia (Plurinational State of)
South America LMI 2010 arc
Bosnia and Herzegovina
Eastern Europe UMI 2004 n/a
Brazil South America UMI 2014 n/a
Canada North America HI 2007 plate
Chile South America HI 2013 n/a
China Eastern Asia UMI 2007 pagoda
Colombia South America UMI 2013 plate
Costa Rica Central America UMI 2010 plate
Croatia Eastern Europe HI 2002 pyramid
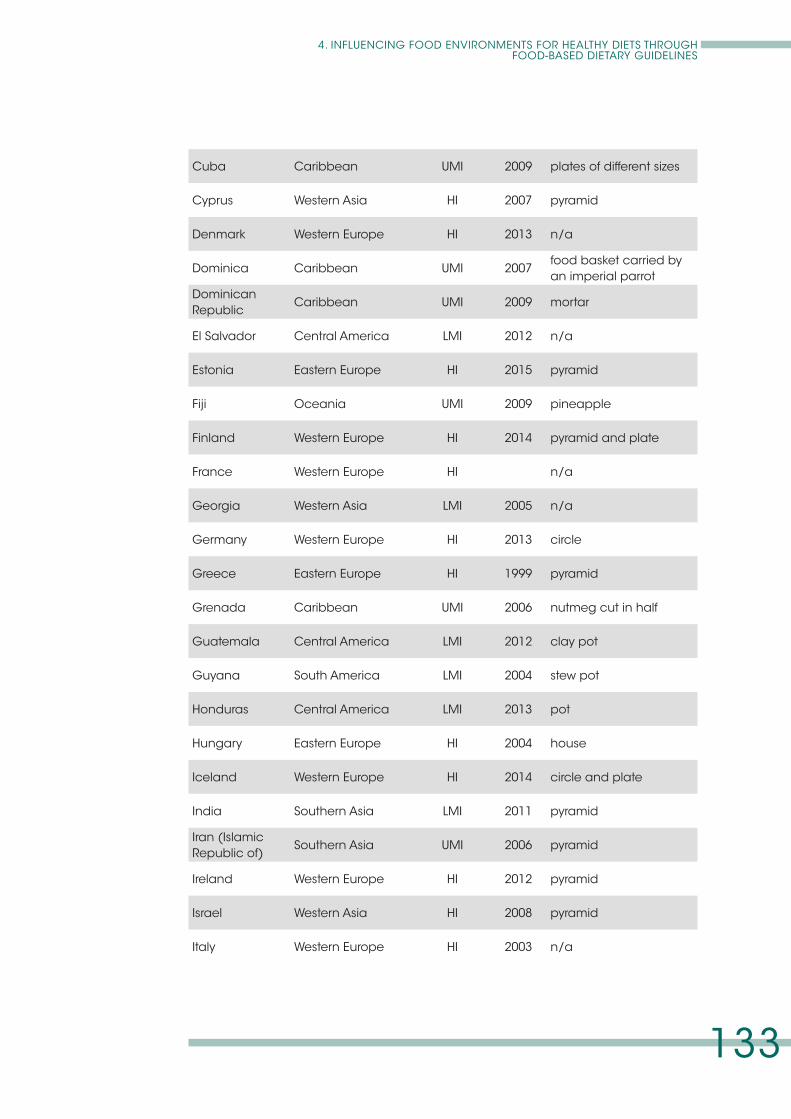
4. INFLUENCING FOOD ENVIRONMENTS FOR HEALTHY DIETS THROUGH FOOD-BASED DIETARY GUIDELINES
133
Cuba Caribbean UMI 2009 plates of different sizes
Cyprus Western Asia HI 2007 pyramid
Denmark Western Europe HI 2013 n/a
Dominica Caribbean UMI 2007food basket carried by an imperial parrot
Dominican Republic
Caribbean UMI 2009 mortar
El Salvador Central America LMI 2012 n/a
Estonia Eastern Europe HI 2015 pyramid
Fiji Oceania UMI 2009 pineapple
Finland Western Europe HI 2014 pyramid and plate
France Western Europe HI n/a
Georgia Western Asia LMI 2005 n/a
Germany Western Europe HI 2013 circle
Greece Eastern Europe HI 1999 pyramid
Grenada Caribbean UMI 2006 nutmeg cut in half
Guatemala Central America LMI 2012 clay pot
Guyana South America LMI 2004 stew pot
Honduras Central America LMI 2013 pot
Hungary Eastern Europe HI 2004 house
Iceland Western Europe HI 2014 circle and plate
India Southern Asia LMI 2011 pyramid
Iran (Islamic Republic of)
Southern Asia UMI 2006 pyramid
Ireland Western Europe HI 2012 pyramid
Israel Western Asia HI 2008 pyramid
Italy Western Europe HI 2003 n/a
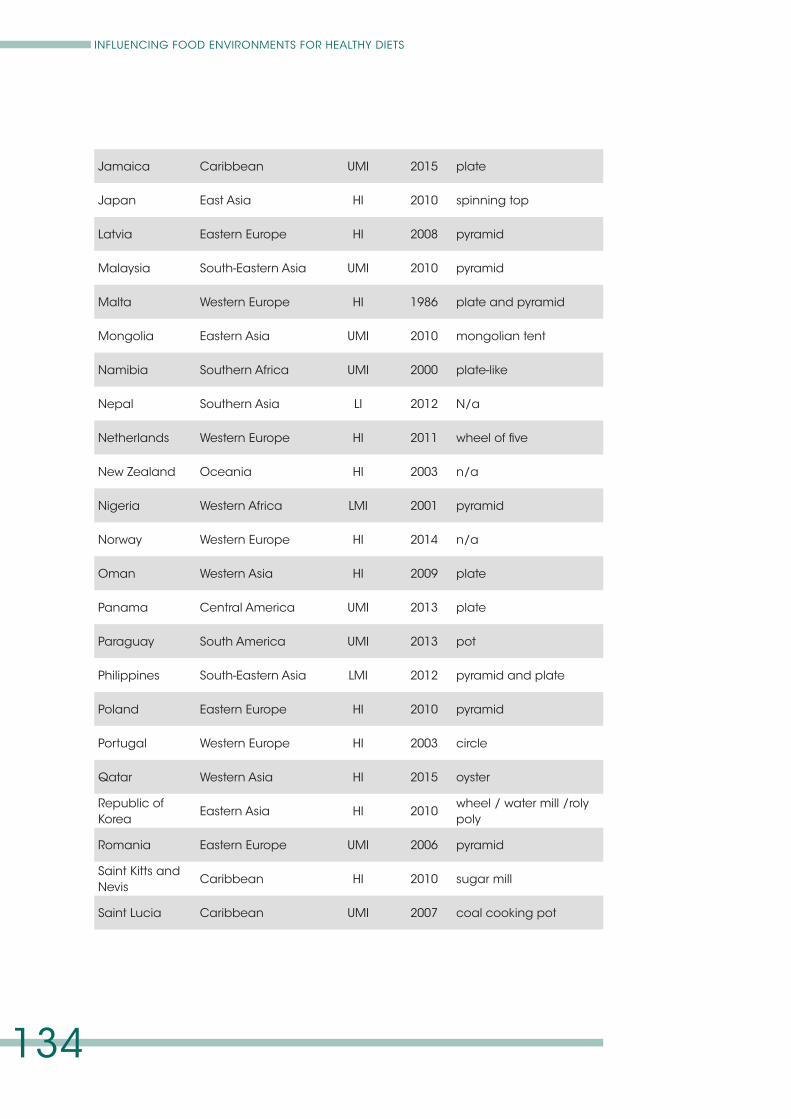
INFLUENCING FOOD ENVIRONMENTS FOR HEALTHY DIETS
134
Jamaica Caribbean UMI 2015 plate
Japan East Asia HI 2010 spinning top
Latvia Eastern Europe HI 2008 pyramid
Malaysia South-Eastern Asia UMI 2010 pyramid
Malta Western Europe HI 1986 plate and pyramid
Mongolia Eastern Asia UMI 2010 mongolian tent
Namibia Southern Africa UMI 2000 plate-like
Nepal Southern Asia LI 2012 N/a
Netherlands Western Europe HI 2011 wheel of five
New Zealand Oceania HI 2003 n/a
Nigeria Western Africa LMI 2001 pyramid
Norway Western Europe HI 2014 n/a
Oman Western Asia HI 2009 plate
Panama Central America UMI 2013 plate
Paraguay South America UMI 2013 pot
Philippines South-Eastern Asia LMI 2012 pyramid and plate
Poland Eastern Europe HI 2010 pyramid
Portugal Western Europe HI 2003 circle
Qatar Western Asia HI 2015 oyster
Republic of Korea
Eastern Asia HI 2010wheel / water mill /roly poly
Romania Eastern Europe UMI 2006 pyramid
Saint Kitts and Nevis
Caribbean HI 2010 sugar mill
Saint Lucia Caribbean UMI 2007 coal cooking pot
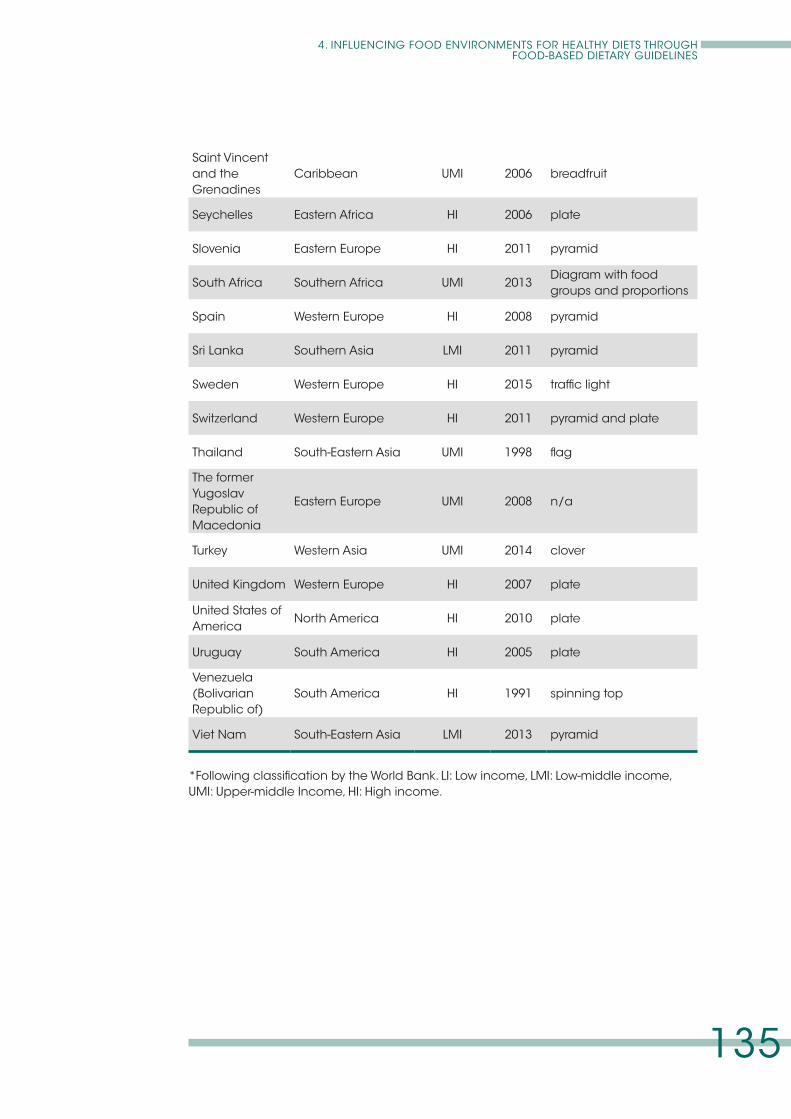
4. INFLUENCING FOOD ENVIRONMENTS FOR HEALTHY DIETS THROUGH FOOD-BASED DIETARY GUIDELINES
135
*Following classification by the World Bank. LI: Low income, LMI: Low-middle income, UMI: Upper-middle Income, HI: High income.
Saint Vincent and the Grenadines
Caribbean UMI 2006 breadfruit
Seychelles Eastern Africa HI 2006 plate
Slovenia Eastern Europe HI 2011 pyramid
South Africa Southern Africa UMI 2013Diagram with food groups and proportions
Spain Western Europe HI 2008 pyramid
Sri Lanka Southern Asia LMI 2011 pyramid
Sweden Western Europe HI 2015 traffic light
Switzerland Western Europe HI 2011 pyramid and plate
Thailand South-Eastern Asia UMI 1998 flag
The former Yugoslav Republic of Macedonia
Eastern Europe UMI 2008 n/a
Turkey Western Asia UMI 2014 clover
United Kingdom Western Europe HI 2007 plate
United States of America
North America HI 2010 plate
Uruguay South America HI 2005 plate
Venezuela (Bolivarian Republic of)
South America HI 1991 spinning top
Viet Nam South-Eastern Asia LMI 2013 pyramid


SUMMARY OF THE 10 COMMITMENTS TO ACTION IN THE ROME DECLARATION ON NUTRITION
1. Eradicate hunger and prevent all forms of malnutrition worldwide
2. Increase investments for effective interventions and actions to improve people’s diets and nutrition
3. Enhance sustainable food systems by developing coherent public policies from production to consumption and across relevant sectors
4. Raise the profile of nutrition within relevant national strategies, policies, action plans and programmes and align national resources accordingly
5. Improve nutrition by strengthening human and institutional capacities through relevant research and development, innovation and appropriate technology transfer
6. Strengthen and facilitate contributions and action by all stakeholders and promote collaboration within and across countries
7. Develop policies, programmes and initiatives for ensuring healthy diets throughout the life course
8. Empower people and create an enabling environment for making informed choices about food products for healthy dietary practices and appropriate infant and young child feeding practices through improved health and nutrition information and education
9. Implement the commitments of the Rome Declaration on Nutrition through the Framework for Action
10. Give due consideration to integrating the vision and commitments of the Rome Declaration on Nutrition into the post-2015 development agenda process including a possible related global goal
I6484EN/1/11.16