INFLUENCE OF WINTER ANNUAL COVER CROPS AND INSECT ...
62
A. Whalen, A. Catchot, J. Gore, D. Cook, T. Irby, R. Brown, and B. Barton INFLUENCE OF WINTER ANNUAL COVER CROPS AND INSECT MANAGEMENT STRATEGIES ON INSECT PESTS OF MISSISSIPPI SOYBEAN 1 2
Transcript of INFLUENCE OF WINTER ANNUAL COVER CROPS AND INSECT ...

A. Whalen, A. Catchot, J. Gore,
D. Cook, T. Irby, R. Brown, and B. Barton
INFLUENCE OF WINTER ANNUAL COVER
CROPS AND INSECT MANAGEMENT
STRATEGIES ON INSECT PESTS OF
MISSISSIPPI SOYBEAN
1 2

Cover Crops
• Crops grown to “cover” the ground when regular crops are not occupying fields.
• Most planted before winter months and terminated before planting.
• In the Midsouth, the major categories of winter cover crops to consider are either grasses, legumes, or a mixture of the two.
• Provide many agronomic benefits as well as habitat for wildlife, including pollinators, and improved water quality.
• Less than 2% of cropland in the Mississippi River Basin is planted in cover crops, but that percentage is increasing –National Wildlife Federation

Agronomic Benefits
4
5
6

Cover Crops and Pests
• Cover crops of wheat, rye, and alfalfa and residue
cover increased seedcorn maggot and slug
infestations in Ohio soybean (Hammond and Stinner
1987).
• Bean leaf beetle and Japanese beetle populations
increased with the use of a rye cover crop before
soybean in Ohio (Smith et al 1988).
• Pea leaf weevil outbreak in Mississippi Delta soybean
seed treatment trials and Arkansas soybean fields in
2014 following hairy vetch and Austrian winter peas.

Pea Leaf Weevil (Sitona lineatus)
• Defoliating pest associated with soybean following a winter legume cover crop.
• Adult beetles measure 5 mm. long and are gray-brown in color.
• Adults feed on leaves of legumes; larvae feed on nodules.
• Can be controlled with labeled insecticides but continue to emerge from cover crop residue resulting in multiple applications.
• Seed treatments can help prevent total crop loss.

7 8
Pea Leaf Weevil Soybean Damage

9 10
11

Pea Leaf Weevil in Arkansas

Early Season Pests of Soybean
• Soil Insects – White grubs, wireworms, lesser
cornstalk borer, etc.
• Three-cornered alfalfa hopper
• Bean Leaf Beetle
• Thrips
12
13 14


Objective 1
Determine the efficacy of various chemical and cultural
control practices on insect pests of soybean following
cover crops

Materials and MethodsCover crop treatments:
• Cover crop blend of tillage radish, Austrian winter pea\hairy vetch, and triticale
• Naturally occurring winter vegetation
Chemical and cultural control treatments:
Treatment Application Description
Untreated Fungicide only treated seed
Karate Z Termination
Spray
Foliar application of Karate Z (lambda-cyhalothrin) during
cover crop termination
Neonic SDTRT Neonicotinoid seed treatment on soybean seed at planting
Karate Z + Neonic
SDTRT
Foliar application during cover crop termination
+ seed treatment on soybean seed at planting
Capture InfurrowIn-furrow insecticide spray application of Capture
(bifenthrin) at planting
Higher Plant Pop. Increased seeding rate of 165,000 plants/acre

Materials and Methods
• Planted into 8 row plots measuring 7.72 m wide by 15.24 m long.
• 12 treatment combinations replicated 4 times in two Mississippi locations in 2016 and 2017 growing seasons.
• Cover crops terminated four weeks prior to planting with a herbicide application.
• Soybean planted early May.
• Visually scouted for bean leaf beetle, three cornered alfalfa hopper and pea leaf weevil and defoliation damage at V3.
• Plots were harvested and yields recorded.

Mean Total Insect Pest Visual Counts for
each Control Method
A AB AB BC C C0
0.5
1
1.5
2
2.5
3
3.5
4
4.5
Untreated Karate® Z at
Termination
Increased Plant
Pop.
Capture® LFR®
in-Furrow
Neonic SDTRT Karate® Z +
Neonic SDTRT
Mea
n T
ota
l In
sect
Pes
ts p
er 1
m o
f R
ow
P < 0.0001

Mean Defoliation Damage for each
Control Method
A B B B B B0
1
2
3
4
5
6
7
8
9
Untreated Karate® Z at
Termination
Increased Plant
Pop.
Capture® LFR®
in-Furrow
Neonic SDTRT Karate® Z +
Neonic SDTRT
Mea
n P
erce
nt
Def
oli
ati
on
P = 0.0119

Mean Soybean Yield for each
Control Method
C C BC ABC A AB0
500
1000
1500
2000
2500
3000
Untreated Karate® Z at
Termination
Increased Plant
Pop.
Capture® LFR®
in-Furrow
Neonic SDTRT Karate® Z +
Neonic SDTRT
Mea
n S
oy
bea
n Y
ield
(k
g h
a-1
)
P = 0.0080

Conclusion
• Significantly less insect pests observed in neonicotinoid seed treatment plots than the untreated control plots.
• Significantly less defoliation damage observed in all control methods than in all untreated control plots.
• No significant differences observed between previous cover types with regards to insect pests totals and defoliation damage.
• No significant interactions between previous cover type and control methods with regards to soybean yield.
• No significant difference in yields from natural winter vegetation plots and cover crop plots.
• The neonicotinoid seed treatment increased soybean yield regardless of previous cover type.

Objective 2
Determine how neonicotinoid seed treatments and
termination date of cover crops affects insect damage
in soybean following cover crops

Materials and Methods
Cover crop treatments:• Cover crop blend
• Winter wheat
• Natural winter weeds
Soybean seed treatments:• Neonicotinoid seed
treatment
• Fungicide only seed treatment
Burndown timing treatments:
Treatment Application Description Burndown Window Planting Window
Early Burndown 6 weeks before planting March 28 - April 1 May 9-13
Optimal Burndown 4 weeks before planting April 11-15 May 9-13
Late Burndown 2 weeks before planting April 25-29 May 9-13

Materials and Methods
• Planted into 4 row plots measuring 3.86 m wide by 15.24 m long.
• 18 treatment combinations replicated 4 times in two Mississippi locations.
• Cover crops will be terminated during the designated termination windows with a herbicide application.
• Asgrow 4835 soybean seed planted in early May.
• Soybean plots were treated at threshold for insect pests once soybean plants reached reproductive growth stages.
• Visually scouted for bean leaf beetle, three cornered alfalfa hopper and pea leaf weevil and defoliation damage at V3.

A
B
0
0.5
1
1.5
2
2.5
3
Untreated Neonicotinoid
Mea
n D
efo
lia
tion
Per
cen
tag
e
Mean Defoliation Damage for each
Seed Treatment
P < 0.0001

Mean Soybean Yield for each
Termination Timing
A A A0
500
1000
1500
2000
2500
Early Optimal Late
Mea
n S
oy
bea
n Y
ield
(k
g h
a-1
)
P = 0.38

B B A0
500
1000
1500
2000
2500
3000
Natural Winter Vegetation Winter Wheat Cover Crop Blend
Mea
n S
oy
bea
n Y
ield
(k
g h
a-1
)
Mean Soybean Yield for each
Previous Cover Type
P < 0.0001

B A0
500
1000
1500
2000
2500
Untreated Neonicotinoid
Mea
n S
oy
bea
n Y
ield
(k
g h
a-1
)
Mean Soybean Yield for each
Seed Treatment
P = 0.02

Conclusion
• No significant differences between termination timings for observed pests, defoliation damage, or yield.
• Significantly less defoliation damage in neonicotinoid seed treatment plots than the untreated control plots.
• Soybean planted behind the cover crop blend had a significantly higher yield than soybean planted behind winter wheat and natural winter vegetation.
• Neonicotinoid seed treatments did provide a significant yield increase.

Objective 3
Determine the agronomic and
pest effects of various cover
crop treatments planted
before soybean

Materials and Methods
• Planted into 8 row plots measuring 7.72 m wide by 15.24 m long.
• 6 previous cover treatments 4 times in two Mississippi locations in 2016 and 2017 growing seasons.
• Cover crops terminated four weeks prior to planting with a herbicide application.
• Soybean planted early May.
• Visually scouted for bean leaf beetle, three cornered alfalfa hopper and pea leaf weevil and defoliation damage at V3.
• Plots were harvested and yields recorded.

Materials and Methods
• Cover crop treatments:
• Winter wheat
• Triticale
• Austrian winter pea
• Hairy vetch
• A blend of tillage radish, Austrian
winter pea/hairy vetch, and
triticale
• Naturally occurring winter weeds

B AB A A B AB0
1
2
3
4
5
6
7
Natural Winter
Vegetation
Blended Cover
Crop
Austrian Winter
Peas
Hairy Vetch Winter Wheat Triticale
Mea
n T
ota
l In
sect
s p
er 1
m o
f R
ow
Mean Total Insect Pest Visual Counts for
each Previous Cover Type
P = 0.02

C BC BA
C C0
10
20
30
40
50
Natural Winter
Vegetation
Blended Cover
Crop
Austrian Winter
Peas
Hairy Vetch Winter Wheat Triticale
Mea
n D
efo
lia
tion
Per
cen
tag
e
Mean Defoliation Damage for each
Previous Cover Type
P < 0.0001

A B B B B B0
500
1000
1500
2000
2500
3000
Natural Winter
Vegetation
Blended Cover
Crop
Austrian Winter
Peas
Hairy Vetch Winter Wheat Triticale
Mea
n S
oy
bea
n Y
ield
(k
g h
a-1
)
Mean Soybean Yield for each
Previous Cover Type
P < 0.0001

Conclusion
• Previous plantings of legume cover crops attracted
more insect pests to the soybean planted behind
them during early stages.
• These pests caused significant defoliation damage
compared to soybean planted behind no cover crop.
• Soybean planted behind no cover crop yielded higher
than soybean planted behind all cover crops.

Objective 4
Determine how various cover crop treatments affect
arthropod diversity in Mississippi soybean

Materials and Methods
• Asgrow 4835 soybean seed was planted into 8 row plots measuring 7.72 m wide by 15.24 m long.
• 6 treatments replicated 4 times in two Mississippi locations.
• Cover crops were terminated four weeks before planting with a herbicide application.
• Soybean seed was only treated with a fungicide seed treatment.
• Soybean plots were treated at threshold for insect pests once soybean plants reached reproductive growth stages.

Materials and Methods
• Cover crop treatments:
• Winter wheat
• Triticale
• Austrian winter pea
• Hairy vetch
• A blend of tillage radish, Austrian
winter pea/hairy vetch, and
triticale
• Naturally occurring winter weeds

Materials and Methods• Both cover crops and soybean were
sampled for arthropod diversity.
• Sampling methods included:• Sweeping cover crops before termination (4
siteyears)
• Sweeping soybean plots starting at R1 (4 siteyears)
• Pit-fall trapping soybean plots (3 siteyears)
• All insects and spiders captured were identified to family.
• Capture data was used to determine the mean Shannon Entropy Index and Family Richness of each treatment combination.

Pitfall Trap Results for
Cover Crop Study • 6 Cover Treatments
• 2 Growth Stages: VC & R1
• Total of 14,504 insects and spiders collected from all
plots at all locations over both years.
• Insecta: 10,875 (74.98%)
• Araneae: 3,629 (25.02%)
• 9 orders, 46 families collected.

Major Families Collected over all Cover Types
(>1% of the Overall Total Catch)
Insect Families Number % of Total Catch
Formicidae 3,997 27.56%
Gryllidae 1,228 8.47%
Staphylinidae 1,015 7.00%
Carabidae 1,008 6.95%
Anthicidae 611 4.21%
Phoridae 595 4.10%
Latridiidae 308 2.12%
Cydnidae 270 1.86%
Elateridae 235 1.62%
Acrididae 232 1.60%
Sciaridae 199 1.37%
Nitidulidae 158 1.09%
Anisolabididae 158 1.09%
Araneae Familes Number % of Total Catch
Lycosidae 2,757 19.01%
Linyphiidae 860 5.93%
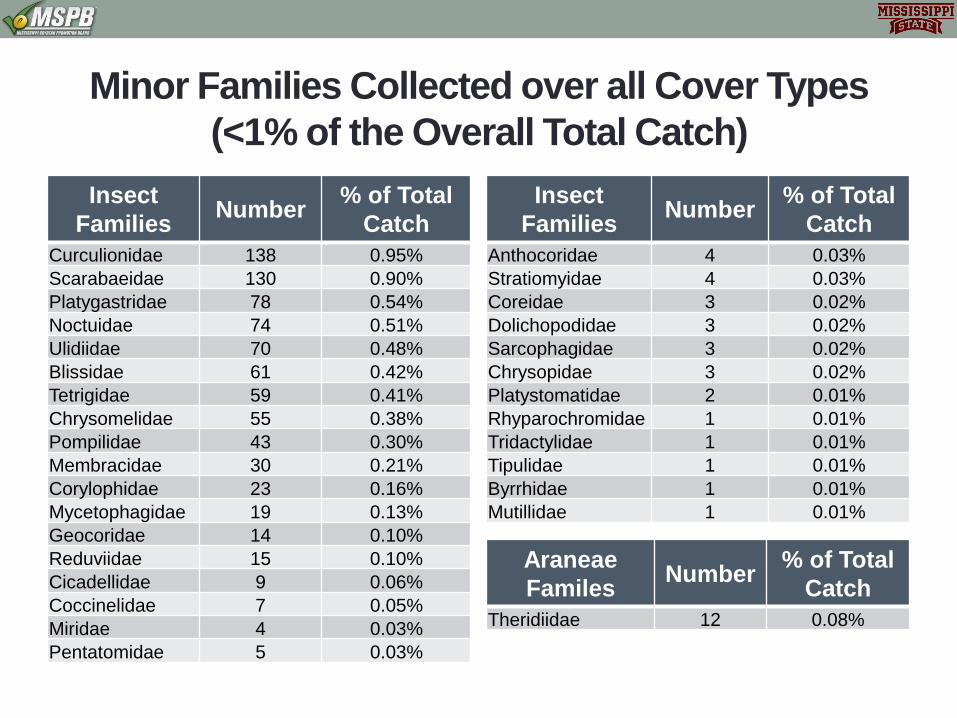
Minor Families Collected over all Cover Types
(<1% of the Overall Total Catch)
Insect
FamiliesNumber
% of Total
Catch
Curculionidae 138 0.95%
Scarabaeidae 130 0.90%
Platygastridae 78 0.54%
Noctuidae 74 0.51%
Ulidiidae 70 0.48%
Blissidae 61 0.42%
Tetrigidae 59 0.41%
Chrysomelidae 55 0.38%
Pompilidae 43 0.30%
Membracidae 30 0.21%
Corylophidae 23 0.16%
Mycetophagidae 19 0.13%
Geocoridae 14 0.10%
Reduviidae 15 0.10%
Cicadellidae 9 0.06%
Coccinelidae 7 0.05%
Miridae 4 0.03%
Pentatomidae 5 0.03%
Insect
FamiliesNumber
% of Total
Catch
Anthocoridae 4 0.03%
Stratiomyidae 4 0.03%
Coreidae 3 0.02%
Dolichopodidae 3 0.02%
Sarcophagidae 3 0.02%
Chrysopidae 3 0.02%
Platystomatidae 2 0.01%
Rhyparochromidae 1 0.01%
Tridactylidae 1 0.01%
Tipulidae 1 0.01%
Byrrhidae 1 0.01%
Mutillidae 1 0.01%
Araneae
FamilesNumber
% of Total
Catch
Theridiidae 12 0.08%

Mean ENS for the Epigeal Community of each
Previous Cover Type and Soybean Growth Stage
BCDE BC A B CDEF BCF DEF BCD EF BCDE BCD0
2
4
6
8
10
12
Natural Winter
Vegetation
Cover Crop
Blend
Austiran Winter
Pea
Hairy Vetch Winter Wheat Triticale
Mea
n S
ha
nn
on
En
tro
py
In
dex
VC R1
P = 0.02

Mean Family Richness for the Epigeal
Community at each Soybean Growth Stage
A B0
2
4
6
8
10
12
14
16
VC R1
Mea
n F
am
ily
Ric
hn
ess
P < 0.0001

Mean Total of Predatory Arthropods for the Epigeal
Community of each Soybean Growth Stage
A B0
10
20
30
40
50
60
70
80
90
VC R1
Mea
n T
ota
l o
f P
red
ato
ry A
rth
rop
od
s
P < 0.0001

Mean Total Herbivorous Arthropods of the Epigeal
Community of each Soybean Growth Stage
A B0
1
2
3
4
5
6
7
8
VC R1
Mea
n T
ota
l o
f H
erb
ivo
rou
s A
rth
rop
od
s
P < 0.0001

Sweep Net Results for
Cover Crop Study • 6 Cover Treatments
• 2 Growth Stages: VC & R1
• Total of 4,621 insects and spiders collected from all
plots at all locations over both years.
• Insecta: 4,513 (97.66%)
• Araneae: 108 (2.34%)
• 8 orders, 38 families collected.

Major Families Collected over all Cover Types
(>1% of the Overall Total Catch)
Insect Families Number % of Total Catch
Membracidae 1993 43.13%
Miridae 621 13.44%
Chrysomelidae 463 10.02%
Acrididae 352 7.62%
Coccinellidae 167 3.61%
Platystomatidae 129 2.79%
Tephritidae 114 2.47%
Cicadellidae 88 1.90%
Elateridae 80 1.73%
Pentatomidae 72 1.56%
Geocoridae 62 1.34%
Tetrigidae 62 1.34%
Syrphidae 56 1.21%
Curculionidae 51 1.10%
Araneae Familes Number % of Total Catch
Oxyopidae 58 1.26%

Minor Families Collected over all Cover Types
(<1% of the Overall Total Catch)
Insect
FamiliesNumber
% of Total
Catch
Reduviidae 29 0.63%
Thyreocoridae 26 0.56%
Nabidae 23 0.50%
Plataspidae 22 0.48%
Dolichopodidae 18 0.39%
Carabidae 17 0.37%
Coreidae 12 0.26%
Chrysopidae 10 0.22%
Gryllidae 8 0.17%
Erotylidae 7 0.15%
Cerambycidae 7 0.15%
Sciomyzidae 7 0.15%
Apidae 6 0.13%
Noctuidae 4 0.09%
Berytidae 2 0.04%
Stratiomyidae 2 0.04%
Ichneumonidae 2 0.04%
Chloropidae 1 0.02%
Araneae
FamilesNumber
% of Total
Catch
Theridiidae 21 0.45%
Tetragnathidae 11 0.24%
Salticidae 7 0.15%
Thomisidae 6 0.13%
Clubionidae 5 0.11%

Soybean Growth Stage Previous Cover Type
Mean Total of
Herbivorous
Arthropods
SEM
Before Cover Crop
Termination
Natural Winter Vegetation 2.52de 0.19
Blended Cover Crop 3.84a 0.34
Austrian Winter Peas 3.34ab 0.37
Hairy Vetch 3.81a 0.26
Winter Wheat 3.84a 0.25
Triticale 3.31ab 0.22
R1
Natural Winter Vegetation 2.66bcde 0.24
Blended Cover Crop 2.80bcde 0.13
Austrian Winter Peas 2.88bcde 0.24
Hairy Vetch 2.52de 0.18
Winter Wheat 2.50e 0.19
Triticale 2.31e 0.15
R2
Natural Winter Vegetation 2.75bcde 0.30
Blended Cover Crop 2.58dec 0.22
Austrian Winter Peas 2.74bcde 0.30
Hairy Vetch 2.69bcde 0.23
Winter Wheat 2.70bcde 0.20
Triticale 2.80bcde 0.27
R3
Natural Winter Vegetation 3.20abcd 0.38
Blended Cover Crop 3.23abc 0.35
Austrian Winter Peas 2.66bcde 0.26
Hairy Vetch 2.87bcde 0.30
Winter Wheat 2.72bcde 0.24
Triticale 2.69bcde 0.31
Mean ENS of the Foliar Community for each Previous Cover Type at each Soybean Growth Stage
P = 0.05

Soybean Growth Stage Previous Cover Type
Mean Total of
Herbivorous
Arthropods
SEM
Before Cover Crop
Termination
Natural Winter Vegetation 2.94h 0.19
Blended Cover Crop 4.81ab 0.39
Austrian Winter Peas 4.31bcde 0.51
Hairy Vetch 5.38a 0.41
Winter Wheat 4.75abc 0.31
Triticale 3.81defgh 0.23
R1
Natural Winter Vegetation 3.38fgh 0.29
Blended Cover Crop 3.63defgh 0.15
Austrian Winter Peas 3.69defgh 0.24
Hairy Vetch 3.44efgh 0.24
Winter Wheat 3.19gh 0.21
Triticale 2.94h 0.23
R2
Natural Winter Vegetation 3.69defgh 0.52
Blended Cover Crop 3.31fgh 0.34
Austrian Winter Peas 3.63defgh 0.40
Hairy Vetch 3.63defgh 0.35
Winter Wheat 3.69defgh 0.30
Triticale 3.75defgh 0.42
R3
Natural Winter Vegetation 4.19bcdef 0.61
Blended Cover Crop 4.44bcd 0.56
Austrian Winter Peas 4.13bcdef 0.57
Hairy Vetch 4.00bcdefg 0.49
Winter Wheat 3.94bcdefg 0.47
Triticale 3.88cdefg 0.56
Mean Family Richness of the Foliar Community for each Previous Cover Type at each Soybean Growth Stage
P = 0.01

Mean Total of Predatory Arthropods for the
Foliar Community of each Growth Stage
A B B B0
0.5
1
1.5
2
2.5
Cover Crop R1 R2 R3
Mea
n T
ota
l P
red
ato
ry A
rth
rop
od
s
P < 0.0001

Soybean Growth Stage Previous Cover Type
Mean Total of
Herbivorous
Arthropods
SEM
Before Cover Crop
Termination
Natural Winter Vegetation 5.50d 1.20
Blended Cover Crop 11.50bc 2.06
Austrian Winter Peas 11.25bc 2.31
Hairy Vetch 18.50a 2.93
Winter Wheat 7.94cd 1.54
Triticale 5.13d 0.99
R1
Natural Winter Vegetation 8.31cd 1.09
Blended Cover Crop 10.38c 2.18
Austrian Winter Peas 11.31bc 1.38
Hairy Vetch 9.25cd 1.27
Winter Wheat 11.19bc 1.98
Triticale 7.50cd 1.52
R2
Natural Winter Vegetation 8.38cd 1.75
Blended Cover Crop 8.44cd 1.49
Austrian Winter Peas 8.19cd 1.74
Hairy Vetch 8.00cd 1.09
Winter Wheat 8.31cd 1.22
Triticale 8.88cd 1.61
R3
Natural Winter Vegetation 9.44cd 2.15
Blended Cover Crop 11.50bc 2.32
Austrian Winter Peas 14.94ab 5.00
Hairy Vetch 9.06cd 1.85
Winter Wheat 11.69bc 2.62
Triticale 10.25c 2.17
Mean Total Herbivorous Arthropods of the Foliar Community in each Previous Cover Type
P < 0.0001

Conclusions
• The epigeal communities of soybean planted behind legume cover crops were more diverse at the earlier growth stage than soybean behind other cover types at both growth stages.
• Time after termination was important for mean family richness and for predatory and herbivorous arthropods within the epigeal community.
• The foliar communities of hairy vetch and winter wheat cover crops were significantly more diverse than the soybean planted behind them.
• When soybeans become reproductively mature, previous cover type did not effect diversity of the foliar community.

Materials and Methods
• Plots from Objective 1 study were used to measure
diversity of arthropods in neonicotinoid treated and
untreated soybeans following a blended cover crop or
winter weeds.
• Asgrow 4835 soybean seed was planted into 8 row plots
measuring 7.72 m wide by 15.24 m long.
• 4 treatment combinations replicated 4 times in two
Mississippi locations.
• Soybean plots were treated at threshold for insect pests
once soybean plants reached reproductive growth stages.

Major Families Collected over all Cover Types
and Treatments (>1% of the Overall Total Catch)
Insect Families Number % of Total Catch
Formicidae 2,826 33.64%
Gryllidae 721 8.58%
Staphylinidae 506 6.02%
Carabidae 502 5.98%
Anthicidae 454 5.40%
Phoridae 319 3.80%
Latridiidae 130 1.55%
Nitidulidae 115 1.37%
Sciaridae 99 1.18%
Cydnidae 94 1.12%
Araneae Families Number % of Total Catch
Lycosidae 1,588 18.90%
Linyphiidae 492 5.86%

Minor Families Collected over all Cover Types
and Treatments (<1% of the Overall Total Catch)
Insect
FamiliesNumber
% of Total
Catch
Acrididae 81 0.96%
Elateridae 63 0.75%
Curculionidae 57 0.68%
Anisolabididae 56 0.67%
Ulidiidae 48 0.57%
Scarabaeidae 44 0.52%
Blissidae 34 0.40%
Platygastridae 32 0.38%
Chrysomelidae 26 0.31%
Pompilidae 25 0.30%
Membracidae 13 0.15%
Tetrigidae 11 0.13%
Corylophidae 10 0.12%
Geocoridae 10 0.12%
Mycetophagidae 9 0.11%
Reduviidae 6 0.07%
Noctuidae 5 0.06%
Cicadellidae 4 0.05%
Insect
FamiliesNumber
% of Total
Catch
Chrysopidae 3 0.04%
Pentatomidae 2 0.02%
Coreidae 2 0.02%
Coccinelidae 1 0.01%
Byrrhidae 1 0.01%
Miridae 1 0.01%
Anthocoridae 1 0.01%
Tridactylidae 1 0.01%
Dolichopodidae 1 0.01%
Tipulidae 1 0.01%
Ichneumonidae 1 0.01%
Araneae
FamiliesNumber
% of Total
Catch
Theridiidae 5 0.06%

Mean ENS for the Epigeal Community of each
Soybean Growth Stage in the Second Field Trial
A B0
1
2
3
4
5
6
7
8
VC R1
Mea
n S
ha
nn
on
En
tro
py
In
dex
P < 0.0001

Mean ENS for the Epigeal Community of Soybean Treated
with each Seed Treatment in the Second Field Trial
A B0
1
2
3
4
5
6
7
8
Fungicide Only Fungicide + Neonicotinoid
Mea
n S
ha
nn
on
En
tro
py
In
dex
P = 0.03
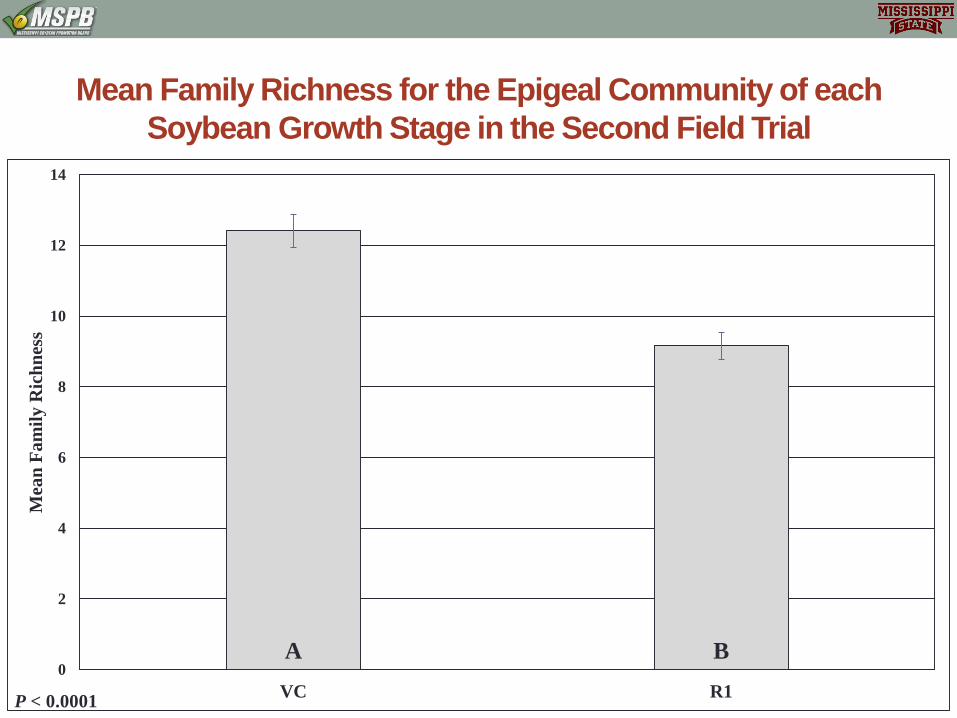
Mean Family Richness for the Epigeal Community of each
Soybean Growth Stage in the Second Field Trial
A B0
2
4
6
8
10
12
14
VC R1
Mea
n F
am
ily
Ric
hn
ess
P < 0.0001

Mean Family Richness for the Epigeal Community of
Soybean Treated with each Seed Treatment
in the Second Field Trial
A B0
2
4
6
8
10
12
14
Fungicide Only Fungicide + Neonicotinoid
Mea
n F
am
ily
Ric
hn
ess
P < 0.0001

Mean Total of Herbivorous Arthropods within the
Epigeal Community of Soybean Treated with each
Seed Treatment in the Second Field Trial
A B0
0.5
1
1.5
2
2.5
3
3.5
4
4.5
Fungicide Only Fungicide + Neonicotinoid
Mea
n T
ota
l o
f H
erb
ivo
rou
s A
rth
rop
od
s
P < 0.0001

Mean Total of Predatory Arthropods within the
Epigeal Community of Soybean Treated with each
Seed Treatment in the Second Field Trial
A A0
10
20
30
40
50
60
70
80
Fungicide Only Fungicide + Neonicotinoid
Mea
n T
ota
l P
red
ato
ry A
rth
rop
od
s
P = 0.10

Conclusions
• The epigeal communities of soybean treated with
neonicotinoid seed treatments were less diverse at
than soybean treated with only a fungicide seed
treatment.
• While herbivorous arthropods were significantly less
abundant in neonicotinoid treated soybean, predatory
arthropod abundance was not affected by the seed
treatment.

Acknowledgements
• Angus Catchot
• Jeff Gore
• Don Cook
• Trent Irby
• Richard Brown
• Brandon Barton
• Dung Bao and Boise
Stokes
• Fellow graduate
students
• Student Workers