Influence of Varroa Mite (Varroa destructor) Infestation Levels … and Insecticides 2016Aug.pdf ·...
55
Prepared for Publication in: Address Correspondence to: 1 Insects Dr. Frank Rinkevich 2 USDA-ARS Honey Bee Breeding, 3 Genetics, and Physiology Laboratory 4 1157 Ben Hur Rd. 5 Baton Rouge, LA 70820 6 USA 7 Phone: (225) 276-3998 8 Fax Number: (225) 766-9212 9 E-mail: [email protected] 10 11 Influence of Varroa Mite (Varroa destructor) Infestation Levels and Management 12 Practices on Insecticide Sensitivity in the Honey Bee (Apis mellifera) 13 14 Frank D. Rinkevich 1,2* , Robert G. Danka 2 , and Kristen B. Healy 1 15 16 1 Department of Entomology, Life Sciences Annex, Louisiana State University, 17 Baton Rouge, LA USA 18 2 USDA-ARS Honey Bee Breeding, Genetics, and Physiology Laboratory, Baton 19 Rouge, LA USA 20 *Current address 21 22 23
Transcript of Influence of Varroa Mite (Varroa destructor) Infestation Levels … and Insecticides 2016Aug.pdf ·...
Prepared for Publication in: Address Correspondence to: 1
Insects Dr. Frank Rinkevich 2
USDA-ARS Honey Bee Breeding, 3
Genetics, and Physiology Laboratory 4
1157 Ben Hur Rd. 5
Baton Rouge, LA 70820 6
USA 7
Phone: (225) 276-3998 8
Fax Number: (225) 766-9212 9
E-mail: [email protected] 10
11
Influence of Varroa Mite (Varroa destructor) Infestation Levels and Management 12
Practices on Insecticide Sensitivity in the Honey Bee (Apis mellifera) 13
14
Frank D. Rinkevich1,2*, Robert G. Danka2, and Kristen B. Healy1 15
16
1Department of Entomology, Life Sciences Annex, Louisiana State University, 17
Baton Rouge, LA USA 18
2USDA-ARS Honey Bee Breeding, Genetics, and Physiology Laboratory, Baton 19
Rouge, LA USA 20
*Current address 21
22
23
ABSTRACT 24
Varroa mites may cause devastating colony losses throughout the year 25
and especially over winter. In addition to killing honey bees by feeding directly 26
on bodily fluids, these parasites transmit many viral diseases, increase the 27
susceptibility of the honey bee to pathogens, as well as disrupt biochemical and 28
developmental processes. A variety of chemical, mechanical, and cultural 29
practices may be implemented to mitigate mite infestation. While miticide 30
applications are typically the most consistent and efficacious Varroa mite 31
management method, increased sensitivity of honey bees to insecticides via 32
miticide synergism and the eventual evolution of miticide resistance in Varroa 33
mites are reasonable concerns. 34
We used discriminating potency bioassays to test if mite infestation levels 35
affected sensitivity to three commonly used insecticides. With no other factors 36
considered, higher Varroa mite infestation levels significantly increased sensitivity 37
to naled and imidacloprid, but not to phenothrin. Varroa mite infestation levels 38
measured from newly emerged adults was significantly higher than from 39
sampling from samples of bees on unknown age within the colony. 40
To test the effects of mite infestation levels and mite management 41
practices on insecticide sensitivity, colonies of Italian honey bee were treated 42
with amitraz (Apivar®) according to the labeled instructions, IPM techniques 43
such as screened bottom boards, drone brood trapping, and powdered sugar 44
grooming stimulation, as well as an untreated control group. Sensitivity to 45
phenothrin, amitraz, and clothianidin was assessed on a monthly basis from May 46
through October. Measurements of colony health such as adult bee population, 47
brood quantity, brood quality, queen presence, mite infestation levels, pollen 48
collection rates and honey bee weight were also recorded. 49
Surprisingly, mite infestation levels did not significantly affect the sensitivity 50
to the pesticides we tested. Phenothrin sensitivity was significantly increased by 51
day of the year, pollen collection rate, but significantly decreased by bee 52
weight and queen retention. There was a significant negative relationship 53
between amitraz sensitivity and bee weight. Clothianidin sensitivity was 54
significantly affected by treatment type (amitraz, IPM>Control), and declined 55
with day of the year, brood quality, pollen collection rate, and bee weight. 56
Varroa mite infestation significantly decreased brood quality and honey bee 57
weight. Varroa mite infestation levels were significantly determined by treatment 58
(amitraz < IPM, Control) and day of the year. 59
These results show that insecticide sensitivity is dynamic throughout the 60
year with fall bees being less sensitive than spring bees likely due to physiological 61
differences between those cohorts. The observation that larger bees and higher 62
pollen collection rates reduce insecticide sensitivity underscores the importance 63
of nutrition on colony health. In-hive amitraz treatment according to the labeled 64
use pattern did not synergize sensitivity to the pesticides tested and should 65
alleviate concern over potential synergistic effects of amitraz observed in 66
laboratory studies. Since IPM practices were largely ineffective at reducing 67
Varroa mite infestation levels, reliance on chemical methods of Varroa mite 68
management is likely to be prominent in the near future. However, these 69
products must be used judiciously so the long term effectiveness of these 70
compounds could be maximized. 71
These data demonstrate the complex and dynamics variables that 72
contribute to honey bee colony health. It underscores the importance of 73
controlling for as many of these variables as possible in order to accurately 74
determine the effects of each of these factors as they act alone or in concert 75
with others. 76
INTRODUCTION 77
The Varroa mite, Varroa destructor, is one of the most important forces 78
responsible for colony declines and increased overwintering colony losses in the 79
honey bee, Apis mellifera. Varroa mites feed on the hemolymph of bees at all 80
life stages. This feeding activity can result in premature mortality in all 81
developmental stages of honey bees. Queen loss and starvation are the only 82
factors that are more critical to colony loss than Varroa mite infestation [1,2]. The 83
impacts of Varroa mite infestation can be immediate and profound. In some 84
regions of the US, up to 80% of managed colonies were lost due to Varroa mite 85
infestation in the 1995-96 field season [3]. Varroa mite levels as low as 10 mites 86
per 100 bees can reduce overwintering survival [4]. 87
While the direct damage to honey bees by Varroa mite infestation on its 88
own is evident, Varroa mite infestation indirectly increases the susceptibility to 89
other parasites and diseases. For example, low to moderate Varroa mite 90
infestations can reduce the expression of antimicrobial peptides, dampen 91
immunity function, facilitate virus amplification, and may affect the expression of 92
genes related to behavior [5-7]. High mite infestation can lower pupal and adult 93
weight [8,9], which can lead to lower reproductive output by queens and 94
drones as well as reduced colony maintenance and foraging capabilities by 95
workers. 96
Varroa mite infestation affects physiological processes that are relevant to 97
insecticide sensitivity. Varroa mite infestation can reduce body size [8,9] and 98
body size is a universal factor that dictates sensitivity to insecticides. Varroa mites 99
may affect insecticide sensitivity through lowering the titer of vitellogenin in the 100
hemolymph of infested bees [10]. Vitellogenin is a carrier protein that can act to 101
sequester xenobiotics and limit oxidative stress [11], and high vitellogenin levels 102
may account for the different acaricide sensitivities between workers and 103
queens [12]. Varroa infestation mutes expression of genes involved in metabolic 104
detoxification and oxidative stress [13]. Due to its effects on body size, 105
vitellogenin titers, and metabolic gene expression, it is reasonable to conclude 106
that Varroa mite infestation may increase insecticide sensitivity. 107
The goal of this study was to evaluate if bees infested with high levels of 108
Varroa mites are more sensitive to insecticides than bees with lower levels of 109
mites. In addition, we evaluated colony health indicators in honey bees 110
managed with one of three Varroa mite management strategies. 111
112
MATERIALS AND METHODS 113
Single-Potency Bioassays 114
Varroa mite infestation was measured in September 2014 from 16 colonies 115
of Italian honey bees (Apis mellifera ligustica, Wooten’s Golden Bees, Palo 116
Cedro, CA) that were started at nucleus colonies in April 2014 at the USDA-ARS 117
Bee Breeding, Genetics, and Physiology Laboratory in Baton Rouge, LA, under 118
normal field rearing conditions. No mite treatments, antibiotics, or supplemental 119
feedings were administered beyond the scope of this research. Frames with 120
wax-coated foundation and boxes were added based on the needs of the 121
colony. Approximately 300 bees from brood frames were scooped with a 500 mL 122
plastic cup, transferred to a zip-top bag, then stored on ice in the field before 123
freezing overnight at -20oC. 124
Brood frames with emerging adults were collected from each colony and 125
held at 33+1oC with >70+5% humidity in a dark incubator. One-day-old bees 126
were brushed from the frames and sorted into groups of 20 into disposable wax 127
paper cups and held at environmental conditions listed above with three cotton 128
balls soaked in 50% (w/v) sucrose solution until bees are three days of age. 129
Topical bioassays with phenothrin and naled as well as a feeding bioassay with 130
imidacloprid were performed with diagnostic doses or concentrations that result 131
in 50% (66 ng/bee), 33% (33 ng/bee) and 25% (4 ng/mL) mortality for phenothrin, 132
naled, and imidacloprid, respectively [14]. Topical bioassays with phenothrin 133
and naled were performed by applying a 1 uL drop of insecticide to the 134
thoracic notum of a bee anesthetized on CO2 for less than 1 minute with a 135
mechanical Hamilton syringe. The 20 anesthetized bees were weighed after 136
treatment. Bees were held at the environmental conditions listed above. A 137
feeding bioassay with imidacloprid was conducted by placing a perforated 138
microcentrifuge tube with filled with 1 ml of imidacloprid in 50% sucrose solution 139
through the tulle covering the waxed cup and removing the cotton ball soaked 140
with sucrose solution. Control feeding assays were conducted with 50% sucrose 141
solution with 0.001% acetone. Mortality in all bioassays was recorded at 24 hours 142
after insecticide application. Individuals that are ataxic or unable to right 143
themselves were scored as dead. 144
Bees used in bioassays were frozen at -20oC overnight. Varroa mites left 145
over in the bioassay cups were collected and counted. Varroa mites were 146
dislodged from frozen bees collected from brood frames in the colony and from 147
bioassays by shaking in warm soapy water at 120 rpm on an orbital table shaker 148
for 1hr. Samples were shaken until no additional Varroa mites were dislodged. 149
The Varroa mite infestation level was calculated by dividing the total number of 150
mites collected from bioassay cups and bee washes by the number of bees in 151
the sample (# mites/100 bees). 152
153
Seasonal Management Experiments 154
Thirty-six, deep frame, nucleus colonies of Italian bees were established on 155
4-May-2015 as described above. The colonies were divided into three equal 156
treatment groups (Control, Amitraz, and IPM) so that Varroa mite infestation 157
levels were equal among groups. Varroa mite levels were not managed in the 158
control group. The amitraz group received treatments in the form of Apivar® 159
strips according to the label instructions. One strip was placed in the brood 160
comb of the colonies from 13-May-2015 through 7-July-2015. A second Apivar® 161
treatment was initiated 1-Sept-2015. One strip was applied for every 5 frames in 162
the brood chambers. Mite levels in the IPM group were managed using non-163
chemical control methods of screened bottom boards, drone brood Varroa 164
mite trapping, and coating bees with powdered sugar to dislodge Varroa mites. 165
Screened bottom boards were installed at colony establishment on 4-May-2015 166
and remained in place through the duration of the experiment. Drone comb 167
was installed at colony establishment. Drone comb was removed and frozen 168
when sealed drone brood was present and replaced with empty drone comb 169
as needed over the course of the experiment. Bees were treated with 170
powdered sugar by removing frames and coating bees with an even layer of 171
powdered sugar by shaking powdered sugar through a screened shaker. 172
Powdered sugar treatments were administered 6-May-2015, 8-July-2015, and 2-173
Sept-2015. 174
Colony health was assessed by measuring the population of adult bees, 175
amount of brood, brood quality, queen survivorship, Varroa mite infestation 176
levels, and pollen collection rates using standard procedures [15,16]. Adult 177
population was estimated by counting the number of full deep frames of adult 178
bees in each colony. Brood quantity was estimated counting the cumulative 179
surface area of all capped worker brood comb in the colony so that for every 180
100 in brood quantity represents a full side of a deep frame covered with 181
capped worker brood. Brood quality was measured by taking 4 counts of empty 182
brood cells in a 100 total cell survey area. Queen retention was measured by 183
observing if a queen was present on a monthly basis. Queen loss was confirmed 184
by lack of eggs, presence of queen cells, or a supersedure queen. Varroa mite 185
infestation levels were measured by sampling approximately 300 bees from 186
brood bearing comb with a 500 ml plastic cup, placed into a zip top plastic bag 187
on ice in the field, and then frozen at -20oC overnight. Varroa mites were 188
dislodged from bees and infestation rate was calculated as described above. 189
Pollen collection was measured by installing pollen traps at the entrance of 190
each colony. Pollen traps were closed each time frames are removed for 191
bioassays and then opened when frames were replaced. The amount of pollen 192
collected was standardized in grams of pollen collected per day. Due to high 193
mite infestation levels and a large population of bees in the Control and IPM 194
treatments that were symptomatic for deformed wing virus (DWV) and chronic 195
bee paralysis virus (CBPV), our final sample collections occurred in October. 196
197
Pesticides 198
We evaluated the sensitivity of honey bees to the insecticides phenothrin 199
and clothianidin, the miticide amitraz, and the fungicide chlorothalonil. 200
Phenothrin is widely used in mosquito control programs, while clothianidin is used 201
as a seed treatment in many industrially grown crops. Amitraz is used as an in-202
hive chemical treatment to control mites. Chlorothalonil is a widely used 203
agricultural fungicide that is commonly found at high levels in honey bee 204
colonies [17]. All materials were >98% purity and were purchased from 205
ChemService (West Chester, PA). Stock solutions of each compound were 206
dissolved in acetone. 207
208
Bioassays 209
Bioassays were performed as previously described [14]. Brood frames were 210
collected from each colony the first Monday of each month (May through 211
October) and held at 33+1oC with >70+1% humidity in a dark incubator. One-212
day-old bees were brushed from the frames and sorted into groups of 20 into 213
disposable wax paper cups and held at environmental conditions listed above 214
with three cotton balls soaked in 50% (w/v) sucrose solution until bees are three-215
days of age. 216
Stock solutions were diluted to include more than four concentrations that 217
provided more than 0% and less than 100% mortality. Dilutions for phenothrin, 218
amitraz, and chlorothalonil stock solutions were done in acetone, while 219
clothianidin was diluted in 50% (w/v) sucrose solution. Topical bioassays with 220
phenothrin, amitraz, and chlorothalonil and feeding bioassays with clothianidin 221
were performed as described above. At least three reps of 20 bees per cup 222
were used at each dose for each pesticide was used to determine LD50 values 223
with a minimum of 200 bees per pesticide per treatment. 224
225
Statistical Analyses 226
All statistics besides probit analysis were performed with JMP 12 (SAS, Cary 227
NC). Correlation of Varroa mite infestation levels with insecticide sensitivity in 228
discriminating potency bioassays was compared with linear regression. 229
Comparison of Varroa mite infestation levels from bees collected from the 230
colony or from bioassays was compared with Wilcoxon Ranked Sum Test. The 231
LD50 value for each insecticide for each colony was calculated using probit 232
analysis with Abbot’s correction for control mortality [18] and standardized by 233
body weight using Minitab (State College, PA). Toxicity was considered 234
significantly different if the 95% CI of the LD50 values did not overlap between 235
colonies or test dates. Differences in the number of frames of adults, amount of 236
brood, brood quality, Varroa mite infestation, honey bee weight, and pollen 237
collection rate were compared using One-Way ANOVA with Fisher’s exact test. 238
Queen retention over time among treatment groups was analyzed by Kaplan-239
Meier survival estimates. The interactions of colony health measurements and 240
LD50 values (not standardized by weight) were assessed with a General Linear 241
Model. 242
243
RESULTS 244
Single-Potency Bioassays 245
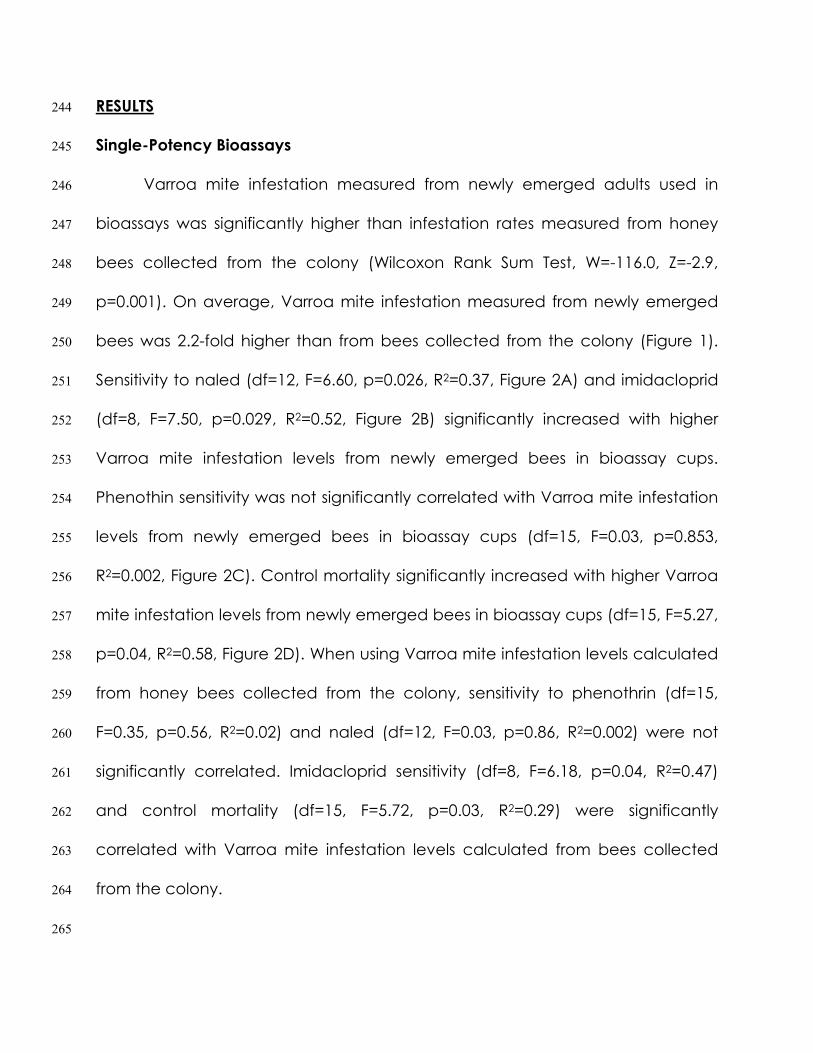
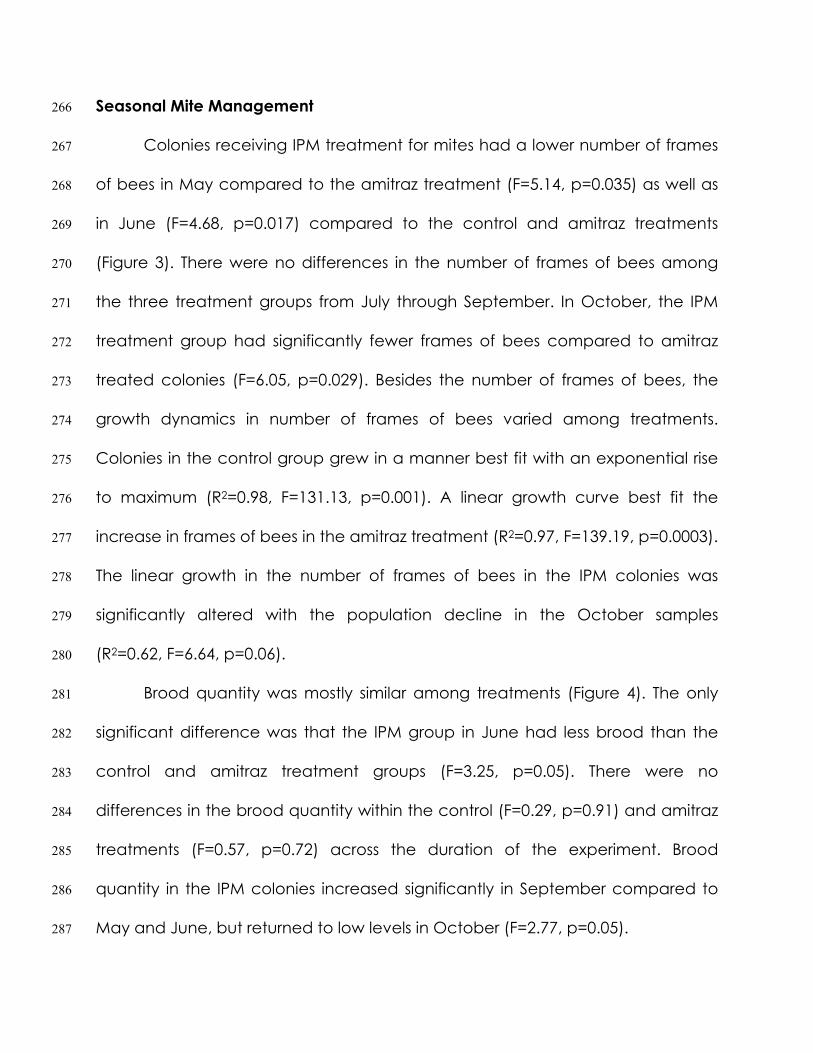
Varroa mite infestation measured from newly emerged adults used in 246
bioassays was significantly higher than infestation rates measured from honey 247
bees collected from the colony (Wilcoxon Rank Sum Test, W=-116.0, Z=-2.9, 248
p=0.001). On average, Varroa mite infestation measured from newly emerged 249
bees was 2.2-fold higher than from bees collected from the colony (Figure 1). 250
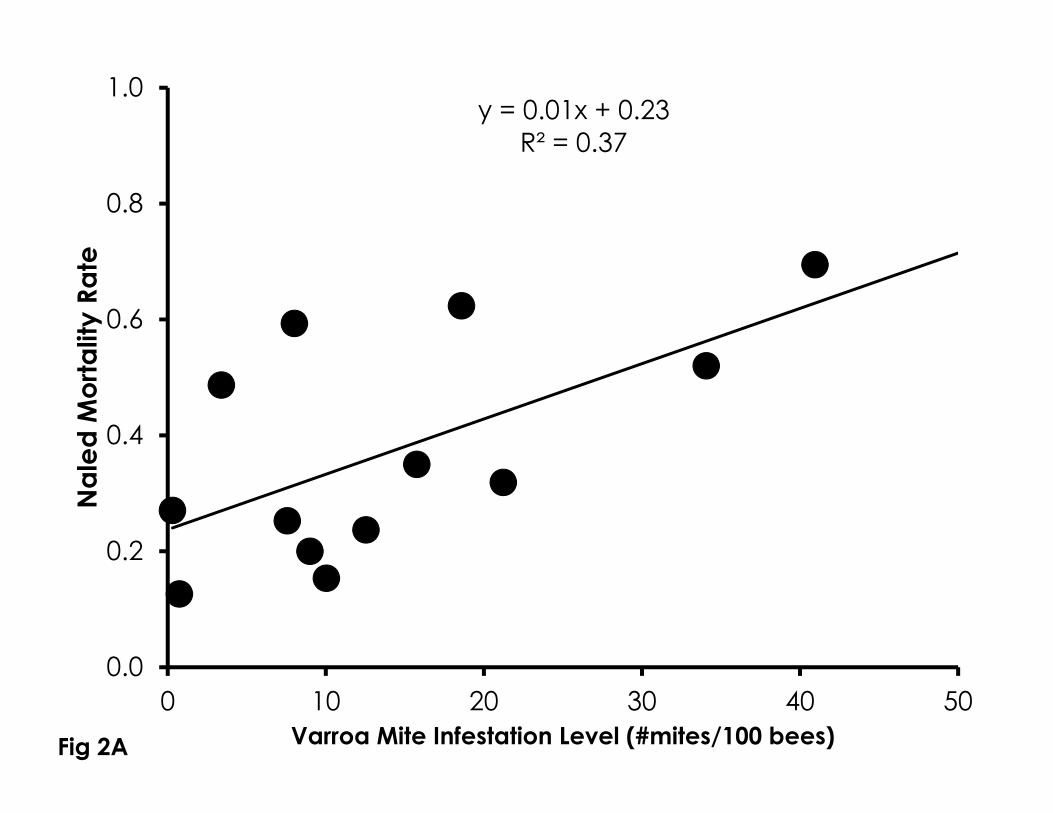
Sensitivity to naled (df=12, F=6.60, p=0.026, R2=0.37, Figure 2A) and imidacloprid 251
(df=8, F=7.50, p=0.029, R2=0.52, Figure 2B) significantly increased with higher 252
Varroa mite infestation levels from newly emerged bees in bioassay cups. 253
Phenothin sensitivity was not significantly correlated with Varroa mite infestation 254
levels from newly emerged bees in bioassay cups (df=15, F=0.03, p=0.853, 255
R2=0.002, Figure 2C). Control mortality significantly increased with higher Varroa 256
mite infestation levels from newly emerged bees in bioassay cups (df=15, F=5.27, 257
p=0.04, R2=0.58, Figure 2D). When using Varroa mite infestation levels calculated 258
from honey bees collected from the colony, sensitivity to phenothrin (df=15, 259
F=0.35, p=0.56, R2=0.02) and naled (df=12, F=0.03, p=0.86, R2=0.002) were not 260
significantly correlated. Imidacloprid sensitivity (df=8, F=6.18, p=0.04, R2=0.47) 261
and control mortality (df=15, F=5.72, p=0.03, R2=0.29) were significantly 262
correlated with Varroa mite infestation levels calculated from bees collected 263
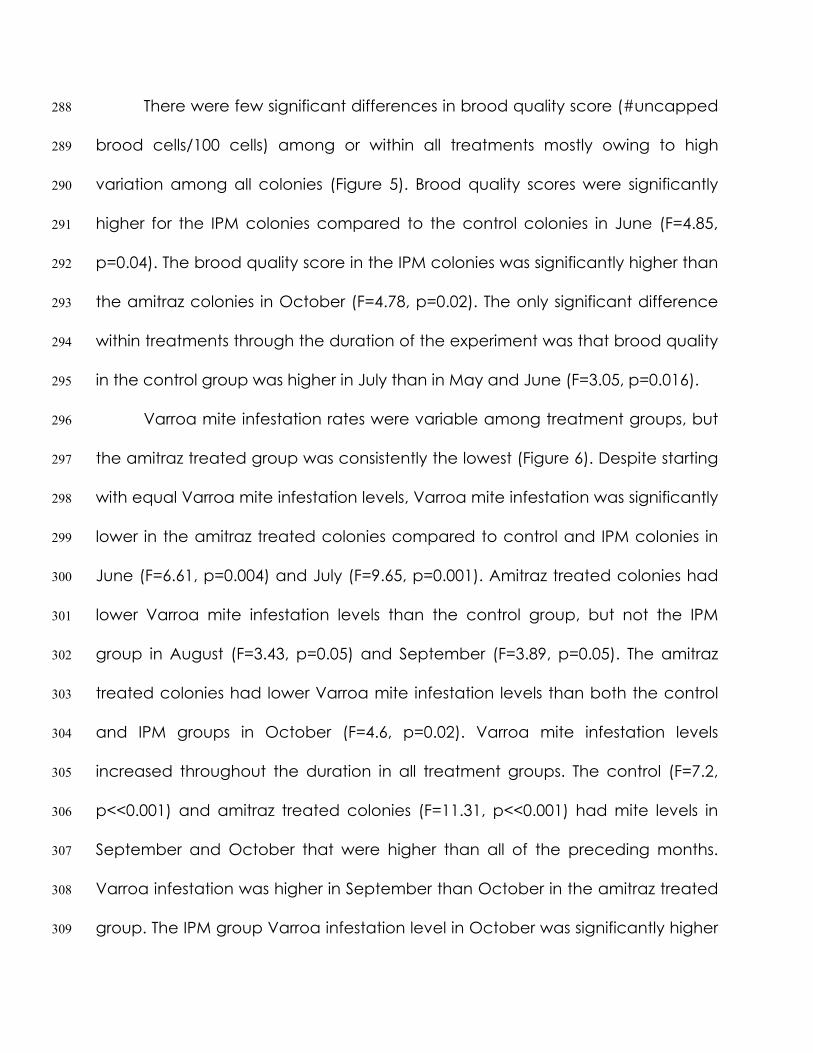
from the colony. 264
265
Seasonal Mite Management 266
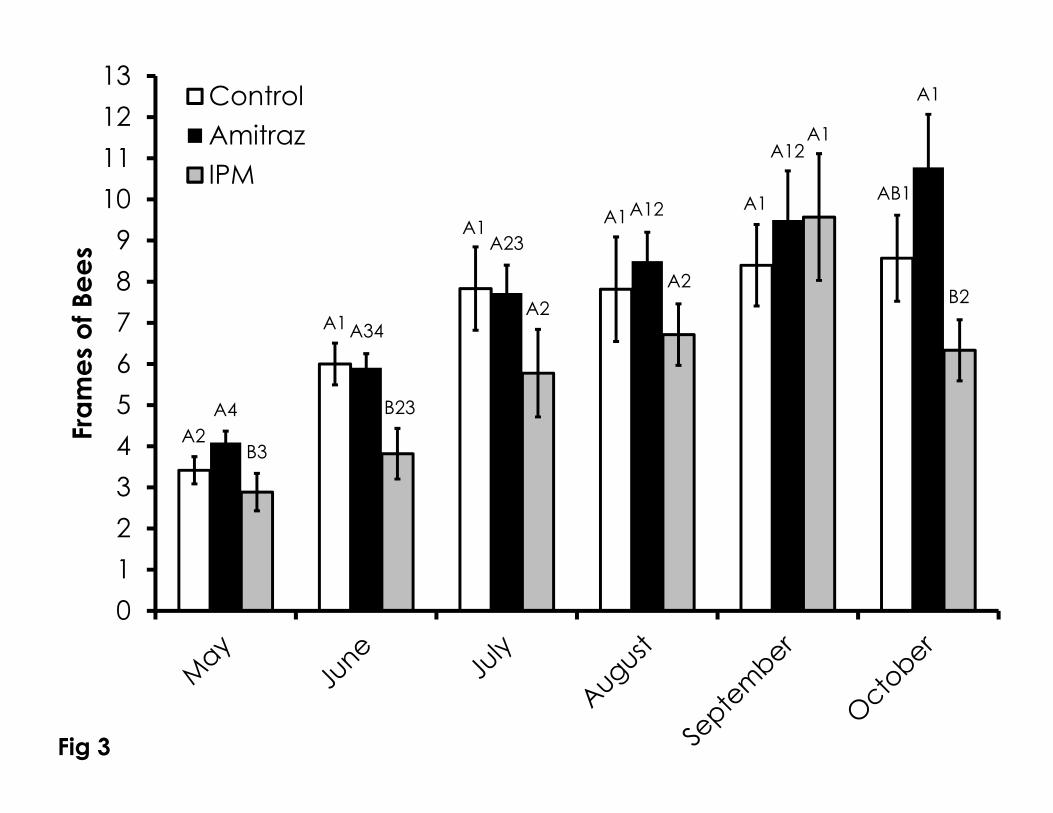
Colonies receiving IPM treatment for mites had a lower number of frames 267
of bees in May compared to the amitraz treatment (F=5.14, p=0.035) as well as 268
in June (F=4.68, p=0.017) compared to the control and amitraz treatments 269
(Figure 3). There were no differences in the number of frames of bees among 270
the three treatment groups from July through September. In October, the IPM 271
treatment group had significantly fewer frames of bees compared to amitraz 272
treated colonies (F=6.05, p=0.029). Besides the number of frames of bees, the 273
growth dynamics in number of frames of bees varied among treatments. 274
Colonies in the control group grew in a manner best fit with an exponential rise 275
to maximum (R2=0.98, F=131.13, p=0.001). A linear growth curve best fit the 276
increase in frames of bees in the amitraz treatment (R2=0.97, F=139.19, p=0.0003). 277
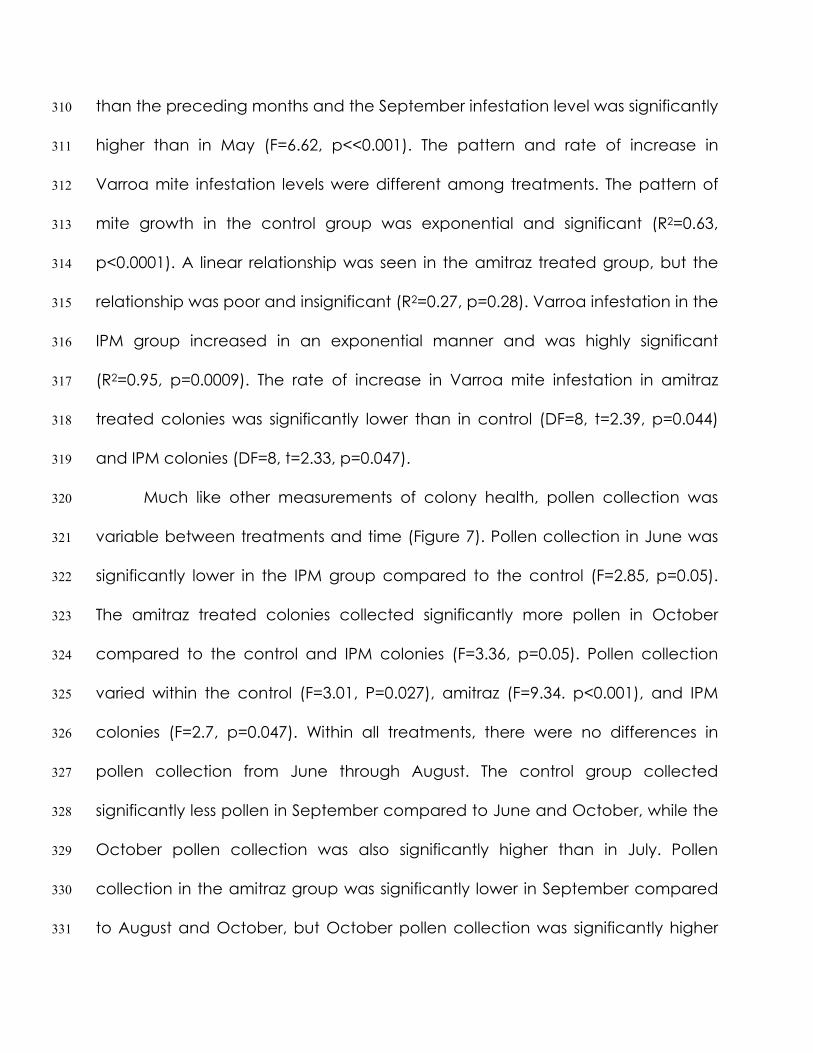
The linear growth in the number of frames of bees in the IPM colonies was 278
significantly altered with the population decline in the October samples 279
(R2=0.62, F=6.64, p=0.06). 280
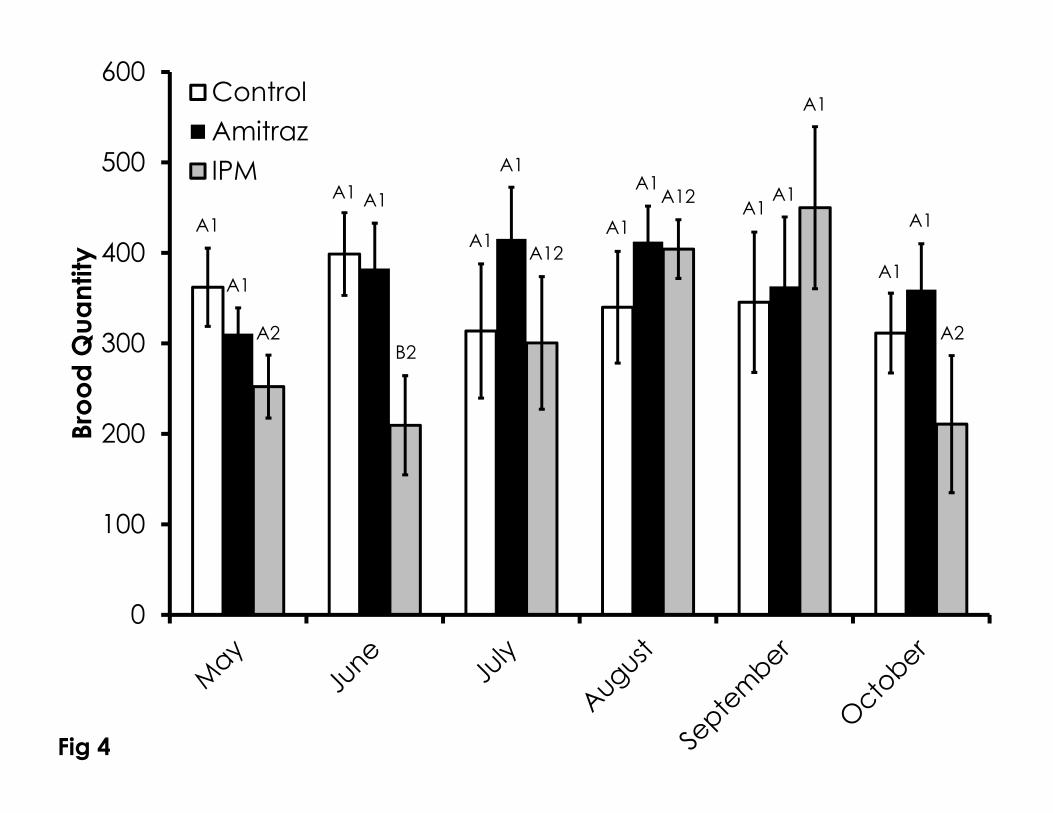
Brood quantity was mostly similar among treatments (Figure 4). The only 281
significant difference was that the IPM group in June had less brood than the 282
control and amitraz treatment groups (F=3.25, p=0.05). There were no 283
differences in the brood quantity within the control (F=0.29, p=0.91) and amitraz 284
treatments (F=0.57, p=0.72) across the duration of the experiment. Brood 285
quantity in the IPM colonies increased significantly in September compared to 286
May and June, but returned to low levels in October (F=2.77, p=0.05). 287
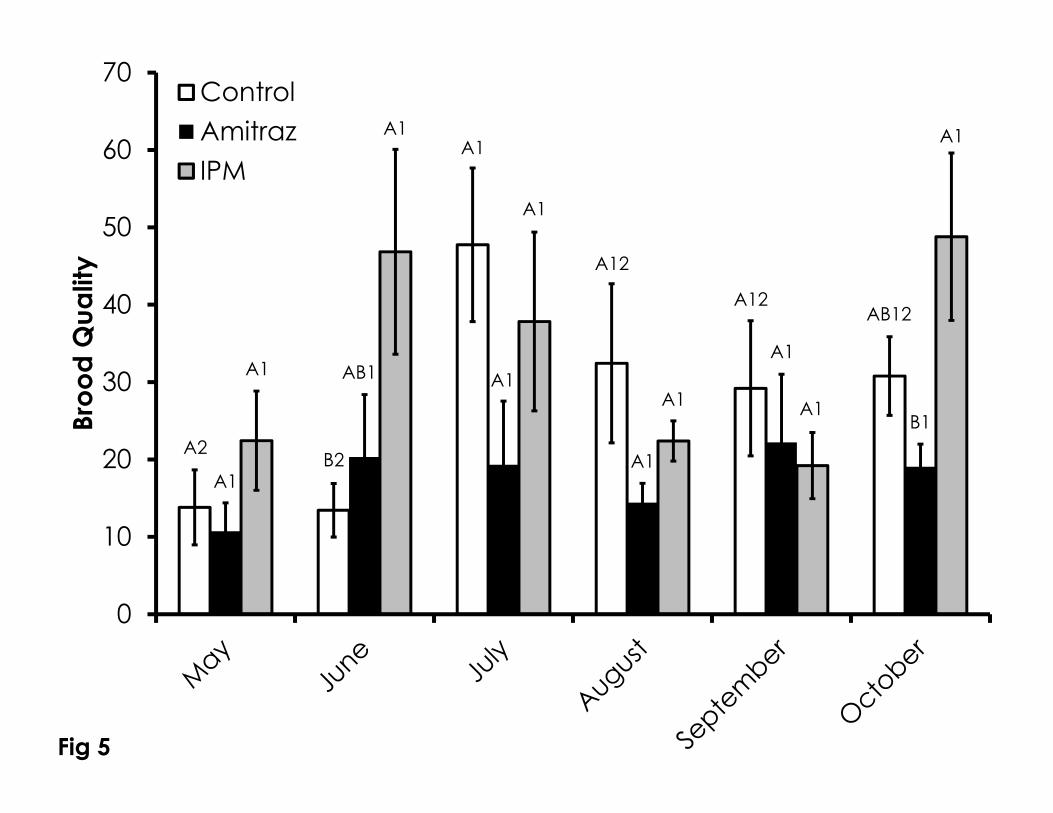
There were few significant differences in brood quality score (#uncapped 288
brood cells/100 cells) among or within all treatments mostly owing to high 289
variation among all colonies (Figure 5). Brood quality scores were significantly 290
higher for the IPM colonies compared to the control colonies in June (F=4.85, 291
p=0.04). The brood quality score in the IPM colonies was significantly higher than 292
the amitraz colonies in October (F=4.78, p=0.02). The only significant difference 293
within treatments through the duration of the experiment was that brood quality 294
in the control group was higher in July than in May and June (F=3.05, p=0.016). 295
Varroa mite infestation rates were variable among treatment groups, but 296
the amitraz treated group was consistently the lowest (Figure 6). Despite starting 297
with equal Varroa mite infestation levels, Varroa mite infestation was significantly 298
lower in the amitraz treated colonies compared to control and IPM colonies in 299
June (F=6.61, p=0.004) and July (F=9.65, p=0.001). Amitraz treated colonies had 300
lower Varroa mite infestation levels than the control group, but not the IPM 301
group in August (F=3.43, p=0.05) and September (F=3.89, p=0.05). The amitraz 302
treated colonies had lower Varroa mite infestation levels than both the control 303
and IPM groups in October (F=4.6, p=0.02). Varroa mite infestation levels 304
increased throughout the duration in all treatment groups. The control (F=7.2, 305
p<<0.001) and amitraz treated colonies (F=11.31, p<<0.001) had mite levels in 306
September and October that were higher than all of the preceding months. 307
Varroa infestation was higher in September than October in the amitraz treated 308
group. The IPM group Varroa infestation level in October was significantly higher 309
than the preceding months and the September infestation level was significantly 310
higher than in May (F=6.62, p<<0.001). The pattern and rate of increase in 311
Varroa mite infestation levels were different among treatments. The pattern of 312
mite growth in the control group was exponential and significant (R2=0.63, 313
p<0.0001). A linear relationship was seen in the amitraz treated group, but the 314
relationship was poor and insignificant (R2=0.27, p=0.28). Varroa infestation in the 315
IPM group increased in an exponential manner and was highly significant 316
(R2=0.95, p=0.0009). The rate of increase in Varroa mite infestation in amitraz 317
treated colonies was significantly lower than in control (DF=8, t=2.39, p=0.044) 318
and IPM colonies (DF=8, t=2.33, p=0.047). 319
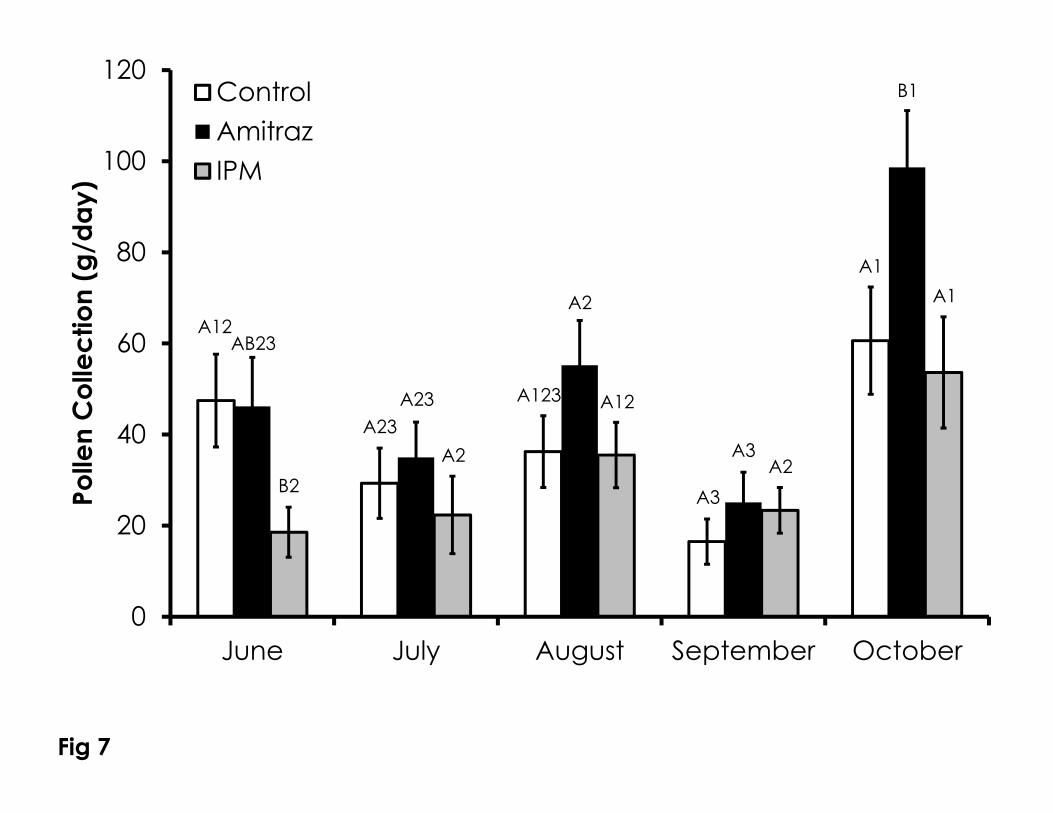
Much like other measurements of colony health, pollen collection was 320
variable between treatments and time (Figure 7). Pollen collection in June was 321
significantly lower in the IPM group compared to the control (F=2.85, p=0.05). 322
The amitraz treated colonies collected significantly more pollen in October 323
compared to the control and IPM colonies (F=3.36, p=0.05). Pollen collection 324
varied within the control (F=3.01, P=0.027), amitraz (F=9.34. p<0.001), and IPM 325
colonies (F=2.7, p=0.047). Within all treatments, there were no differences in 326
pollen collection from June through August. The control group collected 327
significantly less pollen in September compared to June and October, while the 328
October pollen collection was also significantly higher than in July. Pollen 329
collection in the amitraz group was significantly lower in September compared 330
to August and October, but October pollen collection was significantly higher 331
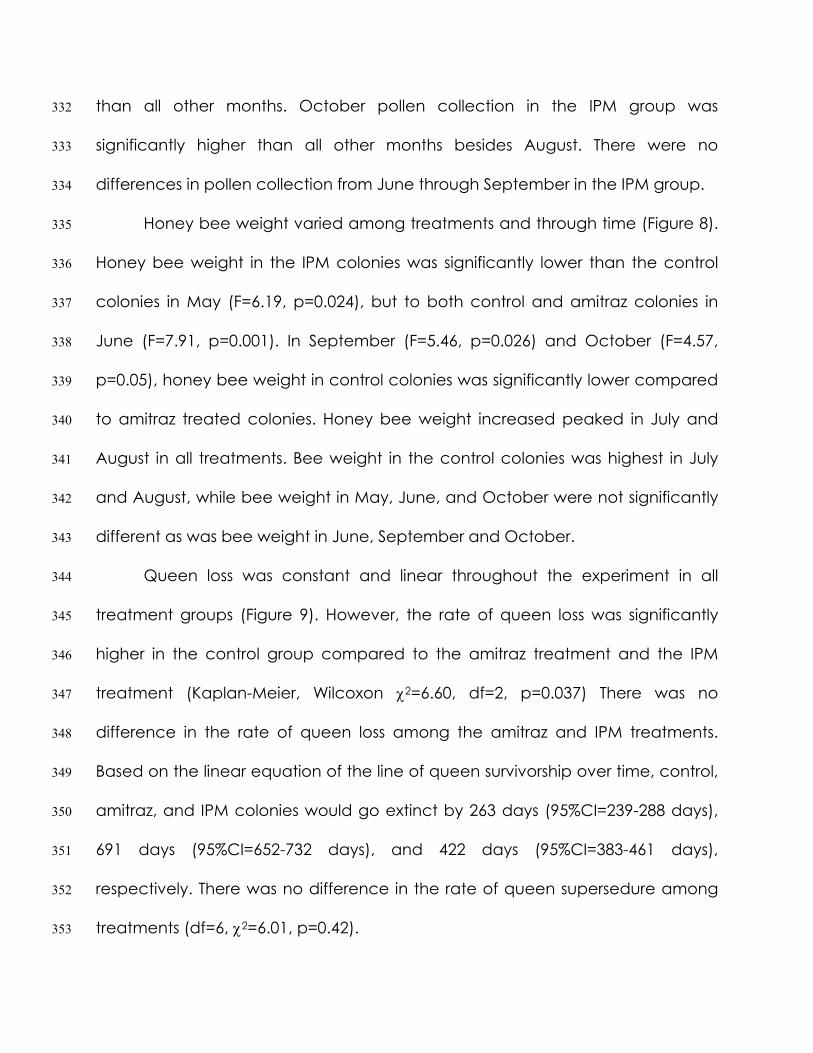
than all other months. October pollen collection in the IPM group was 332
significantly higher than all other months besides August. There were no 333
differences in pollen collection from June through September in the IPM group. 334
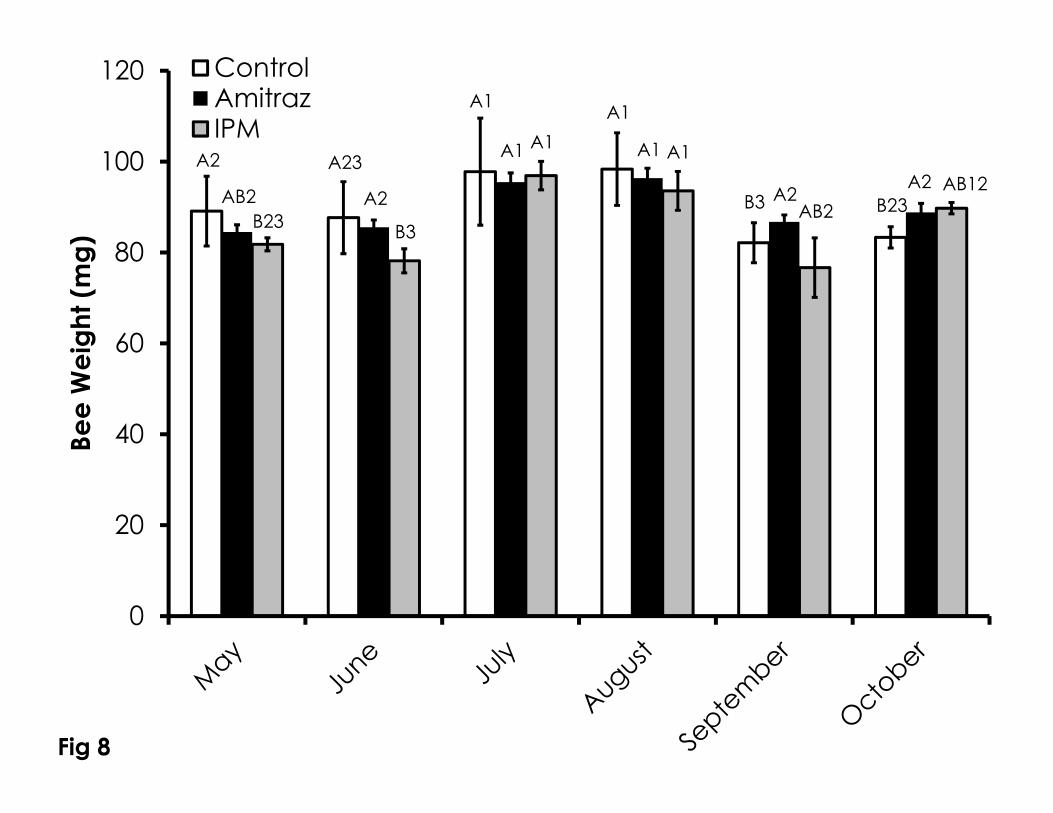
Honey bee weight varied among treatments and through time (Figure 8). 335
Honey bee weight in the IPM colonies was significantly lower than the control 336
colonies in May (F=6.19, p=0.024), but to both control and amitraz colonies in 337
June (F=7.91, p=0.001). In September (F=5.46, p=0.026) and October (F=4.57, 338
p=0.05), honey bee weight in control colonies was significantly lower compared 339
to amitraz treated colonies. Honey bee weight increased peaked in July and 340
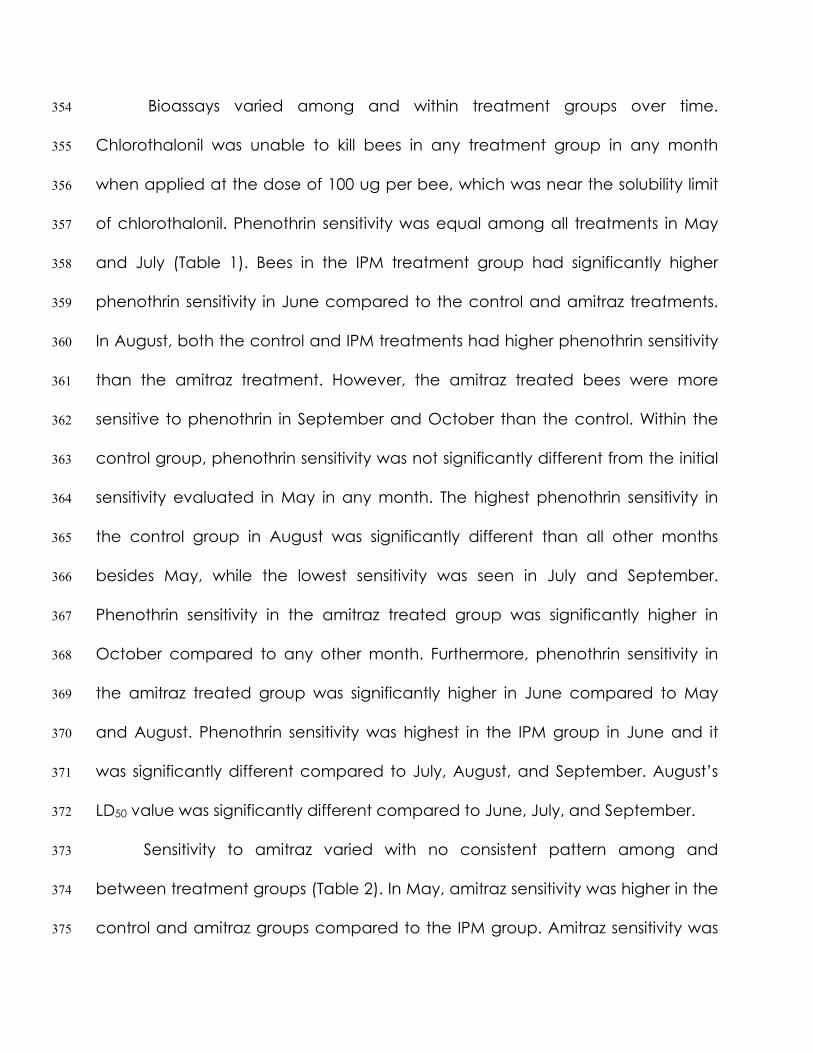
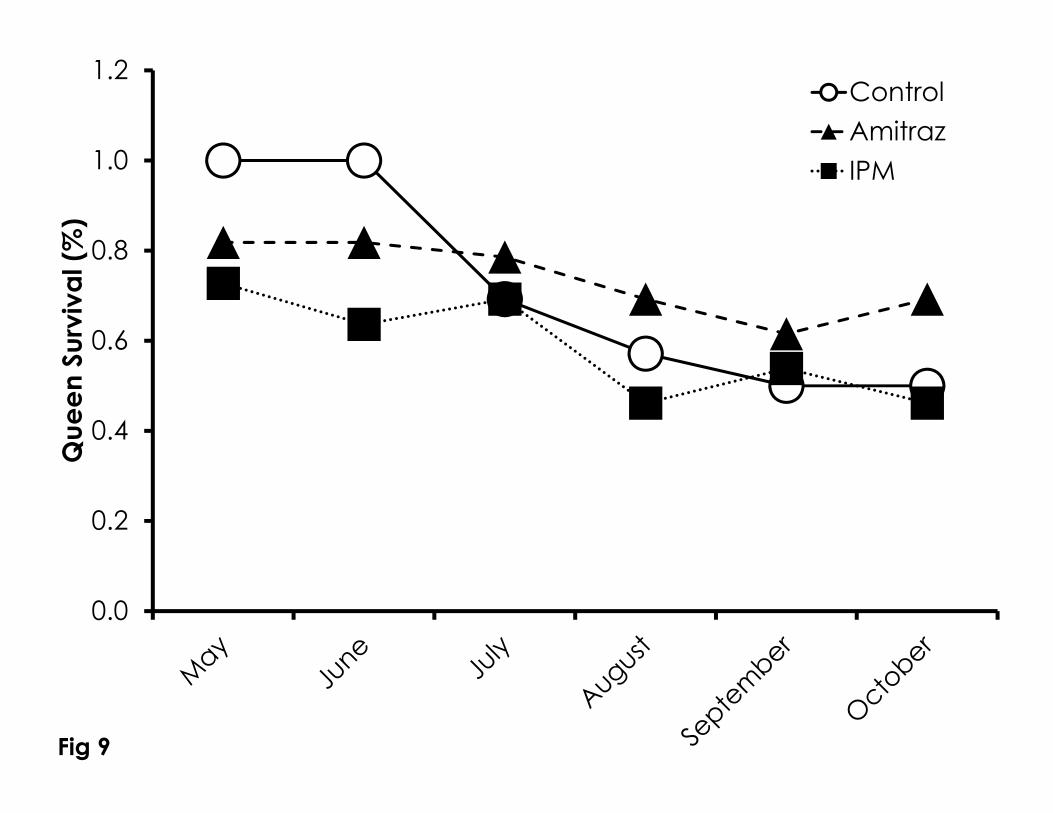
August in all treatments. Bee weight in the control colonies was highest in July 341
and August, while bee weight in May, June, and October were not significantly 342
different as was bee weight in June, September and October. 343
Queen loss was constant and linear throughout the experiment in all 344
treatment groups (Figure 9). However, the rate of queen loss was significantly 345
higher in the control group compared to the amitraz treatment and the IPM 346
treatment (Kaplan-Meier, Wilcoxon 2=6.60, df=2, p=0.037) There was no 347
difference in the rate of queen loss among the amitraz and IPM treatments. 348
Based on the linear equation of the line of queen survivorship over time, control, 349
amitraz, and IPM colonies would go extinct by 263 days (95%CI=239-288 days), 350
691 days (95%CI=652-732 days), and 422 days (95%CI=383-461 days), 351
respectively. There was no difference in the rate of queen supersedure among 352
treatments (df=6, 2=6.01, p=0.42). 353
Bioassays varied among and within treatment groups over time. 354
Chlorothalonil was unable to kill bees in any treatment group in any month 355
when applied at the dose of 100 ug per bee, which was near the solubility limit 356
of chlorothalonil. Phenothrin sensitivity was equal among all treatments in May 357
and July (Table 1). Bees in the IPM treatment group had significantly higher 358
phenothrin sensitivity in June compared to the control and amitraz treatments. 359
In August, both the control and IPM treatments had higher phenothrin sensitivity 360
than the amitraz treatment. However, the amitraz treated bees were more 361
sensitive to phenothrin in September and October than the control. Within the 362
control group, phenothrin sensitivity was not significantly different from the initial 363
sensitivity evaluated in May in any month. The highest phenothrin sensitivity in 364
the control group in August was significantly different than all other months 365
besides May, while the lowest sensitivity was seen in July and September. 366
Phenothrin sensitivity in the amitraz treated group was significantly higher in 367
October compared to any other month. Furthermore, phenothrin sensitivity in 368
the amitraz treated group was significantly higher in June compared to May 369
and August. Phenothrin sensitivity was highest in the IPM group in June and it 370
was significantly different compared to July, August, and September. August’s 371
LD50 value was significantly different compared to June, July, and September. 372
Sensitivity to amitraz varied with no consistent pattern among and 373
between treatment groups (Table 2). In May, amitraz sensitivity was higher in the 374
control and amitraz groups compared to the IPM group. Amitraz sensitivity was 375
highest in the amitraz treated group in June compared to the control and IPM 376
groups. The IPM group was more sensitive to amitraz than the amitraz treated 377
group in August. In September, amitraz sensitivity was highest in the amitraz 378
treated and IPM colonies. The control group was more sensitive to amitraz than 379
the amitraz treated group in October and the LD50 for amitraz was unable to be 380
calculated from the IPM group in October. 381
Clothianidin sensitivity was significantly higher in the control and amitraz 382
group than the IPM group at in May (Table 3). The IPM group was more than 11-383
fold more sensitive to clothianidin than the control group in June. The IPM group 384
was more sensitive to clothianidin than the amitraz group in August. In 385
September, the amitraz group was more sensitive to clothianidin than the 386
control group. The amitraz and IPM groups were more sensitive to clothianidin 387
than the control group in October. Within the control group, clothianidin 388
sensitivity was highest in May, June, and July, intermediate in August and 389
October, and lowest in September. Clothianidin sensitivity in the amitraz group 390
was highest in May and June which was significantly different from July, which 391
was significantly different from October, which was significantly different from 392
August and September. The IPM group had the highest sensitivity to clothianidin 393
in June while the lowest sensitivity was in May and September. 394
395
Interactions of Measurements of Colony Health 396
The number of frames of bees was significantly increased by day (F=6.97, 397
p=0.009, m=0.021), brood quantity (F=39.73, p<0.001, m=0.0094), and pollen 398
collection (F=3.71, p=0.05, m=0.013) and the model had an R2 of 0.546. 399
The model for brood quantity with an R2 of 0.661 showed that day (F=6.35, 400
p=0.013, m=-1.032), and frames of bees (F=39.73, p<0.001, m=24.94) significantly 401
increased brood quantity, while brood quality (F=84.78, p<0.001, m=-4.24) 402
significantly decreased brood quantity. 403
Brood quantity (F=84.78, p<0.001, m=-0.094) significantly decreased brood 404
quality, while Varroa mite infestation level (F=8.92, p=0.003, m=0.529) significantly 405
increased brood quality, and the model yielded an R2 of 0.604. 406
Varroa mite infestation was significantly influenced by treatment (F=5.51, 407
p=0.005, mTreat2=5.63, mTreat3=2.35), and significantly increased with day (F=6.52, 408
p=0.012, m=0.0747), and significantly decreased with brood quality (F=8.92, 409
p=0.003, m=0.122) and weight (F=6.96, p=0.009, m=-0.285). The mite model 410
yielded an R2 of 0.408. 411
Pollen collection rate was significantly increased with day (F=16.82, 412
p<0.001, m=0.391) and queen retention (F=13.36, p<0.001, m=104.8) with a 413
model R2 of 0.343. 414
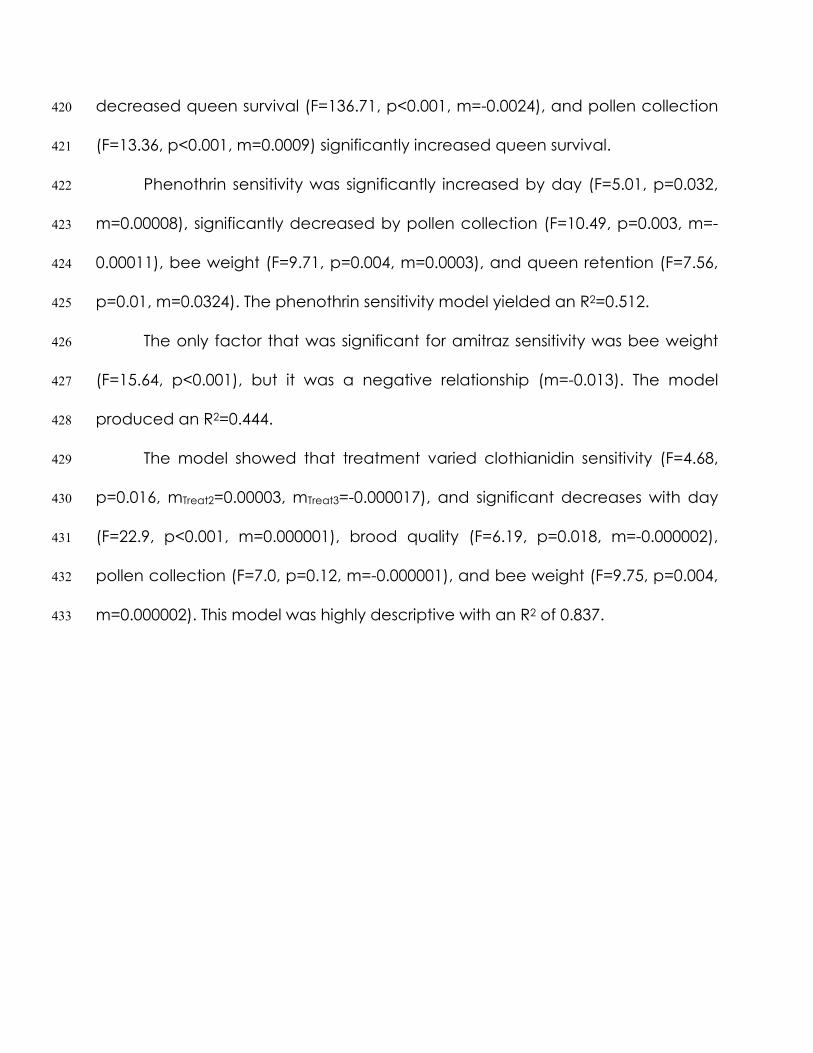
The model for honey bee weight (R2=0.143) varied by treatment (F=3.82, 415
p=0.024, mTreat2=0.44, mTreat3=-4) and significantly decreased with mite infestation 416
level (F=6.96, p=0.009, m=-0.179). 417
Queen loss was well described by the model (R2=0.711) with treatment 418
varied (F=30.36, p<0.001, mTreat2=-0.041, mTreat3=-0.147), day significantly 419
decreased queen survival (F=136.71, p<0.001, m=-0.0024), and pollen collection 420
(F=13.36, p<0.001, m=0.0009) significantly increased queen survival. 421
Phenothrin sensitivity was significantly increased by day (F=5.01, p=0.032, 422
m=0.00008), significantly decreased by pollen collection (F=10.49, p=0.003, m=-423
0.00011), bee weight (F=9.71, p=0.004, m=0.0003), and queen retention (F=7.56, 424
p=0.01, m=0.0324). The phenothrin sensitivity model yielded an R2=0.512. 425
The only factor that was significant for amitraz sensitivity was bee weight 426
(F=15.64, p<0.001), but it was a negative relationship (m=-0.013). The model 427
produced an R2=0.444. 428
The model showed that treatment varied clothianidin sensitivity (F=4.68, 429
p=0.016, mTreat2=0.00003, mTreat3=-0.000017), and significant decreases with day 430
(F=22.9, p<0.001, m=0.000001), brood quality (F=6.19, p=0.018, m=-0.000002), 431
pollen collection (F=7.0, p=0.12, m=-0.000001), and bee weight (F=9.75, p=0.004, 432
m=0.000002). This model was highly descriptive with an R2 of 0.837. 433
DISCUSSION 434
Honey bee colony health are complex and dynamic manifestations of an 435
increasingly nuanced summation of biotic and abiotic factors [19]. 436
Understanding the interactions of these factors that promote colony health is of 437
utmost importance to the $20B in the commercial pollination industry in the US 438
[20]. 439
The results of the single-potency bioassays demonstrate the influence of 440
Varroa mite infestation levels on insecticide sensitivity and the need to control 441
for factors that can affect bioassay results and interpretation. The >2-fold 442
difference in Varroa mite infestation levels between honey bees collected from 443
the colony or from newly emerged adult bees is expected as newly emerged 444
adults are more likely to harbor Varroa mites that parasitize the larval and pupal 445
stages. Upon emergence, Varroa mites may disassociate from the infested adult 446
and attach to other adults in the colony, thereby diluting the Varroa mite 447
infestation levels measured from bees of various age and behavioral state within 448
colony as in commonly used methods to collect bees to measure Varroa mite 449
infestation. Measuring Varroa mite infestation levels from newly emerged adults 450
may be a more accurate method when using those bees in bioassays 451
according to our method as the significant relationship of naled sensitivity with 452
Varroa mite infestation level would have been overlooked using calculations 453
from colony-collected bees. 454
While mite infestation affects bioassay mortality, the fact that Varroa 455
infestation levels were also correlated with control mortality has toxicological 456
and practical implications. Control mortality needs to be accounted for in 457
bioassays to accurately assess insecticide induced mortality [18]. Measurements 458
of insecticide potency in bioassays with high levels of control mortality are 459
statistically challenging and toxicologically questionable [21]. From a practical 460
standpoint, for every Varroa mite/100 bees, there is a corresponding 1.5% 461
increase in mortality of 4-day old bees. This is important to note as Varroa mite 462
infestation levels are highest in the fall and honey bee reproduction is declining. 463
This finding may help explain why Varroa mite infestation has their most 464
profound effects on colony health late in the season and overwinter. 465
Varroa mite infestation effects on the sensitivity to naled and imidacloprid, 466
but not phenothrin are curious. The slopes of the increased mortality for naled 467
and imidacloprid with higher Varroa mite infestation levels are identical, 468
suggesting a uniform mechanism of increased insecticide sensitivity to these two 469
classes of insecticides with distinctly different modes of action, target sites, and 470
detoxification pathways [22,23]. The reduction in weight [8,9], lower vitellogenin 471
levels [10], and decrease expression of detoxification enzymes [13] with Varroa 472
mite infestation may explain this shared increase in sensitivity to naled and 473
imidacloprid. However, the fact that Varroa mite infestation did not affect 474
phenothrin sensitivity demonstrates this possible mechanism of increased 475
sensitivity is not universal to all insecticides. 476
We found that Varroa mite infestation levels increased sensitivity in 477
discriminating potency bioassays but not in the seasonal mite management. This 478
discrepancy may have arisen because the two measures of sensitivity we used 479
in these two experiments are conceptually divergent. In the discriminating 480
potency bioassays, a single treatment yielded a range of mortalities that was 481
regressed against Varroa mite infestation levels treated as a continuous, 482
untransformed variable, while in the seasonal mite management experiments, 483
multiple concentrations yielded mortality that was converted to probits and 484
regressed against the logarithm of the insecticide concentration. Therefore, 485
there is a fundamental difference in the kinds of data generated between these 486
experiments. There are more chances for type II error when using discriminating 487
potency bioassays as variation increases at insecticide concentrations that are 488
above or below the LD50/LC50 as the those values have the least amount of 489
variation by definition [21]. Furthermore, populations may have similar LD50/LC50 490
values, but concentrations above and below LD50/LC50 values may produce 491
dramatically different mortalities due to the slope of the line. For example, in the 492
seasonal mite management experiment, the control group had the exact same 493
LD50 for phenothrin in both May and June, but the slopes were very different 494
(Table 1). Therefore, if we used the LD20 to compare these groups rather than 495
the LD50, the LD20 for the control group in May (0.21 (0.11-0.28 95% CI) ng 496
phenothrin/mg bee) and June (0.34 (0.32-0.36 95% CI) ng phenothrin/mg bee) 497
would be significant different by approximately 60%. While using concentrations 498
besides the LD50/LC50 values to compare populations may be statistically 499
unsatisfying, it may be useful to accurately determine the maximum sublethal 500
concentration when comparing sublethal effects between populations as 501
opposed to simply using a dose or concentration that is arbitrarily lower than the 502
LD50/LC50 values. 503
The practical implications of the increased insecticide sensitivity with 504
Varroa mite infestations as measured in our discriminating potency bioassays are 505
likely to be minimal. The use of organophosphates in general are being greatly 506
reduced [24] and naled specifically is usually applied by aircraft to control 507
mosquito populations only in the event of a regional outbreak of mosquito-508
borne disease (Randy Vaeth, personal communication). Exposure to 509
neonicotinoids (i.e. imidacloprid, clothianidin) typically occurs by encounters 510
with dust emitted from planters depositing neonicotinoid treated seed in late 511
April [25] or when corn and soy shed pollen in July [26], which is separated in 512
time from peak Varroa infestation levels in October. Furthermore, neonicotinoids 513
in honey bee colonies are typically found very infrequently and at very low 514
concentrations [17,27,28], far below the concentration we used in our single-515
potency bioassays. The fact that insecticide sensitivity was not correlated with 516
Varroa mite infestation levels in our seasonal mite management experiments 517
validates the assertion of minimal practical impacts. 518
While our seasonal mite management experiments were terminated in 519
October, we originally planned to continue our experiments through December. 520
However, the control and IPM colonies in October displayed a high frequency 521
of overt symptoms of deformed wing virus (DWV) and chronic bee paralysis virus 522
(CBPV), presumably due to high mite infestation rates in those treatment groups. 523
Although viral titers were not measured, the high prevalence of infection 524
leading to poor adult emergence would have confounded our bioassay results, 525
especially in the case of amitraz bioassays in the IPM group in October. We did 526
not use any colonies that had a high prevalence of virus-mediated symptoms. 527
Future experiments to assess insecticide sensitivity in bees of known virus 528
infection rates will determine possible interactions of these factors. 529
The difference in the colony growth dynamics was somewhat 530
unexpected. The control and IPM groups followed normal colony growth 531
dynamics with a stable rise and slight drop off late in the year [29]. The linear 532
increase in the number of frames of bees in the amitraz group suggested that 533
the amitraz treatment released those colonies from the seasonal factors that 534
slow or inhibit colony growth. This is probably due to reduced mite pressure or 535
possibly an octopaminergic pathway. Octopamine levels in honey bee brains 536
decrease after peaking early in the summer [30], which is correlated with colony 537
size over that time. However, a causal relationship between octopamine levels 538
and colony population levels remains unresolved. It is possible that amitraz may 539
inhibit the signal to slow colony growth over time because although mite 540
infestation levels were lower in the amitraz treatment group, they are not a 541
significant factor in determining the number of frames of bees. While the IPM 542
treatment had less frames of bees than the control and amitraz treatment 543
groups in May and June, this was the result of ensuring the colonies were 544
distributed among groups with equal mite infestation rate as this was the major 545
hypothesis being tested. 546
Much like frames of bees, the age of the colony, frames of bees, and 547
brood quality scores were significant determinants of brood quantity. Despite 548
the potential collinearity of these variables, none of them could be excluded 549
from the model with the as the Variable Inflation Factors (VIF) never exceeded 550
3.5 for any factor in any model. 551
Spotty brood patterns are a tell-tale symptom of high levels of mite 552
infestation [31]. In our experiments, mite infestation level was a significant factor 553
in determining brood quality, demonstrating that mite infestation leads to 554
patchier brood patterns despite not affecting overall brood quantity. 555
The differences in Varroa mite infestation level between treatments 556
showed that amitraz has a significant impact on mite populations compared to 557
control and IPM treatments. The control and IPM colonies reached Varroa mite 558
infestation levels by September of 21.2 and 9.5 Varroa mites/100 bees, 559
respectively, that are strong indications that those colony will die out [32,33]. The 560
screened bottom boards and powdered sugar treatments administered in the 561
IPM treated group were not adequate to suppress mite levels that were different 562
than control measures. IPM treatment did slow the rate of Varroa mite 563
infestation in August and September to the point where it was not statistically 564
different from the amitraz treatment. However, the IPM treatment did not stop 565
the dramatic increase in Varroa mite infestation so that in October the IPM 566
treatment produced the highest Varroa mite infestation levels seen in the 567
experiment. These findings are largely in line with previous reports that IPM 568
measures provide limited effectiveness at controlling Varroa mite populations at 569
the colony level through the season [34,35]. Drone brood trapping was likely to 570
not very effective in our treatment scheme because very little drone brood 571
(<200 capped drone cells/comb) was present at any time it was removed from 572
the colony. Other studies of drone brood trapping in reducing Varroa mite 573
infestation levels were effective when large number of drone brood were 574
removed (>7000 capped drone cells [36], >3000 cells [37]). The lack of 575
consistently efficacious and easily administered IPM techniques results in an 576
increased emphasis on chemical control in colonies headed by non-hygienic 577
queens. It is likely that Varroa mite suppression by amitraz treatment would have 578
been enhanced if treatment would have been continuous throughout the year. 579
The gap between amitraz treatments (to mimic a honey harvest) allowed for the 580
mite population to rebound dramatically. For practical purposes concerning 581
managing mites with chemical means, the beekeeper may have to balance 582
taking a honey crop with colony survival. The current Apivar® label limits 583
application to 2 treatments annually with a 56 day maximum treatment interval. 584
Amendment of the Apivar® label to allow uninterrupted, year round, treatment 585
would very likely improve product effectiveness in the short term. However, a 586
constant treatment regime would also increase selection pressure for amitraz 587
resistance in Varroa mites. The loss of effective amitraz treatments to control 588
Varroa mites is a disconcerting prospect due to the low rate of product 589
development to specifically and effectively control Varroa mites. 590
Queen loss was significantly higher in the control group compared to the 591
amitraz and IPM group. It is likely this difference is due to the differences in 592
queen establishment between the treatment groups with all the queens 593
surviving initially in the control group in May and June. Excluding those time 594
points, the amitraz treatment experiences significantly less queen loss than both 595
the control and IPM treatment. While it is highly probable that reduced mite 596
pressure shortens the life span of the queen, this result seems to suggest that 597
octopamine may play a role on queen longevity, which is largely dominated by 598
biochemical pathways involving insulin-like peptides, juvenile hormone, and 599
vitellogenin [38]. The significance of treatment type is curious because 600
treatment was a significant factor in mite levels and weight, but both of those 601
factors were not significant factors to explain queen loss. Queen loss was 602
significantly negatively correlated with pollen collection rate. Pollen collection 603
rate is typically driven by brood quantity [39] and brood pheromone [40]. The 604
presence of a queen or queen pheromone such as 9-oxodecenoic acid 605
stimulate nectar foraging, but not pollen foraging [41]. The influence of the 606
queen on pollen collection is transitive via brood deposited by the queen [42]. 607
However, there was no relationship between brood quantity and queen 608
survivorship in our model, which was highly descriptive. The fact that queen loss 609
was significantly affected by treatment, day, and pollen collection rate 610
underscore the manner in which external factors influence queen longevity. 611
Worker bee weight was significantly influenced by treatment and mite 612
infestation level, with those two factors having already been established as 613
significantly interacting. The influence of mite infestation on bee weight has 614
been previously demonstrated. For example, drone brood with 1-3 mites per 615
pupa significantly reduced pupal weight by the red eye stage as well as smaller 616
adult drones compared to uninfested pupae. In cases of extreme Varroa mite 617
infestation of 20 mites per pupae, newly emerged adult drones were 50% lighter 618
than adults from uninfested pupae [8]. In addition to weight, Varroa infestation 619
levels also reduced protein and carbohydrate concentrations [9] as well as 620
vitellogenin titers [10] in newly emerged workers. 621
The fungicide chlorothalonil is commonly found at high concentrations in 622
wax and pollen [17]. This frequent and copious detection of chlorothalonil may 623
be concerning because at concentrations of 34 mg/L (i.e. 34,000 ppb), 624
chlorothalonil results in >50% mortality to 6-day old honey bee larvae in chronic 625
toxicity bioassays and synergizes toxicity of fluvalinate and coumaphos at low 626
concentrations [43]. Chlorothalonil was unable to kill adult bees under our 627
experimental conditions. Despite chlorothalonil treatment of 100 ug/bee, this 628
dose was below the reported LD50 of 181 ug/bee for chlorothalonil from the EPA-629
OPP Pesticide Ecotoxicity Database 630
(http://www.ipmcenters.org/Ecotox/Details.cfm?RecordID=29837). It is important 631
to note that this LD50 is presented without slope or confidence intervals, so its 632
quality as a reference value is reasonably questionable. Although high 633
concentrations of chlorothalonil were associated with entombed pollen (~1300 634
ppb), there were no effects of entombed pollen with high concentration of 635
chlorothalonil on adult bee survivorship or larval growth [44]. It is important to 636
note that chlorothalonil concentrations the study by vanEnglesdorp et al. were 637
10-fold lower than the study of Zhu et al. showing high larval mortality. The 638
concentration found in entombed pollen also is near the mean concentration 639
of chlorothalonil found in pollen within colonies (1593 ppm [17]). Therefore, it 640
seems chlorothalonil poses very little hazard to adult bees, but may be 641
detrimental to larvae at unusually high concentrations. 642
As classical toxicological principals would predict, weight was a significant 643
factor in determining insecticide sensitivity in all cases. However, mite infestation 644
level was not. This incongruence is surprising considering the highly significant 645
interaction of weight and mite infestation levels in our model. A further 646
confounding issue is that mite infestation causes the downregulation of 647
cytochrome P450 monooxygenases [13,45] that are involved in detoxification of 648
insecticides such as pyrethroids and neonicotinoids [46,47]. In the case of 649
amitraz, sensitivity increased with an increase in body weight, which is 650
counterintuitive. While this is an unusual observation, there was a negative 651
correlation between body size and abamectin and -cypermethrin in the 652
oriental fruit fly, Bactrocera dorsalis [48]. 653
There was a significant influence of date in the sensitivity of honey bees to 654
phenothrin and clothianidin, but not amitraz. The positive relationship seen in 655
both cases show that fall bees are less sensitive to insecticides than spring bees. 656
A similar pattern of seasonal sensitivity was seen with sensitivity to diazinon that 657
correlated with cytochrome P450 activity [49]. Since both phenothrin and 658
clothianidin are capable of being detoxified by P450s [14,50,51], it is likely the 659
seasonal variation in P450 activity may underlie the seasonal sensitivity to these 660
insecticides. Amitraz sensitivity does not follow the same seasonal variation 661
presumably due to P450 detoxification because it appears that P450s do not 662
detoxify amitraz in honey bees as the P450 inhibitors piperonyl butoxide (PBO) or 663
prochloraz do not synergize amitraz sensitivity in honey bees [52]. 664
The significant effect of pollen collection on phenothrin and clothianidin 665
sensitivity showed a negative correlation between these factors. This observation 666
is at odds with previous work showing that pollen feeding reduces pesticide 667
sensitivity [53]. However, our experiment was different in that we used 3-day old 668
bees raised on 50% sugar water for 3 days and pollen amount was measured 669
from pollen traps, while the study of Wahl and Ulm used 8-day old bees raised 670
on defined pollen regimes. 671
While clothianidin sensitivity was higher in the amitraz group compared to 672
the control group in September and October, clothianidin sensitivity was also 673
higher in the IPM group compared to the control in those same two months. 674
Taken together, this shows that amitraz treatment did not synergize clothianidin 675
sensitivity. 676
Queen survivorship was another significant factor in phenothrin sensitivity. 677
Colonies headed by queens were less sensitive to phenothrin than queenless 678
colonies. While the interaction of the multitude of queen pheromones have on 679
worker behavior and development have been well documented [54,55], little 680
data exists on the influence of queen pheromone on insecticide sensitivity and 681
detoxification. While the expression of cytochrome P450s CYP4AA1, CYP4G11, 682
and CYP18A1 are not increased by queen presence [56], those enzymes are 683
involved in caste-specific fatty acid hydroxylation or chemoreception and not 684
detoxification. The possible influence of queens on insecticide sensitivity is 685
particularly concerning as queen longevity is typically less than 1 year in many 686
commercial operations and queen losses are the most often cited factor in 687
colony losses [2,57]. 688
This study highlights how many real world practices can affect insecticide 689
sensitivity. These results underscore the difficulty in comparing results of honey 690
toxicology from study to study due to the difficulty in controlling all these 691
variables. As our, and many other studies show, Varroa mites are the major 692
factor affecting colony health and losses. The fact that amitraz strips were a 693
significantly more effective method of controlling Varroa mite than the IPM 694
measures we implemented ensures amitraz will be used more intensely in the 695
short term. Overuse of this product will undoubtedly select for amitraz resistant 696
Varroa mites, thus ensuring the loss of highly effective mite management tool. 697

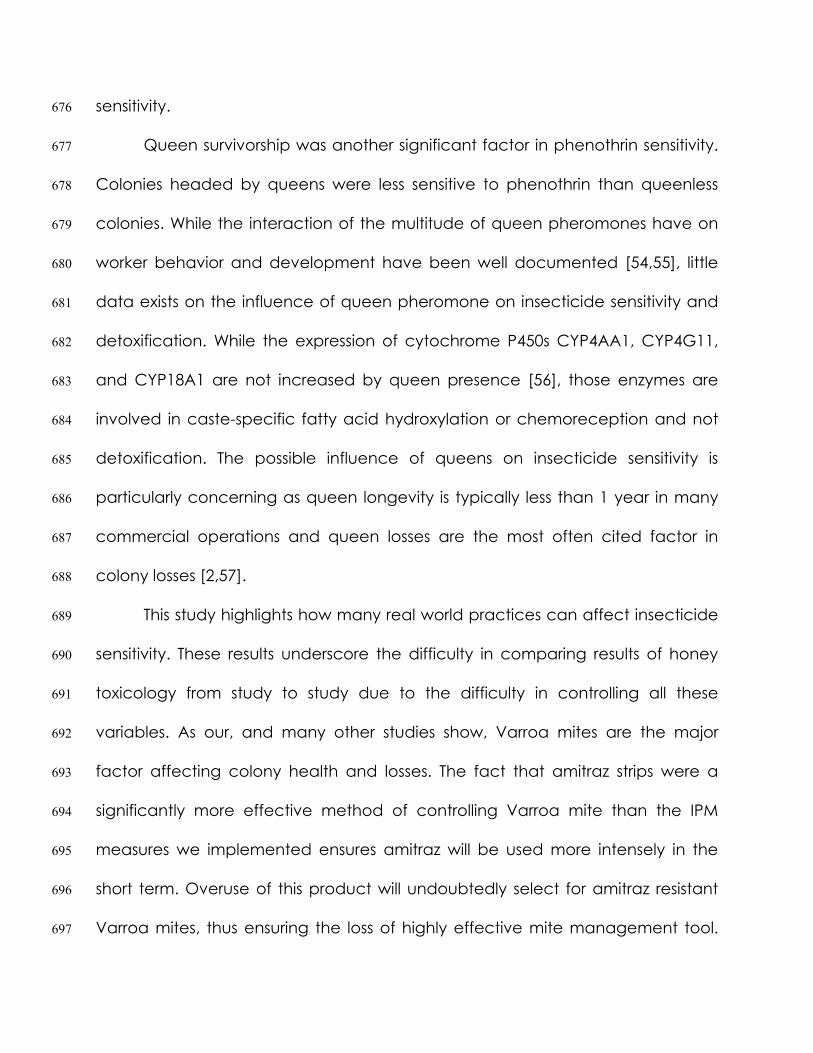
Use of Varroa-resistant bees (i.e. Varroa-Sensitive Hygienic (VSH) bees) [58,59] 698
and development of novel, more consistently effective, non-chemical Varroa 699
mite control will likely be long term, sustainable colony management practices. 700
ACKNOWLEDGEMENTS 701
We would like to thank Dave Dodge, Victor Rainey, and Dan Winfrey at 702
USDA-ARS Honey Bee Breeding, Genetics, and Physiology Laboratory for colony 703
maintenance and data collection and Nick Delisi, Vivek Pohkrel, and Jean 704
Pittman at Louisiana State University for assistance with bioassays. This research 705
was funded by a grant from the National Honey Board to Frank Rinkevich and 706
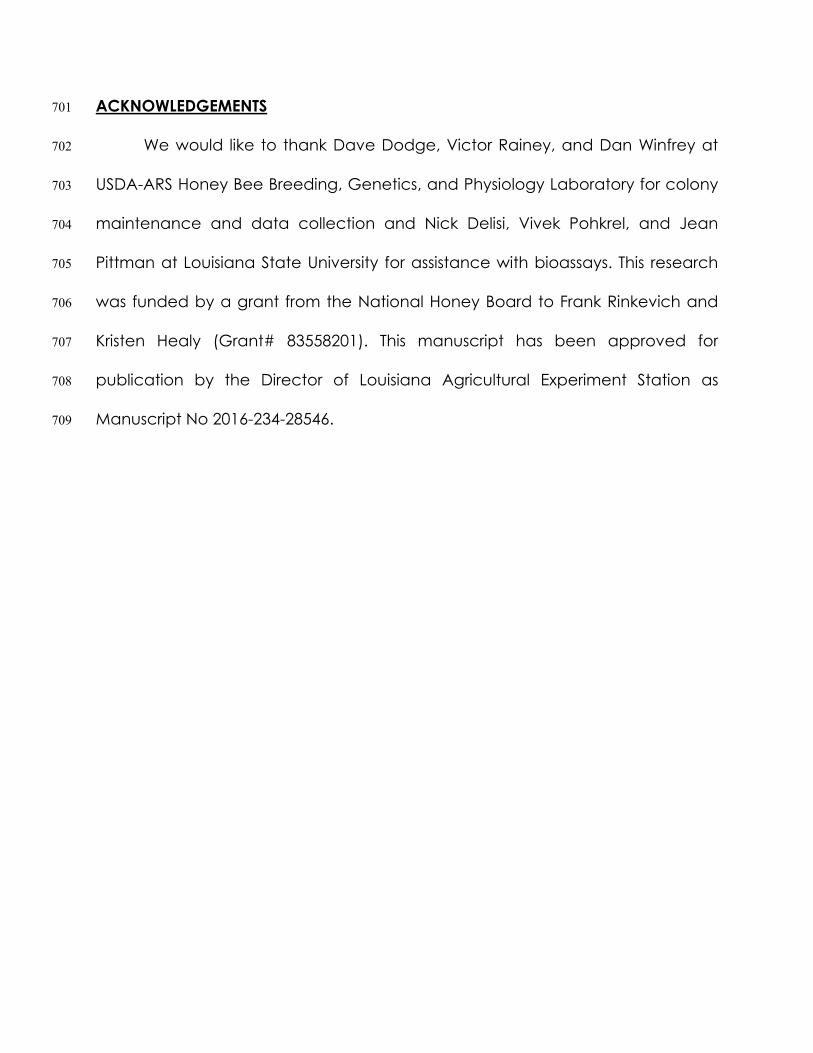
Kristen Healy (Grant# 83558201). This manuscript has been approved for 707
publication by the Director of Louisiana Agricultural Experiment Station as 708
Manuscript No 2016-234-28546. 709
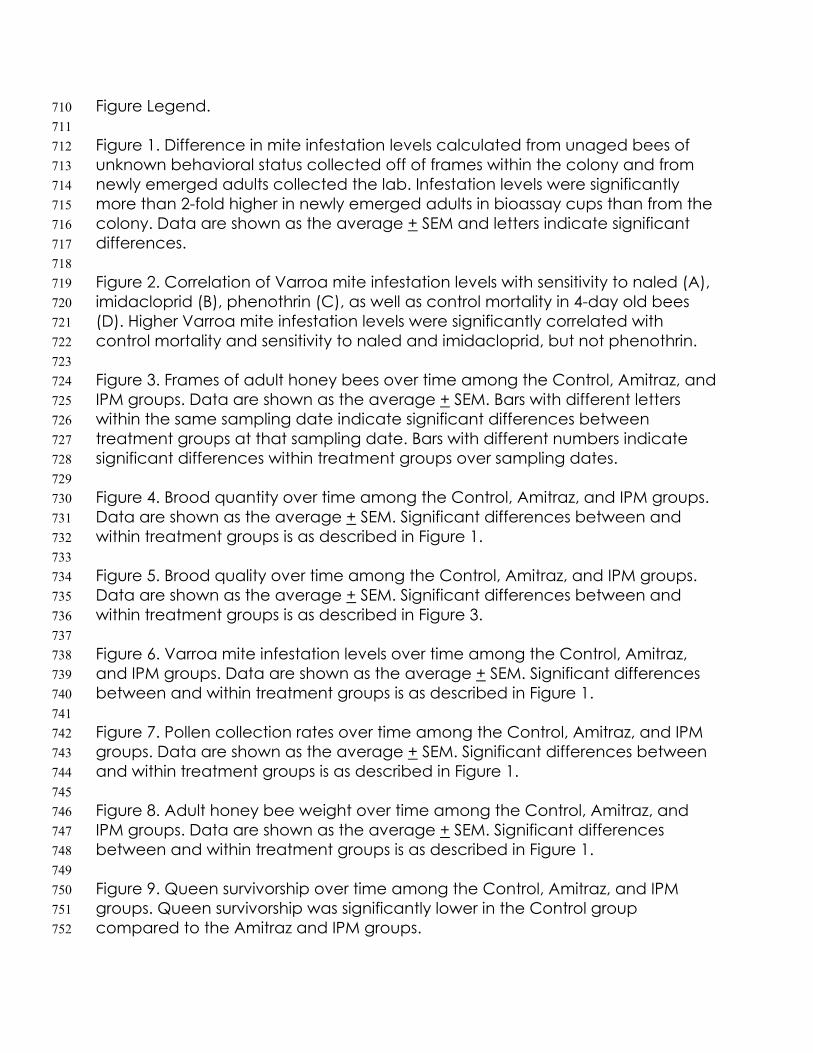
Figure Legend. 710
711
Figure 1. Difference in mite infestation levels calculated from unaged bees of 712
unknown behavioral status collected off of frames within the colony and from 713
newly emerged adults collected the lab. Infestation levels were significantly 714
more than 2-fold higher in newly emerged adults in bioassay cups than from the 715
colony. Data are shown as the average + SEM and letters indicate significant 716
differences. 717
718
Figure 2. Correlation of Varroa mite infestation levels with sensitivity to naled (A), 719
imidacloprid (B), phenothrin (C), as well as control mortality in 4-day old bees 720
(D). Higher Varroa mite infestation levels were significantly correlated with 721
control mortality and sensitivity to naled and imidacloprid, but not phenothrin. 722
723
Figure 3. Frames of adult honey bees over time among the Control, Amitraz, and 724
IPM groups. Data are shown as the average + SEM. Bars with different letters 725
within the same sampling date indicate significant differences between 726
treatment groups at that sampling date. Bars with different numbers indicate 727
significant differences within treatment groups over sampling dates. 728
729
Figure 4. Brood quantity over time among the Control, Amitraz, and IPM groups. 730
Data are shown as the average + SEM. Significant differences between and 731
within treatment groups is as described in Figure 1. 732
733
Figure 5. Brood quality over time among the Control, Amitraz, and IPM groups. 734
Data are shown as the average + SEM. Significant differences between and 735
within treatment groups is as described in Figure 3. 736
737
Figure 6. Varroa mite infestation levels over time among the Control, Amitraz, 738
and IPM groups. Data are shown as the average + SEM. Significant differences 739
between and within treatment groups is as described in Figure 1. 740
741
Figure 7. Pollen collection rates over time among the Control, Amitraz, and IPM 742
groups. Data are shown as the average + SEM. Significant differences between 743
and within treatment groups is as described in Figure 1. 744
745
Figure 8. Adult honey bee weight over time among the Control, Amitraz, and 746
IPM groups. Data are shown as the average + SEM. Significant differences 747
between and within treatment groups is as described in Figure 1. 748
749
Figure 9. Queen survivorship over time among the Control, Amitraz, and IPM 750
groups. Queen survivorship was significantly lower in the Control group 751
compared to the Amitraz and IPM groups. 752
Table 1. Honey bee phenothrin bioassay summary. The LD50 values are in shown in units of ng phenothrin/mg bee. Letters and numbers beside LD50 753 values indicate significant differences in rows and columns, respectively. 754 755 Control Amitraz IPM Month n LD50 (95% CI) Slope (SE) n LD50 (95% CI) Slope (SE) n LD50 (95% CI) Slope (SE) May 308 0.45 (0.35-0.52)a123 2.6 (0.4) 239 0.48 (0.45-0.52)a1 6.4 (0.7) 229 0.47 (0.32-0.57)a123 3.1 (0.6) June 489 0.45 (0.42-0.46)a13 7.2 (0.5) 576 0.42 (0.40-0.44)a2 7.6 (0.5) 531 0.32 (0.29-0.34)b3 5.8 (0.6) July 448 0.41 (0.38-0.43)a1 5.3 (0.5) 374 0.43 (0.40-0.48)a12 3.7 (0.5) 329 0.45 (0.41-0.49)a1 5.0 (0.6) August 383 0.33 (0.29-0.35)b2 4.7 (0.6) 303 0.50 (0.46-0.54)a1 4.8 (0.6) 543 0.35 (0.34-0.38)b2 4.7 (0.4) September 297 0.48 (0.45-0.51)a3 7.3 (0.7) 252 0.42 (0.39-0.45)b12 6.3 (0.7) 284 0.47 (0.44-0.50)ab1 6.7 (0.7) October 362 0.41 (0.37-0.44)a1 4.3 (0.6) 464 0.34 (0.31-0.36)b3 4.8 (0.5) 73 0.43 (0.31-0.52)ab123 4.7 (1.4) 756 757 Table 2. Honey bee amitraz bioassay summary. The LD50 values are in shown in units of ng amitraz/mg bee. Letters and numbers in beside LD50 values 758 indicate significant differences in rows and columns, respectively. The LD50 value for the IPM treatment group in October was not reported as the 759 data were not well represented by a line. 760 761 Control Amitraz IPM Month n LD50 (95% CI) Slope (SE) n LD50 (95% CI) Slope (SE) n LD50 (95% CI) Slope (SE) May 373 20.0 (18.4-21.8)b3 4.9 (0.4) 339 17.6 (15.8-19.6)b5 3.7 (0.3) 320 27.1 (24.7-29.7)a4 4.2 (0.4) June 380 59.4 (51.5-72.9)a1 3.4 (0.4) 416 33.7 (31.1-36.6)b23 4.1 (0.4) 368 46.8 (42.0-53.5)a12 3.5 (0.4) July 429 20.1 (18.5-21.9)a3 4.2 (0.3) 238 19.5 (17.6-21.8)a5 5.0 (0.5) 218 18.4 (16.3-20.9)a3 4.4 (0.5) August 324 23.8 (19.9-28.5)ab3 2.2 (0.3) 328 25.3 (22.7-28.1)a4 3.5 (0.3) 568 18.5 (16.7-20.5)b3 2.6 (0.2) September 327 60.6 (55.7-65.8)a1 4.3 (0.5) 180 41.0 (35.8-46.1)b123 4.0 (0.6) 255 36.4 (31.1-41.2)b2 4.0 (0.5) October 321 30.6 (28.5-32.3)b2 9.1 (1.3) 350 42.4 (38.9-46.3)a12 4.4 (0.5) NA NA NA 762 763 Table 3. Honey bee clothianidin bioassay summary. The LC50 values are in shown in units of ng clothianidin/mL/mg bee. Letters and numbers in 764 beside LD50 values indicate significant differences in rows and columns, respectively. 765 766 Control Amitraz IPM Month n LC50 (95% CI) Slope (SE) n LC50 (95% CI) Slope (SE) n LC50 (95% CI) Slope (SE) May 308 1.12 (0.78-1.43)b3 2.4 (0.3) 269 0.48 (0.09-0.93)b4 1.5 (0.3) 293 2.78 (2.37-3.16)a1 4.0 (0.5) June 280 0.81 (0.51-1.10)a3 1.9 (0.3) 460 0.35 (0.09-0.64)ab4 1.2 (0.2) 479 0.07 (0.001-0.25)b5 1.0 (0.2) July 357 1.20 (1.07-1.37)a3 3.3 (0.3) 253 1.14 (1.04-1.28)a3 5.6 (0.7) 276 1.39 (1.22-1.65)a34 3.7 (0.4) August 325 2.19 (1.95-2.49)ab2 3.7 (0.4) 287 2.47 (2.24-2.71)a1 5.8 (1.0) 416 1.97 (1.81-2.15)b23 4.5 (0.4) September 370 3.25 (2.94-3.55)a1 4.3 (0.4) 356 2.29 (1.95-2.62)b1 2.8 (0.3) 340 2.59 (2.23-2.97)ab1 2.6 (0.3) October 296 2.62 (2.33-2.93)a2 4.0 (0.4) 447 1.75 (1.60-1.90)b2 5.3 (0.4) 54 1.60 (0.89-2.04)b234 7.3 (2.2)
LITERATURE CITED 767
1. vanEngelsdorp, D.; Hayes, J.; Underwood, R.M.; Pettis, J. A survey of 768
honey bee colony losses in the us, fall 2007 to spring 2008. PLoS One 769
2008 3, e4071. 770
2. Steinhauer, N.A.; Rennich, K.; Wilson, M.E.; Caron, D.M.; Lengerich, 771
E.J.; Pettis, J.; Rose, R.; Skinner, J.A.; Tarpy, D.R.; Wilkes, J.T., et al. A 772
national survey of managed honey bees 2012-2013 annual colony 773
losses in the USA: Results from the bee informed partnership. J. Apic. 774
Res. 2014, 53, 1-18. 775
3. Finley, J.; Camazine, S.; Frazier, M. The epidemic of honey bee 776
colony losses during the 1995-1996 season. Am. Bee J. 1996, 136, 777
805-808. 778
4. Siede, R.; Konig, M.; Buchler, R.; Failing, K.; Thiel, H.J. A real-time pcr 779
based survey on acute bee paralysis virus in german bee colonies. 780
Apidologie 2008, 39, 650-661. 781
5. Gregory, P.G.; Evans, J.D.; Rinderer, T.; de Guzman, L. Conditional 782
immune-gene supression of honeybees parasitized by varroa mites. 783
J. Ins. Sci. 2005, 5, 7-11. 784
6. Yang, X.; Cox-Foster, D.L. Impact of an ectoparasite on the 785
immunity and pathology of an invertebrate: Evidence for host 786
immunosuppression and viral amplification. PNAS 2005, 102, 7470-787
7475. 788
7. Navajas, M.; Migeon, A.; Alaux, C.; Martin-Magniette, M.L.; 789
Robinson, G.E.; Evans, J.D.; Cros-Arteil, S.; Crauser, D.; Le Conte, Y. 790
Differential gene expression of the honey bee apis mellifera 791
associated with varroa destructor infection. BMC Genomics 2008, 9, 792
301-311. 793
8. Duay, P.; De Jong, D.; Engels, W. Weight loss in drone pupae (apis 794
mellifera) multiply infested by varroa destructor mites. Apidologie 795
2003, 34, 61-65. 796
9. Bowen-Walker, P.L.; Gunn, A. The effect of the ectoparasitic mite, 797
varroa destructor, on adult worker honey bee (apis mellifera) 798
emergence weights, water, protein, carbohydrate, and lipid levels. 799
Entomologia Experimentalis et Applicata 2001, 101, 207-217. 800
10. Amdam, G.V.; Hartfelder, K.; Norberg, K.; Hagen, A.; Omholt, S.W. 801
Altered physiology in worker honey bees (hymenoptera: Apidae) 802
infested with the mite varroa destructor (acari: Varroaidae): A 803
factor in colony loss during overwintering? J. Econ. Entomol. 2004, 804
97, 741-747. 805
11. Seehuus, S.C.; Norberg, K.; Gimsa, U.; Krekling, T.; Amdam, G.V. 806
Reproductive protein protects functionally sterile honey bee workers 807
from oxidative stress. PNAS 2005, 103, 962-967. 808
12. Dahlgren, L.; Johnson, R.M.; Siegfried, B.D.; Ellis, M.D. Comparative 809
toxicity of acaricides to honey bee (hymenoptera: Apidae) workers 810
and queens. J. Econ. Entomol. 2012, 105, 1895-1902. 811
13. Alaux, C.; Dantec, C.; Parrinello, H.; Le Conte, Y. Nutrigenomics in 812
honey bees: Digital gene expression analysis of pollen's nutritive 813
effects on healthy and varroa-parasitized bees. BMC Genomics 814
2011, 12, 496-508. 815
14. Rinkevich, F.D.; Margotta, J.W.; Pittman, J.M.; Danka, R.G.; Tarver, 816
M.R.; Ottea, J.A.; Healy, K.B. Genetics, synergists, and age affect 817
insecticide sensitivity in the honey bee, apis mellifera. PLoS One 818
2015, 10, e0139841. 819
15. Imdorf, A.; Buehlmann, G.; Gerig, L.; Kilchenmann, V.; Willie, H. A test 820
of the method of estimation of brood areas and number of worker 821
bees in free flying colonies. Apidologie 1987, 18, 137-146. 822
16. Delaplane, K.S.; van der Steen, J.J.M.; Guzman-Novoa, E. Standard 823
methods for estimating strength parameters of apis mellifera 824
colonies. J. Apic. Res. 2013, 52, 1-12. 825
17. Mullin, C.A.; Frazier, M.; Frazier, J.L.; Ashcraft, S.; Simonds, R.; 826
vanEngelsdorp, D.; Pettis, J.S. High levels of miticides and 827
agrochemicals in north american apiaries: Implications for honey 828
bee health. PLoS ONE 2010, 5, e9754. 829
18. Abbott, W.S. A method of computing the effectiveness of an 830
insecticide. J. Econ. Entomol. 1925, 18, 265-267. 831
19. vanEngelsdorp, D.; Meixner, M.D. A historical review of managed 832
honey bee populations in europe and the united states and the 833
factors that may affect them. J. Invert. Pathol. 2010, 103, S80-S95. 834
20. Gallai, N.; Salles, J.M.; Settele, J.; Vaissiere, B.E. Economic valuation 835
of the vulnerability of world agriculture confronted with pollinator 836
decline. Ecol. Econ. 2009, 68, 810-821. 837
21. Robertson, J.L.; Preistler, H.K. Pesticide bioassays with arthopods. 838
CRC Press: Boca Raton, FL, 1992; p 127. 839
22. Casida, J.E.; Durkin, K.A. Neuroactive insecticides:Targets,selectivity, 840
resistance, and secondary effects. Annu. Rev. Entomol. 2013, 58, 99-841
117. 842
23. Jeschke, P.; Nauen, R. Neonicotinoid insecticides. In 843
Comprehensive molecular insect science, Gilbert, L.I.; Iatrou, K.; Gill, 844
S.S., Eds. Elsevier: New York, 2005; Vol. 5, pp 53-105. 845
24. Jeschke, P.; Nauen, R.; Schindler, M.; Elbert, A. Overview of the 846
status and global strategy for neonicotinoids. Agri. Food Chem. 847
2011, 59, 2897-2908. 848
25. Krupke, C.H.; Hunt, G.J.; Eitzer, B.D.; Andino, G.; Given, K. Multiple 849
routes of pesticide exposure for honey bees living near agricultural 850
fields. PLoS one 2012, 7, e29268. 851
26. Long, E.Y.; Krupke, C.H. Non-cultivated plants present a season-long 852
route of pesticide exposure for honey bees. Nature Comm. 2016, 7. 853
27. Chauzat, M.-P.; Faucon, J.-P.; Martel, A.-C.; Lachaize, J.; Cougoule, 854
N.; Aubert, M. A survey of pesticide residues in pollen loads 855
collected by honey bees in france. J. Econ. Entomol. 2006, 99, 253-856
262. 857
28. Pohorecka, K.; Skubida, P.; Miszczak, A.; Semkiw, P.; Sikorski, P.; 858
Zagibajło, K.; Teper, D.; Kołtowski, Z.; Skubida, M.; Zdańska, D. 859
Residues of neonicotinoid insecticides in bee collected plant 860
materials from oilseed rape crops and their effect on bee colonies. 861
Journal of Apicultural Science 2012, 56, 115-134. 862
29. Mattila, H.R.; Seeley, T.D. Genetic diversity in honey bee colonies 863
enhances productivity and fitness. Science 2007, 317, 362. 864
30. Harris, J.W.; Woodring, J. Effects of stress, age, season, and source 865
colony on levels of octopamine, dopamine, and serotonin in the 866
hone bee (apis mellifera l.) brain. J. Ins. Physiol. 1992, 38, 29-35. 867
31. Snyder, R. Parasitic mite syndrome. 868
https://beeinformed.org/2013/10/15/parasitic-mite-syndrome-pms/ 869
32. Guzman-Novoa, E.; Eccles, L.; Calvete, Y.; McGowan, J.; Kelly, P.G.; 870
Correa-Benitez, A. Varroa destructor is the main culprit for the death 871
and reduced populations of overwintered honey bee (apis 872
mellifera) colonies in ontario, canada. Apidologie 2010, 71. 873
33. Boeking, O.; Genersch, E. Varroosis- the ongoing crisis in bee 874
keeping. J. Verbrauch. Lebensm. 2008, 3, 221-228. 875
34. Berry, J.A.; Afik, O.; Nolan, M.P.; Delaplane, K.S. Revisiting powdered 876
sugar for varroa control on honey bees (apis mellifera l.). J. Apic. 877
Res. 2012, 51, 367-368. 878
35. Calderone, N.W. In A three-year study of screened bottom boards 879
in the northeast, Proceedings of the American Bee Research 880
Conference, 2007; pp 436-437. 881
36. Calderone, N.W. Evaluation of drone brood removal for 882
management of varroa destructor (acari: Varroidae) in colonies of 883
apis mellifera (hymenoptera: Apidae) in the northeastern united 884
states. J. Econ. Entomol. 2005, 98, 645-650. 885
37. Charriere, J.D.; Imdorf, A.; Bachofen, B.; Tschan, A. The removal of 886
capped drone brood: An effective means of reducing the 887
infestation of varroa in honey bee colonies. Bee World 2003, 84, 117-888
124. 889
38. Corona, M.; Velarde, R.A.; Remolina, S.; Moran-Lauter, A.; Wang, Y.; 890
Hughes, K.A.; Robinson, G.E. Vitellogenin, juvenile hormone, insulin 891
signaling, and queen honey bee longevity. PNAS 2007, 104, 7128-892
7133. 893
39. Al-Tikrity, W.S.; Benton, A.W.; HIllman, R.C.; Clark, W.W. The 894
relationship between the amount of unsealed brood in honeybee 895
colonies and their pollen collection. J. Apic. Res. 1972, 11, 9-12. 896
40. Pankiw, T.; Page, R.E.; Fondrk, M.K. Brood pheromone stimulates 897
pollen foraging in honey bees (apis mellifera). Behav. Ecol. 898
Sociobiol. 1998, 44, 193-198. 899
41. Jaycox, E.R. Honey bee queen pheromones and worker foraging 900
bahavior. Annals Entom. Soc. Am. 1970, 63, 222-228. 901
42. Jaycox, E.R. Honey bee foraging behavior: Response to queens, 902
larvae, and extracts of larvae. Annals Entom. Soc. Am. 1970, 63, 903
1689-1694. 904
43. Zhu, W.; Schmehl, D.R.; Mullin, C.A.; Frazier, J.L. Four common 905
pesticides, their mixtures, and a formulation solvent in the hive 906
environment have high oral toxicity to honey bee larvae. PLoS One 907
2014, 9, e77547. 908
44. VanEngelsdorp, D.; Evans, J.D.; Donovall, L.; Mullin, C.; Frazier, M.; 909
Frazier, J.; Tarpy, D.R.; Hayes, J.; Pettis, J. "Entombed pollen": A new 910
condition in honey bee colonies associated with increased risk of 911
colony mortality. J. Invert. Pathol. 2009, 101, 147-149. 912
45. Gregorc, A.; Evans, J.D.; Scharf, M.; Ellis, J.D. Gene expression in 913
honey bee (apis mellifera) larvae exposed to pesticides and varroa 914
mites (varroa destructor). J. Ins. Physiol. 2012, 58, 1042-1049. 915
46. Karunker, I.; Benting, J.; Lueke, B.; Ponge, T.; Nauen, R.; Roditakis, E.; 916
Vontas, J.; Gorman, K.; Denholm, I.; Morin, S. Over-expression of 917
cytochrome p450 cyp6cm1 is associated with high resistance to 918
imidacloprid in the b and q biotypes of bemisia tabaci (hemiptera: 919
Aleyrodidae). Insect Biochem. Molec. Biol. 2008, 38, 634-644. 920
47. Scott, J.G. Cytochromes p450 and insecticide resistance. Insect 921
Biochem. Mol. Biol. 1999, 29, 757-777. 922
48. Lin, Y.; Jin, Y.; Zeng, L.; Lu, Y. Insecticide toxicity to oriental fruit fly 923
bactrocera dorsalis (diptera:Tephrididae) is influenced by 924
environmental factors. J. Econ. Entomol. 2013, 106, 353-359. 925
49. Smirle, M.J.; Winston, M.L. Intercolony variation in pesticide 926
detoxification by the honey bee (hymenoptera: Apidae). J. Econ 927
Entomol. 1987, 80, 5-8. 928
50. Komagata, O.; Kasai, S.; Tomita, T. Overexpression of cytochrome 929
p450 genes in pyrethroid-resistant culex quinquefasciatus. Insect 930
Biochem. Mol. Biol. 2010, 40, 146-152. 931
51. Puinean, A.M.; Denholm, I.; Millar, N.S.; Nauen, R.; Williamson, M.S. 932
Characterisation of imidacloprid resistance mechanisms in the 933
brown planthopper, nilaparvata lugens stål (hemiptera: 934
Delphacidae). Pestic. Biochem. Physiol. 2010, 97, 129-132. 935
52. Johnson, R.M.; Dahlgren, L.; Siegfried, B.D.; Ellis, M.D. Acaricide, 936
fungicide and drug interactions in honey bees (apis mellifera). PLoS 937
One 2013, 8, e54092. 938
53. Wahl, O.; Ulm, K. Influence of pollen feeding and physiological 939
condition on pesticide sensitivity of the honey bee apis mellifera 940
carnica. Oecologia 1983, 59, 106-128. 941
54. Slessor, K.N.; Winston, M.L.; Le Conte, Y. Pheromone communication 942
in the honeybee J. Chem. Ecol. 2005, 31, 2731-2745. 943
55. Le Conte, Y.; Hefetz, A. Primer pheromones in social hymenoptera. 944
Annu. Rev. Entomol. 2008, 53, 523-542. 945
56. Malka, O.; Karunker, I.; Yeheskel, A.; Morin, S.; Hefetz, A. The gene 946
road to royalty – differential expression of hydroxylating genes in the 947
mandibular glands of the honeybee. FEBS Letters 2009, 276, 5481-948
5490. 949
57. Lee, K.V.; Steinhauer, N.A.; Rennich, K.; Wilson, M.E.; Tarpy, D.R.; 950
Caron, D.M.; Rose, R.; Delaplane, K.S.; Baylis, K.; Lengerich, E.J., et al. 951
A national survey of managed honey bee 2013-2014 annual colony 952
losses in the USA. Apidologie 2015, 46, 292-305. 953
58. Harbo, J.R.; Harris, J.W. Responses to varroa by honey bees with 954
different levels of varroa sensitive hygiene. Journal of apicultural 955
research 2009, 48, 156-161. 956
59. Danka, R.G.; Harris, J.W.; Dodds, G.E. Selection of vsh-derived “pol-957
line” honey bees and evaluation of their varroa-resistance 958
characteristics. Apidologie 2015, 1-8. 959
960
0
5
10
15
20
25
30
Colony Mites Cup Mites
Varro
a M
ite In
fest
atio
n Ra
te(m
ites/
100
bees
)
A
B
Fig 1
y = 0.01x + 0.23R² = 0.37
0.0
0.2
0.4
0.6
0.8
1.0
0 10 20 30 40 50
Nal
ed M
orta
lity
Rate
Varroa Mite Infestation Level (#mites/100 bees)Fig 2A
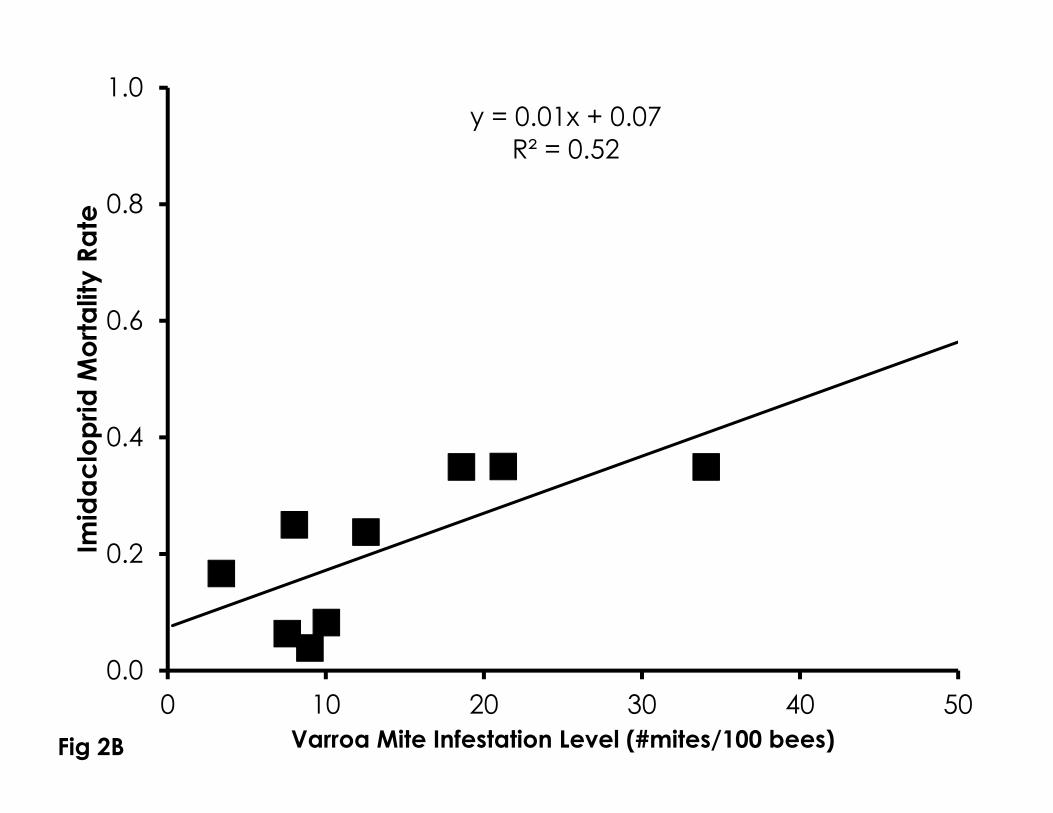
y = 0.01x + 0.07R² = 0.52
0.0
0.2
0.4
0.6
0.8
1.0
0 10 20 30 40 50
Imid
aclo
prid
Mor
talit
y Ra
te
Varroa Mite Infestation Level (#mites/100 bees)Fig 2B
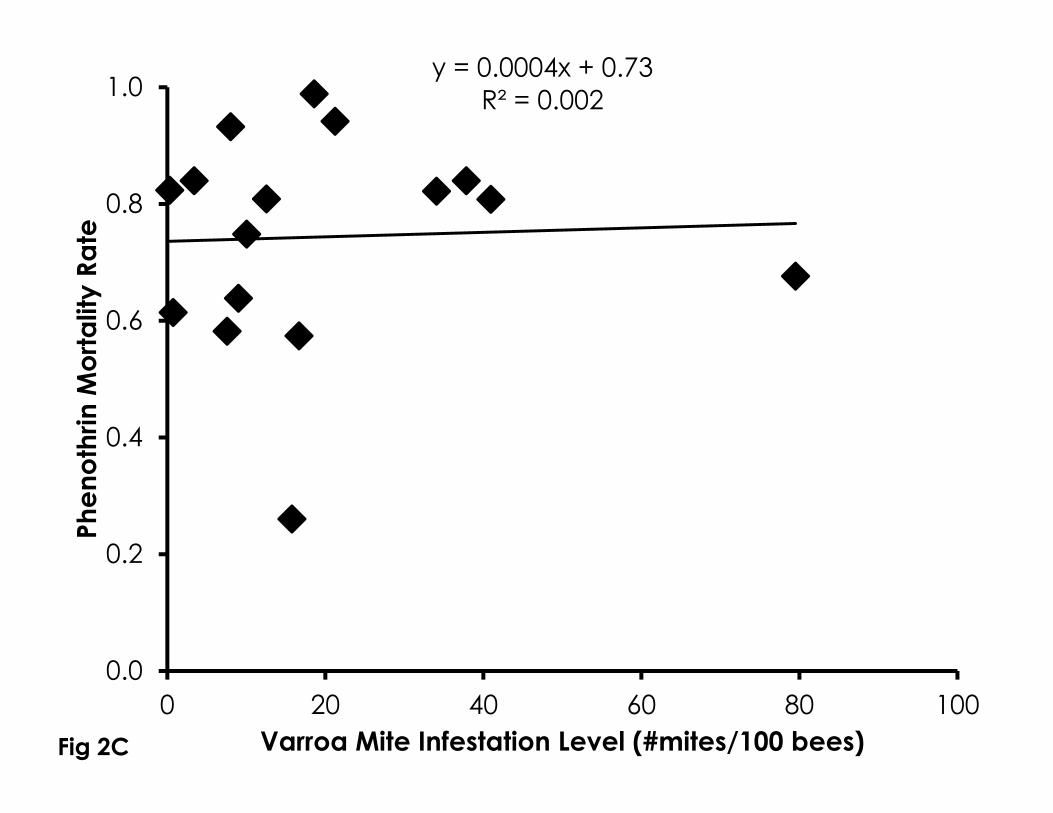
y = 0.0004x + 0.73R² = 0.002
0.0
0.2
0.4
0.6
0.8
1.0
0 20 40 60 80 100
Phen
othr
in M
orta
lity
Rate
Varroa Mite Infestation Level (#mites/100 bees)Fig 2C
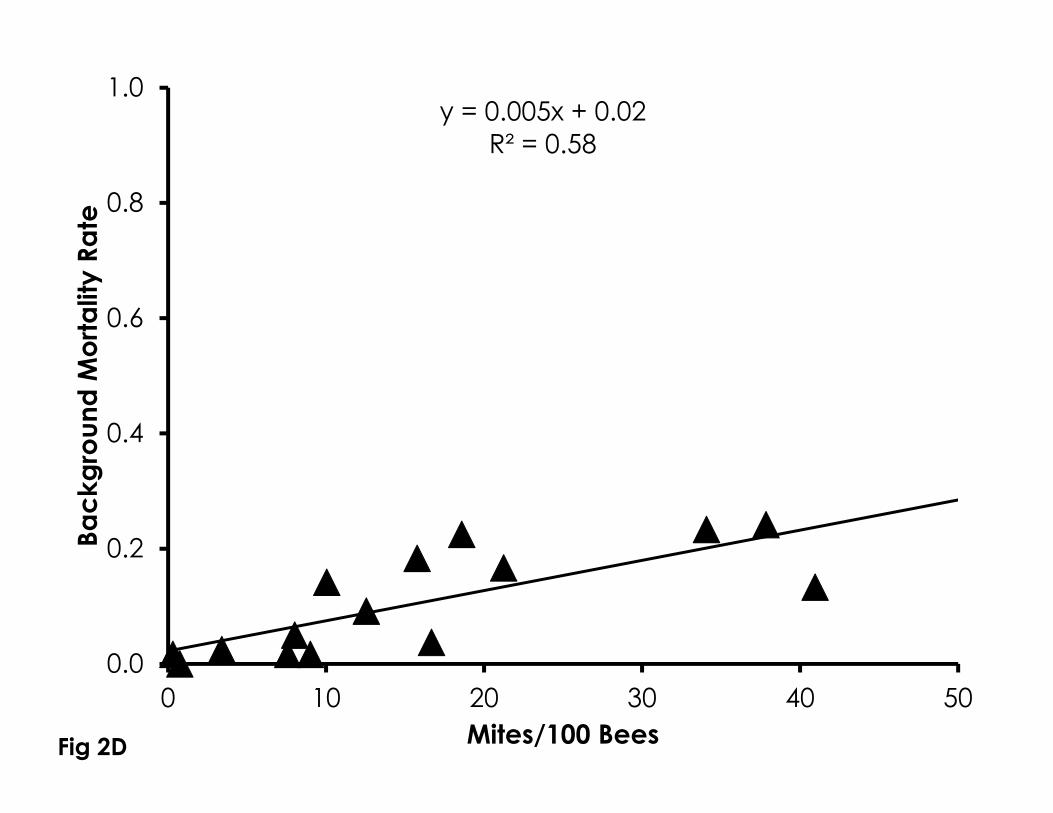
y = 0.005x + 0.02R² = 0.58
0.0
0.2
0.4
0.6
0.8
1.0
0 10 20 30 40 50
Back
grou
nd M
orta
lity
Rate
Mites/100 BeesFig 2D
0123456789
10111213
Fram
es o
f Bee
sControlAmitrazIPM
A2
A1
A1 A1A1 AB1
A4
A34
A23
A12
A12
A1
B3
B23
A2A2
A1
B2
Fig 3
0
100
200
300
400
500
600Br
ood
Qua
ntity
ControlAmitrazIPM
A1
A1
A1A1
A1
A1A1
A1
A1A1 A1
A1
A2B2
A12
A12
A1
A2
Fig 4
0
10
20
30
40
50
60
70Br
ood
Qua
lity
ControlAmitrazIPM
A2 B2
A1
A12
A12AB12
A1
AB1 A1
A1
A1
B1
A1
A1
A1
A1 A1
A1
Fig 5
0
5
10
15
20
25
30
35M
ites/
100
Bees
ControlAmitrazIPM
A1A1
A1
A1
A2
A2
A2
B1 B1B1
B3
B2A12 A12
AB12
AB2
A3
A1
Fig 6
0
20
40
60
80
100
120
June July August September October
Polle
n C
olle
ctio
n (g
/day
)ControlAmitrazIPM
A12
A23A123
A3
A1
AB23
A23
A2
A3
B1
B2A2
A12
A2
A1
Fig 7
0
20
40
60
80
100
120Be
e W
eigh
t (m
g)ControlAmitrazIPM
A2
AB2B23
A23
A2
B3
A1
A1 A1A1
A1 A1
B3 A2AB2
AB12A2B23
Fig 8
0.0
0.2
0.4
0.6
0.8
1.0
1.2Q
ueen
Sur
viva
l (%
)ControlAmitrazIPM
Fig 9


![Apis mellifera) and Varroa (Varroa destructor · Varroa destructor [1] is a worldwide parasite of Apis, which causes significant brood and adult mortality in colonies of European](https://static.fdocuments.net/doc/165x107/5e5172f363736b6b294a9deb/apis-mellifera-and-varroa-varroa-destructor-varroa-destructor-1-is-a-worldwide.jpg)