Influence of Thermal Power Generation in Nigeria Environment · power generation in Nigeria, the...
12
IOSR Journal of Engineering (IOSRJEN) www.iosrjen.org ISSN (e): 2250-3021, ISSN (p): 2278-8719 Vol. 09, Issue 3 (March. 2019), ||S (II) || PP 42-53 International organization of Scientific Research 42 | Page Influence of Thermal Power Generation in Nigeria Environment Ijeoma R.C 1 & Kiani I. 2 1 Electrical/Electronics Engineering Department, 2 Science Laboratory Technology Department Captain Elechi Amadi Polytechnic, Rumuola Port Harcourt, Rivers State Nigeria Corresponding Author: Ijeoma R.C Abstract: Electrical energy covers the highest level in energy pecking order. It finds numerous applications in homes, industry, agriculture, defense, transportation etc. In order to ensure that Nigerians can enjoy a reliable energy system at a reasonable cost. Several thermal power generating stations that contribute to the nations grid which includes Afam, Egbin, Delta, Sapele thermal power station, Ijora and Oji river thermal power station. This study engages method that applies the ultra-careful study of power generating stations and their various environments and utilizes the application of questionnaires, interviews & investigations, and personal observations in data gathering. Analyses of the various data collected were in tabular exhibitions, mathematical models, pictorial charts, percentages and graphical illustrations. Results obtained from the analyses shows that nitrogen oxides account for 97% of the total emission released from natural gas when used as fossil fuel for thermal stations in Nigeria and particulates 3%. The actual contributions of the greenhouse gases to global warming are 50% carbon dioxide, 18% methane, 14% CFCs and 6% nitrous oxides. In this paper, there were several parameters studied and was discovered that in the management of the environmental influence of electric power generation in Nigeria, the factors involve depends on the type of power stations. Conclusively, this work shows that electricity is being generated at the expense of the surrounding environment, and this is damaging to human existence. It is recommended that, environmental problems be anticipated and adequately reflected in the planning, designing and implementation of electricity generation schemes for sustainability of power generation Keywords: Electrical Energy, Environment, Thermal Station, Energy Consumption, Influence --------------------------------------------------------------------------------------------------------------------------------------- Date of Submission: 01-03-2019 Date of acceptance: 18-03-2019 --------------------------------------------------------------------------------------------------------------------------------------- I. INTRODUCTION Electricity covers the highest level in energy pecking order. It finds numerous applications in homes, industry, agriculture, defense, transportation etc. The fact that electricity can be transported instantaneously and pollution free at consumer end makes it attractive as compared to other forms of energy. Sule and Salami (2013) reported that, the environmental impacts associated with electricity generation, transmission and distribution has become of great importance in power systems planning, design and operations. Every technologically advanced countries of the world, public electricity distribution and supply dominates the industrial scene in the scale of its capital investment requirements, huge tonnage of primary fuel it consumes and its rapid growing demands for large, complex and technically sophisticated plants and equipments. Nigeria is richly endowed with numerous energy resources, which offers the nation opportunities to tap into the strength of the various energy media available. The energy sector however, has not exploited this gift of nature; the progress in the use and development of oil and gas, in past years has created an impression that hydrocarbon is the major viable energy medium available to Nigeria. This has negatively impacted on a comprehensive assessment and use of all Nigeria‟s energy resources. In order to ensure that Nigerians can enjoy a reliable and robust energy system at a reasonable cost, it is essential that supply be generated from a variety of sources. With the cost of oil being uncertain, alternative energy options need to be assessed and development plans expedited to enable a broad-based infrastructure. According to Ibe and Okedu (2015), maintaining a reliable electric power generation is therefore a very important issue in power system design and operation. Nigeria, being the threshold of industrial development, has high energy demand. The country is endowed with rich reserves of conventional energy resources like; crude oil, natural gas, coal and hydro potential. Currently, the national energy consumption mix is dominated by oil, which is approximately 53 percent, seconded by natural gas which approximates to 39 percent and then hydroelectricity that is almost 7 percent. Coal, nuclear power, biomass and other renewable sources are presently not the major part of Nigeria‟s energy consumption mix. Meanwhile, in Nigeria electrical power stations are mostly thermal power stations.
Transcript of Influence of Thermal Power Generation in Nigeria Environment · power generation in Nigeria, the...

IOSR Journal of Engineering (IOSRJEN) www.iosrjen.org
ISSN (e): 2250-3021, ISSN (p): 2278-8719
Vol. 09, Issue 3 (March. 2019), ||S (II) || PP 42-53
International organization of Scientific Research 42 | Page
Influence of Thermal Power Generation in Nigeria Environment
Ijeoma R.C1 & Kiani I.
2
1Electrical/Electronics Engineering Department,
2Science Laboratory Technology Department
Captain Elechi Amadi Polytechnic, Rumuola Port Harcourt, Rivers State Nigeria
Corresponding Author: Ijeoma R.C
Abstract: Electrical energy covers the highest level in energy pecking order. It finds numerous applications in
homes, industry, agriculture, defense, transportation etc. In order to ensure that Nigerians can enjoy a reliable
energy system at a reasonable cost. Several thermal power generating stations that contribute to the nations grid
which includes Afam, Egbin, Delta, Sapele thermal power station, Ijora and Oji river thermal power station.
This study engages method that applies the ultra-careful study of power generating stations and their various
environments and utilizes the application of questionnaires, interviews & investigations, and personal
observations in data gathering. Analyses of the various data collected were in tabular exhibitions, mathematical
models, pictorial charts, percentages and graphical illustrations. Results obtained from the analyses shows that
nitrogen oxides account for 97% of the total emission released from natural gas when used as fossil fuel for
thermal stations in Nigeria and particulates 3%. The actual contributions of the greenhouse gases to global
warming are 50% carbon dioxide, 18% methane, 14% CFCs and 6% nitrous oxides. In this paper, there were
several parameters studied and was discovered that in the management of the environmental influence of electric
power generation in Nigeria, the factors involve depends on the type of power stations. Conclusively, this work
shows that electricity is being generated at the expense of the surrounding environment, and this is damaging to
human existence. It is recommended that, environmental problems be anticipated and adequately reflected in the
planning, designing and implementation of electricity generation schemes for sustainability of power generation
Keywords: Electrical Energy, Environment, Thermal Station, Energy Consumption, Influence
----------------------------------------------------------------------------------------------------------------------------- ----------
Date of Submission: 01-03-2019 Date of acceptance: 18-03-2019
----------------------------------------------------------------------------------------------------------------------------- ----------
I. INTRODUCTION Electricity covers the highest level in energy pecking order. It finds numerous applications in homes,
industry, agriculture, defense, transportation etc. The fact that electricity can be transported instantaneously and
pollution free at consumer end makes it attractive as compared to other forms of energy. Sule and Salami (2013)
reported that, the environmental impacts associated with electricity generation, transmission and distribution has
become of great importance in power systems planning, design and operations. Every technologically advanced
countries of the world, public electricity distribution and supply dominates the industrial scene in the scale of its
capital investment requirements, huge tonnage of primary fuel it consumes and its rapid growing demands for
large, complex and technically sophisticated plants and equipments.
Nigeria is richly endowed with numerous energy resources, which offers the nation opportunities to tap
into the strength of the various energy media available. The energy sector however, has not exploited this gift of
nature; the progress in the use and development of oil and gas, in past years has created an impression that
hydrocarbon is the major viable energy medium available to Nigeria. This has negatively impacted on a
comprehensive assessment and use of all Nigeria‟s energy resources. In order to ensure that Nigerians can enjoy
a reliable and robust energy system at a reasonable cost, it is essential that supply be generated from a variety of
sources. With the cost of oil being uncertain, alternative energy options need to be assessed and development
plans expedited to enable a broad-based infrastructure.
According to Ibe and Okedu (2015), maintaining a reliable electric power generation is therefore a very
important issue in power system design and operation. Nigeria, being the threshold of industrial development,
has high energy demand. The country is endowed with rich reserves of conventional energy resources like;
crude oil, natural gas, coal and hydro potential. Currently, the national energy consumption mix is dominated by
oil, which is approximately 53 percent, seconded by natural gas which approximates to 39 percent and then
hydroelectricity that is almost 7 percent. Coal, nuclear power, biomass and other renewable sources are
presently not the major part of Nigeria‟s energy consumption mix. Meanwhile, in Nigeria electrical power
stations are mostly thermal power stations.

Influence of Thermal Power Generation in Nigeria Environment
International organization of Scientific Research 43 | Page
II. MATERIALS AND METHODS A. STUDY DESIGN
This study engages method that applies the ultra-careful study of power generating stations and their various
environments and utilizes the application of questionnaires, interviews & investigations, and personal
observations in data gathering.
However, the approach adopted in the analysis of data collected were tabular exhibitions, mathematical models,
pictorial charts, percentages and graphical illustrations.
SPECIFIC OBJECTIVES
i. To ascertain influence of thermal electric power stations.
ii. To ascertain preventive mechanisms for power stations negative influences.
iii. To ascertain positive environmental influence of electric power stations.
iv. To proffer ways of managing the influence of electric power generation.
B. THERMAL POWER STATIONS EMISSIONS ANALYSIS
The operations of the thermal electric power stations result to the emission of some effluents into the
atmosphere. These effluents are air borne and they are by-products of the combustion of fossil-fuels from the
thermal power stations. These emissions from the burning of fossil-fuels from operating thermal power stations
in Nigeria as a result from electricity generation from the stations is shown in table 1 below.
Table 1: Fossil-Fuel Emission from Operating Power Stations in Nigeria (Tonnes/1000MW).
Air Borne Effluents Coal Oil Natural Gas
Sulphur oxides 11,000 37,000 20
Nitrogen oxides 27,000 25,000 20,000
Carbon oxides 2,000 710 0
Particulate 3,000 1,200 510
Hydrocarbons 400 470 34
Aldehydes 0 240 0
Ash 360,000 9,000 0
Total 403,400 73,620 20,564
Source: Noise control handbook of principles and practices by David and Arthur (2016).
C. ANALYSIS OF POLLUTANTS AND THEIR SOURCES
Apart from thermal electric power stations, there are also other sources of pollutants emissions into the
atmosphere. These pollutants and their various sources are tabulated below in table 2.
Table 2: Estimated emission of pollutants by different source in Nigeria (Tonnes/year).
Source Black smoke Sulphur oxides Nitrogen oxides Carbon oxides
Domestic 191 135 68 339
Commercial/Industrial 92 683 337 342
Power Stations 25 2644 786 47
Refineries 0 109 36 1
Vehicles
(Petrol Engines) 15 22 703 5644
Vehicles
(Diesel Engines) 182 30 596 12
Railways 0 3 32 12
Forest 0 0 0 0
Gas Leakage 5 0 0 0
Others 30 65 144 31
Total 540 3691 2702 6523
Source: National Environment Protection (Effluent Limitation) Regulations (2016).
From table 2 above, it can be shown that the total pollutants in tonnes/year from power station is 3502
tonnes/year i.e (25 + 2644 + 786 + 47 = 3502 tonnes/year), and the Total pollutants from all sources = 13456
tonnes/yr.

Influence of Thermal Power Generation in Nigeria Environment
International organization of Scientific Research 44 | Page
Hence, the percentage composition of pollutants from power stations becomes: 3502
13456𝑥
100%
1= 26%
Thus, 26% of the total pollutants released into the atmosphere per year come from thermal power stations.
D. GREENHOUSE GASES
Greenhouse gases are responsible for global warming. They cause the depletion of the ozone layer and thus,
expose the earth‟s surface to intensive heat from the sun. These gases however, are also been discharged from
the power stations and their percentage distributions can be seen below in table 3.
Table 3: Distribution of Greenhouse Gases
GREENHOUSE GAS PERCENTAGE
Carbon dioxides (CO2) 50%
Methane (CH4) 18%
Chlorofloro carbons (CFCS) 14%
Nitrous oxides (NOX) 6%
Ozone /Others 12%
Source: Relative Contributions of Greenhouse Gases to Global Warming by Lashof and Ahuja (2016).
These greenhouse gases are not only been discharged by the power stations, there are other various sources.
These sources are been tabulated below in table 4.
Table 4: Sources of Greenhouse Gases
Gas Sources
% Contribution to
Global warming
Carbon dioxide (CO2) Combustion of fossil (80%) and biomass (20%). 50%
Methane (CH4)
Biomass burning, anaerobic fermentation in
wetlands, natural gas exploration and transportation. 18%
Chlorofloro carbons (CFCs)
Aerosol pollutant, coolants, foamier and fire
extinguishers. 14%
Nitrous oxides (NOX) Combustion of fossil fuels and fertilizer. 6%
Ozone /Others
Formed by action of sunlight on hydrocarbons and
nitrogen oxides from vehicles 12%
Source: Relative Contributions of Greenhouse Gases to Global Warming by Lashof and Ahuja (2016).
E. NATURAL GAS CONSUMPTION OF UGHELLI THERMAL POWER STATION
The natural gas consumption of ughelli thermal power for the year 2001 is seen in appendix I. These
data collected on the natural gas consumption is analyzed to show that the rate of natural gas utility in ughelli
thermal power station varies for each month. Table 5 below contains the amount of natural gas consumed for the
year 2012 in meter cube.
Table 5: Natural Gas Consumption of Ughelli Thermal Power Station (2012)
Month Gas Consumption (Estimated) Factor m3
Jan 53,186,914.77
Feb 25,886,540.51
March 68,068,023.70
April 51,754,674.73
May 600,871,544.10
June 58,205,698.64
July 79,603,786.74
Aug 86,162,564.19
Sept 0
Oct 0
Nov 52,358,247.90
Dec. 0
Influence of Thermal Power Generation in Nigeria Environment
International organization of Scientific Research 45 | Page
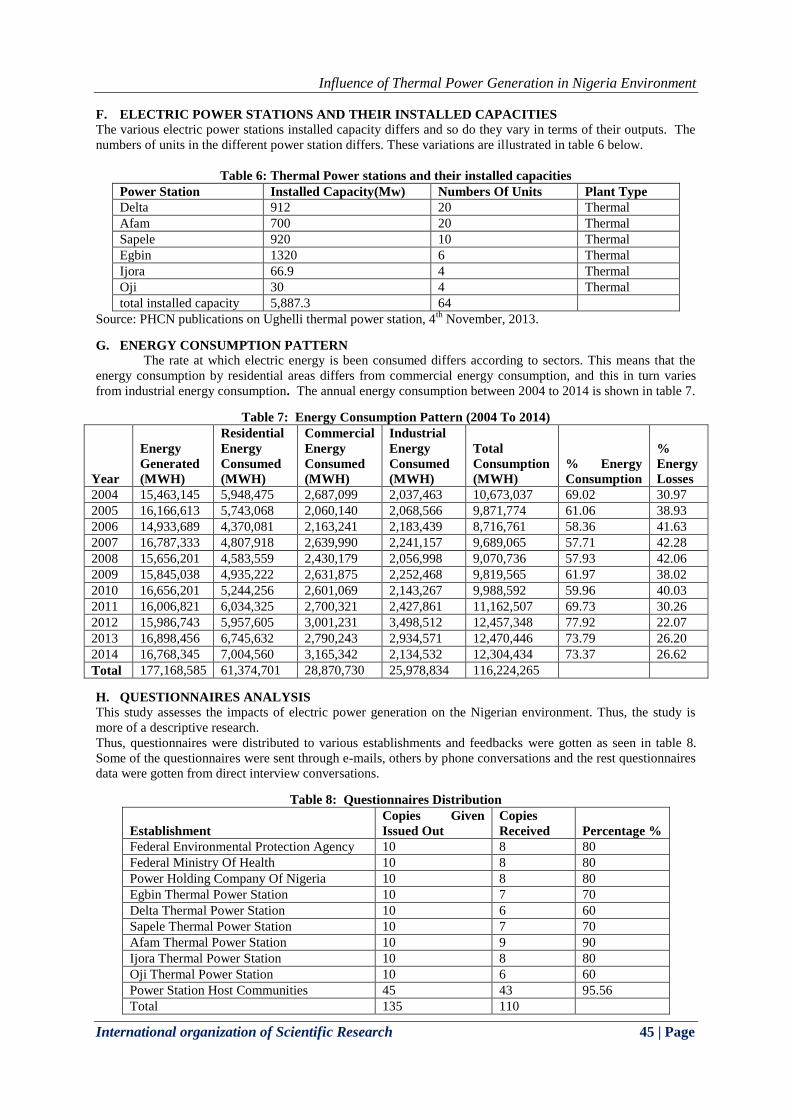
F. ELECTRIC POWER STATIONS AND THEIR INSTALLED CAPACITIES
The various electric power stations installed capacity differs and so do they vary in terms of their outputs. The
numbers of units in the different power station differs. These variations are illustrated in table 6 below.
Table 6: Thermal Power stations and their installed capacities
Power Station Installed Capacity(Mw) Numbers Of Units Plant Type
Delta 912 20 Thermal
Afam 700 20 Thermal
Sapele 920 10 Thermal
Egbin 1320 6 Thermal
Ijora 66.9 4 Thermal
Oji 30 4 Thermal
total installed capacity 5,887.3 64
Source: PHCN publications on Ughelli thermal power station, 4th
November, 2013.
G. ENERGY CONSUMPTION PATTERN
The rate at which electric energy is been consumed differs according to sectors. This means that the
energy consumption by residential areas differs from commercial energy consumption, and this in turn varies
from industrial energy consumption. The annual energy consumption between 2004 to 2014 is shown in table 7.
Table 7: Energy Consumption Pattern (2004 To 2014)
Year
Energy
Generated
(MWH)
Residential
Energy
Consumed
(MWH)
Commercial
Energy
Consumed
(MWH)
Industrial
Energy
Consumed
(MWH)
Total
Consumption
(MWH)
% Energy
Consumption
%
Energy
Losses
2004 15,463,145 5,948,475 2,687,099 2,037,463 10,673,037 69.02 30.97
2005 16,166,613 5,743,068 2,060,140 2,068,566 9,871,774 61.06 38.93
2006 14,933,689 4,370,081 2,163,241 2,183,439 8,716,761 58.36 41.63
2007 16,787,333 4,807,918 2,639,990 2,241,157 9,689,065 57.71 42.28
2008 15,656,201 4,583,559 2,430,179 2,056,998 9,070,736 57.93 42.06
2009 15,845,038 4,935,222 2,631,875 2,252,468 9,819,565 61.97 38.02
2010 16,656,201 5,244,256 2,601,069 2,143,267 9,988,592 59.96 40.03
2011 16,006,821 6,034,325 2,700,321 2,427,861 11,162,507 69.73 30.26
2012 15,986,743 5,957,605 3,001,231 3,498,512 12,457,348 77.92 22.07
2013 16,898,456 6,745,632 2,790,243 2,934,571 12,470,446 73.79 26.20
2014 16,768,345 7,004,560 3,165,342 2,134,532 12,304,434 73.37 26.62
Total 177,168,585 61,374,701 28,870,730 25,978,834 116,224,265
H. QUESTIONNAIRES ANALYSIS
This study assesses the impacts of electric power generation on the Nigerian environment. Thus, the study is
more of a descriptive research.
Thus, questionnaires were distributed to various establishments and feedbacks were gotten as seen in table 8.
Some of the questionnaires were sent through e-mails, others by phone conversations and the rest questionnaires
data were gotten from direct interview conversations.
Table 8: Questionnaires Distribution
Establishment
Copies Given
Issued Out
Copies
Received Percentage %
Federal Environmental Protection Agency 10 8 80
Federal Ministry Of Health 10 8 80
Power Holding Company Of Nigeria 10 8 80
Egbin Thermal Power Station 10 7 70
Delta Thermal Power Station 10 6 60
Sapele Thermal Power Station 10 7 70
Afam Thermal Power Station 10 9 90
Ijora Thermal Power Station 10 8 80
Oji Thermal Power Station 10 6 60
Power Station Host Communities 45 43 95.56
Total 135 110

Influence of Thermal Power Generation in Nigeria Environment
International organization of Scientific Research 46 | Page
Environmental Impact Assessment Analysis of the Thermal Power Stations.
In order to ascertain the various impacts of constructions of thermal electric power stations on the
people, houses, villages and lands around its vicinity, questionnaires were sent out. From the data gathering
using the questionnaires, the mean of each of the parameter was taken. Table 9 below reflects the outcome of the
data collection. It is also of importance to note that, information on some parameters of some of the thermal
power stations were not feasible to ascertain.
Table 9: Villages/Peoples/Houses displaced and Land Mass used During the Construction of Thermal
Power Stations
Power
stations
Number
people
displaced
Number
People
available
Number of
villages
displaced
Number
of villages
available
Number of
houses
displaced
Number
of houses
available
Land
mass
used
1 Sapele None Not
available
None Not
available
None Not
available
130 acres
2 Delta 2,150 9,860 2 5 680 1940 Not
available
3 Egbin 1,860 9,940 3 7 2780 6230 63
4 Afam None Not
available
None Not
available
None Not
available
Not
available
5 Ijoro 685 2970 1 4 78 280 Not
available
6 Oji Not
available
Not
available
Not
available
Not
available
Not
available
Not
available
Not
available
III. RESULTS AND DISCUSSIONS
RESULTS ON THERMAL POWER STATIONS EMISSIONS
Considering the data in table 1, the effluents discharge are not from one source, the percentages variations of
coal, oil and natural gas compositions for each effluent can be shown in the column bar chart as this is illustrated
in figure 1below.
Furthermore, to show variation in tonnes/1000MW in the combustion of the fossil-fuel, a pictorial
diagram of the pie chart in figure 2 below gives a clearer view. The highest fossil-fuel emission from operating
power stations in Nigeria (in tonnes/1000mw) emanates from the combustion of coal, which is about 81% of the
entire emissions. This followed by emissions due to the burning of oil (15%) and then, the smallest of 4% which
are emissions from natural gas combustion

Influence of Thermal Power Generation in Nigeria Environment
International organization of Scientific Research 47 | Page
In the analysis of thermal power stations emissions, from table 1, a column bar chart were developed
showing the percentage capacity of emissions from fossil-fuel combustion of power stations in Nigeria (see
figure 6). This infers that, it is only the combustion of oil that can produce 100% aldehydes effluents and the
combustion of natural gas in the power stations cannot produce carbon oxides and ash as effluents. To show the
percentage composition discharge of the effluents from the combustion of coal, oil and natural gas pie chart
were used.
However, the crude oil used in Nigeria thermal stations comprises of certain gases like oxides of
sulphur (Sox), oxide of nitrogen (Nox), oxides of carbon (Cox), particulate matter, hydrocarbon, aldehydes and
ash. From the pie chart of the proportion of the effluents for oil as fossil-fuel source are seen.
However, table 1 shows the total capacity of emission from crude oil to be 73,620tonnes/1000MW.
Hence:
a. Total capacity of Sulphur oxides released = 37,000tonnes/1000MW (which constitutes 50% of the
emission).
b. Total capacity of Nitrogen oxides released = 25,000tonnes/MW (which constitutes 34% of the emission).
c. Total capacity of Carbon oxides released = 710tonnes/I000MW (which constitutes 1% of the emission).
d. Total capacity of Particulate released = 1,200tonnes/I000MW (which constitutes 2% of the emission).
e. Total capacity of Hydrocarbons released = 470tonnes/I000MW (which constitutes 1% of the emission).
f. Total capacity of Aldehydes released = 240tonnes/I000MW (which constitutes 0% of the emission).
g. Total capacity of Ash released = 9,000tonnes/I000MW (which constitutes 12% of the emission)
Furthermore, the natural gas used in Nigeria thermal stations comprises of certain gases like oxides of sulphur
(Sox), oxide of nitrogen (Nox), particulate matter and hydrocarbon. From the pie chart of figure 2, the
proportions of the effluents for natural gas as fossil-fuel source are seen. Table 1 shows the total capacity of
emission from natural gas to be 20,564tonnes/I000MW.
Therefore:
a. Total capacity of Sulphur oxides released = 20tonnes/1000MW (which constitutes 0% of the emission).
b. Total capacity of Nitrogen oxides released = 20,000tonnes/MW (which constitutes 97% of the emission).
c. Total capacity of Particulate released = 510tonnes/I000MW (which constitutes 3% of the emission).
d. Total capacity of Hydrocarbons released = 34tonnes/I000MW (which constitutes 0% of the emission).
However, it has been shown that nitrogen oxides account for 97% of the total emission released from natural gas
when used as fossil fuel for thermal stations in Nigeria, particulates accounts for 3%, while oxides of sulphur
and hydrocarbons accounts for approximately 0% . Hence, in the combustion of natural gas by thermal stations,
nitrogen oxides are the predominant gases released into the atmosphere.
SOURCES OF POLLUTANTS AND GREENHOUSE GASES
Considering Table 2, it can be seen that black smoke is the highest pollutant from gas leakage. Sulphur
oxides are the highest pollutant from power stations. Nitrogen oxides are the second highest pollutant given off
from the power stations. Carbon oxides are the highest pollutants from vehicles. This is best illustrated using a
column bar chart as seen in figure 3 below.

Influence of Thermal Power Generation in Nigeria Environment
International organization of Scientific Research 48 | Page
The total percentage compositions of black smoke, sulphur oxides, nitrogen oxides and carbon oxides from the
various pollutant sources is best illustrated with a pie chart. This is shown in figure 4 below.
The electric power stations, though can discharge effluents into the environment, they are not the only
sources pollutants. There are several other sources such as; Domestic sources, Commercial/Industrial sources,
Refineries, Vehicles (petrol engines and diesel engines), Railways, Gas Leakage e.t.c.
Table 2 shows the feasible types of pollutants these sources can discharge and their quantity in
tones/year for each types of pollutants. Figure 3 tends to compare the estimated emission of pollutants by the
different sources in Nigeria with emissions of the same kinds obtainable from the electric power stations. This
shows that the highest emission of oxides of nitrogen and sulphur are been discharged from the power stations.
Meanwhile, the actual contributions of the greenhouse gases to global warming from table 3 are around 50% for
carbon dioxide, 18% for methane, 14% for CFCs and 6% for nitrous oxides. Ozone‟s and other factors
contributes about 12%, this 12% contribution is sometimes a point of debate, due to the differing effects it has in
the troposphere compared to the stratosphere.
NATURAL GAS CONSUMPTION OF UGHELLI THERMAL POWER STATION
INTERPRETATION
Considering Table 5, the variation in gas consumption rate in 2012 for Ughelli thermal electric power station
can be made clearer in a bar chart. This is seen in figure 5 below
Influence of Thermal Power Generation in Nigeria Environment
International organization of Scientific Research 49 | Page
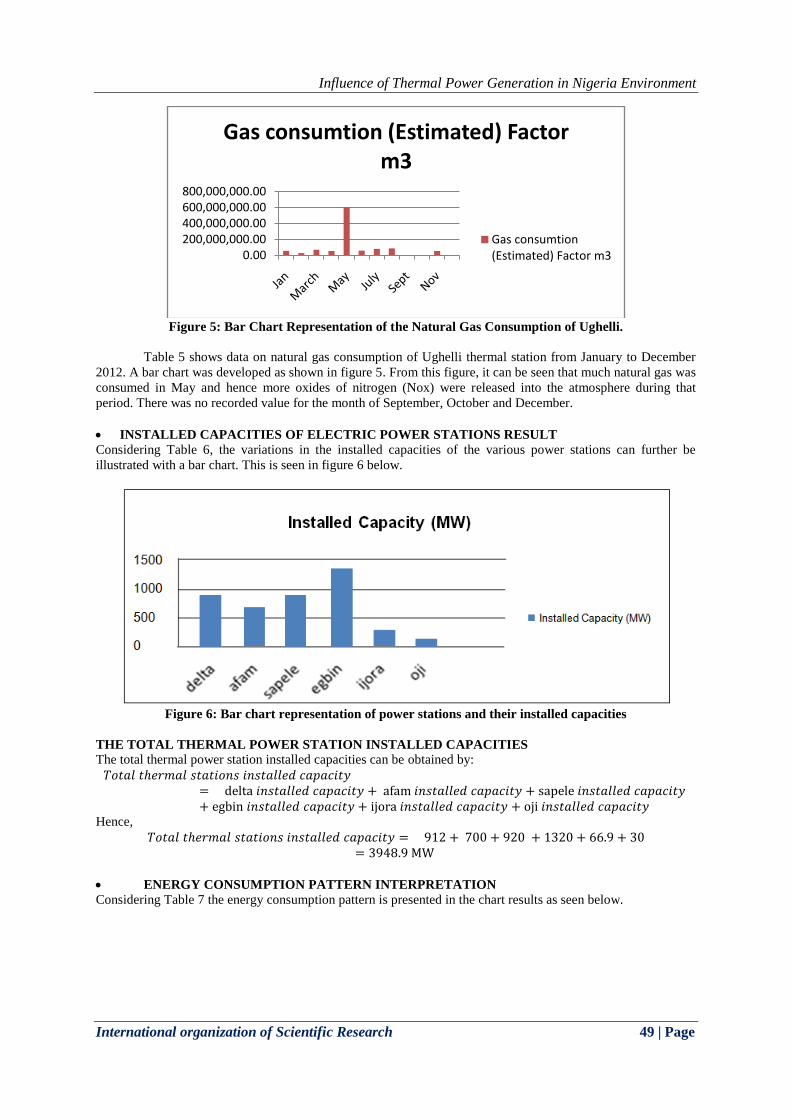
Figure 5: Bar Chart Representation of the Natural Gas Consumption of Ughelli.
Table 5 shows data on natural gas consumption of Ughelli thermal station from January to December
2012. A bar chart was developed as shown in figure 5. From this figure, it can be seen that much natural gas was
consumed in May and hence more oxides of nitrogen (Nox) were released into the atmosphere during that
period. There was no recorded value for the month of September, October and December.
INSTALLED CAPACITIES OF ELECTRIC POWER STATIONS RESULT
Considering Table 6, the variations in the installed capacities of the various power stations can further be
illustrated with a bar chart. This is seen in figure 6 below.
Figure 6: Bar chart representation of power stations and their installed capacities
THE TOTAL THERMAL POWER STATION INSTALLED CAPACITIES
The total thermal power station installed capacities can be obtained by:
𝑇𝑜𝑡𝑎𝑙 𝑡ℎ𝑒𝑟𝑚𝑎𝑙 𝑠𝑡𝑎𝑡𝑖𝑜𝑛𝑠 𝑖𝑛𝑠𝑡𝑎𝑙𝑙𝑒𝑑 𝑐𝑎𝑝𝑎𝑐𝑖𝑡𝑦 = delta 𝑖𝑛𝑠𝑡𝑎𝑙𝑙𝑒𝑑 𝑐𝑎𝑝𝑎𝑐𝑖𝑡𝑦 + afam 𝑖𝑛𝑠𝑡𝑎𝑙𝑙𝑒𝑑 𝑐𝑎𝑝𝑎𝑐𝑖𝑡𝑦 + sapele 𝑖𝑛𝑠𝑡𝑎𝑙𝑙𝑒𝑑 𝑐𝑎𝑝𝑎𝑐𝑖𝑡𝑦 + egbin 𝑖𝑛𝑠𝑡𝑎𝑙𝑙𝑒𝑑 𝑐𝑎𝑝𝑎𝑐𝑖𝑡𝑦 + ijora 𝑖𝑛𝑠𝑡𝑎𝑙𝑙𝑒𝑑 𝑐𝑎𝑝𝑎𝑐𝑖𝑡𝑦 + oji 𝑖𝑛𝑠𝑡𝑎𝑙𝑙𝑒𝑑 𝑐𝑎𝑝𝑎𝑐𝑖𝑡𝑦
Hence,
𝑇𝑜𝑡𝑎𝑙 𝑡ℎ𝑒𝑟𝑚𝑎𝑙 𝑠𝑡𝑎𝑡𝑖𝑜𝑛𝑠 𝑖𝑛𝑠𝑡𝑎𝑙𝑙𝑒𝑑 𝑐𝑎𝑝𝑎𝑐𝑖𝑡𝑦 = 912 + 700 + 920 + 1320 + 66.9 + 30
= 3948.9 MW
ENERGY CONSUMPTION PATTERN INTERPRETATION
Considering Table 7 the energy consumption pattern is presented in the chart results as seen below.
0.00200,000,000.00400,000,000.00600,000,000.00800,000,000.00
Gas consumtion (Estimated) Factor m3
Gas consumtion (Estimated) Factor m3

Influence of Thermal Power Generation in Nigeria Environment
International organization of Scientific Research 50 | Page
Figure 7: Bar chart representation of energy consumption by various sectors
Figure 8: Pie chart percentage representation of energy consumptions by various sectors.
From the percentage analysis of the energy consumption, it is obvious that the residential energy consumption is
highest (53%), followed by commercial energy consumption (25%) and then, the industrial energy consumption
(22%).
ENVIRONMENTAL IMPACT ASSESSMENT RESULTS
The impacts of the construction of power stations in the various localities where the power stations are
been sited have been analyzed. Not all the thermal power stations data where obtainable. But the data for delta,
egbin and ijoro thermal power stations that were available have been analyzed. The visual basic software
developed for computation of percentage was used to model the percentages of the people, houses and villages
displaced at the time of the constructions of the power stations. The percentage results for the numbers of
people, houses and villages displaced is tabulated below in table 10.
Table 10: Percentage Displacements Due To Power Stations Construction
Power Station
Percentage of People
Displaced (%)
Percentage of Houses
Displaced (%)
Percentage of Villages
Displaced (%)
Delta Station 21.81 35.05 40.00
Egbin Station 18.71 44.62 42.86
Ijora Station 23.06 27.86 25.00
As in table 10 above, during the construction of Ijora thermal power station, 23% of the population of
people residing within the Ijora station locality where been displaced. 28% of the houses where displaced and
about 25% of the villages where displaced. It then entails that many people were left homeless as at then within
the Ijora power station vicinity.
Also, it can be deduced from table 10, that for every power station constructed, a certain percentage of
the people, houses and villages residents within the power station area where been displaced.
IV. DISCUSSION The construction of thermal power stations has significant impacts on the lives and activities of the
inhabitants of the area. Table 11 below shows the occupations of the indigenes of the power stations
environments before and after the construction of the stations.
010,000,00020,000,00030,000,00040,000,00050,000,00060,000,00070,000,000
residential energy consumed
commercial energy consumed
industrial energy consumed
residential energy
consumed 53%
commercial energy
consumed25%
industrial energy
consumed22%
Percentage consumption

Influence of Thermal Power Generation in Nigeria Environment
International organization of Scientific Research 51 | Page
Table 11: Indigenes Occupation before and after the Construction of the electric thermal Power Stations
Power
station
Occupation before the construction of power
station
Occupation after the
construction of power station
Sapele
Thermal
Station
1. Hunting activities 1. Reduction in hunting
2. Farming that involves land clearing,
cultivation and harvesting
2. Reduced farming
3. Fishing which involves inshore fishing 3. Contractors to power
station
4. Palm wine tappers 4. Fishing, though limited
5. Traders 5. Land transportation
6. Construction of boat and river transportation
Ughelli 1. Hunting
2. Farming which involves land clearing
cultivation and harvest.
3. Trading
1. Constructors to power
station with few still carrying out
farming activities.
2. Reduced hunting
3. Teaching
4. Improved trading
5. Civil servants
Egbin Station 1. Farming which includes clearing of land,
cultivation and harvesting.
2. Fishing which involves in-shore fishing
3. Horticultural activities
4. Construction of agricultural implement and
boats.
5. River transportation
1. Contractors to power
station with few still carrying out
farming activities.
2. Fishing though limited
3. Improved trading
4. Teaching
5. River and land
transportation
Afam station 1. Farming
2. Fishing
3. Trading
4. Construction of agricultural implement and
boats
5. Hunting
6. River and land transportation
1. Indigenes employed by
NEPA and some are contractors
to power station
2. Reduced farming
3. Reduced hunting
4. Reduced fishing
5. Land and river
transportation.
Ijora
station
1.Farming
2.Fishing
3.Trading
4.Hunting
1.Teaching
2. Contractors to power
station
3. Reduced farming
4. Reduced hunting
5. Reduced fishing
Oji station 1.Farming
2.Fishing
3.Trading
4.Hunting
1.Teaching
2. Contractors to power
station
3. Reduced farming
4. Reduced hunting
5. Reduced fishing
However, due to the discharges of effluents into the environments that result from the operations of the
power stations, several health hazards have been encountered by the inhabitants of the power stations area. In
table 12, the health challenges associated with the power stations construction is compared to those occurring
before the power stations constructions.

Influence of Thermal Power Generation in Nigeria Environment
International organization of Scientific Research 52 | Page
Table 12: Health Hazard Associated With Indigenes Before and After Construction of Thermal Electric
Power Stations.
Power station Health Hazard Before
Construction Of Power
Stations
Health Hazard After The Construction Of
Power Station
Sapele station 1. Malaria
2. Headache
3. High blood pressure
4. Cough
5. Cartah
6. Rheumatism
1. Cancer
2. Chronic bronchitis
3. Irritation of eyes
4. Nose and throat irritation
5. Increases cough victim
6. Asthma
7. Increases victim of high blood
pressure
Afam station 1. Malaria
2. Headache
3. Cholera
4. Dysentery
5. Rheumatism
1. Irritation of the eyes
2. Asthma
3. Guinea worm
4. Chronic bronchitis
5. Increased high blood pressure
6. Typhoid
7. Increased cholera victim
8. Increased cartah victim
9. Increased dysentery victim
Delta station 1. Malaria
2. Headache
3. High blood pressure
4. Cough
5. Cartah
6. Rheumatism
1. Cancer
2. Chronic bronchitis
3. Irritation of eyes
4. Nose and throat irritation
5. Asthma
6. Increases cough victim
7. Increases victim of high blood
pressure
Egbin station 1. Malaria
2. Headache
3. High blood pressure
4. Cough
5. Cartah
1. Cancer
2. Chronic bronchitis
3. Increases cough victim
4. Asthma
5. Increases victim of high blood
pressure
Ijora station 1. Malaria
2. Headache
3. Cough
4. Cartah
5. Rheumatism
1. Guinea worm
2. Chronic bronchitis
3. Increased high blood pressure
4. Typhoid
5. Increased cholera victim
Oji River
The same as in the above The same as in the above.
In this research, there were several parameters studied. It has been discovered that in the management
of the environmental influence of electric power generation in Nigeria, the factors involve are dependent on the
type of power stations.
V. CONCLUSION The dangers inherent in the generation of electricity by different generating modes have been
highlighted in this work. This paper has shown that electricity is being generated at the expense of the
surrounding environment, and this is detrimental to human existence. Thus, electricity generation is associated
with environmental degradation which if not adequately checked might almost undermined a nation‟s
development because it is said that power is the bedrock of development. It is not enough to ensure that an
electric power generating project yields economic advantage at present without anticipating the environmental
challenges that could result from electric power generation, which may yield positive results on the short run but
will be unsustainable on the long-run.
An electric power scheme depending on the type of mode applied requires the use of resources like
coal, oil, natural gas e.t.c., and these results in the replacement of natural ecosystem by artificial ones. This
Influence of Thermal Power Generation in Nigeria Environment
International organization of Scientific Research 53 | Page
presents not only very important impacts on the biophysical environment but it also causes changes in social and
economic structures of the society. These factors are often accounted for in planning, design and implementation
of electric power schemes.
However, the influence can be grouped into two:
1) Negative influence, which includes:
i. Health hazard
ii. Increases in noise level
iii. Climate change
iv. Human movement and migration
v. Scaring away of wildlife
2) Positive influence, such as:
i. Employment opportunity to indigenes
ii. Enjoyment of electricity
iii. Provision of pipe borne water
iv. Provision of schools and hospitals
v. Construction of road
VI. RECOMMENDATION This research shows that electricity is being generated at the outlay of the immediate environment, and
this is detrimental to human subsistence. It is recommended that, environmental troubles be projected and
adequately reflected in the setting up, designing and execution of electricity generation schemes for
sustainability of power generation
REFERENCE [1]. Abrahamision, D.E. and Pogue, R.E. ( 2009), “The environmental impacts of a growing nuclear power
industry”, Minnesota Academy of Science Press, New York
[2]. Ada, U.U., (2012), “NEPA Management Development in Nigeria”, Caxtom Press (Invest. African) Limited,
Ibadan
[3]. Ayodele A. I., (2012), “Electricity development in Nigeria: Pattern of Nigeria „s Electric Energy Use”, pp 30-
32, Universal Press, Ibadan.
[4]. Ben Caven, (2016), “Impact Of Climatic Change On The Performance Of The Nigerian Power Supply
System”, PHCN Review, Volume VI, pp 10-11
[5]. David M. Lipscomb and Arthur C. Tayler, (2016), “Noise Control Handbook of Principles and Practices”,
Longman publishers, New York
[6]. Desgauliers G.T. (2012), “Energy Models For Planning And Policy Assessment”, pp. 342-401
[7]. R.C Ijeoma & I. Iyenemi "Hydro Power Generation In Nigeria, Environmental Ramifications "IOSR Journal of
Electrical and Electronics Engineering (IOSR-JEEE) 13.5 (2018): 01-09.
[8]. Eisenbu, M. and Gleason, G.G., (2008), “Electric Power and Thermal Discharges”, Science Publishers, New
York.
[9]. Foell, W.K., Green, C. W., and Hanson, M.E. (2011), “Environmental Considerations in Renewable Energy
Policy”, Washington D.C
[10]. Furlan, G., Rodriquez, H. and Violini, G., (2006), “Non-conventional Energy Sources”, ACIF series Volume 3,
World Scientific publishing Co. Ltd. Singapore
[11]. Hottel, H.C. and Howard, J.B., (2013), “New Energy Technology Facts and Assessments”, Massachusetts
Institute of Technology Press, London
[12]. Ibe, A.O. and Okedu, K.E., (2015),“Optimized Electricity Generation in Nigeria”, Nigerian Journal of
Engineering Management (NJEM), Volume 8 No. 4, pp 7-16
[13]. Lashof, D. and Ahuja, D. (2016), “Relative Contributions of Greenhouse Gases to Global Warming”,
nature.com
[14]. Lawal Y. O.(2010), “Maintenance Culture: The Nigeria Situation”, Nigeria Journal of Engineering
Management (NJEM), Vol. 1.No. 4
[15]. National Environment Protection (Effluent Limitation) Regulations, (2016), Published by Federal
Environmental Protection Agency for Federal ministry of Environment
[16]. Niels, H. And Heathcote, V. (2011); "The Early Meaning Of Electricity", Annals Of Science 63 (4): pp. 261–
275
[17]. Onyekwere, O. (2014), “Laws To Break Nepa Monopoly”
[18]. PHCN publications on Ughelli thermal power station, (2016)
R.C Ijeoma. “Influence of Thermal Power Generation in Nigeria Environment.” IOSR Journal
of Engineering (IOSRJEN), vol. 09, no. 03, 2019, pp. 42-53.