Influence of composition, bonding characteristics and microstructure ...

N. DOLI] et al.: INFLUENCE OF THE COOLING RATE ON THE MICROSTRUCTURE DEVELOPMENT ...
INFLUENCE OF THE COOLING RATE ON THEMICROSTRUCTURE DEVELOPMENT OF THE
EN AW-AlMg4.5Mn0.7 ALLOY
VPLIV OHLAJEVALNE HITROSTI NA RAZVOJMIKROSTRUKTURE V ZLITINI EN AW-AlMg4,5Mn0,7
Natalija Doli}1, Jo`ef Medved2, Primo` Mrvar2, Faruk Unki}1
1University of Zagreb, Faculty of Metallurgy, Aleja narodnih heroja 3, 44103 Sisak, Croatia2University of Ljubljana, Faculty of Natural Sciences and Engineering, Department of Materials and Metallurgy, A{ker~eva c. 12, 1000
Ljubljana, [email protected]
Prejem rokopisa – received: 2012-03-01; sprejem za objavo – accepted for publication: 2012-04-05
In this work, the course of the solidification and development of the microstructure of a sample of the EN AW-AlMg4.5Mn0.7alloy, taken out from the edge of a slab cast with a semi-continuous, vertical, direct water-cooling process (DC) was studied.In order to determine the influence of the cooling rate on the type, the morphology and the solidification course of some phasesin EN AW-AlMg4.5Mn0.7, a simultaneous thermal analysis using differential scanning calorimetry was conducted. Its resultswere compared with the thermodynamically calculated equilibrium phases obtained on the basis of the Thermo-Calc software.The results were also compared with the results of a simple thermal analysis, which was conducted by casting the sample in aspecially designed measuring cell using the Croning process and in a cone-shaped measuring cell. The temperature intervals ofthe reference temperature-phase transitions (the liquidus temperature TL, the temperature evaluation of the first eutectic TE1 andthe second eutectic TE2 and the solidus temperature TS) and the times of the solidification �ts of the EN AW-AlMg4.5Mn0.7 alloywere determined. The mathematical models describing the changes in these parameters depending on the cooling rate weremade.Using a quantitative analysis carried out with an energy dispersive spectrometer, the following microstructural constituents weredetermined: the intermetallic phase Al6(Fe, Mn), which, due to an unequilibrium evaluation, corresponds to the first eutectic (�Al
+ Al6(Fe, Mn) and the Mg2Si intermetallic phase, as the second eutectic phase (�Al + Mg2Si). In addition, the presence of thepores was determined. The total surface area of some intermetallic phases and pores and their distribution in dependence on thecooling rate were examined by a scanning electron microscope.Keywords: EN AW-AlMg4.5Mn0.7 alloy, cooling rate, microstructure
V delu obravnavamo potek strjevanja in razvoj mikrostrukture zlitine EN AW-AlMg4,5Mn0,7. Vzorec je bil odvzet na robuslaba, ulitega po polkontinuirnem postopku z direktnim vodnim hlajenjem v navpi~ni smeri ("DC").Za opredelitev vpliva ohlajevalne hitrosti na potek strjevanja v zlitini EN AW-AlMg4,5Mn0,7 in s tem na razvoj faz je bilauporabljena simultana termi~na analiza z diferen~no vrsti~no kalorimetrijo. Dobljene rezultate smo primerjali s termodinamskoravnote`nimi izra~uni posameznih faz. Izra~un je bil narejen s programom "Thermo-Calc". Primerjava je bila narejena tudi zrezultati, dobljenimi z enostavno termi~no analizo. V tem primeru smo vzorec ulili v merilno celico, narejeno po postopkuCronning, in v trajno kokilo sto`~aste oblike. Tako smo dolo~ili karakteristi~ne temperature faznih transformacij (temperaturoliquidusa TL, temperaturo prvega TE1 in drugega evtektika TE2 ter temperaturo solidusa TS) ter ~ase strjevanja zlitine �ts. Za opisteh, od hitrosti odvisnih parametrov, smo izdelali tudi matemati~ni model.Kvantitativna analiza posameznih faz oziroma identifikacija le-teh je bila narejena z energijsko-disperzijsko spektroskopijorentgenskih `arkov. Opredeljene so bile naslednje mikrostrukturne sestavine: intermetalna faza Al6(Fe, Mn), ki je v zvezi zneravnote`nim strjevanjem prvega evtektika (�Al + Al6(Fe, Mn)), intermetalno fazo Mg2Si, ki je del evtektskega heterogenegazloga (�Al + Mg2Si). Prav tako smo naredili analizo poroznosti. Za opredelitev dele`a poroznosti, kot tudi posameznihintermetalnih faz in njihovo porazdelitev v odvisnosti od ohlajevalne hitrosti, je bil uporabljen vrsti~ni elektronski mikroskop.Klju~ne besede: zlitina EN AW-AlMg4,5Mn0,7, ohlajevalna hitrost, mikrostruktura
1 INTRODUCTION
Aluminum and its alloys are used in a variety ofapplications in industry and construction. Typical appli-cations of aluminum alloys are found in the automotiveindustry, in the maritime, air and railway transportations.Recently, aluminum has been competing with steel in theautomotive industry for the production of engine parts,suspensions and car-space frames. In most of theseapplications rolled products are used with a thickness of0.1–25 mm.1 Intensive industrial competition requires acontinuous quality improvement. The main motivationfor this activity originates in the growing demands of the
industry for a development of high-strength alloys inorder to reduce the weight of various products.1
Aluminum-magnesium alloys constitute a group ofnon-heat treatable alloys with a medium strength, highductility, an excellent corrosion resistance and weld-ability (the 5XXX series). Wrought Al-Mg alloys areused as structural materials for marine, automotive, air-craft and cryogenic applications, while their cast formsare mainly used, due to the corrosion resistance, in dairy,food-handling and chemical-processing applications.2–4
The EN AW-AlMg4.5Mn0.7 alloy is one of the mostpopular commercial alloys that is mostly used for ship
Materiali in tehnologije / Materials and technology 46 (2012) 6, 563–571 563
UDK 669.715:620.187:544.015.4 ISSN 1580-2949Original scientific article/Izvirni znanstveni ~lanek MTAEC9, 46(6)563(2012)

structures due to its superior resistance against corro-sion.5
The non-heat treatable aluminum alloys are utilizedin all of the major industrial markets for aluminumflat-rolled products. At the end of the 20th century,transportation, packaging and building/construction sec-tors represented the largest users of the non-heat-treatable sheets. High-performance, non-heat-treatablealloys were developed for the new and existing appli-cations ranging from foil to high-strength structuralproducts. The development of the new or improvedalloys was based on the need for a structural perfor-mance or appearance in the end products and theproductivity during the customer’s manufacturingprocess.1
The polythermal section of the ternary Al-Mg-Mnphase diagram shown in Figure 1 gives us the firstapproximation of the phase-transformation history forthe alloys like EN AW-5083, EN AW-5182, and ENAW-5456 containing the mass fraction of Mg 4.0–7.0 %and 0.3–0.6 % Mn. The solidification starts at 635–640°C with the formation of the �Al grains. After that,providing that the concentration of Mn is sufficient, the(�Al + Al6Mn) eutectics are formed in the temperaturerange from 627 °C to 617 °C. These reactions seldomoccur during the cooling following the solidificationbecause, due to a relatively low diffusion coefficient,manganese usually remains in the supersaturated solidsolution.6
The presence of silicon, as an impurity or an alloyingelement, in the Al-Mg-Mn alloys results in the formationof Mg2Si in addition to other phases. Most commercialalloys contain iron as an impurity. As a result, the (�Al +
Al6(Fe, Mn)) eutectics are formed in the temperaturerange from 600 °C to 570 °C, and the solidification iscompleted at approximately 570 °C with the formationof the (�Al + Al6(Fe, Mn) + Al3Fe) eutectics. Underequilibrium, the other phases that are frequentlyobserved in the Al-Mg-Mn-Fe alloys, e.g., Al8Mg5
(previously known as Al3Mg27–9) and Al10(Mg, Mn)3, are
formed only due to the precipitation from the aluminumsolid solution upon cooling in the solid state. Under thereal, non-equilibrium conditions, these phases can beformed during the solidification being a result of theeutectic reaction.6 In the case of a simultaneous presenceof iron and silicon in a 5XXX series alloy containing5 % Mg (e.g., the EN AW-5182 alloy), the solidificationwill end at 576–578 °C with the formation of Mg2Si by aeutectic reaction.6
The solidification paths that we considered above,describe the phase equilibrium and can hardly beaccomplished under the real casting conditions when thecooling rates are high and the diffusion processes,especially in the solid phase, cannot be completed tosuch an extent that the compositions of the phaseschange with the temperature in accordance with theequilibrium-phase diagram. Local deviations fromequilibrium result in a microsegregation and, eventually,in the shift of local equilibrium to the concentrations,where new phases are formed. In addition, some high-temperature peritectic reactions remain uncompleted andthe high-temperature phases – that have to disappear as aresult of these reactions – are retained at a lowertemperature and can be found in the solid state.6
For all aluminum-alloy components, the castingprocess plays an important role in controlling theproperties of the final products. Semi-continuous DirectChill (DC) casting is the most common method used forproducing aluminum-alloy ingots for the subsequentthermomechanical processing (TMP), such as rolling andextrusion.10,11 Casting defects such as microsegregationand porosity are usually present in the as-cast micro-structure and can lead to a deterioration of mechanicalproperties. Many studies have shown a detrimental effectof porosity on the fatigue properties of the materials usedin the as-cast or heat-treated state.11,12
2 EXPERIMENTAL WORK
Tests were carried out on a sample of an ingot cast bysemi-continuous, vertical, direct water-cooling process(Direct Chill), having the dimensions of 520 mm × 1 680mm × 4 809 mm and being produced from charge 3116of the EN AW-AlMg4.5Mn0.7 alloy (the numericalsymbol EN AW-5083).13 The structure of the tested alloy3116 contains a significantly higher share of thetechnological waste, compared to the primary aluminum,in the ratio of 75 : 25. The main components of thetechnological waste are the alloys EN AW-1050, ENAW-5049 and EN AW-5754. Before casting, the melt
N. DOLI] et al.: INFLUENCE OF THE COOLING RATE ON THE MICROSTRUCTURE DEVELOPMENT ...
564 Materiali in tehnologije / Materials and technology 46 (2012) 6, 563–571
Figure 1: Isopleths of the Al-Mg-Mn phase diagram at the massfraction of Mg 5 % 6
Slika 1: Ravnote`ni izopletni fazni diagram Al-Mg-Mn pri masnemdele`u Mg 5 % 6

was refined with a mixture of argon and chlorine in anALPUR unit. The grain refinement was performed byadding the AlTi5B master alloy in the form of small bars(in the melting furnace) and wires (into the groove infront of ALPUR), in an average quantity of 1.74 kg/t ofthe melt.14
From the ingot cast in this way, an about 30-mmthick, transversally cut plate was taken out from its frontpart, after having been disposed of the technologicalwaste of about 200 mm at the beginning of the casting.From the cut plate, from its edge, a part of the ingot wastaken out and used to perform tests with a simple thermalanalysis (STA) and differential scanning calorimetry(DSC).
The thermodynamical calculation of the phaseequilibrium of the EN AW-AlMg4.5Mn0.7 charge-3116alloy was preliminary performed by the Thermo-Calc(TCW 5.0) software. This software allows a calculationof the phase stability of particular phases taking intoaccount the equilibrium conditions of temperature,pressure and chemical composition.
The simple thermal analysis was performed onsample 6P-1 (in the as-cast condition) taken out from thebeginning of the cast ingot of charge 3116. Sample 6P-1was molten in the graphite pot of an electric furnace.When the melt reached the temperature of approximately730 °C, it was poured from the graphite pot into twomeasuring cells: into a cell made with the Croningprocess (equipped with a single thermocouple in themiddle), Figure 2a, and a permanent cone-shapedmeasuring cell (Figure 2b). For the characterization ofthe solidification of sample 6P-1 at different coolingrates, the cone-shaped measuring cell of grey cast ironwas used with three thermocouples installed in it. Thedescribed measuring cells are illustrated in Figures 2aand 2b.
The samples for the metallographic and micro-structural investigations were taken out from thecorresponding place in the immediate neighborhood ofthe thermocouple. These samples are illustrated in Fig-ures 3a and 3b.
The samples for the metallographic and micro-structural investigation were prepared with a standard
procedure of grinding and polishing, and afterwardsetching in 0.5 % HF. The samples for the microstructuralinvestigation were examined on a scanning electronmicroscope (SEM) TESCAN VEGA TS5136LS withphase recognition performed on the basis of a chemical-composition analysis made with the energy dispersivespectrometer (EDS).
The cooling curves were obtained with a data acqui-sition during the cooling and solidification processesusing a measuring card DAQ Pad-MI0-16XE-50 and thecorresponding software LabView 7.0. The cooling curveswere afterwards plotted and analyzed with the Origin 7.0software, determining the reference temperatures of thephase transformation in real samples.
A simultaneous thermal analysis was performed withthe differential scanning calorimetry (DSC) method onthe NETZSCH equipment, type Jupiter 449C on sample6P-1 using the heating and cooling techniques with thepurpose of establishing the reference temperatures ofphase transformations and solidification intervals, aswell as the corresponding enthalpies and the specificheat extraction for each phase.
3 RESULTS AND DISCUSSION
The chemical composition of the investigated chargewas determined with an optical emission spectrometerand it is presented in Table 1. The sample for the
N. DOLI] et al.: INFLUENCE OF THE COOLING RATE ON THE MICROSTRUCTURE DEVELOPMENT ...
Materiali in tehnologije / Materials and technology 46 (2012) 6, 563–571 565
Figure 3: Sampling methodology for the metallographic and micro-structural analysis with the marked places of the performed analysis:a) photography of a cut sample poured into the measuring cell madewith the Croning process with a marked place of sample taking and adescription; b) photography of a cut sample poured into the permanentcone-shaped measuring cell with the marked places of sample takingand a descriptionSlika 3: Prikaz mesta odvzema vzorcev v ulitku za metalografsko inmikrostrukturno analizo s pripadajo~imi oznakami: a) slika razre-zanega in ozna~enega vzorca, ulitega v merilno celico Croning, b)slika razrezanega in ozna~enega vzorca, ulitega v trajno sto`~astomerilno celico iz sive litine
Figure 2: Measuring cell made: a) with the Croning process and b)the cone-shaped grey iron-measuring cellSlika 2: Merilna celica, narejena: a) po postopku Croning in b) sto`~a-sta merilna celica iz sive litine

chemical analysis was taken out during the casting of aningot with a length of about 0.5 m.
There were no significant deviations of the chemicalcomposition from the referential values prescribed by thestandard EN 573-3: 2002.13
The thermodynamical calculation of the particularphase stability, along with the initial temperature of 20°C, the pressure of 105 MPa and the specific chemicalcomposition of the examined alloys (4.56 % Mg, 0.43 %Mn, 0.38 % Fe and 0.14 % Si), resulted in an isopletephase diagram (Figure 4a) and an area of the tempera-ture stability of each phase (Figure 4b).
The equilibrium solidification of the ENAW-AlMg4.5Mn0.7 alloy proceeds as follows (Figure4): primary crystals of �Al, Al6Mn and Mg2Si. Under thesolidus, the Al3Mg2 (in the literature known as Al8Mg5)and Al3Fe phases also precipitated.
It was determined that at 635 °C the primary crystalsof �Al are the first to be evaluated, which corresponds tothe liquidus temperature. Shortly after the evaluation ofthe �Al crystals at 625 °C the first eutectic phase, Al6Mn,was solidified due to a relatively high content of manga-nese in this alloy. The beginning of the secondary eutec-tic solidification (Mg2Si + �Al) can be predicted to occurat 581 °C. From the diagram in Figure 4a the solidustemperature of 578 °C was determined, which isassociated with the maximum contribution of primarydendrites of aluminum at this temperature. A precipita-tion of the first phase, Al8Mg5, starts at 235 °C in thesolid state. This is followed by the precipitation of theiron phase, Al3Fe, at 115 °C. An interpretation of these
diagrams indicates a complex solidification sequencewith a series of interconnected reactions. The melt isstable after the initial temperature of 650 °C to 578 °C.
On the basis of the data calculated by the Thermo-Calc 5.0 software (Figure 4a) and their stability histo-gram (Figure 4b), an evaluation sequence can be deter-mined as shown in Table 2.
Table 2: Sequence of the microstructural-constituent evaluation madeon the basis of the data calculated with the Thermo-Calc softwareTabela 2: Izra~unane reakcije in razvoj mikrostrukturnih sestavin pristrjevanju zlitine z uporabo programa Thermo-Calc
Predicted reactions Temperature, T/°CL � �Al + L’ 635 Liquidus temperature, TL
L’� �Al + Al6Mn + L’’ 625 Primary eutectictemperature, TE1
L’’� �Al + Mg2Si 581 Secondary eutectictemperature, TE2
�Al � Al8Mg5 + �Al’ 235 Precipitation temperature ofthe low temperature phases�Al’� Al3Fe 115
where L’ is melt composition L’; L’’ is melt compositionL’’.
The cooling curves of sample 6P-1 cast in acone-shaped, grey iron-measuring cell are presented inFigure 5. The cooling curve of the sample from the conevertex is called 6P-11, the one taken from the middle ofthe cone is 6P-12 and the one taken from the cone base is6P-13.
The cooling curves in Figure 5 indicate a significantmutual deviation from the values for reference tem-peratures of the phase changes, as well as of the curve
N. DOLI] et al.: INFLUENCE OF THE COOLING RATE ON THE MICROSTRUCTURE DEVELOPMENT ...
566 Materiali in tehnologije / Materials and technology 46 (2012) 6, 563–571
Figure 4: Thermodynamical calculation of the equilibrium-phase diagram of the investigated EN AW-AlMg4.5Mn0.7 alloy: a) polythermalsection of the equilibrium-phase diagram, b) areas of temperature stability for particular phasesSlika 4: Ravnote`ni termodinamski izra~un faznega diagrama za zlitino EN AW AlMg4,5Mn0,7: a) izopletni ravnote`ni fazni diagram, b) tem-peraturna obmo~ja stabilnosti posameznih faz
Table 1: Chemical composition of the EN AW-AlMg4.5Mn0.7 alloyTabela 1: Kemijska sestava zlitine EN AW-AlMg4,5Mn0,7
Chemical composition in mass fractions, w/%Si Fe Cu Mn Mg Cr Zn Ti Be Na
0.14 0.38 0.01 0.43 4.56 0.11 0.006 0.021 0.0057 0.0012

gradient, indicating significant differences in the coolingrates. The cooling rates of each sample were establishedfrom the cooling curves, where the temperature and thetime intervals were determined from the differencebetween the maximum detected temperature (the pouringtemperature) and the nucleation temperature establishedon the first derivative curve.
The curve of sample 6P-13 features the least var-iation in temperature values, and with its smallest gra-dient it also has the lowest cooling rate of rc = 10.8 °C/s.Using the first and the second derivation cooling curves,the liquidus temperature TL = 632.7 °C, the temperaturesof the first and the second eutectics TE1 = 607.6 °C andTE2 = 570.9 °C, as well as the solidus temperature TS =540.9 °C were determined. The solidification time forthe cooling rate of sample 6P-13, as the difference of thetimes, at which the liquidus and solidus temperaturesoccur, amounts to �ts = 65 s.
The cooling curve of sample 6P-12 indicates thecooling rate of rc = 40.3 °C/s, and here the followingtemperatures of the phase transitions were obtained: TL =634.0 °C, TE1 = 594.0 °C, TE2 = 544.0 °C and TS = 523.7°C. There is a marked fall in all the temperatures com-pared to the previous cooling rate of 10.8 °C/s, exceptfor TL whose deviation is minimum and amounts to ≈1.3°C. In this case the solidification is completed in �ts =11.2 s.
The curve of sample 6P-11 shows the cooling rate ofrc = 124.0 °C/s that makes the oscillations more pro-nounced, and there is an uncertainty in determining theappropriate, respective phase-transition temperatures.
Figure 6 shows a typical cooling curve and its firstderivation of the tested sample 6P-1, STA, cast in themeasuring cell made with the Croning process. On thecooling curve of the tested sample 6P-1, STA (Figure 6),there are no pronounced peaks due to a relatively lowcooling rate in the measuring cell made with the Croningprocess of only 8.3 °C/s. By means of the first derivationof the cooling curve, the liquidus and solidus tempera-tures can be determined, as well as the eutectic tempe-ratures of the tested sample.
From the cooling curve of sample 6P-1, STA, it couldbe noted that the solidification starts at the temperatureof TL = 629.3 °C. The eutectic solidification of the meltinto eutectic E1 occurs at the temperature of TE1 = 598.6°C. At TE2 = 568.8 °C the second eutectic E2 occurs. Thesolidification of sample 6P-1, STA, ceases at the tem-perature solidus of TS = 539.3 °C, so that the obtainedtime of the solidification amounts to �ts = 250.1 s.
The reference temperatures of the phase transfor-mations of the samples tested with a DSC analysis (6P-1,DSC) in the measuring cell made with the Croningprocess (6P-1, STA), and for individual places in the
N. DOLI] et al.: INFLUENCE OF THE COOLING RATE ON THE MICROSTRUCTURE DEVELOPMENT ...
Materiali in tehnologije / Materials and technology 46 (2012) 6, 563–571 567
Figure 6: Cooling curve and differential cooling curve of sample6P-1, STA of the EN AW-AlMg4.5Mn0.7 alloy cast in the measuringcell made with the Croning processSlika 6: Ohlajevalna krivulja in odvod ohlajevalne krivulje vzorca6P-1, STA zlitine EN AW-AlMg4,5Mn0,7, ulite v merilno celicoCroning
Figure 5: Cooling curves of sample 6P-1 cast in a cone-shaped, greyiron-measuring cellSlika 5: Ohlajevalna krivulja vzorca 6P-1, ulitega v trajno sto`~astokokilo iz sive litine
Table 3: Reference temperatures of the phase changes at different cooling rates for sample 6P-1 of the EN AW-AlMg4.5Mn0.7 alloyTabela 3: Zna~ilne temperature faznih premen pri razli~nih ohlajevalnih hitrostih za vzorec 6P-1 zlitine EN AW-AlMg4,5Mn0,7
Cooling curve/Sample indication rc/(°C/s) TL/°C TE1/°C TE2/°C TS/°C �ts/s
TCW 0 635.0 625.0 581.0 578.0 –6P-1, DSC 0.17 637.2 595.8 569.6 527.0 660.66P-1, STA 8.3 630.8 598.5 568.3 538.9 250.1
6P-13 10.8 632.7 607.6 570.9 540.9 65.06P-12 40.3 634.0 594.0 544.0 523.7 11.2

cone-shaped die cast (6P-13 and 6P-12), following theascending cooling rate, are presented in Table 3.
The physical models for the dependences of parti-cular reference temperatures of the phase transformat-ions on the cooling rates were made. Exponential typesfor TL, TE1, TE2 and TS are graphically presented inFigure 7.
The liquidus temperature, TL, is cooling-rate depen-dent and it covers the range of 6.4 °C. The evaluation ofthe primary eutectic phase E1 occurs in the temperature
interval from 625.0 °C, for the equilibrium solidification,to 594.0 °C, for the cooling rate of rc = 40.3 °C/s, andwith a tendency of the temperature TE1 decrease. The TE2
curve has a similar trend. The largest decrease in thesolidus temperature TS was observed at the highestcooling rate. The decrease was 54.3 °C of the coolingrate at the equilibrium solidification (rc = 0 °C/s) to themaximum measured cooling rate of the sample from themiddle part of the cone-shaped mould (rc = 40.3 °C/s).The deviation in TS from the equilibrium solidification(rc = 0 °C/s) TS = 578.0 °C to the cooling rate of rc = 0.17°C/s (sample 6P-1, DSC, TS = 527.0 °C/s, is the result ofthe formation of eutectics, Figure 7 and Table 3. Gener-ally speaking, the liquidus temperature TL remainsalmost unchanged, while the temperatures TE1, TE2 and TS
decrease with an increase in the cooling rate.The physical models for the dependences of liquidus,
primary and secondary eutectic temperatures and solidustemperature were illustrated with the following equationsand the corresponding correlation coefficient R2:
T r rL c c= − ⋅ + ⋅636 00 055 0 013 2. . . R2 = 0.73 (1)
T r rE c c1261010 080 0 010= − ⋅ + ⋅. . . R2 = 0.26 (2)
T r rE c c2257519 051 0 007= − ⋅ + ⋅. . . R2 = 0.90 (3)
T r rS c c= − ⋅ + ⋅55267 154 0 021 2. . . R2 = 0.31 (4)
The largest deviations from the obtained functioncurves show the temperature of the first eutectic and soli-dus temperatures that also have the minimum correlationcoefficient R2.
N. DOLI] et al.: INFLUENCE OF THE COOLING RATE ON THE MICROSTRUCTURE DEVELOPMENT ...
568 Materiali in tehnologije / Materials and technology 46 (2012) 6, 563–571
PlaceMg Al Si Mn Fe O
w/% x/% w/% x/% w/% x/% w/% x/% w/% x/% w/% x/%A 16.36 16.99 67.61 63.27 8.18 7.35 – – – – 7.85 12.38B – – 65.41 79.60 – – 6.56 3.92 28.03 16.48C 4.35 4.69 92.12 89.52 – – – – – – 3.54 5.79
Figure 8: Microstructure of sample 6P-1 obtained with a scanning electron microscope (SEM) with the marked places of quantitative analysisperformed by EDS, their particular spectrums and the quantitative-analysis results (place A – black phase: Mg, Si; stoichiometry Mg2Si; place B– white phase: Al, Fe, Mn; stoichiometry Al6(Fe, Mn); place C – matrix: �Al); w/% mass fraction; x/% mole fractionSlika 8: Mikrostruktura vzorca 6P-1, posneta z vrsti~nim elektronskim mikroskopom (SEM), z ozna~enimi mesti kvantitativne analize (EDS) terpripadajo~i spektri in rezultati kvantitativne analize (mesto A – ~rna faza: Mg, Si; stehiometrija Mg2Si; mesto B – bela faza: Al, Fe, Mn;stehiometrija Al6(Fe, Mn); mesto C – matrica: �Al); w/% masni dele`; x/% molski dele`
Figure 7: Dependences of the reference temperatures of the phasechanges on the cooling rates of the EN AW-AlMg4.5Mn0.7 alloysamplesSlika 7: Karakteristi~ne temperature faznih premen zlitine ENAW-AlMg4,5Mn0,7 v odvisnosti od ohlajevalne hitrosti

The qualitative analysis of the microstructural con-stituents of the EN AW-AlMg4.5Mn0.7 alloy wasperformed in order to determine and/or confirm thepresumed stoichiometry with the energy dispersivespectrometry (EDS) for all the investigated cooling rates.An example of the quantitative phase analysis of theas-cast sample 6P-1 is shown in Figure 8.
The analysis of sample 6P-1 (Figure 8) confirms thepresence of the phase based on magnesium and silicon,which corresponds to the stoichiometric Mg2Si phase,defined as the second eutectic phase (�Al + Mg2Si) by theThermo-Calc. The Mg2Si phase is shown in the imagesas a black, irregular, branched-shaped phase (Figure 8,place A).
The phase based on manganese (Al6Mn) was notestablished although its presence as the primary eutecticphase was assumed during the thermodynamic modelingof the solidification (TCW 5.0). However, the phasescontaining aluminum, manganese and iron were deter-mined and they seem to correspond to the Al6(Fe, Mn)phases. These are the white phases in the structure thatappear in various forms, such as needles (Figure 8, placeB), the forms with a Chinese-script morphology (Figure9) determined with a mapping analysis, or irregularrounded shapes. From the obtained results it could beconcluded that, due to the non-equilibrium solidification,the above-mentioned primary eutectic (�Al + Al6Mn)corresponded to eutectic (�Al + Al6(Fe, Mn)).
Figure 9 shows that iron and magnesium are con-centrated in the eutectic interdentritic regions. Theconcentration of magnesium was markedly elevated inthe eutectic area, where silicon is also found, which indi-cates the occurrence of eutectic (�Al + Mg2Si), Figure 9band 9c. In the areas with elevated concentrations of ironthe elevated content of manganese is also observed,which confirms the existence of the first eutectic (�Al +Al6(Fe, Mn)). The metal base containing aluminum andmagnesium can be seen as the grey background (Figure8, place C, Figure 9), where all of the above-mentionedphases are different.
These results were confirmed by the mapping andEDS analyses, Figure 9.
The presence of phases Al8Mg5 and Al3Fe, whichshould be separated in the solid state, was not establishedalthough their presence was assumed during the thermo-dynamic modeling of solidification. This is attributed tothe cooling conditions that are different from thoseassumed for the equilibrium conditions of solidification.
In addition to the above-mentioned phases present insample 6P-1, the shrinkage porosity also appears in asmall quantity. It appears in black color and with anirregular shape, formed in the dendritic mushy zones,where feeding is not possible, as shown in Figure 10.
By conducting a qualitative analysis of the micro-structural constituents of samples 6P-1, DSC; 6P-1, STA;6P-13, 6P-12 and 6P-11, the presence of equal inter-metallic phases and porosity was also established forsample 6P-1.
Different cooling rates contribute to the developmentof microstructural constituents with different sizes andmorphologies. It is well known that a high cooling rateprompts the refining effect because there is not enoughtime available for achieving the full size as in the casesof low cooling rates. Figure 10 shows a comparativenumber of images of the microstructures of samples6P-1, DSC; 6P-1, JTA, 6P-13, 6P and 6P-12-11, cast atdifferent cooling rates and recorded with a scanningelectron microscope with different magnifications, whichare listed on each figure.
When examining Figure 10 in terms of a uniformmagnification, the differences in the sizes and themorphologies of the microstructural constituents ofindividual samples are not revealed; the intermetallicphases are evenly distributed and have the samemorphology.
However, a comparison of the metallographic imagesof different samples with a scanning electron microscopewith the same magnification shows a significantvariation in the sizes of the surveyed intermetallic phasesand pores. The particles of the intermetallic phase(Al6(Fe, Mn)) and Mg2Si formed at the slowest coolingrate (rc = 0.17 °C/s), Figure 10a, are visible anddistinguishable to the naked eye, and are the largest incomparison with the ones occurring at the other coolingrates. As the cooling rate grows these intermetallic
N. DOLI] et al.: INFLUENCE OF THE COOLING RATE ON THE MICROSTRUCTURE DEVELOPMENT ...
Materiali in tehnologije / Materials and technology 46 (2012) 6, 563–571 569
Figure 9: Microstructure (SEM) of sample 6P-1 obtained with themapping analysisSlika 9: Mikrostruktura (SEM) vzorca 6P-1 s ploskovno porazde-litvijo elementov v mikrostrukturi
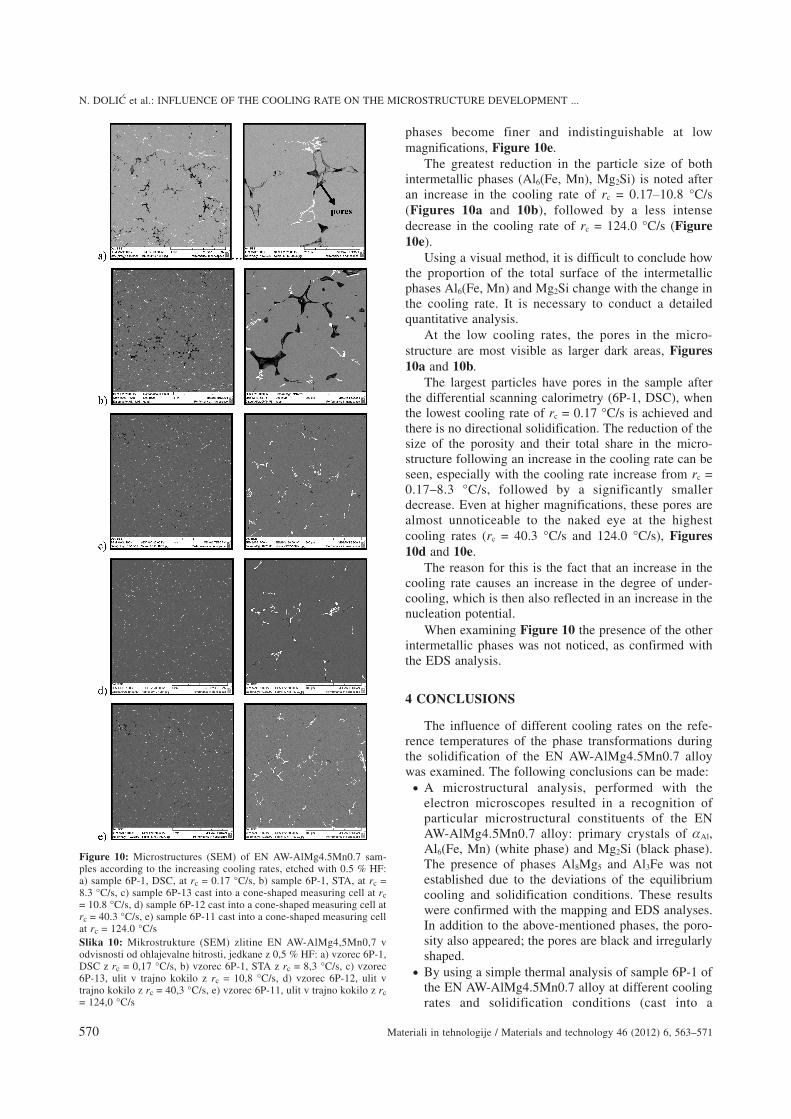
phases become finer and indistinguishable at lowmagnifications, Figure 10e.
The greatest reduction in the particle size of bothintermetallic phases (Al6(Fe, Mn), Mg2Si) is noted afteran increase in the cooling rate of rc = 0.17–10.8 °C/s(Figures 10a and 10b), followed by a less intensedecrease in the cooling rate of rc = 124.0 °C/s (Figure10e).
Using a visual method, it is difficult to conclude howthe proportion of the total surface of the intermetallicphases Al6(Fe, Mn) and Mg2Si change with the change inthe cooling rate. It is necessary to conduct a detailedquantitative analysis.
At the low cooling rates, the pores in the micro-structure are most visible as larger dark areas, Figures10a and 10b.
The largest particles have pores in the sample afterthe differential scanning calorimetry (6P-1, DSC), whenthe lowest cooling rate of rc = 0.17 °C/s is achieved andthere is no directional solidification. The reduction of thesize of the porosity and their total share in the micro-structure following an increase in the cooling rate can beseen, especially with the cooling rate increase from rc =0.17–8.3 °C/s, followed by a significantly smallerdecrease. Even at higher magnifications, these pores arealmost unnoticeable to the naked eye at the highestcooling rates (rc = 40.3 °C/s and 124.0 °C/s), Figures10d and 10e.
The reason for this is the fact that an increase in thecooling rate causes an increase in the degree of under-cooling, which is then also reflected in an increase in thenucleation potential.
When examining Figure 10 the presence of the otherintermetallic phases was not noticed, as confirmed withthe EDS analysis.
4 CONCLUSIONS
The influence of different cooling rates on the refe-rence temperatures of the phase transformations duringthe solidification of the EN AW-AlMg4.5Mn0.7 alloywas examined. The following conclusions can be made:
• A microstructural analysis, performed with theelectron microscopes resulted in a recognition ofparticular microstructural constituents of the ENAW-AlMg4.5Mn0.7 alloy: primary crystals of �Al,Al6(Fe, Mn) (white phase) and Mg2Si (black phase).The presence of phases Al8Mg5 and Al3Fe was notestablished due to the deviations of the equilibriumcooling and solidification conditions. These resultswere confirmed with the mapping and EDS analyses.In addition to the above-mentioned phases, the poro-sity also appeared; the pores are black and irregularlyshaped.
• By using a simple thermal analysis of sample 6P-1 ofthe EN AW-AlMg4.5Mn0.7 alloy at different coolingrates and solidification conditions (cast into a
N. DOLI] et al.: INFLUENCE OF THE COOLING RATE ON THE MICROSTRUCTURE DEVELOPMENT ...
570 Materiali in tehnologije / Materials and technology 46 (2012) 6, 563–571
Figure 10: Microstructures (SEM) of EN AW-AlMg4.5Mn0.7 sam-ples according to the increasing cooling rates, etched with 0.5 % HF:a) sample 6P-1, DSC, at rc = 0.17 °C/s, b) sample 6P-1, STA, at rc =8.3 °C/s, c) sample 6P-13 cast into a cone-shaped measuring cell at rc= 10.8 °C/s, d) sample 6P-12 cast into a cone-shaped measuring cell atrc = 40.3 °C/s, e) sample 6P-11 cast into a cone-shaped measuring cellat rc = 124.0 °C/sSlika 10: Mikrostrukture (SEM) zlitine EN AW-AlMg4,5Mn0,7 vodvisnosti od ohlajevalne hitrosti, jedkane z 0,5 % HF: a) vzorec 6P-1,DSC z rc = 0,17 °C/s, b) vzorec 6P-1, STA z rc = 8,3 °C/s, c) vzorec6P-13, ulit v trajno kokilo z rc = 10,8 °C/s, d) vzorec 6P-12, ulit vtrajno kokilo z rc = 40,3 °C/s, e) vzorec 6P-11, ulit v trajno kokilo z rc= 124,0 °C/s

measuring cell made with the Croning process and apermanent cone-shaped measuring cell), togetherwith differential scanning calorimetry, the coolingrates of rc = (0.17; 8.3; 10.8; 40.3 and 124.0) °C/swere obtained. The following reference temperaturesfrom the solidification were determined: TL, TE1, TE2,TS and �ts. Mathematical models were calculated forthe dependence of the reference temperatures on thecooling rates (equitation (1)–(4)). Generally speak-ing, liquidus temperature TL remains almost un-changed, while temperatures TE1, TE2 and TS decreasewith an increase in the cooling rate.
• By examining the samples at the same magnification,the differences in the size and the morphology ofindividual microstructural constituents of eachsample are not revealed; the intermetallic phases areevenly distributed and have the same morphology.
• Using a visual method to observe images with theSEM, it was found that an increase in the cooling rateleads to a decrease in the particle size of both inter-metallic phases Al6(Fe, Mn) and Mg2Si, and thatsubsequently leads to a refining of the microstructure.It was also found that the pores are the largest at theslowest cooling rate (rc = 0.17 °C/s), while anincrease in the cooling rate leads to a reduction of thepores’ size, as well as to a reduction of their totalshare in the microstructure.
Acknowledgements
The research was performed in the frame of thenational project 124-0000000-1503 financed by theMinistry of Science, Education and Sports of Croatia.
5 REFERENCES
1 Z. Zhu, Ageing and strengthening of cold-rolled Al-Mg(-Cu)-Si-Mnalloys: experimental analysis and modeling, Ph.D. Thesis, Universityof Southampton, Faculty of Engineering, Science & Mathematics,Southampton, United Kingdom 2006
2 I. J. Polmear, Light Alloys, Metallurgy of the light metals, Arnold,London 1995
3 S. Lathabai, P. G. Lloyd, The effect of scandium on the microstruc-ture, mechanical properties and weldability of a cast Al-Mg alloy,Acta Materialia, 50 (2002), 4275–4292
4 ASM Specialty Handbook®, Aluminum and Aluminum Alloys, ASMInternational, Materials Park, Ohio 2002
5 T. Aiura, N. Sugawara, Y. Miura, The effect of scandium on theas-homogenized microstructure of 5083 alloy for extrusion,Materials Science and Engineering, A280 (2000), 139–145
6 D. G. Eskin, Physical metallurgy of Direct Chill casting of alumi-nium alloys, CRC Press/Taylor and Francis Group, Boca Raton 2008
7 L. F. Mondolfo, Aluminum alloys, structure and properties, Butter-worths, London 1976
8 ASM Handbook®, Vol. 3, Alloy phase diagrams, ASM International,Materials Park, Ohio 1992
9 J. L. Murray, Al-Mg (Aluminium-Magnesium), Binary systems ofaluminium – admixture and their importance for metallurgy, Vysoká{kola báòská-Technická Univerzita, Ostrava 2003
10 M. M. R. Jaradeh, Ph. D. Thesis, The effect of processing parametersand alloy composition on the microstructure formation and quality ofDC cast aluminium alloys, Mid Sweden University, Sundsvall, Swe-den 2006
11 A. Chaijaruwanich, P. D. Lee, R. J. Dashwood, Y. M. Youssef, H.Nagaumi, Evolution of pore morphology and distribution during thehomogenization of Direct Chill cast Al-Mg alloys, Acta Materialia,55 (2007), 285–293
12 P. D. Lee, R. C. Atwood, R. J. Dashwood, H. Nagaumi, Modeling ofporosity formation in Direct Chill cast aluminum-magnesium alloys,Materials Science and Engineering A, 328 (2002), 213–222
13 EN 573-3: 2002, Aluminium and aluminium alloys – chemical com-position and form of wrought products – Part 3: Chemical Composi-tion, European Committee for Standardization (CEN), Brussels 2002
14 N. Doli}, Ph.D. Thesis, Influence of solidification and cooling con-dition on the properties of semicontinuous cast slabs of Al-Mg alloy,University of Zagreb, Faculty of Metallurgy, Sisak, Croatia 2010
N. DOLI] et al.: INFLUENCE OF THE COOLING RATE ON THE MICROSTRUCTURE DEVELOPMENT ...
Materiali in tehnologije / Materials and technology 46 (2012) 6, 563–571 571