Influence of Spleen Size Portal Pressure on Erythrocyte...
11
Journal of Clinical investigation Vol. 43, No. 6, 1964 Influence of Spleen Size and Portal Pressure on Erythrocyte Sequestration * R. THOMAS HOLZBACH, REGINALD A. SHIPLEY, RICHARD E. CLARK, AND ETHEL BUCHWALD CHUDZIK (From the Section of Gastroenterology and the Radioisotope Service, Veterans Administration Hospital, and the Department of Medicine, Western Reserve University, School of Medicine, Cleveland, Ohio) That a hemolytic process is one of the potential causes of anemia in cirrhosis of the liver has been well established by repeated demonstrations of decreased red cell survival time in a large propor- tion of patients (1-7). Shortened survival has been noted, not only with autologous cells, but also with transfused normal donor cells (1, 2). This would clearly establish the existence of an extracorpuscular factor. Moreover, Jandl (2) has pointed out that the exponential contour of disappearance curves observed in patients with cirrhosis suggests random fractional removal of cells by an organ such as the spleen. This of course is consistent with the widely accepted no- tion that the congestive splenomegaly of cirrhosis causes "hypersplenism." In previous studies employing thermally dam- aged Cr51-labeled red cells to assess the size of the spleen by a scanning procedure, both we (8) and Wagner and co-workers (9) found that the cells tended to disappear from circulating blood more rapidly in patients with cirrhosis than in control subjects. The present investigation was conducted in order that the rate of removal of thermally damaged cells might be measured defini- tively by analysis either of blood disappearance curves or of curves obtained by continuous record- ing of activity through an external probe placed over the spleen. It was expected that a seques- tration function could be assessed in patients with cirrhosis and other disorders affecting the spleen if the corpuscular variable were minimized by in- troducing labeled red cells that had been subjected to standardized thermal damage. At the same time the size of the spleen could be estimated by the scanning procedure previously described (8). * Submitted for publication October 28, 1963; accepted January 30, 1964. A measurement of spleen size along with measure- ments of portal pressure in patients with cirrhosis would allow correlations to be sought that might favor either size or congestive stasis as the prin- cipal cause of accelerated disappearance of eryth- rocytes. Methods Controls (15 patients). These were hospitalized male patients ranging in age from 32 to 60 years. Most had entered for treatment of active but uncomplicated peptic ulcer. They were carefully screened to exclude the pres- ence of existing or previous liver disease, abnormalities of liver function, and other known causes of "hyper- splenism." Cirrhosis (19 patients). These were hospitalized male patients, ages 33 to 66 years, in whom the diagnosis of cirrhosis had been made on the basis of clinical criteria including the following: history of alcoholism, various physical stigmata such as cutaneous spiders, hepatomegaly, jaundice, esophageal varices, ascites, and derangement of chemical liver function tests. Four had hemoglobin values below 11 g, and 7 below 12 g at the time of admission. Miscellaneous disorders (5 patients). A small non- homogeneous group of patients with splenomegaly, or disorders which lead to splenomegaly, was also studied. This group is characterized in Table II. The method of Cr"1 labeling and heat treatment of autologous erythrocytes before intravenous injection was the same as previously described (8). Briefly stated, it consisted of incubation of whole blood with radiochro- mate at room temperature followed by incubation of the washed cells in physiologic saline at 49.0 ± 0.10 C for exactly 60 minutes. The amount of radiochromium ac- tually injected in this study ranged from 200 to 250 Auc. Approximately 1 minute was required for the injection. In 27 patients, disappearance curves of radioactivity from whole blood were obtained by observations on venous samples collected, respectively, at approximately 2, 5, 10, 15, 20, 30, 45, and 60 minutes after injection, again at either 2 or 4 hours, and usually at 24 hours. In 11 of these 24 patients serum radioactivity also was determined to permit construction of a curve for serum and eryth- rocytes separately. 1125
-
Upload
nguyenliem -
Category
Documents
-
view
214 -
download
0
Transcript of Influence of Spleen Size Portal Pressure on Erythrocyte...

Journal of Clinical investigationVol. 43, No. 6, 1964
Influence of Spleen Size and Portal Pressure on ErythrocyteSequestration *
R. THOMASHOLZBACH, REGINALD A. SHIPLEY, RICHARD E. CLARK, ANDETHEL BUCHWALDCHUDZIK
(From the Section of Gastroenterology and the Radioisotope Service, Veterans AdministrationHospital, and the Department of Medicine, Western Reserve University,
School of Medicine, Cleveland, Ohio)
That a hemolytic process is one of the potentialcauses of anemia in cirrhosis of the liver has beenwell established by repeated demonstrations ofdecreased red cell survival time in a large propor-tion of patients (1-7). Shortened survival hasbeen noted, not only with autologous cells, butalso with transfused normal donor cells (1, 2).This would clearly establish the existence of anextracorpuscular factor. Moreover, Jandl (2)has pointed out that the exponential contour ofdisappearance curves observed in patients withcirrhosis suggests random fractional removal ofcells by an organ such as the spleen. This ofcourse is consistent with the widely accepted no-tion that the congestive splenomegaly of cirrhosiscauses "hypersplenism."
In previous studies employing thermally dam-aged Cr51-labeled red cells to assess the size ofthe spleen by a scanning procedure, both we (8)and Wagner and co-workers (9) found that thecells tended to disappear from circulating bloodmore rapidly in patients with cirrhosis than incontrol subjects. The present investigation wasconducted in order that the rate of removal ofthermally damaged cells might be measured defini-tively by analysis either of blood disappearancecurves or of curves obtained by continuous record-ing of activity through an external probe placedover the spleen. It was expected that a seques-tration function could be assessed in patients withcirrhosis and other disorders affecting the spleenif the corpuscular variable were minimized by in-troducing labeled red cells that had been subjectedto standardized thermal damage. At the sametime the size of the spleen could be estimated bythe scanning procedure previously described (8).
* Submitted for publication October 28, 1963; acceptedJanuary 30, 1964.
A measurement of spleen size along with measure-ments of portal pressure in patients with cirrhosiswould allow correlations to be sought that mightfavor either size or congestive stasis as the prin-cipal cause of accelerated disappearance of eryth-rocytes.
Methods
Controls (15 patients). These were hospitalized malepatients ranging in age from 32 to 60 years. Most hadentered for treatment of active but uncomplicated pepticulcer. They were carefully screened to exclude the pres-ence of existing or previous liver disease, abnormalitiesof liver function, and other known causes of "hyper-splenism."
Cirrhosis (19 patients). These were hospitalized malepatients, ages 33 to 66 years, in whom the diagnosis ofcirrhosis had been made on the basis of clinical criteriaincluding the following: history of alcoholism, variousphysical stigmata such as cutaneous spiders, hepatomegaly,jaundice, esophageal varices, ascites, and derangementof chemical liver function tests. Four had hemoglobinvalues below 11 g, and 7 below 12 g at the time ofadmission.
Miscellaneous disorders (5 patients). A small non-homogeneous group of patients with splenomegaly, ordisorders which lead to splenomegaly, was also studied.This group is characterized in Table II.
The method of Cr"1 labeling and heat treatment ofautologous erythrocytes before intravenous injection wasthe same as previously described (8). Briefly stated, itconsisted of incubation of whole blood with radiochro-mate at room temperature followed by incubation of thewashed cells in physiologic saline at 49.0 ± 0.10 C forexactly 60 minutes. The amount of radiochromium ac-tually injected in this study ranged from 200 to 250 Auc.Approximately 1 minute was required for the injection.In 27 patients, disappearance curves of radioactivity fromwhole blood were obtained by observations on venoussamples collected, respectively, at approximately 2, 5, 10,15, 20, 30, 45, and 60 minutes after injection, again ateither 2 or 4 hours, and usually at 24 hours. In 11 ofthese 24 patients serum radioactivity also was determinedto permit construction of a curve for serum and eryth-rocytes separately.
1125

HOLZBACH, SHIPLEY, CLARK, AND CHIUDZIK
Continuous recording of radioactivity over the splenicarea was obtained for 1 hour after injection with theprobe placed laterally in contact with the skin, and withthe patient reclining in the supine position. In 17 sub-jects a similar recording was made from a second de-tector over the liver anteriorly. A rate meter, strip-chart recorder, and a sodium iodide crystal 11 incheswide by 1 inch thick fitted with a ii- X 11-inch collimatorwere used as the detection system. Spleen scanning wasperformed within 3 hours after injection with the patientrecumbent and with the left lateral aspect exposed to aconventional scanner. The scanner utilized a 19-holefocusing collimator, an integral mounted sodium iodidecrystal 3 inches wide by 1 inch thick, and a rate meterwith discriminator setting at 0.25 Mev. Splenic scan areawas measured with a planimeter.
Portal venous pressure measurements were obtainedindirectly by splenic pulp manometry, as modified fromthe method of Atkinson and Sherlock (10), with a 10-cmbase line. The mean value of two or three observationswas recorded.
Osmotic fragility of erythrocytes was determined bya standardized adaptation of the method of Parpart andco-workers (11). Serial concentrations ranged from0.26 to 1.2% of saline in phosphate buffer. Readingswere made on a Klett-Summerson (model no. 7002)photoelectric colorimeter. Fragility was expressed as thedilution of saline where beginning hemolysis was une-quivocal. Specifically, it was the intercept of the straightmidportion of the curve on the abscissal scale of salineconcentration. The ordinate scale was percentage ofhemolysis.
Results
Blood disappearance. Separate mean curves ofdisappearance for whole blood, serum, and eryth-rocytes are shown in Figure 1. The loss of ac-tivity from whole blood is very rapid. If the2-minute sample is taken as an initial referencepoint, the percentage remaining at one-half houris approximately 18%. At 1 hour it is 12%, andat 4 hours, 2%. The early portion of the curveis almost completely dominated by the decline inactivity of the red cell component. After ap-proximately 1 hour, however, the activity inerythrocytes has fallen to a point where the rela-tive contribution of serum is appreciable. By 4hours the red cell component amounts to only 1%oof that which had existed at 2 minutes. The con-centration in cells at this time and henceforth issurpassed by that of serum. In the period beyond4 hours a slow loss from the erythrocyte com-partment suggests the presence of a minor popula-tion of cells that have escaped serious thermaldamage.
20
10
zz 5
>
_2°U 2-
X 1Of
I-
0.%A0.5Whole Blood
Serum0. 2 z ^______________
RBC
0.10 4 8 12 16 20 24
HOURS
FIG. 1. DISAPPEARANCECURVES, MEANOF EIGHT CON-TROL SUBJECTS. Activity for whole blood is expressedas percentage of dose per liter obtained by direct count;that for serum and cells as percentage of dose per literof whole blood equivalent obtained by direct serum count.The serum activity is corrected to liter of whole bloodequivalent by the formula: (%o dose per L serum) (1 -
hematocrit). This subtracted from percentage of doseper liter of whole blood gives the activity for cells pres-ent in 1 L of blood. The mean hematocrit was 0.47.
The trace of activity in the 2-minute sample ofserum is undoubtedly from chromium lost fromcells directly into plasma immediately after injec-tion. The transient decline during the ensuing 15minutes can probably be ascribed to excretory loss,whereas the slow rise thereafter suggests splenicdischarge consequent to sequestration and dissolu-tion of trapped cells. The succeeding plateaumight be produced by a state of equilibrium be-tween entry into plasma and excretion therefrom.
A preliminary analysis of data suggested thatthe mean curve of disappearance of labeled heatedcells from blood was more rapid in patients withcirrhosis than in control subjects. The differencebetween the two curves was particularly noticeablein the segment beyond 10 minutes. In the groupwith cirrhosis the level of activity from 10 to 60minutes was below that of the normal mean curve.The difference, nevertheless, was small, and statis-tical significance could not be established. Butwhen the patients with a large spleen (> 90 Cm1l2)
1126

ERYTHROCYTESEQUESTRATION
were separated into a subgroup and compared tosubjects from both groups with spleens thatscanned less than 90 cm2, i.e., normal-sized spleens,a distinct difference in the curves was apparent(Figure 2). That the difference in position ofthe curves after 15 minutes was significant wasestablished by constructing a mean curve of allobserved points beyond this time, counting the twoseparate categories of points above or below theline, and calculating Chi square by a fourfoldtable. The value of p was less than 0.01. Al-though these particular curves were derived fromwhole blood rather than separated cells, a variableserum component would introduce insignificanterror during the first hour. The lower position ofthe mean curve of the group with splenomegalysuggests that cells had been removed more rap-idly than in controls. Although a larger bloodvolume or increased splenic reservoir of red cells
20 -
18 -
16 -
o 400
- 12-0
I \\10-_ CONTROL&CIRRHOSIS WITHOUT8Y \ \ SPLENOMEGALY
LX8 \A A CIRRHOSIS WITH SPLENOMEGALY
0
4~~~~~~4
2I0 10 20 30 40 50 60
MINUTES
FIG. 2. MEAN DISAPPEARANCE CURVES, LARGE SPLEEN
VS. NORMALSPLEEN. Nine patients with splenomegaly,15 with normal spleen.
might be proposed as an explanation, this seemsunlikely in light of the large magnitude of therelative difference in concentration at 1 hour (ra-tio 2 to 1).
Because the characteristic blood disappearancecurve is a complex exponential, a quantitative in-tercomparison of curves cannot be made untilcomponent slopes are determined. All curves,when subjected to conventional curve analysis,have yielded three simple exponential componentsas shown in the mean curve for 8 control sub-jects in Figure 3. The curve is dominated dur-ing the first hour by the rapid component with theslope A. A possible source of the late slope (X3)has already been mentioned. Perhaps the inter-mediate slope (X2) represents cells, undoubtedlymore heterogeneous than an apparent single slopewould imply, which have received intermediatedamage. In any event A,, the slope of the earlycomponent, may be looked upon as the dominantrate constant for removal of the preponderantmass of seriously altered cells. It is a measure ofthe fraction of cells sequestered per unit time inall recipient organs as a group. In practical ap-plication, however, this rate constant has the seri-ous disadvantage of being subject to a ratherlarge error of estimate. It is derived by sequen-tial subtraction of two components of a curve thatcannot be delineated with reasonable certainty be-yond 1 hour because of the paucity of observedpoints after this time. A more accurate measureof sequestration rate would be desirable.
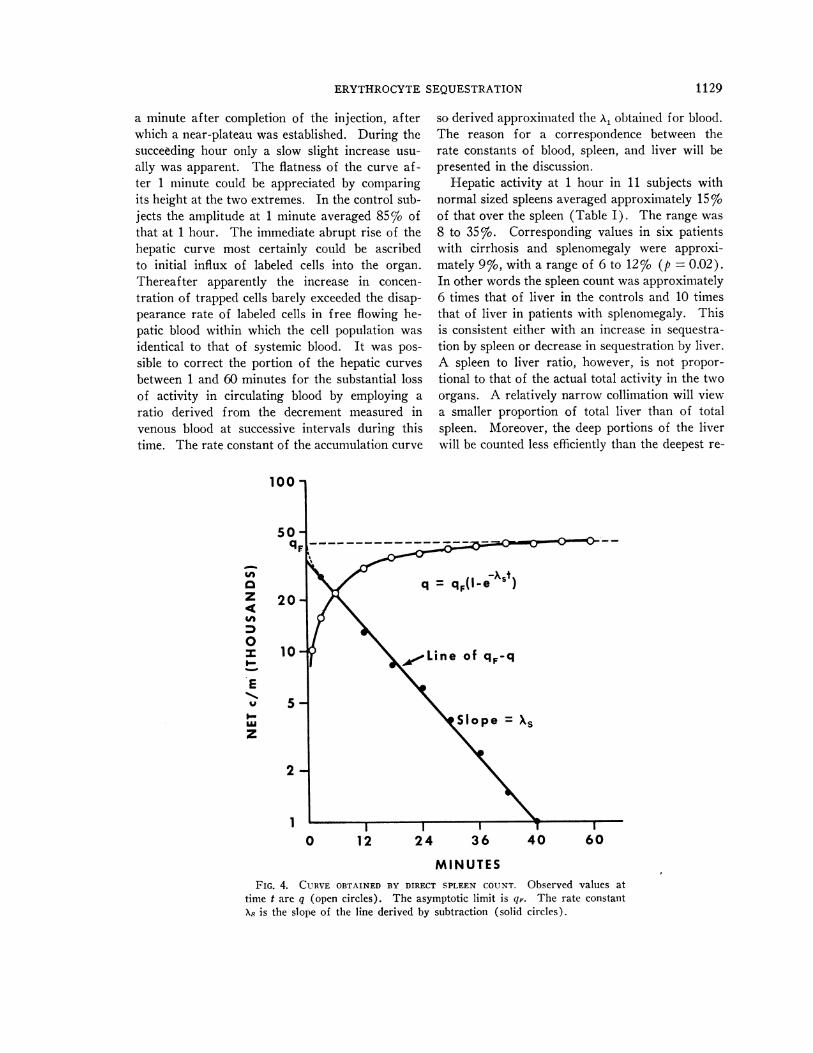
Rate of sequestration as measured by body sur-face recording. With a counter in constant posi-tion over the spleen it was possible to obtain a con-tinuous record of activity in the interval duringwhich most of the labeled cells were removed fromthe blood. Such a curve is shown in Figure 4.It is more than 90% toward plateau at A hour andessentially at plateau by 1 hour. The plateau, ofcourse, is not absolute because radioactivity is con-tinually leaving the spleen in the form of disruptedcells. This rate of loss, nevertheless, is so slowin comparison with uptake (8) that for purposesof analysis of the uptake phase it may be disre-garded. Although theoretically this curve shouldbe as complex as the disappearance curve that wasobtained from blood, its contour in every instanceapproximated that of a simple exponential func-
1127

HOLZBACH, SHIPLEY, CLARK, AND CHUDZIK
10.0 -
1.0 -
0.1
0 1 2HOURS
FIG. 3. CURVE ANALYSIS, ERYTHROCYTES, MEAN OF EIGHT CONTROL SUB-
JECTS. The point midway between the beginning and end of the injectionwas taken as zero time. A correction for the free blood pool at zero timewas not attempted, but its magnitude appeared to be less than 10% of theplateau value. In the curve analysis X3 is observed directly as the terminalslope of the curve. When this terminal phase is extrapolated to zero timeand the extrapolated portion substracted from the original curve, a two-component curve remains with terminal slope X2. Likewise subtraction ofthis extrapolated terminal portion from the two-component curve gives a
final single component of slope 'X. Slopes, expressed as fraction per minute,are: X, = 0.063; X2 = 0.019; Xz = 0.0001.
tion. In other words, a straight line of slope XArepresenting the rate constant of a simple growthequation could be obtained by subtracting observedpoints from the value of the asymptotic limit.This is not surprising because X, is the dominantslope of the blood curve during the first hour, andas will be explained later, the slope X8 obtainedover the spleen should be the same as XA obtainedfrom blood. In instances where blood and spleencounts were obtained in the same patients, the rateconstant (As) from the spleen curve did, in fact,approximate A1 from the blood curve. Actual
miean valuces for eight control suJbjects in which
both measurements were made were 0.06 for AXand 0.07 for At. In all tabulations that follow,A8 was employed exclusively because, for reasons
previously stated, its graphic derivation was con-
sidered to be more accurate.Values of A8 for all subjects are presented in
Table I. The mean rate is higher in the group
with splenomegaly than in control subjects. Thevalue of p is 0.01.
The shape of the uptake curves over the liverdiffered markedly from those over the spleen.An abrupt rise accompanied the injection of la-beled cells. This rapid rise ceased within less than
1128
20
10
I--zLU 5
S-J
0LU 2
LUI.--a,, 1LUD.LU
0 0.5
0.2
0.1
XI
0 8 16 24HOURS
ERYTHROCYTESEQUESTRATION
a minute after completion of the injection, afterwhich a near-plateau was established. During thesucceeding hour only a slow slight increase usu-ally was apparent. The flatness of the curve af-ter 1 minute could be appreciated by comparingits height at the two extremes. In the control sub-jects the amplitude at 1 minute averaged 85% ofthat at 1 hour. The immediate abrupt rise of thehepatic curve most certainly could be ascribedto initial influx of labeled cells into the organ.Thereafter apparently the increase in concen-tration of trapped cells barely exceeded the disap-pearance rate of labeled cells in free flowing he-patic blood within which the cell population wasidentical to that of systemic blood. It was pos-sible to correct the portion of the hepatic curvesbetween 1 and 60 minutes for the substantial lossof activity in circulating blood by employing aratio derived from the decrement measured invenous blood at successive intervals during thistime. The rate constant of the accumulation curve
100
0-f
z
0
I-
E
I-LU
z
20
10
5
2
1
so derived approximated the AX. obtained for blood.The reason for a correspondence between therate constants of blood, spleen, and liver will bepresented in the discussion.
Hepatic activity at 1 hour in 11 subjects withnormal sized spleens averaged approximately 15 %of that over the spleen (Table I). The range was8 to 35%. Corresponding values in six patientswith cirrhosis and splenomegaly were approxi-mately 9%, with a range of 6 to 12% (p = 0.02).In other words the spleen count was approximately6 times that of liver in the controls and 10 timesthat of liver in patients with splenomegaly. Thisis consistent either with an increase in sequestra-tion by spleen or decrease in sequestration by liver.A spleen to liver ratio, however, is not propor-tional to that of the actual total activity in the twoorgans. A relatively narrow collimation will viewa smaller proportion of total liver than of totalspleen. Moreover, the deep portions of the liverwill be counted less efficiently than the deepest re-
q = qF(-eXSt)
'Line of q,-q
Slope = Xs
0 12 24 36 40 60
MINUTESFIG. 4. CURVE OBTAINED BY DIRECT SPLEEN COUNT. Observed values at
time t are q (open circles). The asymptotic limit is qF. The rate constantXA is the slope of the line derived by subtraction (solid circles).
1129

HOLZBACH, SHIPLEY, CLARK, AND CHUDZIK
TABLE I
Miscellaneous observations, controls and cirrhosis
Spleen Splenicscan pulp Uptake rate (Liver count) (100)*
Diagnosis area pressure (X.) Spleen count
cm2 mmwater
Control 80 170 0.079 20.3Control 87 265 0.083 6.5Control 56 210 0.051 15.2Control 77 0.072 8.1Control 56 0.053 35.0Control 64 0.061 9.3Control 11.5Control 87 165 0.112 12.3 Normal sizeControl 87 0.067 14.2 spleenControl 70 0.666 (<90 cm2)Control 65 0.049Control 65 0.084Control 57 0.042Cirrhosis 49 235 0.070 5.3Cirrhosis 80 155 0.110 23.8Cirrhosis 85 310 0.080Cirrhosis 79 255 0.084Cirrhosis 77 285 0.072Cirrhosis 86 280 0.122
Mean i SE 0.074 i 0.0048 14.7 + 2.6
Cirrhosis 96 340 0.044 7.5Cirrhosis 99 450 0.105 11.0Cirrhosis 100 265 0.063 6.1Cirrhosis 123 0.064 6.1Cirrhosis 153 375 0.080Cirrhosis 94 222 0.136 Large spleenCirrhosis 222 280 0.139 (>90 cm2)Cirrhosis 162 375 0.160 11.9Cirrhosis 136 0.122 10.8Cirrhosis 92 610 0.157Cirrhosis 131 365 0.110Cirrhosis 152 355 0.096Cirrhosis 260 445 0.173
Mean :1: SE 0.106 i 0.012 8.9 i 0.98
* At 60 minutes.
gions of the spleen because of the effects of bothdistance and tissue absorption. Thus a spleen toliver ratio of 6: 1 by surface count does not de-note the existence of an identical ratio for totalcontent. On the other hand, the difference in ra-tio between the two groups of subjects undoubtedlyhas meaning. Splenomegaly, by pure change ingeometry alone, should result in a lowering of thecount rather than an increase because a smallerfraction of the total organ is under the collimator.It is therefore reasonable to conclude that theproportion of labeled altered cells in the spleen isgreater in the patients with cirrhosis and spleno-megaly than in control subjects.
Correlations. From Figure 5A it again is ap-parent that the rate of uptake (A5) is substantiallyhigher in patients with cirrhosis than in control
subjects. Both this figure and Table II indicatethat a positive correlation exists between spleensize and rate of uptake. On the other hand, pres-sure and rate of uptake correlate poorly.
Even though an attempt was made to controlthe corpuscular variable by making the cells maxi-mally susceptible to sequestration, and thereforerelatively uniform in this respect, some variationin cells as reflected by osmotic fragility would beexpected. That such variation does exist and thatthe degree of fragility of the heated cells is posi-tively correlated with rate of removal from bloodis apparent from Figure 5B and Table II. Thismight raise the question whether some unexpectedred cell component were operating to contributetoward the correlation observed between rate ofremoval and spleen size. If this were true, a
113()

ERYTHROCYTESEQUESTRATION
0A
A
A
A
* A*oh
A* S
0
A
A
A
A
AA
A
A
A A
I CONTROL
A
I I I I -- I I
40 80 120 160
SPLEEN SIZE (SQ. CM. SCAN
.20-
.16-
.12-
.08 -
.04-
I I I200 240
AREA)
A
AA
A
A
A*A A
0
A
, I I--
0 0.6 0.8
A CIRRHOSIS| CONTROL
1.0
BUFFEREDSALINE (% CONCENTRATION)FIG. 5. CORRELATIONPLOTS. A. SPLEEN SIZE VS. RATE
OF UPTAKE (X8). B. OSMOTIC FRAGILITY AFTER HEATINGVS. RATE (Xe).
.18-
.16-
.14 -
LU'P-
gm
U.'
4dI.-a-
.12-
.10 -
.08-
.06-
.04 -
.02-
'U
4I-a.
1131

HOLZBACH, SHIPLEY, CLARK, AND CHUDZIK
TABLE II
Correlations obtained by two methods of computation
Spearman'sPearson's rank corre-coefficient lation
No. ofcases r p* ra p*
Size vs. rate 32 0.67 0.001 0.96 0.001Pressure vs. rate 21 0.39 0.08 0.32 0.16Size vs. pressure 21 0.41 0.07 0.63 0.003Osmotic fragility
vs. rate 15 0.73 0.003 0.66 0.008Osmotic fragility
vs. sizet 30 -0.22 0.25 0.17 0.38
* The probability as expressed by p was derived from t,which in turn was calculated by the formula: t = r (or r,)
N- 2.1 -(r or r8)2
t Further breakdown of series by category, number ofcases, mean fragility, and SE of mean as follows: Spleenscan larger than 90 cm", 14, 0.76 i 0.02; spleen scansmaller than 90 cm2, 16, 0.75 A= 0.01; total controls, 9, 0.75±t 0.01; total cirrhosis, 21, 0.76 i 0.02.
good correlation between spleen size and osmoticfragility should be demonstrable. Such is not thecase (Table II).
Disorders other than cirrhosis. The findingsin five patients with miscellaneous disorders arepresented in Table III. Although the group issmall and nonhomogeneous, a trend toward rapidrate of removal with increasing spleen size isreadily apparent. As was the case with spleno-megaly in cirrhosis, this relationship seems not tobe related to a systematic difference in osmoticfragility of the heated cells.
Discussion
Determination of rate of disposal of materialfrom blood by measurement of accumulation oftracer in a recipient reservoir was described byKeating, Power, Berkson, and Haines (12) forI131 taken up by the thyroid gland and for the
TABLE III
Miscellaneous disorders other than cirrhosis
OsmoticSize of fragilityspleen Uptake (post-
Diagnosis scan rate heat)
cm2 (X.)Splenomegaly, cause unknown 280 0.29 0.68Lymphosarcoma 272 0.17 0.80Homozygous Hb c disease 207 0.13 0.90Chronic lymphocytic leukemia 136 0.11 0.76Hereditary spherocytosis 68 0.06 0.82
component excreted in urine. Hughes Jones, Mol-lison, and Veall (13) applied a similar method tothe uptake of Cr51-labeled incompatible cells bythe spleen, and Harris, McAlister, and Prankerd(14) employed it in studies of the splenic uptakeof autologous cells. The first two of these groupsof investigators pointed out that the exponentialrate constant of the accumulation curve of an ir-reversible receiving reservoir is identical to thatof the exponential decay curve of blood. In thepresent studies the principle component of theblood curve is expressed as q = qoe-Xit, whereasthe accumulation curve for spleen is q = qF (1 -e-ast). The rate constants A1 and A8 should theo-retically be identical. Both represent fractionalrate of loss from blood. They are assigned sepa-rate symbols only because they are derived fromindependent measurements. A rate constant ofaccumulation over the liver or any other partici-pating organ also should be identical to A1. Forany one of a number of reservoirs of accumulationit is the fractional rate of loss from blood whichis being measured. Only qF, the asymptotic limit,will vary. This coefficient is proportional to thefraction of total dose that ultimately reaches thegiven organ. Because the mathematical proof ofthe identity of rate constants of accumulation withthe rate constant of a blood decay curve is notgiven in the publications that have been cited, it isdesirable to present it here.
Assume a blood pool (a) with two avenues ofexponential removal with rate constants Aba andAca for exits to collecting pools b and c. Let Ab, +Aca A, the over-all rate constant for pool a. Letq be the amount of tracer in a given pool at time t.For loss from blood pool (a)
dqa =-qaX.
Integrate
qa = qaoe-xt (at t = 0, qa = qao)For pool b
dqb = qaXb. = Xiba (qaoe Xt).
Integrate
qb = qao Xbae-xt + constant.
-1132

ERYTHROCYTESEQUESTRATION
The constant is
qaoXba (at t=O, qb =O).
Thus,
qb ( 1 - X t)
Similarly,
qc = qaoAca (1 edit) (at t = 0, qc = 0).
The rate constants of both qb(t) and q,(t) are thesame as that of blood. The coefficients precedingthe parentheses are fractions of total dose ulti-mately reaching the particular reservoir, and theyare proportional to the fractional rate constantsAba and Aca. These rate constants, however, do notrepresent the slopes of these functions. Also,the slope A would not be affected by differencesin the proportion of a total recipient organ viewedby a counter placed in a fixed position over a partof the organ.
In the present studies the observation of a
highly significant correlation between over-allrate of sequestration, A,, and spleen size does notprove that spleen itself is the organ that is re-
sponsible for the difference in rate. When thisobservation is coupled with the finding that sur-
face counts show a higher spleen to liver ratio inthe presence of splenomegaly, however, the con-
clusion seems inescapable that the spleen is re-
sponsible. As was pointed out in Results, al-though this ratio is not an accurate measure oftotal organ content, a change in ratios should mean
a corresponding shift in distribution of total dosebetween the two organs. \Vith evidence that thetotal sequestration rate is increased, along withevidence that a relatively higher proportion of totaldose is in the spleen, it is fair to conclude thatsplenic sequestration is increased in the presence
of splenomegaly.Although correlation does not establish causal
relationship between size and rate of sequestra-tion, such a relationship becomes increasinglyplausible as other factors that might affect rate
of cell removal are systematically excluded. A
corpuscular variable has been fairly well excludedby deliberately altering the cells to make themmaximally susceptible to removal. In such a cir-
cumstance the trapping function of the spleenshould become the dominant rate-limiting mecha-nism. The nearly identical mean osmotic fragilityof heated cells injected into subjects with spleensexceeding 90 cm2 of scanned area versus that ofcells given to subjects with spleens measuring lessthan 90 cm2 would suggest that corpuscular dif-ferences were in fact eliminated, provided thatsuch fragility can be taken as an index of the "cellfactor" which determines susceptibility to seques-tration.
Whether a trapping function directed towardartificially damaged cells is identical to that oper-ating against a natural spectrum of cells is uncer-tain. It is conceivable, but rather unlikely, thatseparate functional mechanisms may exist for thetwo types of cells. The present design for meas-urement of rate is not easily applied to labeledunaltered cells from a normal donor because ac-cumulation in the spleen is extremely slow.Asymptote may not be reached even in 30 days.Previously reported studies that have documentedthe increased rate of disappearance of autologouscells in hepatic cirrhosis have included limitedobservations on spleen size in relation to red cellsurvival. Jones, Weinstein, Ettinger, and Capps(3) recorded the presence or absence of spleno-megaly as judged by palpation and roentgeno-graphic evaluation. Of eight patients with short-ened survival time six had splenomegaly. Ofthree with normal survival time one had spleno-megaly. Although these figures suggest a rela-tionship between splenomegaly and shortened redcell survival, the series is too small to attemptstatistical evaluation. Jandl, Greenberg, Yone-moto, and Castle (15) in a case of hepatic cir-rhosis with anemia and decreased erythrocytesurvival time observed a relatively high uptake ofCr51-labeled autologous cells in the spleen as com-pared to three normal control subjects. Thespleen, however, was not palpable.
A possible direct effect of hemodynamics onsequestration is worthy of comment. If adhesionof erythrocytes to walls of splenic channels is animportant mechanism of entrapment, retardedflow through such channels might promote ad-hesion and thereby in itself favor sequestrationregardless of organ size. The finding of a poorcorrelation between rate of erythrocyte removaland portal pressure suggests that stasis, to the
1133

HOLZBACH, SHIPLEY, CLARK, AND CHUDZIK
extent that it is implied by elevated portal pres-sure, is not of primary importance. Jandl, Sim-mons, and Castle (16), in order to evaluate theeffect of changes in filtration pressure on the pas-sage of red cells, performed in zitro experimentswith a sieve model consisting of a Millipore mem-brane. They observed that when cells wereclumped into agglutinated masses, or into rouleauxarrangements, their passage was impaired to amuch greater extent when the pressure gradientwas low than when it was high. The passage ofdispersed normal cells and sickle cells, on theother hand, was not significantly affected by al-terations in pressure. These observations wouldsuggest that to the degree that the spleen func-tions as a filter increased trapping of cells ar-ranged in clumps would be favored by congestionand reduction in effective filtration pressure; how-ever, cells in the dispersed state would not be in-fluenced by the pressure gradient. Therefore,if we assumed that heat-sphered cells do notclump, an effect of pressure change would not bepredicted.
It has already been mentioned that in the curveof uptake over spleen, which is q = qp (1 - e-at),the coefficient qp is proportional to the total doseultimately taken up by the spleen. With the antici-pation of measuring this component, an at-tempt was initially made to determine total ac-cumulation in the spleen by an external counttaken after 1 to 2 hours at 50 cm distance withan attached collimator accepting a circular area15 cm in diameter at the surface of the skin. Thestandard consisted of a sample of the labeled cells.A mean value obtained in 11 control subjects was56%o, but the variation was extreme. The rangewas 16 to 87%o. Calculations from these meas-urements were not made because of a convictionthat problems of variable geometry, tissue ab-sorption, and hepatic overlap would introduceserious inaccuracies. According to \Vagner andco-workers (9) the proportion of cells going tothe spleen as compared to the liver is affectedby the degree of thermal injury. \Vith accuratecontrol of temperature and duration of heating, itseems doubtful that such an inconstancy could beimplicated as a cause of the wide variation thatwas encountered in the estimate of total uptakeby external counting. Splenectomy, of course,would provide access to tissue for an accurate
determination of total uptake which, coupledwith the rate constant from the curve, would givea numerical value for fractional rate of removalby the spleen alone.
The present findings, although directing atten-tion toward a nonhumoral function of the spleen,nevertheless are in accord with Dameshek's state-ment that "the greater the increase in splenic tis-sue the greater usually is the degree of hyper-splenism" (17). The results along with previousobservations with transfused donor cells (1, 2)suggest that even though such parameters as nu-tritional state, liver function, bleeding, and hypo-function of bone marrow may participate as causesof anemia in cirrhosis, special attention must bedirected toward an extracorpuscular hemolyticprocess. This process may well consist of in-creased splenic activity resulting from nothingmore than an increment in the mass of the organ.
In recent experiments by Jacob, MacDonald,and Jandl (18) enlargement of the spleen in ratsgiven acetylphenylhydrazine was accompanied byreticulum cell hyperplasia within the organ. Thiscellular reaction was construed to be a responseto the increased work of removing the cells al-tered by the drug. That the hyperplasia of reticu-lar tissue was accompanied by increased functionof the spleen was apparent from the increaseduptake of test doses of labeled cells altered byN-ethylmaleimide. These findings are compatiblewith the concept that the sequestration functionof the spleen is significantly affected by reticulo-endothelial mass and that any mechanism whichstimulates reticuloendothelial growth also stimu-lates sequestration.
SummaryThe rate of removal from blood of thermally
damaged red cells in patients with hepatic cirrhosiscorrelated well with the degree of splenomegalyand poorly with the degree of elevation of portalpressure. An increased spleen to liver ratio ofradioactivity by surface count in the presence ofsplenomegaly suggested that sequestration by thespleen was responsible for the increased rate ofremoval of cells. Rate of sequestration was in-creased also in patients with splenomegaly due tocauses other than cirrhosis.
These findings support the concept that in-creased spleen size in itself can result in hyper-
1134

ERYTHROCYTESEQUESTRATION
function. The observations also suggest thatsplenomegaly increases sequestration rate regard-less of the underlying cause of the splenonmegaly.
Acknowledgments
We are indebted to Dr. Jerry S. Wolkoff for per-forming the measurements of splenic pulp pressure andto Lida Claire LeBlanc Gamon for the determinationsof osmotic fragility.
References1. Chaplin, H., Jr., and P. L. Mollison. Red cell life-
span in nephritis and in hepatic cirrhosis. Clin.Sci. 1953, 12, 351.
2. Jandl, J. H. The anemia of liver disease: observa-tions on its mechanism. J. clin. Invest. 1955, 34,390.
3. Jones, P. N., I. M. Weinstein, R. H. Ettinger, andR. B. Capps. Decreased red cell survival associ-ated with liver disease. Use of radioactive so-dium chromate in measurement of red cell survival.Arch. intern. Med. 1955, 95, 93.
4, AMex, F. A., M. H. Cars, ed A. P. Ki2u. De-creased red blood cell-survival time in patientswith portal cirrhosis. Correlation of laboratoryand clinical findings. J. Amer. med. Ass. 1957, 164,955.
5. Hall, C. A. Erythrocyte dynamics in liver disease.Amer. J. Med. 1960, 28, 541.
6. Cawein, M. J. III, A. B. Hagedorn, and C. A. Owen,Jr. Anemia of hepatic disease studied with radio-chromium. Gastroenterology 1960, 38, 324.
7. Sheehy, T. W., and A. Berman. The anemia of cir-rhosis. J. Lab. clin. Med. 1960, 56, 72.
8. Holzbach, R. T., R. E. Clark, R. A. Shipley, W. B.Kent III, and G. E. Lindsay. Evaluation of spleensize by radioactive scanning. J. Lab. clin. Med.1962, 60, 902.
9. Wagner, H. N., Jr., M. A. Razzak, R. A. Gaertner,W. P. Caine, Jr., and 0. T. Feagin. Removal oferythrocytes from the circulation. Arch. intern.Med. 1962, 110, 90.
10. Atkinson, M., and S. Sherlock. Intrasplenic pres-sure as an index of portal venous pressure. Lancet1954, 1, 1325.
11. Parpart, A. K., P. B. Lorenz, E. R. Parpart, J. R.Gregg, and A. M. Chase. The osmotic resistance(fragility) of human red cells. J. clin. Invest.1947, 26, 636.
12. Keating, F. R., Jr., M. H. Power, J. Berkson, andS. F. Haines. The urinary excretion of radioio-dine in the various thyroid states. J. clin. Invest.1947, 26, 1138.
13. Hughes Jones, N. C., P. L. Mollison, and N. Veal.Removal of incompatible red cells by the spleen.Brit. J. Haemat. 1957, 3, 125.
14. Harris, I. M., J. McAlister, and T. A. J. Prankerd.Splenomegaly and the circulating red cell. Brit.3. llamactt. ifUE,, 4, We.
15. Jandl, J. H., M. S. Greenberg, R. H. Yonemoto, andW. B. Castle. Clinical determination of the sitesof red cell sequestration in hemolytic anemias. J.clin. Invest. 1956, 35, 842.
16. Jandl, J. H., R. L. Simmons, and W. B. Castle. Redcell filtration and the pathogenesis of certain he-molytic anemias. Blood 1961, 18, 133.
17. Dameshek, W. Hypersplenism. Bull. N. Y. Acad.Med. 1955, 31, 113.
18. Jacob, H. S., R. A. MacDonald, and J. H. Jand'.Regulation of spleen growth and sequesteringfunction. J. clin. Invest. 1963, 42, 1476.
1135