
Extrapolating Beyond Suboptimal Demonstrations via Inverse ...
Paper ID: ETC2017-150 Proceedings of 12th European Conference on Turbomachinery Fluid dynamics & Thermodynamics ETC12, April 3-7, 2017; Stockholm, Sweden
OPEN ACCESS Downloaded from www.euroturbo.eu
1 Copyright © by the Authors
INFLUENCE OF MEASUREMENT GRID RESOLUTION ON
DUCT LOSS EVALUATION
S. Zerobin, M. Steiner, S. Bauinger, A. Marn, E. Göttlich, F. Heitmeir
Institute for Thermal Turbomachinery and Machine Dynamics,
Graz University of Technology,
Inffeldgasse 25A, 8010 Graz – Austria
ABSTRACT
The present paper deals with the influence of the measurement grid resolution, used for
positioning five-hole-probes, on the evaluation of the aerodynamic flow field in a newly
designed one-and-a-half stage test turbine. In particular, five-hole-probe data taken under
engine realistic conditions downstream of the high pressure rotor at the inlet and outlet of an
intermediate turbine duct is used to generate the corresponding flow fields with various
measurement grid resolutions. The effect of reducing circumferential and radial grid points is
discussed in terms of total pressure loss and total measurement time. In addition, the effect of
extrapolating the radial total pressure distribution to the static pressures at the endwalls is
demonstrated. Consequently, this paper provides estimates of the error generated by a low
measurement grid resolution and proposes a time-efficient adaptive measurement grid which
accurately captures the flow field without jeopardizing the quality of the obtained data.
KEYWORDS
Measurement Grid Resolution, Extrapolation to Endwall, Adaptive Grid, Duct Loss, Turbine
NOMENCLATURE
��� total pressure coefficient Abbreviations
�� static pressure coefficient HP high pressure
�� total pressure ITD intermediate turbine duct
� static pressure LP low pressure
� circumferential coordinate OGV outlet guide vanes
��� total pressure loss coefficient
INTRODUCTION
In order to gain knowledge of the flow phenomena existing inside a turbomachinery component,
it is common to obtain, amongst others, the pressure distribution in the flow field using pneumatic
probes such as rakes with Kiel heads or five-hole-probes. The data acquisition is usually performed
point by point, which means the five-hole-probe is traversed to pre-defined circumferential and
radial measurement points before recording the actual flow data. This approach results in a
measurement grid which covers at least one stator pitch and, depending on the geometry of the flow
channel and the probe used, up to 95% span height in radial direction. The selection of the amount
of measurement points and the grid spacing is mostly based on experience, since it is highly
dependent on the application, e.g. in terms of the arrangement and geometry of the test setup and
the flow conditions. In addition, there is always a trade-off between the quality of the acquired data
using a fine mesh and the time needed for performing the entire measurement. Of course, the
measurement time is directly related to the test facility operating costs. There are also additional
advantages when reducing the measurement time: with a reduced duration of the measurement
multiple measurements at the same operating point on the same day are possible. In test facilities

2
using ambient air as inlet flow or exhausting to ambient conditions, the option to take several
measurements during the same test run can improve the data accuracy, since a day-to-day correction
or operating point correction may not be needed.
Therefore, several researchers (e.g. Takahashi and Ross (1995), Franken and Ivey (2006),
Lenherr et al. (2007), Town and Camci (2015), Bartsch et al. (2015, 2016)) already proposed
algorithms for multi-hole-probes to adapt the measurement grid resolution to the flow field, in order
to minimize the measurement time by setting measurement points where they are needed, and
leaving out points where they are redundant. Although the various methods of generating the
adaptive grids are different, most of the algorithms need a prior basic measurement of the flow field
in order to capture the main flow structures before applying the optimization process. Depending on
the location and strength of the existing pressure gradients, the amount and individual position of
the measurement grid points are selected. This approach generally leads to a fine circumferential
grid resolution in the wake region and a fine radial grid resolution in the tip region. However, most
of these studies were limited to the investigation of the influence of the grid resolution at only one
measurement plane in a cascade or a rotating rig.
As a holistic approach, the present research investigates the influence of the measurement grid
resolution directly on the duct loss evaluation in a one-and-a-half stage high pressure turbine. The
ability to perform five-hole-probe measurements at the duct inlet and duct outlet at the same
operating point on the same day is particularly important when determining the total pressure loss
of an intermediate turbine duct, as this is the case for this study. Therefore, five-hole-probe
measurements at the duct inlet and outlet planes have been used to generate the corresponding flow
fields with various measurement grids. The effect of the reduction of measurement points in both
circumferential and radial traversing directions is discussed separately and compared to the
reference case with a fine grid, both in terms of total pressure loss and total measurement time. As a
result, an adaptive measurement grid has been proposed which reduces the measurement time while
maintaining the quality of the acquired data compared to the fine reference grid.
Furthermore, an extrapolation of the radial total pressure profile to the static pressures at the hub
and tip endwalls is demonstrated. Since the five-hole-probe measurement is constrained both due to
the size of the probe head and due to aerodynamic interaction effects close to the probe hole, the
wall static pressure measurements in both measurement planes are used to approximate the
boundary layer profiles. The influence of considering the complete radial profiles from 0% to 100%
span height on the total pressure loss of the duct is discussed.
EXPERIMENTAL SETUP AND METHODOLOGY
Test setup
Provided by a 3 MW compressor station, pressurized air drives the investigated test turbine. As
illustrated in Figure 1 the flowpath consists of an unshrouded HP turbine stage followed by an
intermediate, S-shaped turbine duct and a low pressure vane row. The investigated intermediate
turbine duct is a state-of-the-art design equipped with non-turning struts. In order to take out the
swirl generated by the vane row two outlet guide vanes were placed in the exhaust duct. More
details on the test rig are provided by Steiner et al. (2017). The test turbine is operated at engine
realistic conditions, with all measurements performed at an HP turbine rotor speed of 9570 rpm, a
massflow rate of 13.3 kg/s and a total pressure ratio of 2.81, calculated from the rig inlet to the rig
outlet.
Measurement technique
In the present study two five-hole-probes differing in inclination of the probe head
(manufactured by IST, RWTH Aachen) were used to perform measurements at the turbine duct
inlet (rotor exit, Figure 1: plane B) and outlet (Figure 1: plane C). Both five-hole-probes have a
probe head diameter of 2.5 mm. For measurements at plane B, a five-hole-probe with a inclined

3
Figure 1: Flowpath of the test turbine
probe head of 90° is used (Figure 2). Due to the strong slope at the duct outlet, both the
measurement plane C and the head of the second five-hole-probe relative to the probe shaft axis are
inclined in order to align the probe head with the main flow direction (Figure 2). The area traverses
were realized in two different ways: In measurement plane C, the probe is traversed
circumferentially over 1.2 strut pitches, whereas in measurement plane B, the circumferential
position of the probe is fixed in the mid passage between two struts and the HP turbine vanes are
then traversed circumferentially over 3.3 HP turbine vane pitches. More details on that so-called
pseudo-traverse and its comparison to the results of a real traverse downstream of a HP rotor are
given by Faustmann and Göttlich (2014).
Figure 2: Five-hole-probe for plane B (left) and for plane C (right)
At a fixed circumferential position, the probes were traversed radially to pre-defined radial
measurement positions. After turning the probe head into the flow direction, the pressure data of the
probe were acquired by a PSI 9016 pressure scanner with an accuracy of 0.05 % full scale.
Including the systematic error of the PSI modules and the uncertainty in the probe calibration, the
mean measurement uncertainties for both five-hole-probes are described in Table 1. The
measurement uncertainties for the static pressure taps are ± 1 mbar. Since the used five-hole-probes
are also equipped with a thermocouple at the probe head, the temperature data of the probe has been
acquired simultaneously by a NI 9214 thermocouple input module. In total, 465 values are acquired
simultaneously with a sampling rate of 5 Hz, in addition including all operating data for each
measurement point.
Table 1: Measurement uncertainties and calibration range for the five-hole-probes
Flow quantity Unit +Uncertainty -Uncertainty Calibration
range
Calibration
step
Mach number (��) [-] 0.005 -0.004 0.1 to 0.8 0.1
Yaw angle [deg] 0.3 -0.3 -20 to 20 4
Pitch angle [deg] 0.5 -0.4 -20 to 20 4
Total pressure (��) [mbar] 3.0 -3.0 - -
Static pressure (�) [mbar] 5.4 -5.1 - -
Total temperature (�) [K] 0.6 -0.5 - -
Static temperature () [K] 0.7 -0.8 - -
HP Stage
ITD
LPVane RowOGV 1
OGV 2Plane B
Plane C
Plane B
90°

4
Methodology
For the present study, five-hole-probe measurements at the duct inlet and outlet, plane B and
plane C, respectively, were taken as the reference case. The grid resolution for this reference case
was defined based on a compromise between the results of a pre-test CFD calculation and the
resulting measurement time. The grid in plane B consists of 19 radial points covering 6% to 95%
span. In plane C, the grid consists of 18 radial points covering 8% to 95% span. For both
measurement planes, the radial grid resolution is non-equidistant, which means that it is refined at
the hub and tip (to a minimum radial step of approximately 1.3 mm) in order to cover the flow
behaviour near the endwalls in more detail. In contrast, the circumferential grid resolution is
equidistant with 19 measurement points per vane pitch in plane B and 55 measurement points per
strut pitch in plane C. In terms of measurement time, approximately four minutes per radial line are
needed for positioning the five-hole-probe and acquiring the data at each measurement point,
resulting in total measurement times of 76 minutes per vane pitch (plane B) and 220 minutes per
strut pitch (plane C).
There are many possibilities to reduce the total measurement time. One possibility is to skip the
procedure of rotating the probe head into the flow direction at each measurement point. Since the
five-hole-probes are calibrated for a certain calibration range (see Table 1), this positioning
procedure is not essential. However, the advantage of turning the probe head into the flow direction
is to enable access to the entire calibration range at each measurement point, which could be
essential in highly fluctuating flows, e.g. downstream of an HP turbine rotor. Another possibility to
reduce the total measurement time, while maintaining data quality, is to reduce the measurement
points, which is the subject of this paper.
To this end, relative to the reference case, the five-hole-probe measurement grid resolution was
reduced based on the grid resolution used for rake measurements carried out in the same test
turbine. Here, total pressure and total temperature rakes in each measurement plane were used
primarily for monitoring and setting the operating point during the test. However, the rakes were
also leveraged, to carry out full 360 degrees area traverses in planes B and C. Due to measurement
time limitations coarse circumferential grids with five points per vane pitch in plane B and 18 points
per strut pitch in plane C were used for the rake measurements. Each rake consists of six Kiel heads
radially arranged at centers of equal area. In order to investigate the influence of the grid resolution
on the quality of the results in terms of covered flow structures and duct pressure loss, the results of
the five-hole-probe measurements were used to simulate and predict the rake measurements. Since
the fine measurement grid for the five-hole-probes is not consistent with the coarse grid for the
rakes, the five-hole-probe data has been linear interpolated to the rake Kiel head positions. A
detailed comparison between the two measurement techniques (i.e. between rakes with Kiel heads
compared to five-hole-probes) is described by Bauinger et al. (2017).
In a first step, the five-hole-probe data was reduced in circumferential direction to
approximately one third from 19 points to 6 points per vane pitch and to one third from 55 points to
18 points per strut pitch, in plane B and plane C, respectively. In a second step, the five-hole-probe
data was linearly interpolated to the six radial rake measurement positions while keeping the higher
circumferential resolution. Finally, the five-hole-probe data was interpolated in both radial and
circumferential directions. The results for these three cases were then compared to the results of the
reference case (see Results and Discussion section of this paper). A summary of the presented
measurement grid resolutions with the individual number of measurement points and the resulting
total measurement time in minutes per HPT vane pitch (for plane B) or per TCF strut pitch (for
plane C) is given in Table 2. In addition, an adaptive grid was proposed based on the presented
outcomes of the radially and circumferentially reduced grids. As can be seen in Table 2, the
adaptive measurement grid is optimized regarding the measurement time, while maintaining the
quality of the acquired data.
In addition, an extrapolation of the five-hole-probe data to the measured static pressure at the
hub and tip endwalls is presented in the following section. Due to geometrical restrictions and the
5
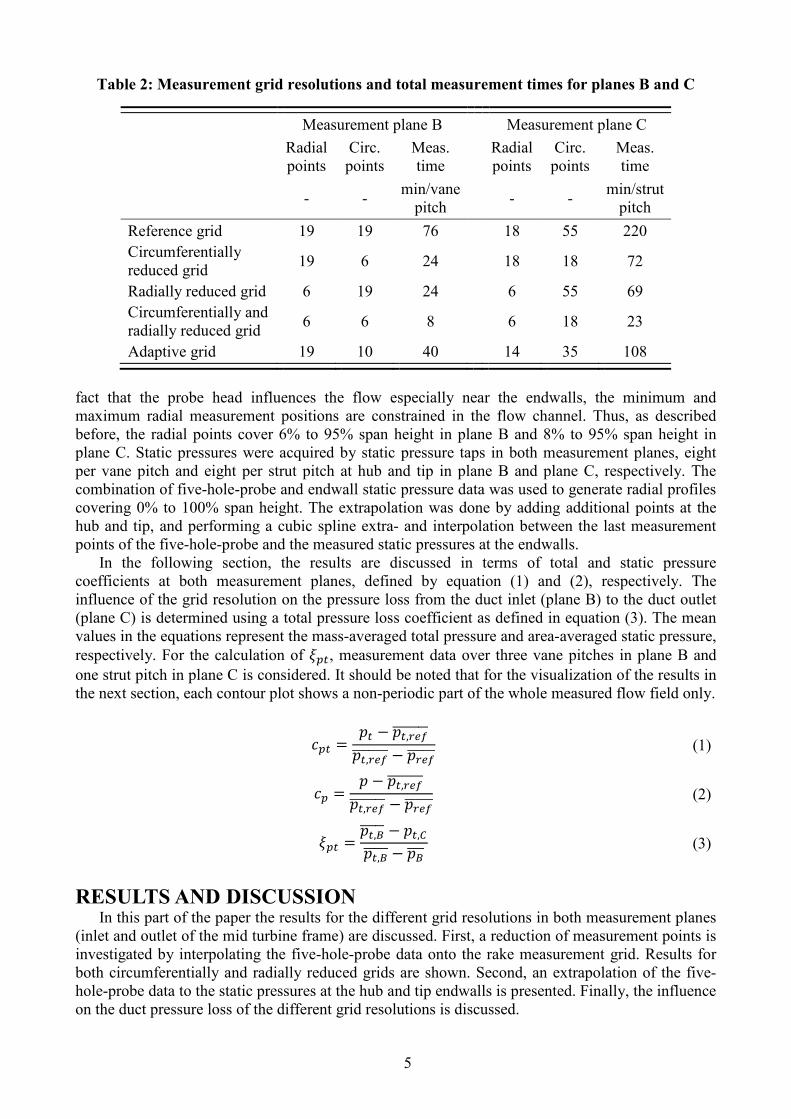
Table 2: Measurement grid resolutions and total measurement times for planes B and C
Measurement plane B Measurement plane C
Radial
points
Circ.
points
Meas.
time
Radial
points
Circ.
points
Meas.
time
- - min/vane
pitch
- -
min/strut
pitch
Reference grid 19 19 76 18 55 220
Circumferentially
reduced grid 19 6 24
18 18 72
Radially reduced grid 6 19 24 6 55 69
Circumferentially and
radially reduced grid 6 6 8
6 18 23
Adaptive grid 19 10 40 14 35 108
fact that the probe head influences the flow especially near the endwalls, the minimum and
maximum radial measurement positions are constrained in the flow channel. Thus, as described
before, the radial points cover 6% to 95% span height in plane B and 8% to 95% span height in
plane C. Static pressures were acquired by static pressure taps in both measurement planes, eight
per vane pitch and eight per strut pitch at hub and tip in plane B and plane C, respectively. The
combination of five-hole-probe and endwall static pressure data was used to generate radial profiles
covering 0% to 100% span height. The extrapolation was done by adding additional points at the
hub and tip, and performing a cubic spline extra- and interpolation between the last measurement
points of the five-hole-probe and the measured static pressures at the endwalls.
In the following section, the results are discussed in terms of total and static pressure
coefficients at both measurement planes, defined by equation (1) and (2), respectively. The
influence of the grid resolution on the pressure loss from the duct inlet (plane B) to the duct outlet
(plane C) is determined using a total pressure loss coefficient as defined in equation (3). The mean
values in the equations represent the mass-averaged total pressure and area-averaged static pressure,
respectively. For the calculation of ���, measurement data over three vane pitches in plane B and
one strut pitch in plane C is considered. It should be noted that for the visualization of the results in
the next section, each contour plot shows a non-periodic part of the whole measured flow field only.
��� =�� − ��, ���������
��, ��������� − � �������� (1)
�� =� − ��, ���������
��, ��������� − � �������� (2)
��� =��,������ − ��,�
��,������ − ����� (3)
RESULTS AND DISCUSSION In this part of the paper the results for the different grid resolutions in both measurement planes
(inlet and outlet of the mid turbine frame) are discussed. First, a reduction of measurement points is
investigated by interpolating the five-hole-probe data onto the rake measurement grid. Results for
both circumferentially and radially reduced grids are shown. Second, an extrapolation of the five-
hole-probe data to the static pressures at the hub and tip endwalls is presented. Finally, the influence
on the duct pressure loss of the different grid resolutions is discussed.

6
Reduction of Measurement Points
Turbine Duct Inlet
In Figure 3, parts of the total pressure coefficient contour plots are shown for plane B,
downstream of the HP turbine rotor at the duct inlet. As described in the previous section, the grid
resolution of the five-hole-probe measurement was used as the reference case. Its result is depicted
in Figure 3 (a). The flow field at the rotor exit is characterized by a circumferential pattern of high
pressure (red color) and low pressure (blue color), driven by the upstream HP turbine vane
positions. Since the HP turbine rotor is unshrouded, a tip leakage region is present from 80% up to
95% span height. The tip leakage vortex dominates the flow field in this region.
As a first step, the grid resolution is reduced in circumferential direction only to one third of the
circumferential measurement points relative to the reference case. Since the circumferential step in
case of the reference five-hole-probe measurement is not a multiple of the step in case of the rake
measurement, which is used for the reduced grid resolution, the five-hole-probe data is interpolated
to the coarse grid. Figure 3 (b) shows the result for the circumferentially reduced grid resolution.
Compared to the reference case in Figure 3 (a) all flow structures are still captured and the
circumferential positions of high and low pressure regions are at the same locations. However, the
maximum amplitude of the total pressure coefficient is not captured by the coarse grid since the
peak at approximately 3.4 degree is between two measurement points as can be seen in the radially
averaged circumferential profile in Figure 4 (left). There is good agreement between the
circumferentially averaged (radial) profiles of the reference case and the circumferentially reduced
grid case, as illustrated by Figure 4 (right).
In contrast, reducing only the radial measurement points to one third leads to a significant
change of the depicted flow field compared to the reference case. As illustrated in the contour plot
in Figure 3 (c), the flow structures in the tip region between 70% and 95% span height, as seen in
the contour plots (a) and (b) of the figure, are completely missing for the radially reduced
Figure 3: Parts of plane B contour plots of total pressure coefficients for reference case (a),
circumferentially reduced grid (b), radially reduced grid (c) and circumferentially and
radially reduced grid (d)
(b)
(c) (d)
(a)
7
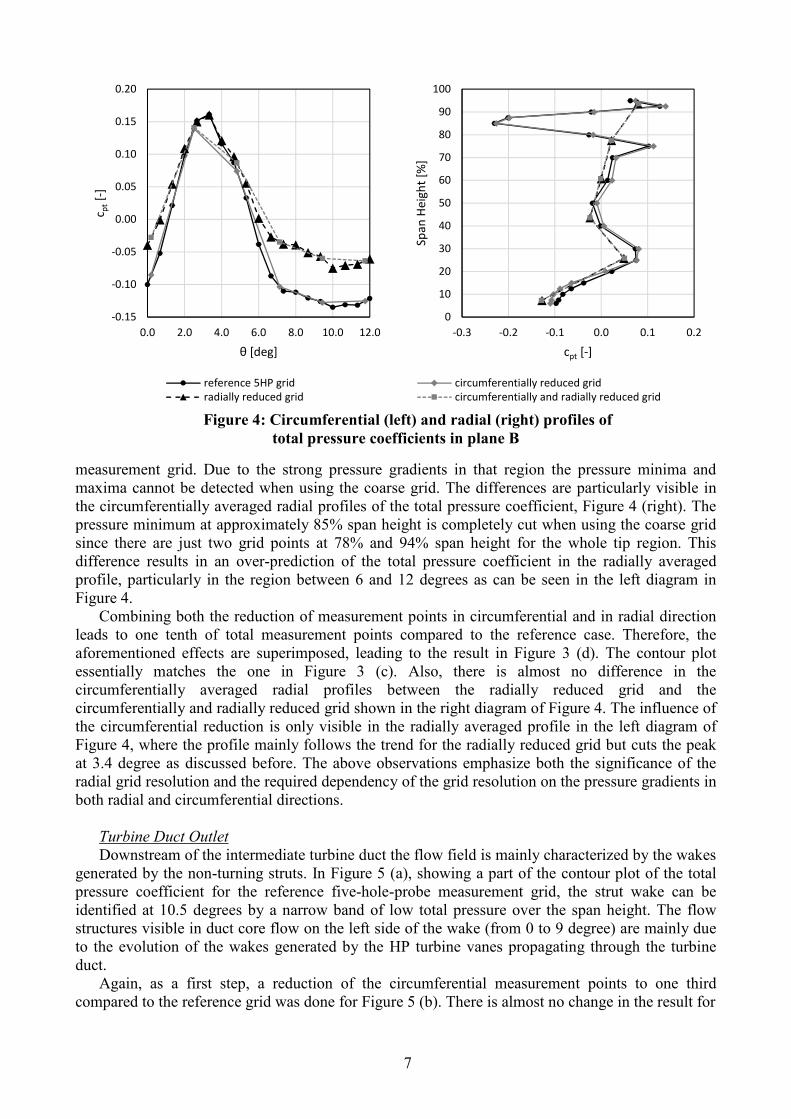
Figure 4: Circumferential (left) and radial (right) profiles of
total pressure coefficients in plane B
measurement grid. Due to the strong pressure gradients in that region the pressure minima and
maxima cannot be detected when using the coarse grid. The differences are particularly visible in
the circumferentially averaged radial profiles of the total pressure coefficient, Figure 4 (right). The
pressure minimum at approximately 85% span height is completely cut when using the coarse grid
since there are just two grid points at 78% and 94% span height for the whole tip region. This
difference results in an over-prediction of the total pressure coefficient in the radially averaged
profile, particularly in the region between 6 and 12 degrees as can be seen in the left diagram in
Figure 4.
Combining both the reduction of measurement points in circumferential and in radial direction
leads to one tenth of total measurement points compared to the reference case. Therefore, the
aforementioned effects are superimposed, leading to the result in Figure 3 (d). The contour plot
essentially matches the one in Figure 3 (c). Also, there is almost no difference in the
circumferentially averaged radial profiles between the radially reduced grid and the
circumferentially and radially reduced grid shown in the right diagram of Figure 4. The influence of
the circumferential reduction is only visible in the radially averaged profile in the left diagram of
Figure 4, where the profile mainly follows the trend for the radially reduced grid but cuts the peak
at 3.4 degree as discussed before. The above observations emphasize both the significance of the
radial grid resolution and the required dependency of the grid resolution on the pressure gradients in
both radial and circumferential directions.
Turbine Duct Outlet
Downstream of the intermediate turbine duct the flow field is mainly characterized by the wakes
generated by the non-turning struts. In Figure 5 (a), showing a part of the contour plot of the total
pressure coefficient for the reference five-hole-probe measurement grid, the strut wake can be
identified at 10.5 degrees by a narrow band of low total pressure over the span height. The flow
structures visible in duct core flow on the left side of the wake (from 0 to 9 degree) are mainly due
to the evolution of the wakes generated by the HP turbine vanes propagating through the turbine
duct.
Again, as a first step, a reduction of the circumferential measurement points to one third
compared to the reference grid was done for Figure 5 (b). There is almost no change in the result for
-0.15
-0.10
-0.05
0.00
0.05
0.10
0.15
0.20
0.0 2.0 4.0 6.0 8.0 10.0 12.0
c pt
[-]
θ [deg]
0
10
20
30
40
50
60
70
80
90
100
-0.3 -0.2 -0.1 0.0 0.1 0.2
Sp
an
He
igh
t [%
]
cpt [-]
reference 5HP grid circumferentially reduced grid
radially reduced grid circumferentially and radially reduced grid

8
Figure 5: Parts of plane C contour plots of total pressure coefficients for reference case (a),
circumferentially reduced grid (b), radially reduced grid (c) and circumferentially and
radially reduced grid (d)
Figure 6: Circumferential (left) and radial (right) profiles of
total pressure coefficients in plane B
the flow field in the core flow, whereas the strut wake is significantly washed out in the coarse grid
case. This effect is also visible in the radially averaged circumferential profile in Figure 6 (left),
where the strong pressure gradient in the wake region cannot be detected by the coarse grid.
-0.30
-0.25
-0.20
-0.15
-0.10
-0.05
0.00
0.05
0.10
0.0 2.0 4.0 6.0 8.0 10.0 12.0 14.0
c pt
[-]
θ [deg]
0
10
20
30
40
50
60
70
80
90
100
-0.4 -0.2 0.0 0.2
Sp
an
He
igh
t [%
]
cpt [-]
reference 5HP grid circumferentially reduced grid
radially reduced grid circumferentially and radially reduced grid
(b)
(d) (c)
(a)

9
Keeping the fine circumferential grid resolution and reducing just the radial measurement points
to one third compared to the reference grid leads to the result shown in Figure 5 (c). The obtained
flow field for the total pressure coefficient mostly agrees with the one for the reference grid in
Figure 5 (a). However, the low pressure region near the tip is cut since the last measurement point is
3% lower compared to the reference grid, as can be seen in the radial profile in the right diagram of
Figure 6. As a result, the radially averaged pressure profile in Figure 6 (left) shows a higher total
pressure coefficient in the core flow region, but matches the minimum peak in the strut wake.
The reduction of measurement points in both directions, circumferential and radial, respectively,
again superimposes the outcome of each individual grid reduction process. However, compared to
the result for the duct inlet where the radial grid resolution is essential for capturing the flow
structures, the result for the duct outlet is also highly dependent on the circumferential grid
resolution, as can be seen in Figure 5 (d) as well as in both diagrams of Figure 6. The result for the
circumferentially and radially reduced grid neither accurately captures the strut wake nor the total
pressure level.
Extrapolation to the Endwalls
In contrast to the reduction of measurement points, an extrapolation of the five-hole-probe data
to the endwall points (based on static pressure data) was performed as described above. In Figure 7,
the extrapolated total and static pressure coefficients are illustrated for plane B and plane C, left and
right diagram, respectively. In addition, the total pressure coefficients for the reference grids are
plotted in order to highlight the extrapolated measurement points. As can be seen, the extrapolation
of each radial profile has been performed down to 2% and up to 98% span height. Since the wall
static pressures are known, a cubic interpolation between 0% and 2% as well as between 98% and
100% span height including one additional grid point at 1% and 99%, respectively, has been done in
order to simulate a boundary layer profile of the total pressure coefficient. The radial profiles of the
static pressure coefficient obtained by the five-hole-probe are in good agreement with the wall
statics in terms of inclination of the profiles and match of course the total pressure coefficient at the
endwalls. It must be noted that the extrapolation process has been performed at each circumferential
measurement position and that the presented radial profiles are the results of the mass- and area-
averaged total and static pressure coefficients over the circumference, respectively. Also, the
Figure 7: Radial profiles of extrapolated total and static pressure coefficients in
plane B (left) and plane C (right)
0
10
20
30
40
50
60
70
80
90
100
-1.5 -1.0 -0.5 0.0 0.5
Sp
an
He
igh
t [%
]
cpt [-], cp [-]
0
10
20
30
40
50
60
70
80
90
100
-1.5 -1.0 -0.5 0.0 0.5
Sp
an
He
igh
t [%
]
cpt [-], cp [-]
cpt extrapolated cp extrapolated cpt reference 5HP grid cp reference 5HP grid

10
circumferential variation of the static pressure in both measurement planes due to the specific vane
and strut locations has been considered for these results.
Impact on Duct Loss Evaluation
The turbine duct pressure loss is calculated by the mass-averaged total pressures at the duct inlet
(plane B) and duct outlet (plane C) using the total pressure loss coefficient defined in equation (2).
In Figure 8, the results for the reduced measurement grids as well as for the extrapolated five-hole-
probe profile are demonstrated relative to the total pressure loss coefficient for the reference grid.
Reducing the circumferential measurement points in each plane leads to a small increase of 1.7% of
the duct pressure loss compared to the reference case. As discussed before, there are almost no
differences in the captured flow structures for plane B except for a slight change of the total
pressure level. Although in plane C the strut wakes are not completely captured by the coarse
circumferential grid in terms of minimum pressure, the mass-averaged total pressure in plane C is
similar to the one obtained with the reference grid using the same radial grid. Thus, the total
pressure coefficient for the circumferentially reduced grid is comparable to the one for the reference
grid. Compared to the reference grid, the total measurement time for one vane pitch in plane B and
one strut pitch in plane C was reduced to one third.
In contrast, decreasing the radial grid resolution in both measurement planes leads to a
significant increase of the resulting pressure loss coefficient (23% relative to the reference duct loss;
see Figure 8). Due to the fact that the flow structures in the tip region at the rotor exit (duct inlet)
are not captured by the coarse radial grid, the mass-averaged total pressure in plane B is higher than
the one resulting from the reference grid. The resulting higher pressure level at the duct inlet
dominates the duct pressure loss evaluation, since the radial reduction of the grid points hardly
affects the flow field at the duct outlet (plane C). The same trend is identified for the combination of
circumferentially and radially reduced grid points in both measurement planes. The superposition of
the individual drawbacks leads to a 26% increase in total pressure loss coefficient compared to the
reference case. Similar to the circumferentially reduced grid the total measurement time per vane
and strut pitch for the radially reduced grid is approximately one third of the reference time,
whereas the measurement time for the circumferentially and radially reduced grid is decreased to
one tenth.
In order to find a compromise between the measurement time and the quality of the acquired
data, an adaptive grid was proposed. Based on the aforementioned effects evoked by reducing the
measurement grid resolution in circumferential and radial direction, the new measurement grid was
adapted according to the present pressure gradients. As discussed, structures generated by the tip
leakage at the rotor exit in plane B as well as structures generated by the wakes of the stationary
struts at the duct outlet in plane C cause strong pressure gradients. In order to sufficiently resolve
these gradients a fine measurement grid is needed for those regions. Therefore, in plane B the fine
radial measurement grid of the reference grid is kept, but the circumferential resolution is reduced
to 50% compared to the reference case. In plane C the radial points are decreased and the
Figure 8: Total pressure loss coefficients relative to the 5HP reference case
-15 -10 -5 0 5 10 15 20 25 30
5HP extrapolated
adaptive grid
circumferentially and radially reduced grid
radially reduced grid
circumferentially reduced grid
reference 5HP grid
ξpt - ξpt, ref [%]

11
Figure 9: Parts of plane C contour plots of total pressure coefficients for reference case (a)
and adaptive grid (b), both superposed with the respective measurement grid resolution
circumferential grid includes a fine grid around the strut wake region and a coarse grid in the core
flow region, as depicted in Figure 9 in comparison to the reference case. The result is a decrease of
the total measurement time to approximately 50% of the reference time (see Table 2) without deficit
in the quality of the acquired data. Both the total pressure level and the position of its local minima
and maxima are detected in same quality as with the reference grid. Consequently, the total pressure
loss coefficient is almost equal to the one obtained with the fine grid resolution of the reference case
(see Figure 8).
Considering the low static pressures at the hub and tip endwalls in the extrapolated radial
profiles in Figure 7, the mass-averaging of the total pressure coefficients results in lower values
compared to the reference case for both measurement planes. Due to the larger decrease of the mean
total pressure coefficient at the duct inlet than at the duct outlet, the total pressure loss for the
extrapolated five-hole-probe data decreases by about 12% compared to the reference case without
an extrapolation to the endwalls (see Figure 8). Such an extrapolation of the measurement data is
particularly useful and important when comparing numerical CFD data to the experimental
measurement data. In the numerical domain, the data is available from 0% to 100% span height,
whereas the measurement is limited at the hub and tip regions, using state-of-the art five-hole-
probes. With the extrapolation of the five-hole-probe data to the measured wall static pressures, the
measurement is also able to capture the flow information over the entire channel height.
CONCLUSIONS
The influence of the measurement grid resolution on the duct loss evaluation in a one-and-a-half
stage high pressure test turbine is experimentally investigated in the presented paper. Measurement
data obtained by five-hole-probes at the inlet (rotor exit) and the outlet of an intermediate turbine
duct is used to generate the corresponding flow fields with various measurement grid resolutions.
The individual impact of the circumferential and radial grid resolution is compared to the fine
reference grid at both measurement planes.
It is shown, that downstream of the high pressure rotor a fine radial grid resolution is needed to
capture the strong pressure gradients which are forming the characteristic flow structures in the tip
leakage region. Otherwise the duct pressure loss increases significantly due to the resulting higher
mean total pressure at the duct inlet, since the impact of the radial reduction of the grid resolution at
the duct outlet is negligible. In contrast, a reduction of measurement points in circumferential
direction mostly affects the flow field at the duct outlet. The wakes of the stationary struts are
washed out in the coarse grid case and the minimum pressure level is increased. However, since the
flow field at the duct inlet is hardly affected by a coarse circumferential grid resolution, the
resulting total pressure loss is comparable to the reference case with a fine grid resolution. By
reducing the circumferential grid resolution for both measurement planes the total measurement
0
1.5
3
4.5
6
7.5
9
10.5
12
13.5
0
1.5
3
4.5
6
7.5
9
10.5
12
13.5
cp
t [-]
cp
t [-]
(b) (a)
12
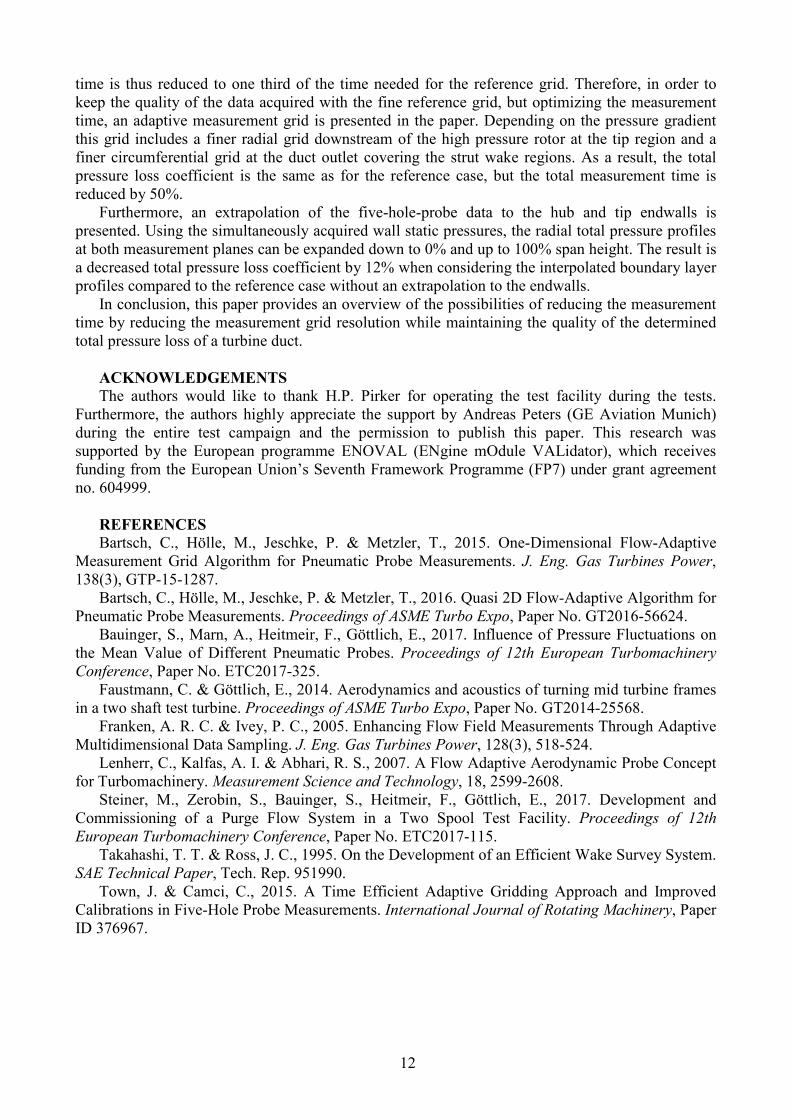
time is thus reduced to one third of the time needed for the reference grid. Therefore, in order to
keep the quality of the data acquired with the fine reference grid, but optimizing the measurement
time, an adaptive measurement grid is presented in the paper. Depending on the pressure gradient
this grid includes a finer radial grid downstream of the high pressure rotor at the tip region and a
finer circumferential grid at the duct outlet covering the strut wake regions. As a result, the total
pressure loss coefficient is the same as for the reference case, but the total measurement time is
reduced by 50%.
Furthermore, an extrapolation of the five-hole-probe data to the hub and tip endwalls is
presented. Using the simultaneously acquired wall static pressures, the radial total pressure profiles
at both measurement planes can be expanded down to 0% and up to 100% span height. The result is
a decreased total pressure loss coefficient by 12% when considering the interpolated boundary layer
profiles compared to the reference case without an extrapolation to the endwalls.
In conclusion, this paper provides an overview of the possibilities of reducing the measurement
time by reducing the measurement grid resolution while maintaining the quality of the determined
total pressure loss of a turbine duct.
ACKNOWLEDGEMENTS
The authors would like to thank H.P. Pirker for operating the test facility during the tests.
Furthermore, the authors highly appreciate the support by Andreas Peters (GE Aviation Munich)
during the entire test campaign and the permission to publish this paper. This research was
supported by the European programme ENOVAL (ENgine mOdule VALidator), which receives
funding from the European Union’s Seventh Framework Programme (FP7) under grant agreement
no. 604999.
REFERENCES
Bartsch, C., Hölle, M., Jeschke, P. & Metzler, T., 2015. One-Dimensional Flow-Adaptive
Measurement Grid Algorithm for Pneumatic Probe Measurements. J. Eng. Gas Turbines Power,
138(3), GTP-15-1287.
Bartsch, C., Hölle, M., Jeschke, P. & Metzler, T., 2016. Quasi 2D Flow-Adaptive Algorithm for
Pneumatic Probe Measurements. Proceedings of ASME Turbo Expo, Paper No. GT2016-56624.
Bauinger, S., Marn, A., Heitmeir, F., Göttlich, E., 2017. Influence of Pressure Fluctuations on
the Mean Value of Different Pneumatic Probes. Proceedings of 12th European Turbomachinery
Conference, Paper No. ETC2017-325.
Faustmann, C. & Göttlich, E., 2014. Aerodynamics and acoustics of turning mid turbine frames
in a two shaft test turbine. Proceedings of ASME Turbo Expo, Paper No. GT2014-25568.
Franken, A. R. C. & Ivey, P. C., 2005. Enhancing Flow Field Measurements Through Adaptive
Multidimensional Data Sampling. J. Eng. Gas Turbines Power, 128(3), 518-524.
Lenherr, C., Kalfas, A. I. & Abhari, R. S., 2007. A Flow Adaptive Aerodynamic Probe Concept
for Turbomachinery. Measurement Science and Technology, 18, 2599-2608.
Steiner, M., Zerobin, S., Bauinger, S., Heitmeir, F., Göttlich, E., 2017. Development and
Commissioning of a Purge Flow System in a Two Spool Test Facility. Proceedings of 12th
European Turbomachinery Conference, Paper No. ETC2017-115.
Takahashi, T. T. & Ross, J. C., 1995. On the Development of an Efficient Wake Survey System.
SAE Technical Paper, Tech. Rep. 951990.
Town, J. & Camci, C., 2015. A Time Efficient Adaptive Gridding Approach and Improved
Calibrations in Five-Hole Probe Measurements. International Journal of Rotating Machinery, Paper
ID 376967.