Influence of Lead-Bismuth Eutectic Environment on …Influence of Lead-Bismuth Eutectic Environment...
106
Influence of Lead-Bismuth Eutectic Environment on the mechanical properties of the AISI 316L stainless steel Candidate: Lorenzo STEFANINI Mentors: Dr. Rosa LO FRANO, University of Pisa Dr. Erich STERGAR, SCK•CEN Dr. Serguei GAVRILOV, SCK•CEN 20 July 2015, Pisa
Transcript of Influence of Lead-Bismuth Eutectic Environment on …Influence of Lead-Bismuth Eutectic Environment...
Influence of Lead-Bismuth Eutectic Environment
on the mechanical properties of the AISI 316L
stainless steel
Candidate:
Lorenzo STEFANINI
Mentors:
Dr. Rosa LO FRANO, University of Pisa
Dr. Erich STERGAR, SCK•CEN
Dr. Serguei GAVRILOV, SCK•CEN
20 July 2015,
Pisa

"Success is not to be measured by the position someone has reached in life, but
the obstacles he has overcome while trying to succeed.”
Booker T. Washington
“If you can’t fly then run, if you can’t run then walk, if you can’t walk then
crawl, but whatever you do you have to keep moving forward.”
Martin Luther King Jr.

"… 4.53 pm on Saturday 1st June 1974 the Flixborough Works of Nypro (UK)
Ltd. (Nypro) were virtually demolished by an explosion of warlike dimensions.
[…] 28 were killed and 36 other suffered injuries. […] number of causalities
would have been much greater. […] Hundreds more suffered minor injuries
[…] a preliminary surveys showed that 1821 houses and 167 shops and
factories had suffered to a greater or lesser degree."
The Flixborough Disaster – Report of the Court of Inquiry
Potential consequences of Metal Induced Embrittlement
Contents
_Toc422298923

1. Introduction ........................................................................................................................ 1
2. Background ........................................................................................................................ 4
2.1 MYRRHA .................................................................................................................... 4
2.1.1 R&D .......................................................................................................................... 6
2.2 Liquid Metal Embrittlement ............................................................................................. 7
2.2.1 Essential conditions: wetting, stress, cracks .............................................................. 9
2.2.2 Influencing parameter ............................................................................................. 11
2.2.3 Proposed mechanisms ............................................................................................. 15
2.2.4 Literature on AISI 316L in LBE environment ........................................................ 16
2.3 Types of fracture in metals ............................................................................................. 17
2.4 Tensile tests .................................................................................................................... 20
2.4.1 SSRT ....................................................................................................................... 22
2.5 MYRRHA Structural Materials ...................................................................................... 26
2.5.1 T-91 ......................................................................................................................... 26
2.5.2 Austenitic Stainless Steels (316L)........................................................................... 30
3. Experimental .................................................................................................................... 36
3.1 Specimens, DEMETRA Projects ............................................................................... 36
3.2 Limets 1 ..................................................................................................................... 38
3.2.1 Limets 1: operational procedure ......................................................................... 39
3.3 Specimens cleaning ........................................................................................................ 43
3.4 Metallography ................................................................................................................. 44
4.1.1 Metallography .................................................................................................... 44
4.1.2 Light microscopy ................................................................................................ 44
4.1.3 Specimens preparation for metallography .......................................................... 45
3.5 Fractography ................................................................................................................... 46
3.4.1 Scanning Electron Microscopy ............................................................................... 47
4. Results .................................................................................................................................. 49

4.2 Microstructure ........................................................................................................... 49
4.3 Tensile Tests – Stress-Strain curves .......................................................................... 52
4.4 SEM – Fractography .................................................................................................. 60
5. Discussion ........................................................................................................................ 64
5.1 Effect of the LBE environment on the tensile properties ............................................... 64
5.1.1 Total Elongation ...................................................................................................... 64
5.1.2 UTS ......................................................................................................................... 67
5.1.3 Yield Strength ......................................................................................................... 69
5.1.4 Uniform Elongation ................................................................................................. 70
5.1.5 Area Reduction ........................................................................................................ 71
5.2 SEM observation ....................................................................................................... 73
6. Summary and Conclusions ............................................................................................... 74
Bibliography ............................................................................................................................. 77
Appendix A – LME Mechanisms ............................................................................................. 83
A.1 Brittle Fracture ............................................................................................................... 83
A.2 Robertson model – dissolution/diffusion ....................................................................... 85
A.3 Glickman model – dissolution/precipitation .................................................................. 87
A.4 SJWK model (Kamdar) – weakening of interatomic bond ........................................... 89
A.5 Lynch model – decrease of the strength of interatomics bond ...................................... 90
A.6 Popovich model – Rebinder effect/plastic flow ............................................................. 92
A.7 Gordon model – penetration .......................................................................................... 93
Appendix B - Pictures of fracture surfaces from papers on T91 and 316L ............................. 95


Acronyms
316L/LBE = Embrittling couple formed by AISI 316L and lead-bismuth eutectic in intimate
contact and under stress.
T91/LBE = Embrittling couple formed by f/m T91 and lead-bismuth eutectic in intimate
contact and under stress.
ADS = Accelerator-Driving System
bcc = Body centered cubic
EIC = Environmentally Induced Cracking
EMF = ElectroMotive Force
EDX = Electron Dispersive X-ray analysis
f/m = ferritic/martensitic
fcc = face centered cubic
HE = Hydrogen Embrittlement
HLM = Heavy Liquid Metal
LBE = Lead-Bismuth Eutectic
LCF = Low Cycle Fatigue
LME = Liquid Metal Embrittlement
MOX = Mixed Oxyde Fuel
MYRRHA = Multi-purpose hYbrid Research Reactor for High-tech Application
RA = Reduction in Area
SCC = Stress Corrosion Cracking
SEM = Scanning Electron Microscope/y
SS = Stainless Steel
SSRT = Slow Strain Rate Tensile test
UE = Uniform Elongation
UTS = (Ultimate) Tensile Strength
TE = Total Elongation
YS = Yield Stress


Introduction
1
1. Introduction
In 2015 the reduced availability of energy resources, and the fear of a further decrease of them
seem to be diffused worldwide. People become aware of the fact that it is not feasible to
continue to burn fossil fuels: natural gas, oil and coal, which have multiple use, are starting to
cease. In this contest, the production of electricity needs new and different sources. There are
two main options in this respect: nuclear energy and renewable sources.
This study is focused on the nuclear energy, and, specifically, on the feasibility of new
nuclear technologies that could make energy production more sustainable.
Nuclear energy came out in the ‘50s as a reliable and safe source of energy, which seemed to
be almost infinite. It was the most revolutionary invention of that time; everyone in the world
knew the infinite power of the U atom, not necessarily used for pacific purposes.
In a Nuclear Power Plant the energy is produced by transferring the kinetic energy deriving
from the Uranium fission products into heat, which was subsequently removed by water; the
steam convoyed to rotating turbines (coupled with alternator) allowed to produce electric
energy.
What makes the nuclear energy so special, enough to call the other energy sources
"conventional", is of course the fuel, normally made of uranium oxide UO2 (3-5% U-235
enriched).
With the increasing need of energy in countries like China, India, Brazil, South Africa a
considerable number of nuclear reactors will be built in the next 10 years. This raises the
problem of the natural resources supply, to be approached at least in three ways:
1. Using the not easily and more expensive extractable uranium ore, with higher price of
uranium (three times than the actual paid) it may result in an increase of the supply
price of about 5%, despite the uranium price has negligible influence on the final price
of the kWh.
2. Using more efficiently the uranium extracted by taking advantage of all the uranium
extracted.
3. Using other different natural ore elements, like Thorium.

Introduction
2
The point 2. is the most valuable and so far developed (and desirable) path to be followed.
The more efficient use of the uranium is achieved by burning all the uranium, including the
U-238. To do this one fast neutron spectrum needs to be used. In fact the fission cross-section
(probability that fission occurs per neutron) for the U-238 is higher only when the impacting
neutron has high energy.
With reference to this latter aspect, a new generation of nuclear reactors is under design,
currently referred to as Generation IV (Gen-IV); in this contest Lead or Lead-Bismuth Cooled
Fast Reactor will be considered.
Gen-IV reactors are supposed to be safest, mostly efficient and reliable than those existing:
these goals are/will be achieved through innovative technologies.
Another important and urgent problem to face is the management of the HLW and of the
spent nuclear fuel (SNF). SNF contains high level radioactive isotopes of thousands years
half-life. The problem can be approached in many ways:
1. Storing wastes, as they are, in geological repository.
2. Reprocessing the fuel, reducing the amount of high level waste.
3. Transmutating heavy and long lived elements by irradiating the fuel in proper facilities
so to reduce their half-life to hundreds years and to produce energy as well.
MYRRHA is going to be a IV-Gen reactor, using lead-bismuth eutectic (LBE) as coolant,
and taking advantage of the ADS concept. It will have several aims: production of medical
isotopes, materials testing, doped Si production and, last but not least, it will be the most
important IV-Gen prototype of a transmutation facility. Even if it will not be an industrial
simulator, MYRRHA will prove the feasibility of this process.
In this study an important contribution to the realization MYRRHA has been done by
investigating the performance of material to be employed in the main structural and support
component. Firstly ferritic/martensitic T91 steel and austenitic AISI 316L stainless steel were
taken into account as possible material candidates. Particularly, T91 seemed to be very
promising and several investigations were carried on.
T91 revealed its weakness in suffering liquid metal embrittlement when in contact with LBE,
and for that reason is not currently considered as structural material. The only choice available
remained thus AISI 316L.

Introduction
3
In this study, the behavior of the AISI 316L in LBE environment will be analyzed by means
of tensile tests and microscopic observations. Particularly, it will be investigated the
occurrence of liquid metal embrittlement. The study will be performed by using the same
approach adopted for the T91/LBE embrittling couple. As main tensile parameter the
variation of the total elongation will be considered, as trivial indicator of the occurrence of the
liquid metal embrittlement. In this work the following two objectives have been hence
investigated:
- Determine whether the AISI 316L suffers embrittlement when in contact with LBE or
not;
- Determine if the method of investigation used for the T91/LBE embrittling couple is
also valid for the couple 316L/LBE.

Background
4
2. Background
2.1 MYRRHA
MYRRHA (Multi-purpose hYbrid Research Reactor for High-tech Application) is a corner
stone in the framework of European Research Area of Experimental Reactors, and so also in
the development of new technologies related with the Gen. IV reactors. In fact, being
MYRRHA a research reactor and a flexible irradiation facility; it may be used as a valid
support in the development of the complete gamma of fast reactors: Lead Fast Reactor,
Sodium Fast Reactor and Gas Fast Reactor.
Moreover, MYRRHA will substitute the main SCK•CEN facility, the BR-2 light water
reactor. The BR-2 is a Material Testing Reactor and it provides a significant amount of the
worldwide used medical molybdenum radioisotope, besides others medical radioisotopes.
Moreover, it is one of the leading facilities in the production of doped Si for high-tech
electronics. Finally, MYRRHA is developed with the concept of Accelerator Driven System
(ADS) reactor; this is considered one of the most suitable options in transmuting the long-
lived radioactive waste [1]. ADS means that the neutron source is achieved by the system
composed by a proton accelerator, a spallation source and a sub-critical core. The main
advantage in using this type of reactor is its inherent safety; in fact the reactor is switched off
at the moment the proton beam is switched off (criticality concept).
Figure 2.1– General scheme of MYRRHA ADS. (MYRRHA sd)

Background
5
The proton beam used by MYRRHA will be delivered as a Continuous Wave by a Continuous
Wave Linac (linear machine); the accelerator is linear and delivers the beam as well-divided
bunches of protons. The accelerator requirements are a compromise between: beam energy
(neutron yield, dimensions, and costs), beam intensity (neutron yield), beam shape and profile
(efficiency and cooling capability) and beam availability (damages on the ADS, efficiency).
Linac is composed by two sections: the "front end" and the "independently phased
superconducting section". The front end comprises a first ion source (Electron Cyclotron
Resonance) and accelerates protons up to 17 MeV. The second part consists of a sequence of
individually controlled superconducting cavities. The use of superconducting cavities is to
minimize ohmic and beam losses.
Once protons are delivered, they interact with the spallation target, providing primary
neutrons. These are produced by means of spallation reaction of the heavy-metal target nuclei
with the protons themselves. The production happens in stages.
Figure 2.2 – Chain of events in the production of neutrons
At the first stage ("internuclear cascade") the proton reacts directly with the nucleons of the
target leading to emissions of very energetic secondary particles (mainly neutrons and
protons). At the second stage, the excited nuclei relief their energy in excess by releasing a
large amount of neutrons. These phenomena are completed by means of classical nuclear
fission process at lower energy. Generally an average of 15 neutrons per proton is produced.
The chosen spallation target is the Pb-Bi eutectic (LBE). Vacuum is required in order to avoid
plasma formation at the interface between LBE and beam. LBE evaporation must be kept
under control. Once produced, the neutrons enter the sub-critical core, which acts like an
amplifier. The fresh core of MYRRHA is supposed to have 183 hexagonal channels of which
68 occupied by MOX fuel assemblies. Three hexagonal channels are left empty to house the
spallation target. With this configuration the keff is equal to 0.955. The Doppler constant
(Tdk/dT) is -370 pcm, the coolant coefficient (dk/dT) is -2.4 pcm/K in the range 150 °C –
400 °C. If the spallation target module is emptied the reactivity contribution is around -1000

Background
6
pcm, while voiding the first 30 cm of the active part of the 21 central elements means a
reactivity insertion of 300 pcm. If the LBE is drained a contribution up to -2500 pcm appears.
Thermal expansion of the structures during the start-up inserts -490 pcm.
In Table 1 the MYRRHA dimensions and specifications are reported.
Characteristic MYRRHA
Core barrel inner diameter 1480 mm
Reactor vessel inner diameter 6030 mm
Height (cove not included) 8860 mm
Primary coolant LBE
LBE volume 150 m3
Secondary coolant Boiling water
Core inlet temperature 270 °C
Core average outlet temperature 400 °C
Maximum allowed bulk velocity 2.0 m/s
Nominal core power 50-100 MWth
Table 1 – Summary of the principal characteristics of the primary system
2.1.1 R&D
The research and development program of MYRRHA is oriented in three main directions:
- R&D on LBE technology: this involves research on the spallation loop thermal-
hydraulics, on the vacuum system, on the fuel pin and assemblies thermal-hydraulics,
on the radiotoxicity issues (194Hg and 210Po) and, for what mainly concerns the
structural material issues the chemistry control. In fact oxygen control has been chosen
as the method to control corrosion arising from the use of LBE as coolant. For this
purpose oxygen sensors and adequate oxygen control methods have been developed.
Nevertheless the removal of the LBE from the structure has been taken into account
by means of small-scale simulation.
- R&D on component qualification: this involves a big effort in research about the pool
thermal-hydraulics behavior. In fact, in order to validate computational tools and
qualify the design and safety, experiments on scaled-down models are necessary. For
what concerns the heat exchangers, the main uncertainties arise from the validation of
heat transfer correlation for LBE. The other main research programs are about the

Background
7
robotics (remote handling have been proved to work in small-scale experiments in
inert environments and has to be validate for LBE) and ultrasound imaging (because
of the opacity of LBE a reliable system is necessary).
- R&D on materials and qualification strategy: the main decision about materials has
been to rely on industrially available materials rather than on the development and
optimization of innovative materials. At high temperatures (550 °C) and under
relevant irradiation no data are actually available so the operation temperature for the
Lead Fast Reactor prototype has been chosen to be lower (around 480 °C). Structural
materials have to be tested under representative conditions (high temperature, high
burn-ups and aggressive environment). Five areas of study have been identified:
1. Workability and fabricability: investigated in EU FP6-FP7 Projects with particular
attention to the welding-joining techniques and to the cladding fabrication;
2. Mitigation of corrosion by LBE: aimed to create a predictive model relevant for
the corrosion issues in the coolant circuit and to suggest mitigation measures,
including their validation. (Parts of these investigations were also done in the
framework of European FP6 and FP7 projects);
3. Embrittlement by LME: the aim is to develop and validate experimental tools to
measure the fracture toughness in LBE environment;
4. Irradiation effects: the principal objective is the completion of the database on
irradiated materials;
5. Transferability of the experimental results to the actual MYRRHA machine.
Generally speaking high Cr f/m steels and nuclear grade austenitic stainless steels
have been selected for the evaluation of point 3). Austenitic steels seem to be the
favorite candidate for the structural parts (i.e. reactor vessel) because of the behavior
at low temperatures and under irradiation, while ferritic-martensitic (f/m) T91 appears
the best candidates for fuel cladding because of its resistance against swelling and
creep under high fast neutron flux. Even though it is likely that the first core will be
composed by 15-15 Ti stabilized clads; further validations for the T91 are requested.
2.2 Liquid Metal Embrittlement

Background
8
The Liquid Metal Embrittlement (LME) is a phenomenon discovered in 1874 and currently
not completely understood. Lynch in [2] offers an overview of the most common industrial
situations that may lead to embrittlement. He cites:
- Coatings: Cd, Zn and other low melting are widely used for protection against
corrosion. LME may occur during the application of coating if residual stresses are
present or during service at high temperatures and sufficiently high stresses.
Sometimes inert films are deposited between coatings and substrates to prevent
embrittlement from occurring.
- Welding: if in the welding material there are present some embrittlers it is likely to
have LME during joining of components.
- Lubricants: lead is used as a lubricant during cold machining on steels, a residual
amount of it may produce cracking during stress relieving.
- Overheated bearings: if the bearing contains copper LME may occur in case of
overheating caused by loss of lubrication.
- Nuclear fission product: alkali metal coolants and metallic fission products may
affects the mechanical properties of structural materials (i.e. zircalloy cladding
suffered failures by embrittlement by cadmium-cesium fission product).
- Accidental contaminations.
- Internal sources: i.e. Pb or Bi are sometimes intentionally added to materials to
improve their machinability. Segregation of P, Sn and Sb to prior-austenite grain
boundaries in high-strength steels may cause temper embrittlement (defined metal-
induced embrittlement if the segregated specie is a metal).
- Etc.
A unique theoretical model capable to predict and explain extensively and without
contradiction LME phenomenon is still missing. Several LME definition have been given
from different authors, the most relevant of which are:
LME is the reduction of mechanical properties of a material in contact with
a liquid metal and subject to tensile loading.
[3]
LME is the degradation of the mechanical properties (generally tensile) of a
stressed material, whilst in intimate contact with some liquid metal.
[4]
LME is the brittle fracture, or loss in ductility, of a usually ductile material
in presence of liquid metal. [5]

Background
9
LME is the reduction in elongation to failure that can occur when normally
ductile metals or alloys are stressed while in contact with liquid metals.
[6]
LME is the reduction in resistance to the initiation and growth of cracks in
certain liquid-metal environment.
[2]
LME is a special case of brittle fracture. Indeed the effects of mechanical,
metallurgical, physical and chemical factors on embrittlement may be
explained rationally in terms of the principles of brittle fracture.
[7]
All these definitions have however some common factors, such as wetting, stress and cracks.
2.2.1 Essential conditions: wetting, stress, cracks
2.2.1.1 Stress
Almost all the authors refer to LME as a phenomenon occurring when the solid material is
subject to a stress exceeding a certain threshold. Even though the definition looks clear and
simple it is well known that the embrittlement of aluminum by liquid gallium occurs without
any stress as it can be seen in Figure 2.3. The situation can be, anyway, more complicated. A
metal supposed free from stress may contain high stress concentrations due to the presence of
obstacles (i.e. grain boundaries) serving as stress concentrators. Dai [8] presents this concept
in light of stress concentration at the crack tips.
Figure 2.3– Strain/Stress thresholds for various embrittling systems with polycrystalline aluminum as solid metal [9]

Background
10
2.2.1.2 Wetting
According to the theory of lowering in the surface energy by mean of liquid metal atoms
presence near to the surface (Rebinder effect) an extremely good grade of contact seems to be
necessary to introduce LME. Multiple authors observed that the presence of an oxide layer on
the surface avoids the embrittlement phenomenon. The removal of the oxide layer has been
one of the most challenging features in the study of LME. In the most recent studies the
possibility of reaching excellent wetting even with system having negligible solubility has
been demonstrated. The wetting necessity is demonstrated again by the need of feeding the
crack tips with the liquid metal. Once the crack tips are not fed with liquid metal the brittle
propagation stops [6].
Three main methods of oxide layer removal to ensure the intimate contact with the structural
material are:
- Direct contact via physical vapour deposition [10].
- Intimate contact by means of chemical flux [11].
- Ageing in a heavy liquid metal bath: this method is the one used during this work.
It is well described in [8] and has been also reported in [4]. The oxygen content in the LBE in
the test tank should not exceed 1 wppm. During the tests, presented in this work, the oxygen
concentration was around 10-11 wt%, well below that limit value. To remove efficiently the
oxide layer, specimens were immersed in LBE for 12 hours or longer ("pre-exposure"). The
low oxygen level in the LBE allows the dissolution of the oxide layer.
2.2.1.3 Cracks
Dai presented in [8] the importance of the presence of cracks by using two groups of
specimens: group "I" not treated after electro-discharge machining and group "II" electro-
polished after electro-discharge machining. From an analysis on T91 tested at 375 °C with a
strain rate of 10-5 m/min he determined that group-I specimen showed LME not present in the
group-II specimen. A subsequent metallographic analysis of the samples showed that the non-
electro-polished samples contained micro-cracks, the contrary for the electro polished. These
observations are in agreement with a peculiar LME characteristic: the tendency of the liquid-
metal-induced-crack to form on the external surface. The presence of previous starting sites
and crack tips enhances LME.

Background
11
2.2.2 Influencing parameter
As previously indicated a unique theory predicting LME occurrence is still missing. What is
clear by analysing the past studies, is that the conditions for which LME appears are changing
with the embrittling couples. For this reason each couple should be thoroughly investigated
considering the variations of the all parameters.
2.2.2.1 Strain Rate
Lynch in [2] stated that the degree of LME is often greater at higher strain rates. Perovic in
[12] noticed a dependence of the ductility recover temperature TR (the right edge of the
ductility trough in Figure 2.4), in particular it shifts to higher temperature as the strain rate
increases. The same behavior is shown from the ductility trough depth, higher the strain rate
deeper the trough. Other examples supporting this conclusion are reported in [6] where an
increased embrittlement produced by high strain rate for Al-Hg3%Zn, Al-In [13] and Ti-Cd
[14] is shown.
Figure 2.4– Example of ductility trough [6].
Other tests showed instead the opposite behavior. Indeed, in [4] is shown how the
embrittlement of both the T91 and the AISI 316L is enhanced by lower strain rates (Figure
2.5).

Background
12
Figure 2.5- a) LME for T91 in Hg at room temperature. b) LME for 316L in Hg at room temperature [4].
Hamouche-Hadjem in [15] showed the influence of strain rate on LBE induced LME on T91.
The lower the strain rate, the more pronounces is the effect of LME.
This brief overview shows how results can differ each other depending on the chosen couple,
and thus, how important is to study each embrittling system. In addition it has been
demonstrated that the strain rate and the temperature are not only parameters that may affect
LME but also parameters that can influence each other.
2.2.2.2 Temperature
Often LME is found to occur at a certain temperature range, that is called ductility trough.
This is shown in Figure 2.4 where it is delimitated by TE and TR. TE is, in mostly cases, the
melting point of the embrittler, and is also the temperature at which LME seems to be stronger
[6] [5]. Nevertheless, not always TE coincides with the melting point. Indeed LME may occur
below the embrittler melting point if a eutectic is formed between the liquid metal and a metal
component [2]. It has been also proven that LME can be as stronger as the temperature is
higher. Hémery in [16], studying the embrittlement of 304L by liquid sodium, states that LME
occurs in a range from 300 °C to 400 °C and that the embrittlement increases along with the
temperature. For martensitic steels, Ye [17] shows that the embrittlement is stronger as the
temperature increases (Figure 2.6).

Background
13
Figure 2.6 - Effect of temperature on T91 TR750 coupled with LBE [17].
Van den Bosch in [18] shows a reduction in total elongation in the temperature range of 115-
450 °C. The measured minimum value of the total elongation was at 345 °C.
Finally, Dai in [8] report the data for not polished T91 specimen in contact with LBE at
various temperatures for a fix strain rate of 10-5 s-1. Results showed that LME occurs from
300 °C and became more severe at elevated temperatures.
2.2.2.3 Grain Size and metallurgy
Nicholas in [6] indicated that an increasing of the grain size is associated with a worsening of
the embrittlement effect but he also claimed the reverse behavior observed by Ichinose in [19]
for pre-strained aluminum coupled with Hg-3% Zn.
Barbier in [5], regarding the grain size, propsed a linear relationship between the true tensile
strength and d-1/2, where d is the average grain diameter. He claims also that the brittle to
ductile temperature (TR) increased linearly with the grain size, with log(d). Lynch in [2] found
segregation of impurity (i.e. Sb and Sn) in high strength steels increases the susceptibility to
LME.
Almost all the authors agreed that harder materials have an increased susceptibility to LME
[2] [5] [6]. Anyway both Barbier and Lynch point out that if hardness is obtained by cold
work the LME susceptibility will decrease, since the grain size decreases [5] ,and will
produce a more fibrous grain structure that would result in a more tortuous inter-crystalline
crack path and a greater resistance to inter-crystalline cracking [2].
Finally, Serre in [20] shows that temper heat treatment has effects on the T91 behavior in
LBE. By varying the annealing temperature (from 750 °C to 500 °C) the hardness of the

Background
14
material is adjusted; the hardest material had the worst behavior in LBE: above 600 °C a
ductile behavior is instead promoted.
2.2.2.4 Alloying of the liquid embrittler
Barbier et al. in [5] states that changes in liquid metal composition may increase/decrease the
LME susceptibility although without significant effects. Nicholas in [6] added that this
evidence suggests that major effects are produced by substantial addition of impurities (not in
the order of ppm).
2.2.2.5 Composition of the solid metal
Besides in this case some addition to the solid metal may increase or decrease the degree of
LME. The fact that the main influence of an alloying element takes place at the level of grain
boundaries is commonly accepted [5].
2.2.2.6 Mutual solubility
It is commonly accepted that the embrittlement is generally achieved when the couple has a
low mutual solubility. In the past this condition seemed to be not in agreement with the
wetting condition however, with the improvement in cleaning surfaces from protecting layers,
a perfect wetting can be achieved despite low solubilities. The low solubilities concept
matches with the concept of adsorption of the embrittlement. Low solubilities appear anyway
a necessary condition for LME, instead high solubilities may lead to dissolution of the solid in
the liquid, with a consequent blunting of the crack tips (which might arrest the crack
propagation) [13] [21].
2.2.2.7 Interfacial and grain-boundary energies
SL (interfacial energy) and b (grain-boundary energy) parameters are considered in each
proposed LME forming mechanism; of course their variations may lead changes in the
characteristics of LME.
2.2.2.8 Formation of intermetallics
Lack of intermetallics is generally required to have LME. Popovich in [22] noticed that this
empirical low is not followed by every system (i.e. Sn embrittles Fe and forms intermetallics
with it).

Background
15
2.2.2.9 Time of pre-exposure
The time of pre-exposure does not influence the degree of the embrittlement [5], it must last
in any case longer enough to favorite the dissolution of the oxide layer. Anyway, it has been
also proposed that LME might not happen on smooth 316L cylindrical specimen in LBE
because of the short time of exposure. A longer exposure may lead to formation of corrosion
pits and to preliminary cracks, as cited by [17].
2.2.2.10 Specimen geometry
Lynch in [2] states that the effects of LME are similar to the ones of the hydrogen
embrittlement. This leads to the conclusion that embrittlement may be sometimes observed in
notched specimen but not in non-notched.
2.2.3 Proposed mechanisms
In this paragraph a brief summary of the LME proposed mechanisms is reported. A more
extended explanation of these methods is given in the Appendix A.
Author Model
Robertson
(1966) Robertson in [23] presents a model in which the liquid metal enhances the
dissolution of the solid metal at the crack tip aided by stress and capillarity. Atoms
dissolve in the liquid and the crack advances. Glickman
(1978) For Glickman [24] the nucleation and the growth of cracks occur along the grain
boundaries and are associated with the dissolution of solid metal atoms at the crack
tip. The dissolution is enhanced by the adsorption of the liquid metal atoms, which
favors the nucleation of dislocations, creates an atomic roughness at the
solid/liquid interface, and enhances the dissolution, leading to an accelerated
propagation. Kamdar (1983) The model presented by Kamdar in [21] is based on the weakening of the inter-
atomic bonds; seen as a particular case of brittle fracture. Even if this model
explains various dependences of the LME phenomenon (strain-rate, temperature,
grain size, etc.) it doesn't predict the occurrence of embrittlement. Lynch (1992)
This model, presented by Lynch in [2] and in other papers, assumes that crack
propagation does not occur by rupture of atomic bonds and it gives an explanation
for the presence of ductility at a micro-level. It states that the weakening of the
interatomic bonds eases the nucleation of dislocations and promotes intensive slip
of them, this leads to the formation of voids and their coalescence with the
propagation of the crack. Popovich
(1978) This model based on the Rebinder effect and on enhanced plastic flow. Popovich,
as Lynch, proposes [25] a method which foresees an easier plastic flow. Popovich
states that this easing is due to the reduction of shear stress , caused by the action
of liquid metal. The increased dislocation activity leads to a work hardening in a
determined region and, consequently, to a premature failure. Gordon (1982)
Gordon [26] postulates that the embrittler atoms are absorbed and then penetrated
a short distance into base metal grain boundaries. In these zones the presence of
the embrittler lowers the crack resistance and increases the difficulty of slip. When

Background
16
a sufficient concentration of embrittler atoms has been built up to some critical
depth in one penetration zone, cracks nucleation takes place.
2.2.4 Literature on AISI 316L in LBE environment
While the literature about the couple T91/LBE is already substantial and well structured, the
same is missing for the AISI 316L/LBE couple. Some works about the susceptibility to AISI
316L to liquid metal embrittlement exist, even if mostly related to the couple 316L/Hg [27]
[4]. As Gorse states in [28] in 2000 no literature was present about the couple 316L/LBE.
Since the start of the first European projects most of the attention has been related to
ferritic/martensitic steels.
The main studies are:
- Kalkhof and Grosse in [29] studied the low cycle fatigue at 300 °C, 450 °C and
550 °C. They found that in LBE, AISI 316L shows a stress relaxation at 300 °C, this
result is not achieved in air at such moderate temperature. They stated that LBE effects
on AISI 316L may be considered weak.
- Hamouche-Hadjem et al. in [15] performed tensile test on 316L/LBE at 160 °C and
used the strain rate as parameter. The authors claimed the first observation of quasi-
brittle behavior by mean of shear stress de-cohesion and stated that this phenomenon
increases with decreasing strain rates. Comparing the stress-strain curves derived from
the tests performed in LBE and in air, LME occurrence is not deducible (reduction in
total elongation; reduction in UTS, etc. are not present).
- Coen et al. in [30] performed fracture toughness tests at 200 °C and 300 °C. Coen
found that non clear signs of LME were noticeable at 200 °C while at 300 °C a small
drop in force was obtained after UTS. The results were anyway not even comparable
to what obtained for T91. The fracture surface showed a ductile behavior.
- Gorse et al. in [28] analyzed the influence of LBE environment on AISI 316L by
means of Low Cycle Fatigue (LCF) and tensile tests. The tensile tests on AISI 316L
(between 150 °C and 600 °C) in LBE environment show that the austenitic stainless
steel retains its ductility. LCF tests where instead performed at 300 °C, 450 °C and
550 °C. In these situations a weak influence of the LBE environment was found.
- J. Van den Bosch in [31] performed tensile tests on AISI 316L at various strain rates
at 350 °C. He found no sign of LME fracture toughness for tests at 200 °C and 300 °C

Background
17
in oxygen saturated LBE; only at 300 °C some sign of reduction in fracture toughness
was observed. Anyway those values remained within the normal expected scatter due
to the fracture toughness test procedure. The fracture surface was found to be fully
ductile.
2.3 Types of fracture in metals
Types of fracture may be rudely divided in ductile and brittle. In fractography this
classification is too coarse. It is preferred to classify the types of fracture as follows:
- Transgranular fracture:
1. Brittle cleavage fracture (Figure 2.7)
2. Ductile fracture (Figure 2.9)
3. Fatigue fracture
- Intergranular fracture:
4. With micro-void (Figure 2.11)
5. Without micro-void (Figure 2.11)
Brittle cleavage fracture:
Figure 2.7 – SEM fractography of cleavage fracture surfaces. [32]
Flat surfaces are created by low energies and caused by a fast propagation of the crack
transgranularly. At the higher magnification (using the SEM) the fracture surface shows a
river line pattern or stress line pattern in which is pointing towards the origin of the crack (see
Errore. L'origine riferimento non è stata trovata.).

Background
18
Figure 2.8 – Line patterns showing crack initiation sites at various magnifications. [32].
If in some areas ductile features are observed (as in the case of liquid metal embrittlement
fractures) a quasi-cleavage surface is obtained.
Ductile fracture: this failure occurs by overstress.
Figure 2.9 – Ductile fracture in 304L stainless steel [33].
The fracture surface is characterized by numerous concave dimples. These are halves of
micro-voids which develop very near the advancing crack front as the metal is being strained.
With increasing deformation, the voids coalesce to form the fracture plane. The dimples can
nucleate and grow around inclusions as sulfides, carbides and silicates. The shape of the
dimples can be used also to determine the type of force applied on the specimen, as shown in
Figure 2.10.

Background
19
Figure 2.10 – Various stress generate various dimples orientation [32].
Fatigue fracture: is primarily characterized by the presence of striations, each of which is
associated with a cycle in the cycling loading.
Intergranular fracture: this kind of fracture can occur under a variety of loading and
environmental conditions (SCC, creep, HE, fatigue, etc.). It is generally associated to a
weakening of the grain boundaries by precipitation of variation in concentration of certain
elements/compounds. It can occur with or without micro-voids coalescence.
Figure 2.11 – Intergranular fracture wit hand without micro-voids coalescence [32].

Background
20
2.4 Tensile tests
The tensile tests are performed in order to obtain tensile properties useful to characterize a
material. This technique uses tensile specimens, which have a typical shape shown in Figure
2.12.
Figure 2.12 – Tensile specimen with dimensions [34].
On the specimen two zones are present. The two ends are used for gripping. The central part,
which is the thinner zone, is called gage length. The cross-sectional area of the gage section is
reduced so that deformation and failure will be localized inside this region.
The main result of tensile test is the stress-strain curve. There are two types of curves:
- Engineering curves: these are the curves used in this study. On the two axis there are:
o Engineering stress ():
Where F is the tensile force and A0 is the initial cross-section area of the gage
section.
o Engineering strain (e):
Where L0 is the initial gage length and L is the change in gage length (L-L0).
The tensile test is performed by holding the specimen at the two end sites and
submitting it to traction until rupture. The outcome is the stress-strain curve (showing
tensile properties). An example of an engineering stress-strain curve is reported in
Figure 2.13.

Background
21
Figure 2.13 – Characteristic stress-strain curve. The main tensile parameters and phenomena are indicated [34].
The main tensile parameters are:
o Yield Strength (YS): is the value of stress at which the deformation mechanism
passes from elastic (stretching of interatomic bonds) to plastic (planes of atoms
slide one over another). It is found on the stress-strain curve by constructing a
straight line parallel to the initial linear portion of the curve; offset by = 0.2%.
The initial linear part follows Hook's law.
o Uniform Strain or Elongation (UE): is the value of strain corresponding to the
strain at UTS stress. It indicates the last moment before the necking starts.
o Ultimate Tensile Strength (UTS): is the maximum load achieved divided by the
original cross-sectional area of the specimen. From the UTS the specimen
undergoes to the necking phenomenon, where the cross-sectional area starts to
reduce. During this phase, the (real) stress on the specimen continues to
increase but the applied load decrease.
o Strain at fracture or Total Elongation (TE): represents the elongation at
fracture. It is a measure of the ductility of the material and it is defined as:
Background
22
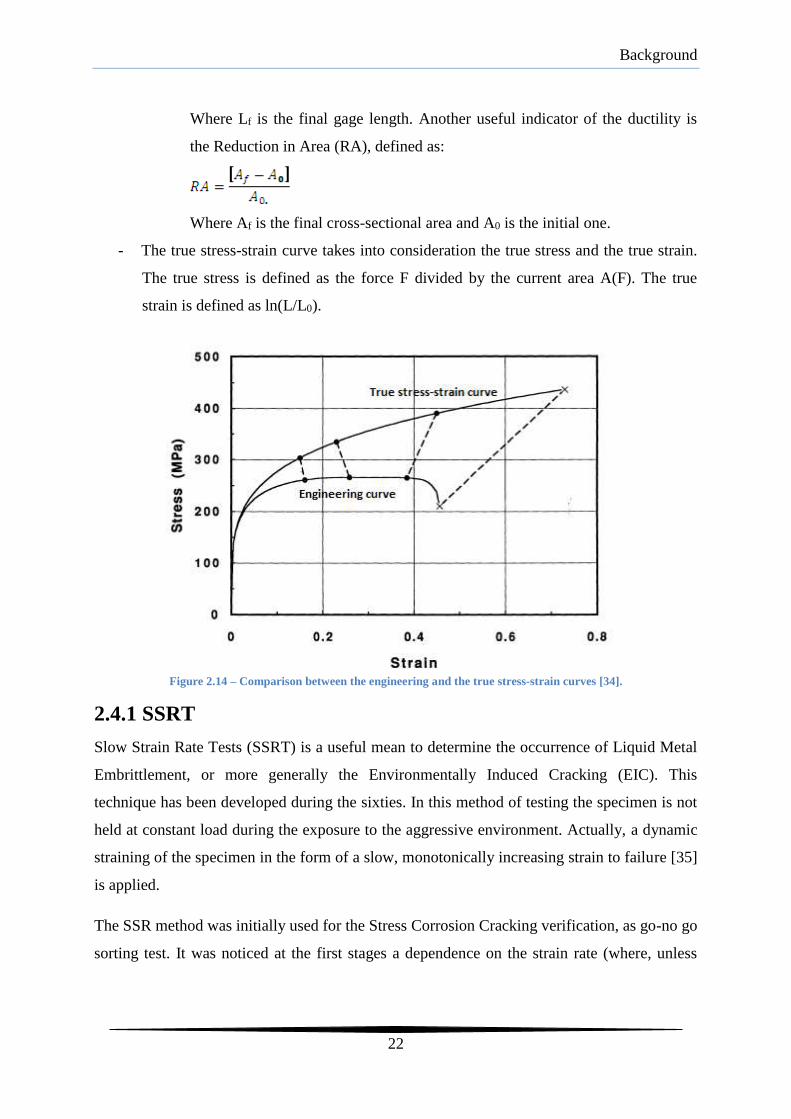
Where Lf is the final gage length. Another useful indicator of the ductility is
the Reduction in Area (RA), defined as:
Where Af is the final cross-sectional area and A0 is the initial one.
- The true stress-strain curve takes into consideration the true stress and the true strain.
The true stress is defined as the force F divided by the current area A(F). The true
strain is defined as ln(L/L0).
Figure 2.14 – Comparison between the engineering and the true stress-strain curves [34].
2.4.1 SSRT
Slow Strain Rate Tests (SSRT) is a useful mean to determine the occurrence of Liquid Metal
Embrittlement, or more generally the Environmentally Induced Cracking (EIC). This
technique has been developed during the sixties. In this method of testing the specimen is not
held at constant load during the exposure to the aggressive environment. Actually, a dynamic
straining of the specimen in the form of a slow, monotonically increasing strain to failure [35]
is applied.
The SSR method was initially used for the Stress Corrosion Cracking verification, as go-no go
sorting test. It was noticed at the first stages a dependence on the strain rate (where, unless

Background
23
differently specified, strain rate refers to the initial strain rate calculated from the initial gage
length).
Susceptibility to EIC is defined by SSRT by mean of various possible parameters like: time to
failure, maximum load/stress achieved during the test, % Reduction in Area, elongation at
rupture, average crack velocity. Moreover SSRTs are proficiently used to sort rapidly the
effects of metallurgical changes or to define the effectiveness of an environment in terms of
its composition [36].
Advantages of SSRT are [36, 37]:
i. The period of testing is generally shorter if compared with constant load or deflection
techniques.
ii. There is no "test time" to specify, since the result of a SSRT is anyway the rupture of
the specimen (unless stated otherwise). Actually the test duration is an interesting
parameter to analyze.
iii. SSRTs are more aggressive and higher loads may be reached.
iv. Realistic approach to service failures.
v. Rapid identification of environment/metal combination which produce EIC.
vi. Establishment of quantitative rankings of EIC properties of metals and alloys having
similar microstructure.
In some cases the SSRT can be stopped before the failure of the specimen. In this case it is
called "interrupted SSRT".
Generally a test is interrupted to examine cracks, as it was done during in this study for T91,
and so to obtain a value of threshold stress. One can indeed interrupt several tests at various
stresses and, examining the presence of cracks, can determine a threshold stress for which a
certain phenomenon (in this study LME) appears at certain conditions.
Finally, the specimens for SSRTs are generally: smooth, pre-cracked or notched.
The difference between the two latter is that a pre-cracked specimen can be prepared by
fatigue while a notched specimen requires previous machining.
EIC in the vicinity of cracks/notch is a local phenomenon, localized at the crack/notch tip and
is therefore linked to local variables as local stress, local strain and local strain energy density.

Background
24
Thus if someone wants to obtain quantitative relations and objective results the knowledge of
these local values is needed, especially the local strain.
By using the pre-cracked and notched specimen configuration described in Figure 2.15, local
and global strain can be defined.
Figure 2.15 – Pre-cracked (left) and notched (right) specimens. L = sample length, D = sample diameter, B = sample
thickness, a = crack depth, R = notch radius, A = notch depth, r = radial coordinate, z = axial coordinate, x = distance
from crack/notch tip [37].
Global strain is defined as:
Where uG is the global displacement (and so the measure of the gauge length after the test)
and D is the sample diameter.
Local strain is defined as:
Where: LL is the local reference length that must be small enough, compared with the notch.
dL has to be integrated throughout the loading process to obtain the local strain at any time.
At this point strain rates, local and global, can be obtained by time derivation. An interesting
parameter is now the ratio between the strain rates. In Figure 2.16 is identified the relationship
between these in function of G.

Background
25
Figure 2.16 – Relationship between the strain rates ratio and the global displacement for several notch shapes [37].
From the dimensional analysis is found that the strain rates ratio is dependent on: material
properties, geometry and level of loading.

Background
26
2.5 MYRRHA Structural Materials
2.5.1 T-91
T-91 is one of the candidate structural materials proposed to be used in MYRRHA. For that
reason it has been extensively tested in LBE environment to investigate its compatibility and
behavior in LBE. The gained knowledge from these investigations is ongoing to be used to
identify the possible LME effects in AISI 316L. The most extensively tested batch of the
material stems came from the EUROTRANS-DEMETRA project, inside which framework an
industrially sized batch of this material was produced. In Table 2 the chemical composition
(wt%) of this steel is given [38].
Composition DEMETRA [39] C 0.102 Si 0.235 Mn 0.401 P 0.019 Cr 8.895 Mo 0.889 Ni 0.121 N 0.048 Fe balance
Table 2 – Composition of the austenitic AISI 316L stainless steel provided in the FP Demetra [38].
2.5.1.1 Microstructure and heat treatment
The produced T-91 f/m steel is generally receiving two-stage heat treatment: the
normalization (heating up to austenite phase, also called austenitization, in the field 1040 °C-
1090 °C with subsequent fast cooling to room temperature so to form a complete martensitic
phase) and the tempering (in the range 730 °C-795 °C for 1 hour with subsequent cooling in
air to room temperature). Such a heat treatment forms a martensitic structure, which upon
tempering is transformed into a very fine ferrite. Due to precipitation of carbides (V and Nb),
a secondary hardening effect is obtained during tempering. These precipitates contribute also
to grain size control, of both the ferrite and the austenite.
The DEMETRA steel was provided as 15 mm thick plate, normalized at 1050 °C for 15
minutes (1 minute per millimeter of thickness according to the ASTM requirements) and
water-cooled to room temperature in order to produce a purely martensitic structure; this
treatment was followed by a tempering at 770 °C for 45 minutes (3 minutes per millimeter of
thickness according to the ASTM requirements), and then the cooling in still air to room
temperature.

Background
27
Figure 2.17 – Total martensitic microstructure in T91 [40].
2.5.1.2 Tensile behavior
In inert or air environment the T91 shows a normal tensile test behavior. When the specimen
is loaded to the UTS it starts to neck; at this stage, in normal environment, the micro-cavities
start to grow and coalesce, leading to ductile fracture. However, when the specimen is
affected by LBE environment, another tensile behavior can be found. After reaching the UTS,
cracks start to form on the sample surface, penetrating into the specimen. Anyway, as shown
in Figure 2.18, there are no sudden drops in mechanical properties, such as the yield stress or
the UTS.
Figure 2.18 – Various stress-strain curves for T91. LME effect is evidenced [41].
A typical fracture surface for a T91 tensile sample tested in LBE is shown in Figure 2.19.

Background
28
Figure 2.19 – SEM investigations on T91 tensile samples, tested in LBE, shows signs of LME . In A is visible an
overview of a fracture surface, in b) a detail out of a) and c) necking area of a tensile sample where the test was
interrupted before rupture [42].
The effects of LME are clearly visible on the fracture surface: cracks start from the surface
(Figure 2.19 A and C) and propagate inwards forming a quasi-cleavage surface (Figure 2.19
B). It is noticeable that the main affected parameter is the total elongation.
The ductility tough, which identifies the range of temperatures over which LME occurs and
gives a qualitative idea of its severity, is shown in Figure 2.20 for the T91. It can be seen that
the T91 suffers LME between 250°C and 450°C with a maximum effect around 400°C.
Figure 2.20 – Effect of LME on total elongation on T91 with temperature [8].
2.5.1.3 Fractography study of LME on T91
Figure 2.21 shows a comparison between T91 specimens tested in inert and in LBE
environment. Already in the overview pictures (Figure 2.21.a and Figure 2.21.Errore.

Background
29
L'origine riferimento non è stata trovata.c) a significant difference between the fracture
appearances appears evident.
Figure 2.21- T91 specimens. Figure a) and b) are related to a specimen tested in LBE. Figure c) and d) are related to a
specimen test in inert environment. All of the pictures are taken by use the scanning electron microscopy technique.
The magnifications are x40 for the figures a) x65 for the figure c) and x5500 for the figures b) and d).
A more detailed view of the fracture surfaces reveals further differences, which are obvious
by comparing Figure 2.21.b with Figure 2.21.d. The Reduction in Area is much lower in
Figure 2.21.a, where there are also zones indicating an attack started from the extern. These
zones appear at high magnification, in Figure 2.21.b), with a quasi-cleavage structure. This,
according to literature, is a clear indication of the LME occurrence. The central part of the
specimen tested in LBE remained ductile, assuming the shape that is also valid for the
specimen tested in inert environment and that is shown in Figure 2.21.d). It can be concluded
that for the T91, the SEM analysis revealed a marked difference between fracture surface of
the specimens tested in inert or in LBE environment. This is mostly evidenced by the
appearance of quasi-cleavage areas and by a reduced area reduction in the specimen tested in
LBE.

Background
30
2.5.2 Austenitic Stainless Steels (AISI316L)
2.5.2.1 Microstructure and Constitution
The general chemical composition of the considered austenitic stainless steel is reported in
Table 3.
Composition DEMETRA [39] C 0.16 Si 0.641 Mn 1.84 P 0.026 Cr 16.822 Mo 2.086 Ni 10.170 N 0.025 Fe balance
Table 3 – Chemical composition of AISI 316L [38].
The major alloying elements of an austenitic SS are typically Fe, Cr, and Ni:
- Iron: below its melting point (1536°C) has three allotropes, as indicated in Table 4.
Temperature range (°C) Symbol Crystal structure
1536-1392 -Fe Body centred cubic (bcc)
1392-911 -Fe Face centred cubic (fcc)
911-and below -Fe Body centred cubic (bcc)
Table 4 – Allotropes of Iron [43].
- Chromium: is bcc below its melting point (1900°C) and can form continuous solutions
with the iron (over 1000°C) (').
- Nickel: is fcc below its melting temperature (1453°C). Solid solutions in nickel are
continuous with solid solution in fcc iron.
This ternary Fe-Cr-Ni system presents four phases [44]:
- fcc based on -Fe and Ni.
- bcc based on -Fe.
- bcc based on Cr.
- phase, subsequently termed .

Background
31
Figure 2.22 – Dashed lines are related to a steel with 2% of Mo; solid lines on the other to a steel with 3% of Mo [45]
Ferrite-forming elements are: Mo, Ti, Si and Nb. The relative tendency to form ferrite is given
in the Table 5.
Element Thidemann Newell and Fleischmann Binder et al.
C -40 -30 -23
N -20
Ni -3 -1 -0.8
Mn -2
Ti +7,2
Si +5,2
Nb +4,5
Mo +4,2 +2 x Cr +1,4
Cr +1 +1,0
Table 5 – Relative tendency of elements to form -Ferrite from various authors [45].
The addition of Ti, Si, Mo, Nb to steels, as the use of "L" (low Carbon) grade steels, allows to
enhance the formation of -Fe. If a total austenitic steel is required Ni must be added to
ensure a fully austenitic phase. Usually austenitic steels 300 series are fully austenitic.

Background
32
2.5.2.2 Short-term mechanical properties (tensile properties)
Relationship between the compositional and micro-structural parameters and the tensile
properties has been found [46, 47]:
Where: -ferrite is the percentage of -ferrite, d is the mean linear intercept of the grain
diameter (mm), t is the twin spacing (mm), the brackets indicate the concentration expressed
in weight percent. No relations are given for the reduction of area during the tensile test
because the effect of the alloying elements is not linear. The twin spaces does not affect the
yield stress because the stacking fault energy, which controls the work-hardening rate, has no
effect at the low strains concerning the yield stress [47]. Generally a small 't' is a natural
consequence of a low stacking fault energy [48]. On the other hand the twin space is more
important for the tensile strength than the grain size, because the effect of the stacking fault
energy is quite significant on the work-hardening rate. -ferrite increases the yield stress and
the tensile strength values by a dispersion-strengthening effect. As solutes, C and N have the
greater strengthening effects [48, 47].
Figure 2.23– Effect of solid-solution hardening in austenite [49, 48, 47].
Among the solid-solution strengthener nitrogen is the most powerful; it has in fact a more
potent action and less detrimental effects on intergranular corrosion than carbon [50]. If

Background
33
dissolved in big amount nitrogen can cause problems concerning ingot porosity. To dissolve
high nitrogen contents a substitution in steel alloys elements is required, in particular some
Mn should replace some Ni. This can be seen in the Table 5.
Type 316 Type HP 316
Mn 1.8 2.0
Ni 12 11.5
N2 0.03 0.2
Tensile Strength (MPa) 571 695
Yield Stress (MPa) 247 350
Elongation (%) 50 45
Table 5 – Differences due to the increased presence of nitrogen [47].
In duplex austenite--ferrite steels an increased amount of -ferrite is found. This leads to an
increase in the tensile strength and yield stress. A further advantage in the increased level of
ferrite is that it causes grain refinement of the austenite phase, which produces additional
strengthening. These effects are further improved by refining the grain size by a controlled-
rolling treatment at 900-950 °C. Besides the increase in the mechanical properties (the Yield
Strength may reach 450 MPa), other advantages of using duplex steels are: super-plastic
behavior at very low strain rate, improvement in formability, and a better resistance to the
stress corrosion cracking.
The type of heat treatment or working (i.e. cold working), to which the steel is subjected,
affects the tensile properties. In [51] the tensile properties of type 316 in the temperature
range 20-650 °C at an initial strain rate of 2x10⁻³ m/min are examined. They concluded:
- 13% tensile cold work increases the yield stress by a factor three (Recovered after
stress relief treatment of 16 h at 800 °C).
- Initial strain hardening is almost independent of temperature and can be recovered.
- Stress relief heat treatment and pre-ageing for 6000 h at 750 °C produced little
changes in tensile strengths but relevant changes in the fracture process and in
ductility.
- Cold work materials exhibited sharp decreases in reduction of area values as the test
temperature increased from 540° to 625 °C, that has been related with the onset of
high-temperature grain-boundary decohesion processes. From 625 °C the situation is

Background
34
reversed and the phenomenon avoided, this was attributed to the presence of grain
boundary precipitates.
Figure 2.24– Tensile properties of AISI 316 at different temperatures [52] [53].
- Pre-ageing at 750 °C for up to 6000 h produces changes in fracture behavior at 540 °C
similar to those caused by the stress relief heat treatment.
The strain rate influences the tensile properties as well. On type AISI 316 [54, 55] has
been noted a significant drop at the elevate temperature of the ductility as the strain rate
decreases below the critical rate of 10-5/10-6.

Background
35
Figure 2.25 – Ductility of type 316 steel as a function of strain rate. Temperature range 593°-650 °C [55, 54].
Obviously also the presence of environmental interactions can influence the tensile properties
of stainless steel. The effects can be divided in two main categories:
- Near-surface effects;
- Bulk effects: irradiation and hydrogen embrittlement.
Among the near-surface effects can be mentioned the carburization, the stress corrosion and
the surface embrittlement.

Experimental
36
3. Experimental
3.1 Specimens, DEMETRA Projects
DEMETRA- Design of Mechanical Transmissions: Efficiency, Noise and Durability
Optimization)- project has the objective to assess the design and the feasibility of an
industrial ADS prototype dedicated to transmutation.
Figure 3.1– Structure of EUROTRANS and position of DEMETRA within the project [56].
The DM4 of DEMETRA project for the Development and assessment of structural materials
and heavy liquid Metal technologies for TRAnsmutation system, has the following objectives:
vii. Studies the behavior of reference structural materials in HLM and under irradiation.
These reference materials are the 9Cr f/m steel T91 and the austenitic steel AISI 316L.
viii. Thermal-hydraulics quantifications.
ix. HLM instrumentation and system operation technologies (impurities monitoring and
removal methods, oxygen sensor, etc.).
x. Assessment of the operational performance of the MEGAPIE.
In the framework of the project the materials were/are distributed throughout all the members
by Industeel. This guarantees that all the members work with the same steel and improve the

Experimental
37
reproducibility of the results (benchmark). The specimens of a bunch are obtained by the
same plate and must be definitely identified on the basis of their origin point on the plate. In
Figure 3.2 the cutting scheme of the AISI316L Demetra plate is shown. The extraction area is
marked with dashed blue ellipses.
Figure 3.2 – Cutting scheme of the DEMETRA plate.
The specimens used in this study have cylindrical shape with a total length (L) of 24 mm, a
gauge length (A) of 12 mm and a diameter (D) of 2.4 mm.
Figure 3.3 – Cylindrical specimen and its dimensions.
Because the specimen dimensions are input parameters for the tensile test and can
significantly influence the results, a precise measurement of these dimensions is crucial. The

Experimental
38
measurement of the specimen's dimension was carried out with an indirect method by using a
Mitutoyo profilometer where the shadow of the specimen was projected on a screen and then
measured by high resolution dial gages. The entire length of the specimen was measured only
one time (because it is no input parameter), the gauge length three time (one per side and
central) and the diameter three times too (right, center and left-side). For the diameter and
gauge length the mean value was calculated and used as input parameter.
Figure 3.4 – Mitutoyo profilometer which was used to measure the tensile sample dimensions.
3.2 Limets 1
Limets 1 is a tensile test machine custom made for testing samples in controlled inert and
LBE environment. From the schematic in Figure 3.5, it can be seen that Limets 1 is a test
machine composed by three main tanks. The Melting tank was used to melt the LBE the first
time when Limets 1 was started. Usually it is not kept at elevated temperature since it is
empty. It is connected to the Dump tank which is constantly kept at 300 °C because it
contains the LBE during the tests period . It is provided with a safety valve that may discharge
the LBE in the external environment. By means of different valves (V14, V15 and V16) the
Dump tank is connected to the Autoclave, where tests effectively take place. The three tanks

Experimental
39
are connected to a gas supply system which allows for providing different gas mixtures (Ar
and Ar+5%H2) in order to adjust the oxygen concentration in the LBE cylinders. All the tanks
and the piping system are thermally insulated; temperature, pressure and LBE level are also
suitable controlled. A thorough description of the system can also be found in [57].
3.2.1 Limets 1: operational procedure
Starting from the specimen load condition, the specimen was mounted into the holders by
means of two washers screwed at the two end sides of the specimen itself (Errore.
L'origine riferimento non è stata trovata. c). One of the washers can be completely
screwed while the second must be initially fixed only at the first thread in order to ensure the
possibility of entering the sample into the holders. Once the specimen is in position, the
second washer is screwed by using two tweezers until it is completely fixed (Errore.
L'origine riferimento non è stata trovata. d). Once the washers are completely screwed a
force of 100 N was applied by means of a PI force controller. During the movement of the
holder it is possible to try to move the specimen inside the holders, using tweezers so to
avoid jamming of the washers on some edge of the holders, since it would falsify the test.
Before closing the autoclave a thermocouple is posed as close as possible to the specimen
and the LBE-level sensor is tested. For vacuum tight sealing a copper ring is positioned on
the lower part of the autoclave closure (Errore. L'origine riferimento non è stata trovata.
e).

Experimental
40
Figure 3.5 – Limets 1 engineering scheme.

Experimental
41
Figure 3.6 – a) Overview of Limets 1 showing the autoclave (AT) and the dump tank (DT). b) Cleaning operations are
performed. c) Specimen setting before entering the holders. d) Fixing the specimen by mean of tweezers. e) Copper
ring as a seal.
The autoclave is then closed. A definite technique for bolts screwing is required in order to
ensure a homogeneous pressing of the Cu ring and to ensure a vacuum tight sealing.
The bolts are fastened by means of a dynamometrical wrench set to 50 N, using a cross-
scheme. A new record file can now be started on the SSRT software, paying attention to
correctly classify the test. After the Pfeiffer vacuum pump is started and vacuum reached the
usual value of 7.5·10-2 mbar, a purging procedure of evacuating after successive fillings with
Ar-H2 must be performed. At the last filling of Ar-H2 the outlet (V9) is opened. After the
purging procedure, the temperature is set to 354°C (2 hours). Once this temperature is reached
the outlet of the DT (V10) is closed until the pressure, indicated on the PE4, reaches 1.3-1.4
bar, subsequently the two valves V14 and V16 are opened. The LBE will start to flow from
the DT to the AT. It is a very delicate operation that lasts generally 3 - 5 minutes. Attention
must be paid to the light of the level sensor in order to avoid a "solid autoclave" situation. It
lights up when the LBE reached the sensor. As soon as the light is stable the valves V14 and
V16 are closed almost together, to avoid the failure in closure of one of the two.

Experimental
42
Figure 3.7 – a) Qsymmetry in the autoclave closure, the gap on the left side is more marked than in the right side. b)
Valves system on the piping dedicated to the LBE transfer. c) Checking valves. d) Level indicator brightening, the AT
is full.
Once the temperature and the oxygen concentration record file is started, the next step is to
increase/decrease the temperature to the desired exposure/test temperature by means of the
TIC1. Pre-exposure requires at least 20 hours at 450 °C to guarantee the intimate contact of
the steel and the LBE. After pre-exposure the test is preceded by a cyclic loading on the
specimen in order to remove the backlash stemming from the thread of the samples and the
load line. The test must be implemented by setting the dimensions, the strain rate, the data-log
interval and the safety value for stress and displacement. Once it is started, the test can last
from 5-10 minutes (5·10-3 m/s) to 10 days (5·10-7 m/s). After the test is finished the
temperature must be reduced/increased until 330 °C to transfer the LBE from the AT to the
DT. The latter process can be quite long (20-40 minutes). It is performed by increasing the
pressure in the autoclave up to 1.3 bar. Once the LBE is transferred, the heaters H1, H4, H5,
H7 are switched off and it is stopped the acquisition of SSRT and of the temperature/oxygen
concentration. The cooling down might last from 4.5 to 6 hours.

Experimental
43
3.3 Specimens cleaning
Because samples exposed to LBE are typically covered with LBE (Figure 3.8) they had to be
cleaned in order to allow to investigate fracture surfaces.
Figure 3.8 – Specimen covered by LBE.
Therefore, one half of each broken sample, which woould be examined at the SEM, was
cleaned from LBE deposits on its surface by using a chemical cleaning procedure. The
cleaning process consists of submerging the sample in a solution of acetic acid, H2O2 and
ethanol in proportion 1:1:1, for about 2 hours.
It was used 10 ml of solution in a 50 ml beaker. The start and end of this cleaning process is
characterized by the forming and extinguishing of bubbling.
Figure 3.9 – Broken specimen during cleaning bath
Experimental
44
3.4 Metallography
3.2.2 Metallography
Metallography is the study of the microstructure of metallic alloys. The knowledge of the
microstructure of a metal is important since it strongly affects many macroscopic properties of
metallic materials (tensile strength, elongation, thermal and electrical resistivity, etc.). The
basic steps for a proper metallographic examination include: sampling, specimen preparation,
microscopic observation, digital imaging and documentation and quantitative data extraction
through image analysis methods.
3.2.3 Light microscopy
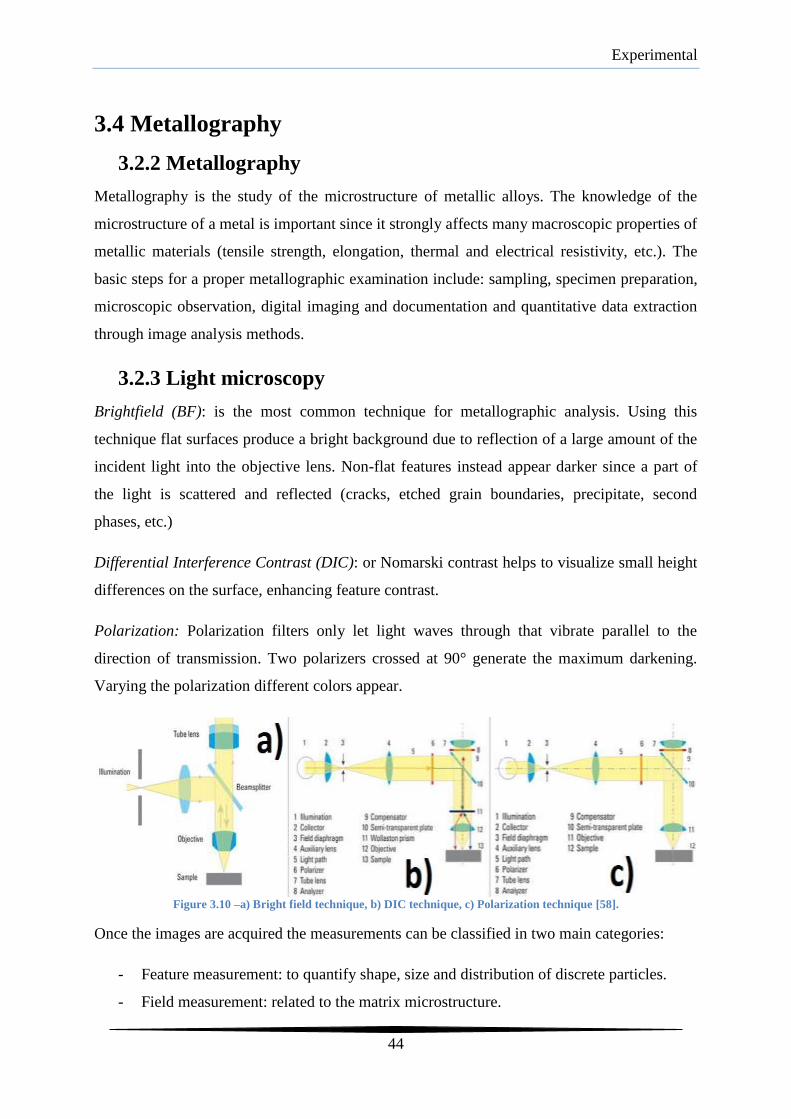
Brightfield (BF): is the most common technique for metallographic analysis. Using this
technique flat surfaces produce a bright background due to reflection of a large amount of the
incident light into the objective lens. Non-flat features instead appear darker since a part of
the light is scattered and reflected (cracks, etched grain boundaries, precipitate, second
phases, etc.)
Differential Interference Contrast (DIC): or Nomarski contrast helps to visualize small height
differences on the surface, enhancing feature contrast.
Polarization: Polarization filters only let light waves through that vibrate parallel to the
direction of transmission. Two polarizers crossed at 90° generate the maximum darkening.
Varying the polarization different colors appear.
Figure 3.10 –a) Bright field technique, b) DIC technique, c) Polarization technique [58].
Once the images are acquired the measurements can be classified in two main categories:
- Feature measurement: to quantify shape, size and distribution of discrete particles.
- Field measurement: related to the matrix microstructure.
Experimental
45
3.2.4 Specimens preparation for metallography
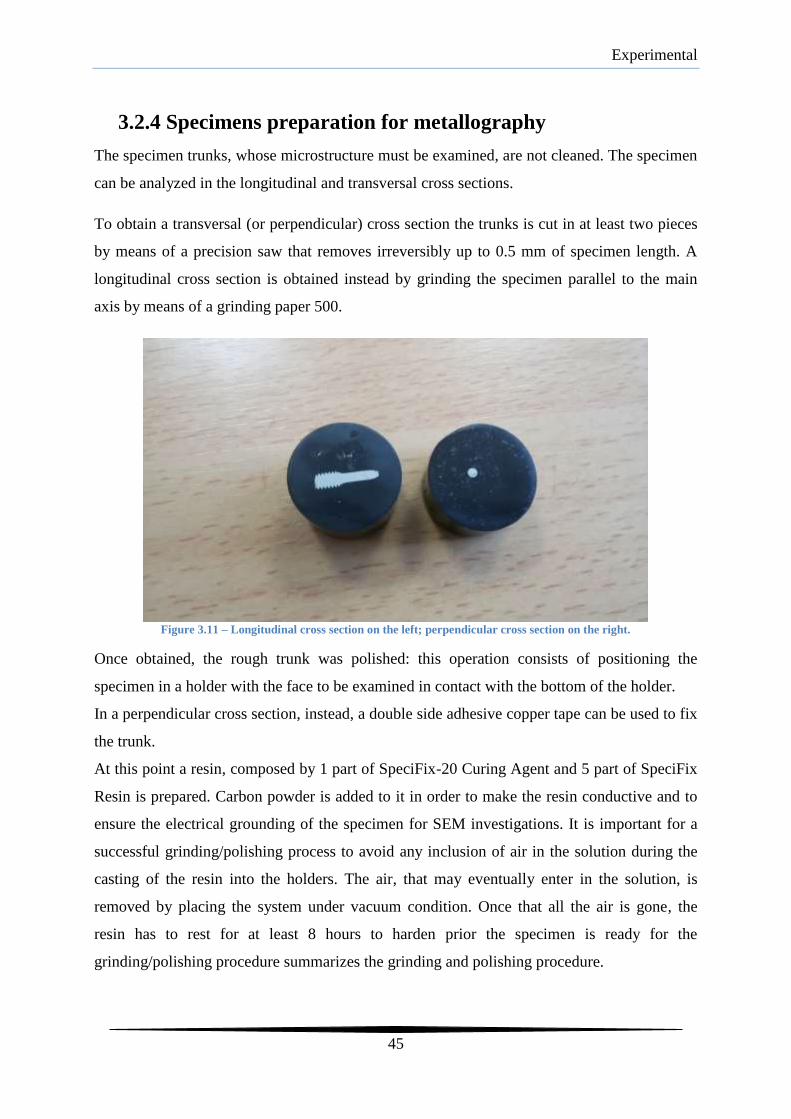
The specimen trunks, whose microstructure must be examined, are not cleaned. The specimen
can be analyzed in the longitudinal and transversal cross sections.
To obtain a transversal (or perpendicular) cross section the trunks is cut in at least two pieces
by means of a precision saw that removes irreversibly up to 0.5 mm of specimen length. A
longitudinal cross section is obtained instead by grinding the specimen parallel to the main
axis by means of a grinding paper 500.
Figure 3.11 – Longitudinal cross section on the left; perpendicular cross section on the right.
Once obtained, the rough trunk was polished: this operation consists of positioning the
specimen in a holder with the face to be examined in contact with the bottom of the holder.
In a perpendicular cross section, instead, a double side adhesive copper tape can be used to fix
the trunk.
At this point a resin, composed by 1 part of SpeciFix-20 Curing Agent and 5 part of SpeciFix
Resin is prepared. Carbon powder is added to it in order to make the resin conductive and to
ensure the electrical grounding of the specimen for SEM investigations. It is important for a
successful grinding/polishing process to avoid any inclusion of air in the solution during the
casting of the resin into the holders. The air, that may eventually enter in the solution, is
removed by placing the system under vacuum condition. Once that all the air is gone, the
resin has to rest for at least 8 hours to harden prior the specimen is ready for the
grinding/polishing procedure summarizes the grinding and polishing procedure.

Experimental
46
Grinding (grain size)
P500 3 minutes, 10 N, 150 rpm.
P800 3 minutes, 10 N, 150 rpm
P1200 3 minutes, 10 N, 150 rpm
P4000 3 minutes, 10 N, 300 rpm
Polishing
3 µm Until the surface is free from major scratches
1 µm OPS Until the surface is free from minor scratches
The free surface from scratches is then examined at the optical microscope or at the SEM.
To examine the microstructure, the surface has to be treated with an OPS etching solution and
polished with a proper plate for a short time (30 sec., generally). When using the SEM, it is
suggested also to use copper adhesive tape surrounding the specimen in order to avoid the
accumulation of electrostatic charge on the resin that could disturb the signal.
Figure 3.12 – Copper tape around the specimen in order to avoid charging due to accumulation of electrons on the
resin surface.
3.5 Fractography
When a metal fractures the crack interacts with the microstructural elements in specific ways
which depend on the stress, strain, strain rate, temperature and environmental condition which
existed at the time of failure. The examination and analysis of the fracture surface topography
is called fractography. By analyzing the fracture surface, the type of fracture (brittle, ductile
etc.) can be identified.

Experimental
47
3.4.1 Scanning Electron Microscopy
Scanning electron microscopy is a powerful method for analyzing and characterizing fracture
surfaces. It has been widely used in the experimental investigations carried out. The main
functions are explained in the following.
3.4.1.1 Principles
The SEM is an electron microscope that produces images of a sample by scanning it with a
focused beam of electrons. These, interacting with the sample's material, release various
signals:
xi. Secondary Electrons: emitted by atoms excited over the ionization energy by the
electron beam.
xii. Backscattered Electrons: they are reflected by the samples surface after an elastic
scattering.
xiii. Characteristic X-Ray: is emitted when an electron returns to its previous energetic
state in the inner shell of the atom following an excitation due to the primary electron
impact.
xiv. Others like sample current, etc.
Today the SEM can have a resolution limit lower than 1 nm. It is a very important tool since
its large depth of focus allows an imaging that appears as 3D. Moreover, since the electrons
are scattered in dependence of their Z (atomic number), a SEM can also provide information
on elemental distributions in the specimen. Finally, X-rays are characteristics for each
element. Therefore, compositions and amounts of a certain element at a certain point in the
sample can be measured. Because an electron beam is used it is generally necessary that the
specimens are electrically conductive, at least at the surface, and electrically grounded.
The electron beam is typically emitted from a (tungsten) filament; V-shaped at the tip with a
radius in the order of µm. Other emitters are single crystal of LaB6. The beam has generally
0.2 - 40 keV. The beam is focused by one or two condenser lenses and the pass through pairs
of the deflector plates in the electron column. Finally it passes through the final lens, which
deflect the beam in the x and y axes so that it scans in a raster fashion over a rectangular area
of the sample surface. After the various interactions and the collection of the signals, a range
of electronic amplifiers are used. The signal is so transmuted in a variation in brightness on a

Experimental
48
computer monitor. The magnification (from 10 to 100000 times) results from the ratio of the
dimensions of the raster on the specimen and on the display device.
Figure 3.13 – SEM layout.
The typical signals used in SEM investigations are secondary electrons, back scatter electrons
and x-ray diffraction.They are originated within few nanometers from the sample surface And
are detected by the ETD, that is substantially a scintillator-photomultiplier system. The
electrons are collected by attracting them toward an electrically biased grid at about 400 V.
Then they are accelerated to 2000 V. At the correspondent energy the electrons are
sufficiently energetic to cause the scintillator to emit flashes of light, which are conducted to a
photomultiplier. The amplified signal is presented as a 2D intensity distribution that can be
viewed on a display and photographed. The brightness of the image depends on the number of
electrons that reach the detector. Backscattered electrons are reflected or backscattered.
Dedicated detectors are positioned above the sample in a doughnut type arrangement,
concentric with the electron beam. This configuration maximizes the solid angle of collection.
These detectors are generally scintillators. When the electrons impinge on the sample also
Bremsstrahlung and characteristic radiation is emitted from the sample. By analyzing this
radiation it is possible to analyze the chemical composition of the samples. Using an electrons
beam it is generally necessary that the specimens are electrically conductive, at least at the
surface, and electrically grounded.

Results
49
4. Results
Since the main aim of this work, as already indicated, is to investigate the effect of the LBE
on the tensile behavior of AISI316L SS, tensile tests in LBE at different temperatures and
strain rates have been conducted at SCK•CEN laboratory and complemented by reference
tests in inert or air environment. A summary of the these tests on specimens, coming from two
batches (L631 and L4-1-T) of the Demetra plate (see Figure 3.2), is given in Table 7.
Based on [15], a wide range of conditions has considered, even if, those most intensively
considered are 350 °C and 5·10-5 s-1. Complementary to the mechanical tensile tests,
fractography on the broken samples as well as basic microstructural investigations was carried
out. In this chapter the results of these investigations will be described and discussed.
3.3 Microstructure
In order to investigate the microstructure of the tested AISI316L material, several tested
tensile samples were investigated by optical light microscopy.
From the microstructural analysis it was found that within the austenitic matrix a second
phase is present.
To analyze the nature of this phase optical microscopy, scanning electron microscopy and
electron dispersive x-ray micro analysis (EDX) were used.
It has an elongated shape oriented parallel to the main axis of the tensile specimens,
corresponding to the rolling direction of the AISI316L-Demetra plate (an example is shown in
Figure 0.1). For both L631 and L4-1-T batches of tensile samples a similar amount of this
second phase was identified.

Results
50
Figure 0.1– Scanning electron microscopy (a) and optical microscopy (b) individuating the second phase.
The amount of this phase was evaluated by measuring the relative fraction of area occupied
by the second phase using optical light microscope pictures: a fraction of 3-5% was estimated.
In further consequence, EDX was used to qualitatively analyze the chemical composition of
this second phase. The results are represented in Figure 0.2
Figure 0.2 – EDX-line profile across two stringers of the second phase chemical composition. The second phase is
individuated.
The measurement reveals a depletion of nickel and an enrichment of Cr and Mo in the second
phase (Figure 0.2 – EDX-line profile across two stringers of the second phase chemical
composition. The second phase is individuated.).

Results
51
Figure 0.3 - Price and Andrew Diagram (a) and Delong Diagram (b) for the determination of the -ferrite content. X-
axis: chromium equivalent; Y-axis: nickel.
Errore. L'origine riferimento non è stata trovata. shows diagrams from Delong and Price
and Andrews taht are typically used to estimate the occurrence and fractions of phases in
steels. In these graphs, the chemical composition of the steel is converted into a chromium
and nickel equivalent. The nickel (and its equivalents) stabilizes the austenitic matrix, while
higher chromium or molybdenum content enhances the formation of the ferrite phase.
Calculating the equivalents for investigated AISI316L material, there are:
- For the Price & Andrew diagram: Ni eq: 11.71, Cr eq: 22.917.

Results
52
- For the Delong diagram: Ni eq: 12.32, Cr eq: 19.869.
These values are represented with red point into the graphs of Figure 0.3 .From the curves
represented in Figure 0.3 a -ferrite content of 2% and 7% may be estimated.
Combining the information from OM, SEM and EDX and considering the predictions of Price
and Andrews and Delong it can be assumed that the found second phase is -ferrite.
3.4 Tensile Tests – Stress-Strain curves
In the frame of the current work 32 tensile tests were performed under various different
conditions. The experimental campaign included tests in LBE, in air and in ArH2
environment at testing temperatures ranging from 200 °C to 450 °C and strain rates from
5·10-3 to 5·10-7 s-1.
Table 7 gives an overview of the tensile tests executed; the table raws highlighted in yellow
represent the data of previous tests re-analyzed and compared to the current data.
Sample ID Material Setup Temp (°C)
Strain Rate (s-1)
Envir.
L631-142 AISI316L Limets 1 350 5.00E-03 LBE
L631-143 AISI316L Limets 1 350 5.00E-04 LBE
L631-144 AISI316L Limets 1 350 5.00E-05 LBE
L631-145 AISI316L Limets 1 350 5.00E-07 LBE
L631-146 AISI316L Limets 1 350 5.00E-03 LBE
L631-147 AISI316L Limets 1 350 5.00E-05 LBE
L631-148 AISI316L Limets 1 350 5.00E-04 LBE
L631-149 AISI316L Limets 1 350 5.00E-06 LBE
L631-151 AISI316L Limets 1 350 5.00E-05 LBE
L631-152 AISI316L Limets 1 350 5.00E-06 LBE
L631-153 AISI316L Limets 1 450 5.00E-05 LBE
L631-154 AISI316L Limets 1 350 5.00E-06 LBE
L631-155 AISI316L Limets 1 450 5.00E-06 LBE
L631-104 AISI316L Limets 1 350 5.00E-05 Argon
L4-1-T1 AISI316L Instron 350 5.00E-04 Inert
L4-1-T2 AISI316L Instron 350 5.00E-05 Inert
L4-1-T3 AISI316L Instron 350 5.00E-05 Inert
L4-1-T4 AISI316L Instron 200 5.00E-05 Inert
L4-1-T5 AISI316L Limets 1 350 5.00E-04 LBE
L4-1-T6 AISI316L Limets 1 200 5.00E-05 LBE
L4-1-T7 AISI316L Limets 1 200 5.00E-06 LBE
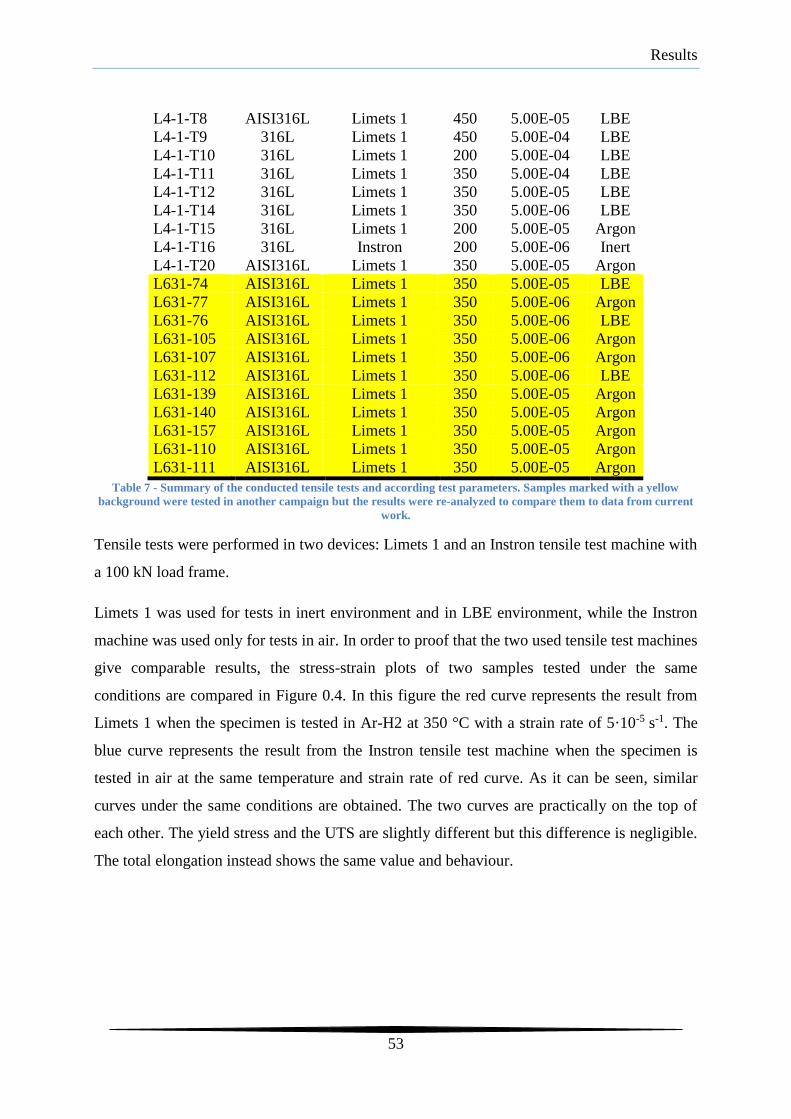
Results
53
L4-1-T8 AISI316L Limets 1 450 5.00E-05 LBE
L4-1-T9 316L Limets 1 450 5.00E-04 LBE
L4-1-T10 316L Limets 1 200 5.00E-04 LBE
L4-1-T11 316L Limets 1 350 5.00E-04 LBE
L4-1-T12 316L Limets 1 350 5.00E-05 LBE
L4-1-T14 316L Limets 1 350 5.00E-06 LBE
L4-1-T15 316L Limets 1 200 5.00E-05 Argon
L4-1-T16 316L Instron 200 5.00E-06 Inert
L4-1-T20 AISI316L Limets 1 350 5.00E-05 Argon
L631-74 AISI316L Limets 1 350 5.00E-05 LBE
L631-77 AISI316L Limets 1 350 5.00E-06 Argon
L631-76 AISI316L Limets 1 350 5.00E-06 LBE
L631-105 AISI316L Limets 1 350 5.00E-06 Argon
L631-107 AISI316L Limets 1 350 5.00E-06 Argon
L631-112 AISI316L Limets 1 350 5.00E-06 LBE
L631-139 AISI316L Limets 1 350 5.00E-05 Argon
L631-140 AISI316L Limets 1 350 5.00E-05 Argon
L631-157 AISI316L Limets 1 350 5.00E-05 Argon
L631-110 AISI316L Limets 1 350 5.00E-05 Argon
L631-111 AISI316L Limets 1 350 5.00E-05 Argon
Table 7 - Summary of the conducted tensile tests and according test parameters. Samples marked with a yellow
background were tested in another campaign but the results were re-analyzed to compare them to data from current
work.
Tensile tests were performed in two devices: Limets 1 and an Instron tensile test machine with
a 100 kN load frame.
Limets 1 was used for tests in inert environment and in LBE environment, while the Instron
machine was used only for tests in air. In order to proof that the two used tensile test machines
give comparable results, the stress-strain plots of two samples tested under the same
conditions are compared in Figure 0.4. In this figure the red curve represents the result from
Limets 1 when the specimen is tested in Ar-H2 at 350 °C with a strain rate of 5·10-5 s-1. The
blue curve represents the result from the Instron tensile test machine when the specimen is
tested in air at the same temperature and strain rate of red curve. As it can be seen, similar
curves under the same conditions are obtained. The two curves are practically on the top of
each other. The yield stress and the UTS are slightly different but this difference is negligible.
The total elongation instead shows the same value and behaviour.

Results
54
Figure 0.4 - Comparison of stress strain graphs for tensile tests conducted on different tensile test machines.
The main tensile parameters analyzed are: Total Elongation (TE), Uniform Elongation (UE),
Ultimate Tensile Strength (UTS), Yield Strength (YS) and Area Reduction (AR).
In Figure 4.5 the stress-strain curves for both batches tested in inert environment are reported.
The blue curves represent the L631 batch. The red curves represent the L4-1-T batch. The
measured Ultimate Tensile Strength and Yield Strength reached values from 380 MPa to
460 MPa and from 190 MPa to 250 MPa respectively. The measured values for the total
elongation and Uniform Elongation reached values from 0.34 to 0.43 and 0.23 to 0.35
respectively. It can be seen that a significant scatter in TE is present.
It can be also noticed that the TE values differ of 7% in absolute values which is about 22% in
relative values with respect to the maximum TE recorded. A certain scatter is also present for
the yield stress (15% relative to the maximum Yield Strength) and in the Uniform Elongation
(22% relative to the measured maximum value) while the UTS does not show such a big
scatter. It can also be observed that the curves from batch L4-1-T seem to exhibit higher
values for TE and lower Yield Strength, while the Ultimate Tensile Strength seems to be not
affected. Due to the lack of data regarding this batch it is not possible to accurately estimate
the scatter; an explanation may rely on the fact that specimens from the L4-1-T batch show a
similar scatter like the L631 batch specimens.

Results
55
Figure 0.5 - Stress-strain curves for tests in inert environment with a set of conditions of 350°C with a strain rate of
5·10-5 s-1.
Figure 0.6 shows the stress-strain curves for L631 samples tested in different environments at
350°C with a strain rate of 5·10-5 s-1. The red curves represent the tests performed in inert
environment (Ar-H2), as already presented in Figure 0.6. The blue curves identify tests
performed in LBE environment after a pre-exposure of at least 20 hours.
Figure 0.6 - Stress-strain curves for tests in inert environment and in LBE with a set of conditions of 350°C with a
strain rate of 5·10-5 s-1. Only L631 samples are considered. Arrows indicate tests not performed but re-analyzed
during this study.
Figure 0.6 shows that the Total Elongation reaches values between 0.35 and 0.40 for the tests
in LBE environment while a Total Elongation of 0.34-0.41 can be observed for tests in ArH2
environment. In ArH2 the measured values for UTS range from 430 MPa to 460 MPa while
the YS shows values of 180 MPa to 220 MPa. In LBE theses values are 445 MPa to 455 MPa

Results
56
for UTS and 210 MPa to 250 MPa for YS. The measured values for Uniform Elongation
range from 0.25-0.34 in ArH2 and 0.29 to 0.34 in LBE.
A similar behavior was also found analysing the samples tested at 350°C with a strain rate of
5·10-6 s-1. In Figure 0.7 the stress-strain curves for tests performed in both LBE and inert
environment are reported.
Figure 0.7- Stress-strain curves for tests in inert environment and in LBE with a set of conditions of 350°C with a
strain rate of 5·10-6 s-1. Only L631 samples are considered. Arrows indicate test not performed during this study but
which were re-analyzed to compare to current data.
Red curves represent tests performed in inert environment while the blue ones are related to
tests in LBE environment. The measured Total Elongation ranges from 0.36 to 0.42 and the
Uniform Elongation reaches values from 0.29 to 0.34. YS; UTS instaed values from 170 MPa
to 250 MPa and 445 MPa to 475 MPa respectively. From Figure 0.8 to Figure 0.10 other tests
results considering various strain rates and temperatures are visible.
Figure 0.8 shows the stress-strain curves obtained from tests performed at 350 °C. The graphs
report the stress-strain curves obtained at various strain rates (from 5·10-3 s-1 to 5·10-7 s-1) in
different environment and both batches. Red curves are related to the reference tests while the
continuous and blue lines are related to tests performed with a strain rate of 5·10-4 s-1. The
dashed blue lines are related to test performed at 5·10-5 s-1. Also the shortest test (5·10-7 s-1,
purple dashed curve) and the longest test (5·10-7 s-1, green curve) lasting 10 days are reported.

Results
57
Figure 0.8 – Stress-Strain curves for tests performed at 350 °C and at various strain rate.
In Figure 0.9 the stress-strain curves obtained from tests performed a 450 °C are visible.
These curves are obtained at various strain rates (from 5·10-4 s-1 to 5·10-6 s-1) in LBE. The red
curve is related to the test performed at 5·10-6 s-1, the dashed blue lines to tests performed at
5·10-5 s-1 and the purple curve represents a test performed at 5·10-4 s-1. The maximum
measured values for UTS, YS, TE and UE are respectively 480 MPa (5·10-7 s-1, LBE), 230
MPa (5·10-4 s-1, LBE), 0.44 (5·10-4 s-1, Air), 0.35 (5·10-6 s-1, Air).
Figure 0.9 - Stress-Strain curves for tests performed at 450 °C and at various strain rate.
In Figure 0.10 the stress-strain curves obtained from tests performed a 200 °C are reported.
The curves are obtained at various strain rates (from 5·10-4 s-1 to 5·10-6 s-1) in different

Results
58
environments. The red curves are related to the reference tests, while the purple line to a strain
rate of 5·10-4 s-1; the dashed blue lines refers to test performed at 5·10-5 s-1 and the green
curve to 5·10-6 s-1. The maximum measured values for UTS, YS, TE and UE are respectively
480 MPa (5·10-7 s-1, LBE), 230 MPa (5·10-4 s-1, LBE), 0.44 (5·10-4 s-1, Air), 0.35 (5·10-6 s-1,
Air).
Figure 0.10 - Stress-Strain curves for tests performed at 200 °C and at various strain rate.
all the data measured are summarized in Table 8.
Sample ID σ0.2 (MPa) σUTS (MPa) εunif (-) εtot (-)
L631-142 155.8 431.2 0.2176 0.3199
L631-143 191.1 439.7 0.2745 0.3675
L631-144 231.9 447.8 0.2699 0.3656
L631-145 196.6 491.9 0.3146 0.4061
L631-146 238 422.6 0.2275 0.3541
L631-147 236.7 451.3 0.2664 0.3504
L631-148 251.8 434.5 0.2458 0.3617
L631-149 249.2 479.7 0.3042 0.4033
L631-151 241.1 452.2 0.2767 0.3658
L631-152 215 452.2 0.2831 0.3693
L631-153 226.9 472.2 0.3297 0.4222
L631-154 235.6 467.6 0.2756 0.3783
L631-155 215.6 462.5 0.282 0.3766
L631-104 187.9 434.9 0.3105 0.4021
L4-1-T1 177.5 444.8 0.3356 0.4359
L4-1-T2 180.9 454 0.28651 0.41214
L4-1-T3 182.7 473.1 0.2981 0.4309
L4-1-T4 189.6 450.7 0.3286 0.4416
L4-1-T5 180.7 438.4 0.2772 0.4096
L4-1-T6 184.8 444.8 0.322 0.4401
L4-1-T7 188.9 456.6 0.3125 0.418
L4-1-T8 171.7 446.2 0.3251 0.4205
L4-1-T9 171.7 425.2 0.2889 0.4013

Results
59
L4-1-T10 217.5 454.3 0.3121 0.4297
L4-1-T11 188.7 437.8 0.2792 0.4023
L4-1-T12 182.1 453 0.3175 0.4204
L4-1-T14 181.3 448.2 0.30936 0.4135
L4-1-T15 210 442.9 0.2957 0.4103
L4-1-T16 180.2 461.3 0.3337 0.4487
L4-1-T20 185 446.5 0.3166 0.4154
L631-74 204.5 452 0.2954 0.4073
L631-77 201.9 472 0.3053 0.4053
L631-76 210 468.5 0.3242 0.416
L631-105 216.7 484.8 0.3071 0.4066
L631-107 217.8 475.6 0.2992 0.3809
L631-112 179.3 453.4 0.2914 0.3806
L631-139 196.6 447.8 0.2853 0.3895
L631-140 217.4 459.4 0.2819 0.3845
L631-157 203.7 458.5 0.2742 0.3799
L631-110 190.6 442.5 0.255 0.3543
L631-111 219.4 447.1 0.2306 0.3377
Table 8 – Summary of tested specimens results. In yellow are the tests which were not performed but re-analyzed
during this study in order to compare to the current results.
Additionally, some T91 specimens were tested in conditions indicated in Table 9; the results
obtained are reported also synthesized in this table: the Total Elongation is not reported
because it is an interrupted test. This last type of testing was used to find the first crack that
would appear on the external surface of the specimen.
Sample Material temp (°C) strain rate (s-1) envir. YS
(MPa) εtot εunif
UTS (MPa)
T5-1-67 T91 200 5.00E-05 LBE 527.6 0.1632 0.0419 628.7
T5-1-68 T91 200 5.00E-07 LBE 550.7 0.1103 0.0465 662
T5-1-69 T91 200 5.00E-05 LBE 506.1 0.1135 0.0415 607.9
T5-1-70 T91 250 5.00E-06 LBE 525.9 0.1441 0.0539 636.2
T5-1-71 T91 200 5.00E-05 LBE 530.3 0.1603 0.0435 641.2
T5-1-72 T91 350 5.00E-05 LBE 512.9 0.0373 615.6
T5-1-73 T91 350 5.00E-05 LBE 512.4 0.0328 595.8
Table 9 – Summary of tested T91 specimens results and test conditions.

Results
60
3.5 SEM – Fractography
The fracture surfaces of T91 tensile samples tested in LBE (data provided from another study
showing clear signs of LME) and ArH2 (ductile behavior) were investigated in order to have a
comparison model to evaluate the fracture surfaces of AISI316L (see section 2.5.1.3). In case
of LME the presence of quasi-cleavage fracture (or signs of brittle fracture) in the external
part of the fracture surface was expected. Indeed, according to the definition given by Kamdar
in [7], LME is a special case of brittle fracture. Therefore, the difference between the fracture
surfaces of the specimens tested in LBE and the fracture surfaces of those tested in inert
environment has been investigated.
Figure 0.11 shows two representative fracture surfaces of specimens from the L631 batch
tested at 350°C and 5·10-5 s-1 tested in Argon-Hydrogen environment (pictures a, b, and c)
and in LBE environment (pictures d, e and f). In Figure 0.11 a and Figure 0.11 d is visible the
absence of quasi cleavage fracture surfaces instead noticed in T91 (by comparing it to Figure
2.21).
By analyzing in more detail the surfaces of the specimens tested in LBE and in inert
environment (Figure 0.11 b and Figure 0.11 e) a thorough ductile structure can be found. In
both two cases is visible at least one zone where dimples originated by void coalescence
change in structure and where they are elongated (Figure 0.11 c and Figure 0.11 f). These
zone, called shear slips, originated from shear stresses and are formed by slip of atom planes.
These zones, common to both the environmental situations, are not an evidence of brittle
fracture; by comparing Figure 0.11 c and Figure 0.11 f with Figure 2.21 the difference
between the quasi-cleavage surface (beginning point of the fracture) and the elongated
dimples (ending point of the fracture) is clear. Moreover, no crack initiation sites on the
fracture surface could be identified.

Results
61
Figure 0.11 - SEM fractography of AISI316L specimens tested in inert environment and LBE. a) Overview of the
fracture surface of a sample tested in inert environment, b) detail out of a), c) detail out of b), d) overview of the
fracture surface of a sample tested in LBE, e) detail out of d), f) detail out of e).
In Figure 0.12 the sample surfaces, close to the fracture surface, for specimens tested in LBE
and in inert environment are compared.

Results
62
Figure 0.12 - AISI316L. External surfaces. Pictures a) and b) are relative to AISI316L tested in inert environment.
Pictures c) and d) are from a specimen tested in LBE at the same conditions. In this case 350°C, 5E-4 s-1.
It can be noticed that sample surfaces do not show differences in their appearance due to the
different environments. An analysis with the SEM may allow to extend the evidence found at
350°C and 5·10-5 s-1 to other conditions.
In Figure 4.13 fracture surfaces of tensile samples tested in LBE and ArH2 at 350°C at a strain
rate of 5·10-4 s-1 are compared. Similar to samples tested at 350 °C and 5·10-5 s-1 no
significant differences or presence of brittle fracture areas was identified. The fracture
surfaces, like Figure 4.11, is characterized by dimples in the central part and by elongated
dimples in some limited zones on its external part.
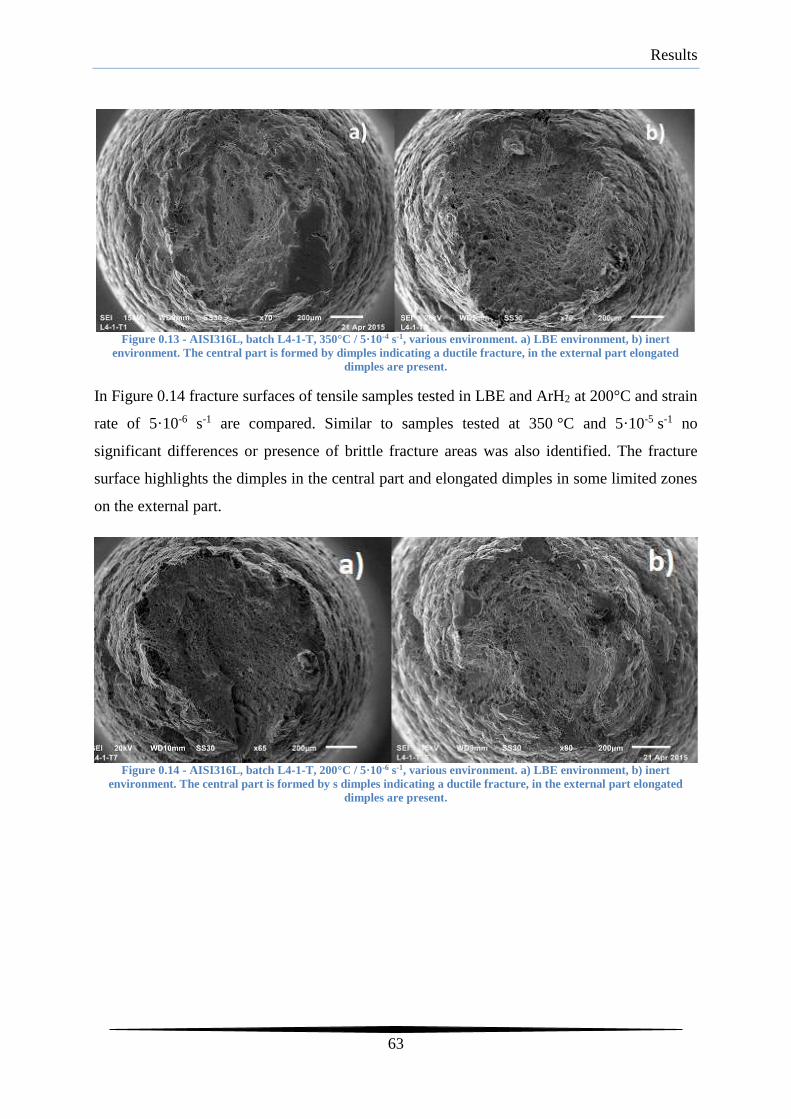
Results
63
Figure 0.13 - AISI316L, batch L4-1-T, 350°C / 5·10-4 s-1, various environment. a) LBE environment, b) inert
environment. The central part is formed by dimples indicating a ductile fracture, in the external part elongated
dimples are present.
In Figure 0.14 fracture surfaces of tensile samples tested in LBE and ArH2 at 200°C and strain
rate of 5·10-6 s-1 are compared. Similar to samples tested at 350 °C and 5·10-5 s-1 no
significant differences or presence of brittle fracture areas was also identified. The fracture
surface highlights the dimples in the central part and elongated dimples in some limited zones
on the external part.
Figure 0.14 - AISI316L, batch L4-1-T, 200°C / 5·10-6 s-1, various environment. a) LBE environment, b) inert
environment. The central part is formed by s dimples indicating a ductile fracture, in the external part elongated
dimples are present.

Discussion
64
4. Discussion
5.1 Effect of the LBE environment on the tensile properties
5.1.1 Total Elongation
From the experience developed at SCK-CEN by studying the f/m steel T91 it is known that a
parameter indicating the presence of LME is the Total Elongation. In fact, following the
intimate exposure to LBE, the T91 showed a significant reduction of this parameter, therefore
this criteria(SSRT + Total Elongation Reduction) was adopted for the couple AISI316L/LBE.
From the analysis of the stress-strain curves data reported in Figure 0.6, Figure 4.1 has been
obtained. The error bar in Figure 4.1 represents +/- 3, where is the standard deviation of
the data. The average TE value was 37% with a standard deviation of 2%.
Figure 4.1- (a): Comparison of measured Total Elongation values for samples tested in LBE and in inert/air
environment at 350 °C with a strain rate of 5·10-5 s-1. The shown error bar represent +/- 3. (b): Normal distribution
curves for TE built for the tests performed at 350 °C and with a strain rate of 5∙10-5 s-1.
In order to perform a similar and reliable analysis referring to the tests reported in Figure 0.7 a
higher number of tests performed in inert environment would necessary. Therefore, the same
standard deviation, as that found for experimental data in inert environment at 350 °C and
5∙10-5 s-1, was used for the tests at 350 °C and 5∙10-6 s-1 in inert environment. This assumption
is based on the fact that the scatter for TE in LBE, where the number of test is sufficient for
both the considered test conditions, is very similar for both the strain rates taken into account.
The same similarity was assumed for the tests in inert environment. Under this assumption a
standard deviation of 0.24 and a man value in TE of 0.4 was assumed (Figure 4.2).

Discussion
65
Figure 4.2 confirms that the tests performed in LBE fall into the scatter range of the tests
performed in inert environment. It is important to notice, from Figure 4.2 a, that this
conclusion is obtained also in the case the standard deviation was calculated considering only
the available tests at a strain rate of 5∙10-6 s-1, in inert environment.
As well in this case, the red square in Figure 4.2 a indicates the mean value of TE for tests
performed in inert environment; the red error bars represent 3. The blue points represent the
tests performed in LBE and, also in this case, data are entirely into the scatter range proper of
the tests performed in inert environment. The green bar instead represents the standard
deviation calculated by the three performed test in inert environment.
Figure 4.2 – (a): Comparison of measured total elongation values for samples tested in LBE and in inert/air
environment at 350°C with a strain rate of 5·10-6 s-1. The shown error bar represent +/- 3. (b):Normal distribution
curves for TE built for the tests performed at 350°C and a strain rate of 5*10-6 s-1.
In case the LME would be present for the couple AISI316L/LBE a distribution similar to the
one obtained for the couple T91/LBE would be expected (compare Figure 5.1 and Figure 5.2
with Figure 5.3). The marked reduction of Total Elongation (Figure 2.5) is missing in the
current case study. The differences between the two cases can be seen by comparing Figure
2.18 with Figure 0.6 or Figure 0.7.
In Figure 4.3 the normal distribution curves obtained for the couple T91/LBE with LME are
shown. It can be seen that the two normal distribution curves are clearly different. Particularly
a net reduction in the TE for the test performed in LBE was noticed. Comparing the
distribution curves of T91/LBE (Figure 5.3) to those for AISI316L/LBE and reporting data in
Figure 5.1 and 5.2 a significant difference can be observed. While in the case of AISI316L the
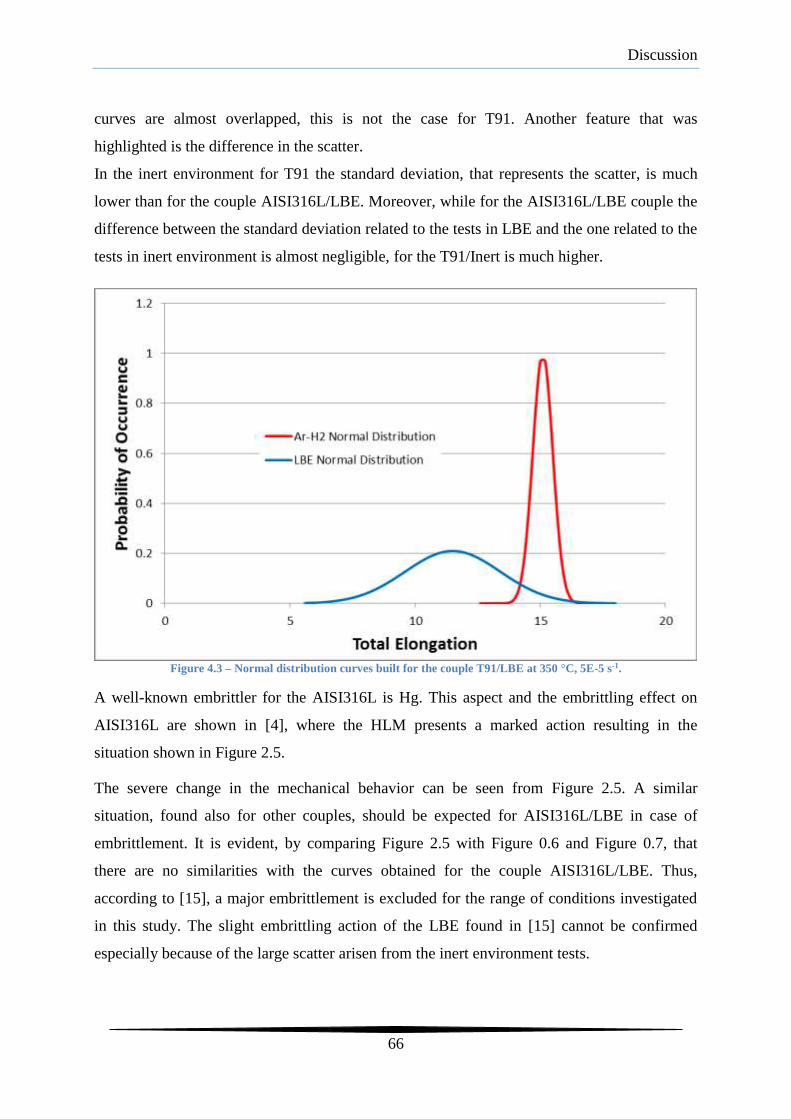
Discussion
66
curves are almost overlapped, this is not the case for T91. Another feature that was
highlighted is the difference in the scatter.
In the inert environment for T91 the standard deviation, that represents the scatter, is much
lower than for the couple AISI316L/LBE. Moreover, while for the AISI316L/LBE couple the
difference between the standard deviation related to the tests in LBE and the one related to the
tests in inert environment is almost negligible, for the T91/Inert is much higher.
Figure 4.3 – Normal distribution curves built for the couple T91/LBE at 350 °C, 5E-5 s-1.
A well-known embrittler for the AISI316L is Hg. This aspect and the embrittling effect on
AISI316L are shown in [4], where the HLM presents a marked action resulting in the
situation shown in Figure 2.5.
The severe change in the mechanical behavior can be seen from Figure 2.5. A similar
situation, found also for other couples, should be expected for AISI316L/LBE in case of
embrittlement. It is evident, by comparing Figure 2.5 with Figure 0.6 and Figure 0.7, that
there are no similarities with the curves obtained for the couple AISI316L/LBE. Thus,
according to [15], a major embrittlement is excluded for the range of conditions investigated
in this study. The slight embrittling action of the LBE found in [15] cannot be confirmed
especially because of the large scatter arisen from the inert environment tests.

Discussion
67
5.1.2 UTS
In Figure 4.4 the dependence of UTS on temperature is shown for a strain rate of 5·10-5 s-1
and it is compared with the literature data. Blue rhombuses and triangles represent results of
tests in LBE while the red ones the tests in inert environment for the batches L631 and L4-1-
T, respectively. At 350 °C it cannot be seen any noticeable effect of the environment since the
tests in LBE gave values in the scatter range of the tests in inert environment.
Figure 4.4 - UTS trend with the test temperature.
In Figure 4.5 the normal distribution curves for the UTS of the AISI316L tested in LBE and
inert environment at 350 °C and 5·10-5 s-1. The two curves, the blue representing the tests in
LBE and the red the ones in inert environment, show a similar behavior. No effect of LBE
environment can be addressed.
In Figure 4.5 the normal distribution curves for the UTS of the AISI316L tested in LBE and
inert environment at 350 °C and 5·10-5 s-1. Also in this case, the two curves, blue for the tests
in LBE and red for those in inert environment, show a similar behavior Without any LBE
effect.
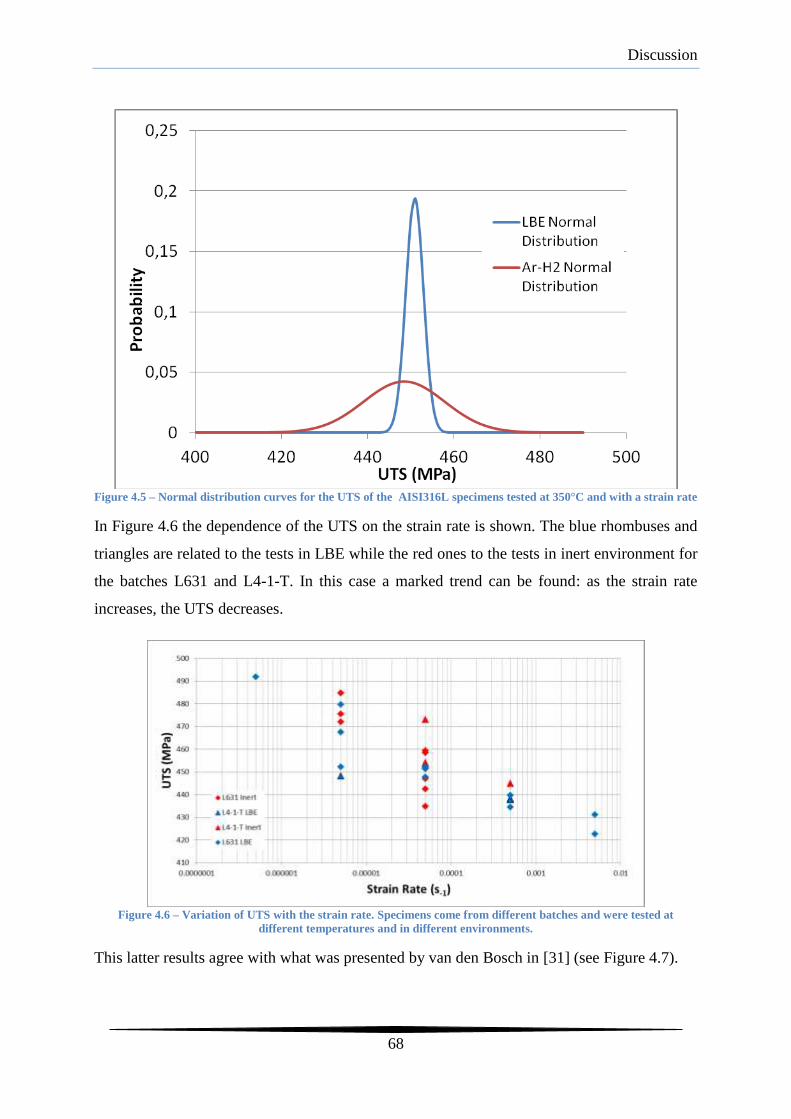
Discussion
68
Figure 4.5 – Normal distribution curves for the UTS of the AISI316L specimens tested at 350°C and with a strain rate
In Figure 4.6 the dependence of the UTS on the strain rate is shown. The blue rhombuses and
triangles are related to the tests in LBE while the red ones to the tests in inert environment for
the batches L631 and L4-1-T. In this case a marked trend can be found: as the strain rate
increases, the UTS decreases.
Figure 4.6 – Variation of UTS with the strain rate. Specimens come from different batches and were tested at
different temperatures and in different environments.
This latter results agree with what was presented by van den Bosch in [31] (see Figure 4.7).

Discussion
69
Figure 4.7 – UTS and YS as a function of strain rate. [31]. Square are related to the YS in inert (empty square) and
LBE (filled square) environment, while the rhombuses are related to UTS in inert (empty rhombus) and LBE (filled
rhombuses) environment.
5.1.3 Yield Strength
Figure 4.8 - Variation of Yield Strength with the temperature. Comparison of experimental and literature data.
In Figure 4.8 the trend of the Yield Strength with the temperature is shown. Blue rhombuses
and triangles are related to tests in LBE while red ones are related to tests in inert environment
for the batches L631 and L4-1-T. The blue curves derive from [59] and are representative for
the literature data. The black curve represents the minimum acceptable YS at various
temperatures as reported in the AFCI standard [60]. Even in this case it seems that there is no
any influence of the temperature on this parameter for the tested steel. Besides, even for the
Yield Strength, it can be seen, especially at 350 °C, that there is no detrimental effect caused

Discussion
70
by the LBE environment. The same result was found in [61] where no effect on mechanical
behavior for the couple LBE/AISI316L at 160 °C was found.
In Figure 4.9 the Yield Strength is reported as a function of the strain rate. The blue
rhombuses and triangles represent the test in LBE environment and the red rhombuses and
triangles the test in inert environment for batch AISI316L and L4-1-T. As it can be seen in
Figure 4.9, Yield Strength seems to be not affected by the strain rate as well. This confirms
the Van den Bosch [31] results (Figure 4.7).
Figure 4.9 - Yield Strength variation with the strain rate.
5.1.4 Uniform Elongation
Figure 4.10 - Uniform Elongation as function of strain rate. The specimens were tested at 350 °C.
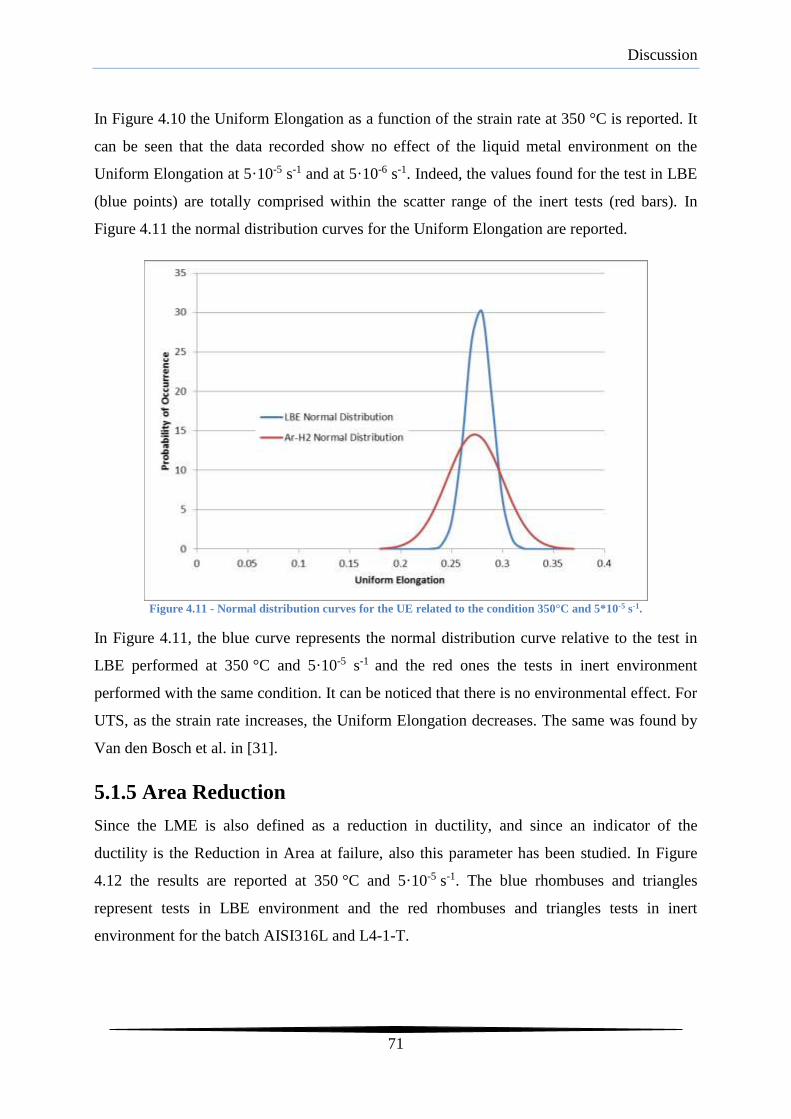
Discussion
71
In Figure 4.10 the Uniform Elongation as a function of the strain rate at 350 °C is reported. It
can be seen that the data recorded show no effect of the liquid metal environment on the
Uniform Elongation at 5·10-5 s-1 and at 5·10-6 s-1. Indeed, the values found for the test in LBE
(blue points) are totally comprised within the scatter range of the inert tests (red bars). In
Figure 4.11 the normal distribution curves for the Uniform Elongation are reported.
Figure 4.11 - Normal distribution curves for the UE related to the condition 350°C and 5*10-5 s-1.
In Figure 4.11, the blue curve represents the normal distribution curve relative to the test in
LBE performed at 350 °C and 5·10-5 s-1 and the red ones the tests in inert environment
performed with the same condition. It can be noticed that there is no environmental effect. For
UTS, as the strain rate increases, the Uniform Elongation decreases. The same was found by
Van den Bosch et al. in [31].
5.1.5 Area Reduction
Since the LME is also defined as a reduction in ductility, and since an indicator of the
ductility is the Reduction in Area at failure, also this parameter has been studied. In Figure
4.12 the results are reported at 350 °C and 5·10-5 s-1. The blue rhombuses and triangles
represent tests in LBE environment and the red rhombuses and triangles tests in inert
environment for the batch AISI316L and L4-1-T.
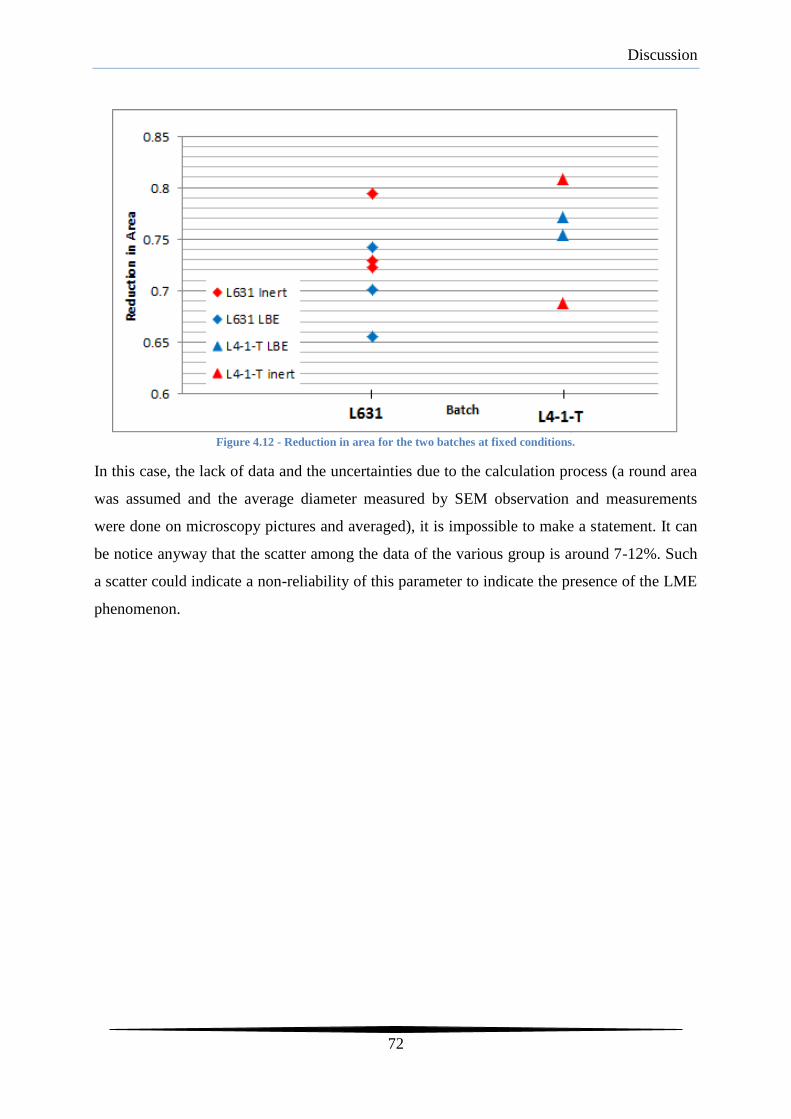
Discussion
72
Figure 4.12 - Reduction in area for the two batches at fixed conditions.
In this case, the lack of data and the uncertainties due to the calculation process (a round area
was assumed and the average diameter measured by SEM observation and measurements
were done on microscopy pictures and averaged), it is impossible to make a statement. It can
be notice anyway that the scatter among the data of the various group is around 7-12%. Such
a scatter could indicate a non-reliability of this parameter to indicate the presence of the LME
phenomenon.

Discussion
73
5.2 SEM observation
From the analysis of the tensile properties variations in liquid metal environment could be
evinced that no sign of strong LME is found for the couple AISI316L/LBE. A major
investigation of the fracture surfaces by SEM resulted in the confirmation of this result. In
fact, differently from what was observed by Medina et al. in [4] for the embrittling couple
AISI316L/Hg and from various authors, [10] [31] [41] etc., for the couple T91/LBE, no
differences were found between the tests in LBE environment and the tests in inert
environment. Particularly, no brittle fracture surface appeared on the AISI316L specimens.
The quasi-cleavage surface, which appears in case of LME occurrence on T91, does not
appear in this case. The fracture surface appears to be completely ductile in LBE environment
and in all other conditions tested.

Conclusion
74
5. Summary and Conclusions
In this study the influence of LBE on mechanical properties of the AISI AISI316L stainless
steel has been investigated by executing also experimental tests. The total elongation of the
specimen was the criterion used for the identification of liquid metal embrittlement for the
couple T91/LBE. This because of the reduction in Total Elongation is a clear sign of the
embrittlement. The same behavior was observed for the couple AISI316L/Hg [4].The same
approach was used for the couple AISI316L/LBE and (screening)for the tensile tests carried
out considering a broad range of testing parameters.
The tested specimens were derived from the DEMETRA plate, made by Industeel in the
framework of the EU DEMETRA FP7, whose ,major aim is to investigate the behavior of the
structural materials when in contact with heavy liquid metal.
Two batches of specimens were studied in this work. The first, named "L631", has been used
to investigate two particular sets of conditions: 350 °C and 5·10-5 s-1 and 350 °C and 5·10-5 s-
1. The second, named "L4-1-T", has been used to screen other sets of conditions.
The results were analyzed in terms of:
i. Variation of the tensile properties (uniform and Total Elongation, Yield Strength,
Tensile Strength and Reduction in Area) between the reference tests and the test
performed in liquid-bismuth eutectic environment.
ii. Variation in the fracture modality.
In order to investigate the first point,slow strain rate tensile tests were performed in lead-
bismuth eutectic environment and in inert environment to have reference tests. The tests in
inert environment were performed in two different machines: Limets 1 and an Instron
machine, the results showed that the two machines gave similar outcomes in terms of stress-
strain curves. For the reference tests, the Limets 1 used Ar-H2 as inert environment while the
Instron machine used air. The tests in LBE, on the other hand, were performed only in the
machine Limets 1.
The analysis of tensile properties resulted in the following:

Conclusion
75
- The fact that the normal distribution curves in both environments (LBE, ArH2) are
almost overlapped for TE, shows that a severe liquid metal embrittlement effect can be
excluded. The TE shows a wide scatter in the reference tests.
- Analysis of the Uniform Elongation showed that it is not influenced by the LBE
environment.
- Yield Strength shows a constant value independent of strain rate and test temperature.
Moreover, no effect related to the LBE environment has been found.
- Tensile strength showed only a little variation due to the test temperature; it decreased
as the strain rate increases. No indication of any effect deriving from the LBE
environment was observed.
Besides tensile tests, in order to investigate the point ii, microstructural and fracture surface
analyses on broken specimens were performed. The microstructural analyses (metallography)
were carried out in order to determine if the material was conform to the standard and
eventually, to correlate the phenomena to the irregularities and anomalies of the austenitic
matrix. The fracture surfaces were analyzed in order to identify the characteristic features of
the liquid metal embrittlement. Particularly, inward propagation of surface-born brittle cracks
was investigated. Metallography was performed by means of the optical microscope and by
the scanning electron microscope. Fractography was performed by means of scanning
electron microscopy. From the metallographic analysis of both batches a δ-ferrite phase
within the austenitic matrix was found. Its volume fraction was estimated about 3-5%.
Comparing these results to the Price and Andrews diagram or to the Delong diagram for δ-
ferrite in austenitic stainless steel a good agreement can be found for the investigated material.
SEM fractography did not show any severe liquid metal embrittlement for the couple
AISI316L/LBE at the sets of conditions studied. Indeed, no differences between the fracture
surfaces obtained in inert or in LBE environment were found. For the couples T91/LBE [8,
10, 30] and AISI316L/Hg [4], in which LME has been observed, the presence of inwards-
propagating brittle cracks was found and quasi-cleavage zones were observed in the outer part
of the broken specimen. This was not true for the couple AISI316L/LBE, for which the
fracture surface remained totally ductile and characterized by dimples and elongate dimples.
Summarizing:
- No sign of severe liquid metal embrittlement was observed for the couple
AISI316L/LBE, although a weak influence cannot be excluded.

Conclusion
76
- SSRT tests together with an approach based on reduction in Total Elongation in LBE
environment resulted to not be the appropriate method to investigate LME for the
couple AISI316L/LBE. The scatter in the reference test does not allow identifying
(possible) minor embrittling effects.
- Tests were performed at 200 °C, 350 °C, 450 °C and at various strain rates ranging
from 5·10-3 s-1 to 5·10-7 s-1 in order to perform a preliminary analysis of other sets
of conditions..
Therefore, further studies are desirable and should be oriented:
- To evaluate in a more detailed way the conditions that could influence LME and that
have been only preliminarily analysed in this study.
- To extensively investigate the LME phenomenon for the couple AISI316L/LBE by
complementary test techniques such as fracture toughness, fatigue or constant load
tests.

Bibliography
77
Bibliography
[1] MYRRHA, Mol, Belgium: www.myrrha.sckcen.be.
[2] S. Lynch, "Metal-Induced Embrittlement of Materials," Materials Characterization vol.
28 , pp. 279-289, 1992.
[3] T. Auger, S. Hémery, J. Courouau and F. Balbaud-Célérier, "Liquid metal embrittlement
of an austenitic stainless steel in liquid sodium," Corrosion Science vol.83, pp. 1-5, 2014.
[4] L.Medina-Almazàn, T. Auger and D. Gorse, "Liquid metal embrittlement of an austenitic
316L type ands a ferritic-martensitic T91 type steel by mercury," Journal od Nuclear
Materialms vol.376, pp. 312-316, 2008.
[5] F. Barbier, B. Joseph and M. Picat, "Liquid metal embrittlement: a state-of-art appraisal,"
The European Journal of Applied Physics, pp. 19-31, 1999.
[6] M. Nicholas and C. Old, "Review of liquid metal embrittlement," Journal of Material
Science, pp. 1-18, 1979.
[7] M. Kamdar, Progr. Mater. Sci. , p. 289, 1973.
[8] Y. Dai and e. al., "Slow Strain Rate Tensile Test on T91 in static lead-bismuth eutectic,"
Jour. of Nuc. Mat. vol. 356, pp. 222-228, 2006.
[9] A. Westwood, M. Kamdar and C. Preece, Fracture vol. 3, p. 589, 1971.
[10] T. Auger and e. al., "Effect of contact conditions on embrittlement of T91 steel by lead-
bismuth," Journ. of Nuc. Mat., pp. 227-231, 2004.
[11] J. Klecka and e. al., "Mechanical properties of the steel T91 in contact with lead,"
Nuclear Engineering and Design, 2014.
[12] D. Perovic, G. Weatherly and W. Miller, "On the strain rate dependence of ductility
troughs observed under liquid mettal embrittlement and creep conditions," Scripta Met.,

Bibliography
78
pp. 345-347, 1986.
[13] W. Rostoker, J. McCaughey and H. Marcus, Embrittlement of liquid metals, New York:
Rheinhold, 1960.
[14] W. Robertson, Met. Trans. vol.1, p. 2607, 1970.
[15] Z. Hamouche-Hadjem and e. al., "Susceptiblity to LME of 316L and T91 steels by LBE:
Effect of strain rate," Jou. of Nuc. Mat., pp. 317-321, 2008.
[16] S. Hémery and e. al., "Liquid metal embrittlement of an austenitic stainless steel in liquid
sodium," Corrosion Science vol.83, pp. 1-5, 2014.
[17] C. Ye and e. al., "Brittle fracture of T91 steel in liquid lead-bismuth eutectic alloy," Nucl.
Eng. Des., 2014.
[18] J. V. d. Bosch, D. Spaundjiev and A. Almazouzi, "Effects of temperature and strain rate
on the mechanical properties of T91 material tested in liquid lead bismuth eutectic,"
Journal of Nuclear Materials, pp. 237-246, 2006.
[19] H. Ichinose and G. Oouchi, Trans. Jap. Inst. Met., p. 980, 1968.
[20] I.Serre and J. Vogt, "Heat treatment of T91 martensitic steel on liquid metal
embrittlement," Jour. Nucl. Mat., pp. 330-335, 2008.
[21] M. Kamdar, Treatise on Material Science and Technology, Academic Presse, 1983, p.
361.
[22] V. Popovich and M. Chaevski, Fiz.-Khim. Mekh. Mater. vol.2, p. 143, 1966.
[23] W. Robertson, Trans. Met. Soc. AIME vol 236, p. 1478, 1966.
[24] E. Glickman and Y. Goryunov, Sov. Mater. Sci., p. 355, 1978.
[25] V. Popovich and I. Dmukhovskaya, Sov. Mater. Sci., p. 355, 1978.
[26] P. Gordon and H. An, Met. Trans. vol. 13, p. 457, 1982.

Bibliography
79
[27] T. Auger and e. al., "Liquid metal embrittlement of T91 and 316L steels by heavy liquid
metals: a fracture mechanics assessment," Jou. of Nuc. Mat., pp. 253-260, 2008.
[28] D. Gorse and e. al., "Influence of liquid lead and lead-bismuth eutectic on tensile, fatigue
and creep properties of ferritic/martensitic and austenitic steels for transmutation
systems," Jour. Nuc. Mater. vol 415, pp. 284-292, 2011.
[29] D. Kalkhof and M. grosse, Jour. Nucl. Mater., pp. 143-150, 2003.
[30] G. Coen and e. al., "Investigation of the effect of lead-bismuth eutectic on the fracture
properties of T91 and 316L," Jour. Nucl. Mater. vol 398, pp. 122-128, 2010.
[31] J. V. D. Bosch, ADS Candidate Materials Compatibility with Liquid Metal in a Neutron
Irradiation Environment, Gent: University of Gent, 2009.
[32] T.Udomphol, Laboratories 9: Fractography, Mech. Metall. Lab..
[33] E. Dahlberg, "Technical Articles from Element experts," [Online].
[34] J. Davis, Tensile Tests, Materials Park, Ohio: ASM International, 2004.
[35] K. Russel, Slow Strain Rate Testing for the Evaluation of Environmentally Induced
Cracking: Research and Engineering Applications, Philadelphia: ASTM, 1993.
[36] R. Parkins, "Slow Strain Rate Testin-25 Years Experience," in Slow Strain Rate Testing
fot the Evaluation of Environmentally Induced Cracking: Research and Engineering
Applications, Philadelphia, ASTM, 1993, pp. 7-21.
[37] J. Toribio, "The Use of Precracked and Nothced Slow Strain Rate Specimenss," in Slow
Strain Rate Testing for the Evaluation of Environmentally Induced Cracking: Research
and Engineering Applications, Philadelphia, ASTM, 1993, pp. 105-122.
[38] S. Gavrilov, E. Stergar and e. al., "MYRRHA Materials Assessment Report," Mol,
Belgium, 2013.
[39] A. A. J. Van Den Bosch, "EUROTRANS DEMETRA - Task 4.1.2: Reference material
Procurement, Dispatching and Characterization, Procurement and Characterizatrion of

Bibliography
80
T91 and SS 316L plates," SCK-CEN, Mol, Belgium, 2005.
[40] R. Klueh, "Elevated-Temperature Ferritic and Martensitic Steels and their Application to
Future Nuclear Reactors," Oak Ridge National Laboratory, 2004.
[41] G. Coen, J. V. d. Bosch and S. Gavrilov, "Effect of Oxygen Depleted LBE on the Liquid
Metal Embrittlement of T91," Journal of Nuclear Energy, 2012.
[42] G. Coen, "Unpublished Results".
[43] V. R. a. G. Raynor, "International Metals Reviews," 1980.
[44] W. Griffiths and E. Bain, Trans. AIME, pp. 166-213, 1927.
[45] C. Novak, Handbook of stainless steels, pp. 4.3-4.77, 1978.
[46] K. J. Irvine and e. al., J. Iron Steel Inst. vol.207, p. 1017, 1969.
[47] F. B. Pickering, Int. Met. rev. vol. 21, pp. 227-77, 1976.
[48] J. Nutting, J. Iron Steel Inst. vol.207, p. 872, 1969.
[49] K. Irvine and e. al., J. Iron Steel Inst. vol. 196, p. 166, 1960.
[50] D. Llewellyn and V. McNeely, Sheet Metal Industry vol. 49, p. 17, 1972.
[51] J. Lai and C. Horton, The tensile properties of a cast of AISI 316 stainless steel in various
metallurgical states, CERL, 1981.
[52] C. Brinkmann, V. Sikka and R. King, Nucl. Tech. vol. 33, pp. 76-95, 1977.
[53] V. Sikka and M. Booker, Effects of melting and processing variables on the mechanical
properties of steels, pp. 256-72, 1977.
[54] R. Hales and J. Cordwell, "Unpublished results," 1982.
[55] V. Sikka, "ORNL/TM-6608," 1978.
Bibliography
81
[56] J. Knebel, "FI6W-CT-2005-516520: EUROTRANS," Nimes, 2006.
[57] R. Bosch and S. &. A. M. A. van Dyck, "Investigation of the susceptibility of
EUROFER97 in lead-lithium to liquid metal embrittlement (LME) Fusion Engineering
and Design," in Proceedings of the 24th Symposium on Fusion Technology SOFT-24,
2007.
[58] D. Diez, 18 October 2013. [Online]. Available: http://www.leica-
microsystems.com/science-lab/metallography-an-introduction/.
[59] V. S. C. Brinkman, "Mechanical Properties of Liquid Metal Fast Breeder ReactorPrimary
Piping Materials," Nuclear Tech., 1976.
[60] AFCI, AFCI Materials Handbool, Materials Data for Particle Accelerator Application,
AFCI, 2006.
[61] e. a. Z. Hamouche-Hadjem, "Susceptiblity to LME of 316L and T91 steels by LBE:
Effect of strain rate," Jou. of Nuc. Mat., pp. 317-321, 2008.
[62] A. Griffith, Phil. Trans. Roy. Soc. , p. 163, 1920.
[63] C. Zener, Fracturing of metals, Ohio: ASM, 1943.
[64] A. Stroh, Adv. physics vol.6, p. 418, 1957.
[65] N. Petch, "Fracture," in Proceedings of theSwampscott Conference, New York, 1959.
[66] R. Dimelfi, Res Mechanica vol. 10, p. 47, 1984.
[67] S. Lynch, in Proceedings of the Conference on embrittlement by liquid and solid metal,
1984.
[68] J. V. d. Bosch and e. al., "Liquid metal embrittlement susceptibility of ferritic-martensitic
steel in liquid alloys," Jour. Nuc. Mater., pp. 322-329, 2008.

Bibliography
82

Appendix A
83
Appendix A – LME Mechanisms
A.1 Brittle Fracture By equating the elastic stain energy of the stressed solid to the work needed to create new
fracture surface we derive:
Where m is the fracture strength of the solid, the surface energy of the fracture faces, a0 the
equilibrium lattice spacing and E the Young modulus.
The theory suggests (by means of substitution of reasonable values) that m should be about
10% of E but the fracture strengths of the bulk brittle materials an metals is around 1% of
their E. This discrepancy led Griffith to postulate the presence of surface flaws at the tips of
which the applied stress is concentrated [62]. Thus, Griffith equated the elastic energy
released by the advance of an infinitely sharp crack of length c in a brittle solid to the work of
formation of the new surfaces, deriving:
Anyway, cracks are not infinitely sharp, considering a blunt crack lead to:
Where c is the stress at the crack tip of radius . Since to extend the crack must be c = m, it
is obtained:
Where the term /a0 is called eff.
An important fact is that not all the materials present cracks, that are nucleated (action of
dislocations to create cracks). In fact Zener in [63] suggests that dislocation pile up and
coalescence against an obstacle may be the nucleus of a crack.
The pile up provokes a stress called pile up stress, defined as:

Appendix A
84
Where G is the shear modulus, is Poisson's ratio, L is the length of the dislocation array (can
be related to the grain size) and A is an arithmetical factor >1 related to the geometry of the
array-obstacle interaction. This stress can be related to app by mean of 0, the threshold stress
which has to be exceeded for dislocation motion to occur:
Given the existence of a sharp crack nucleus the fracture may then be brittle propagated or
ductile (crack blunted by dislocations generation).
The probability p of the occurrence of the brittle fracture is given by Stroh in [64]:
Where f is a frequency factor, t the time, U an activation energy dependent on the applied
stress, T the temperature and k the Boltzman constant. As saw, p is very dependent on T.
More quantitatively, Petch in [65] points out that cleavage rather than slip occurs when:
Where K' is a constant depending on L and d.
Considering the LME as a process of brittle fracture, the above equations could be applicable.
Effects due to the liquid metal are suggested by the presence of the surface energy . For an
intergranular failure of a polycrystalline material, it is:
Where SV and SB are the surface and grain boundary energies.
Taking into account the presence of the liquid metal we obtain:
Where SL is the specific solid-liquid interfacial energy.
By this Kamdar in [7] proposes the concept of embrittling efficiency η of the LME:

Appendix A
85
A.2 Robertson model – dissolution/diffusion Robertson in [23] presents a model in which the liquid metal enhances the dissolution of the
solid metal at the crack tip. This dissolution is aided by stress and capillarity. Atoms dissolve
in the liquid and the crack advance, where the crack is schematized like in figure:
Figure A0.1 - Crack as considered by Robertson [23].
Being C0 the concentration of the solute at the crack tip for an unstressed material, the real
concentration C in the case showed in Figure 3.16 is given by:
Where C() is the excess due to stress:
And C() is the excess due to capillarity:
Where Ω is the atomic volume of the solid, E the Young modulus, k the Boltzman constant, T
the temperature and g the solid-liquid interface energy. While the flux J is:
And the crack velocity is:

Appendix A
86
Setting v = 0 the Griffith criterion for the critical stress sc is obtained. The maximum velocity
can be now calculated, it results to depend on the properties of the solid, the interaction of the
solid and the liquid and the temperature.
Critics to this model:
- Popovich: he notices that the degree of LME, according with Robertson, should
increase with the mutual solubilities, this disagree with the evidence. Besides, high
dissolution leads to the blunting of the crack tips, which arrests LME.
- Glickman: he claims that this model doesn't take into account the possibility of
relaxation of elastic stresses during the blunting of the crack.
- Kamdar: Robertson shows that with temperature increasing the LME degree increases.
Kamdar underlines that LME is not observed in all the couples, but instead sometimes
the opposite is shown.

Appendix A
87
A.3 Glickman model – dissolution/precipitation For Glickman [24] the nucleation and the growth of cracks occur along grain boundaries and
are associated with the dissolution of solid metal atoms at the crack tip. The dissolution is
enhanced by the adsorption of the liquid metal atoms, which favors the nucleation of
dislocations, by creating an atomic roughness at the solid/liquid interface, and which enhances
the dissolution, leading to an accelerate propagation.
Glickman pointed out that there are three kinetic stages for failure:
- Initiation: results from selective dissolution at the grain boundaries exiting the surface.
It lasts till a depth of 10µm.
- Precritical propagation: controls the stage of failure, it is a slow propagation whose
duration, that defines the time to rupture tc, depends on the crack rate and on the
critical length lc.
- Crack supercritical propagation: it is a very fast propagation that happens when the
product lcc overcome a threshold value.
Glickman developed a mechanism to describe the stage of pre-critical propagation based on a
combined dissolution/precipitation phenomenon. Atoms of the solid dissolve in the melt (in
discontinuity points), diffuse in it and precipitate (in discontinuity points) at a certain distance
from the crack tip. The concentration (Cj) of discontinuities, particularly important, is:
Higher Cj, higher is the rate of dissolution and the crack growth v:
Where h is the average distance between dislocation steps at the crack front, is the atomic
volume and vj is the rate of displacement of discontinuities along the step which increases
with increasing , diffusion coefficient DL and solubility of metal in the melt Co.
The energy of formation of discontinuities Uj is expressed by:

Appendix A
88
Where SSL is the increase in the melt-metal interface area and SGB the decrease in grain-
boundary area, due to the formation of new discontinuities.
Glickman determined formulas for the growth rate, the mobility and the threshold stress in
terms of the parameters of the metal-melt system.
The accelerated fracture is, thus, associated to the simultaneous influences of two factors:
- Exceptionally high diffusional permeability of the melt filling the crack cavity (quick
removal of solute atoms);
- High degree of atomic roughness of the metal-melt interfaces which is related to the
low specific surface energy a t these interfaces and ensures high dissolution rate.
Critics:
- Nevertheless the improvement with respect to Robertson's model, this model still faces
the problem of solubility of the solid metal that is supposed to improve the
embrittlement.

Appendix A
89
A.4 SJWK model (Kamdar) – weakening of interatomic
bond This model, presented by Kamdar in [21], is based on the weakening of interatomic bond
mechanism; seen as a particular case of brittle fracture. Even if this model explains various
dependences of the LME phenomenon (strain-rate, temperature, grain size, etc.) it doesn't
predict the occurrence of embrittlement.
The model is based on the presumed existing proportional relationship between surface
energy and interatomic bond energy. The relationship is as follows: considering a crack of
radius , submitted to a normal stress and shear stress , the work associated with the
fracture is proportional to /a0, where is the elastic surface energy and a0 the radius of an
elastic crack. Any factor facilitating the blunting of the crack tips, increases , resulting in
high energy absorption/crack arrest. If the work done to break interatomic bonds is equated to
the maximum stress m to break the A-A0 bond is obtained:
Figure A0.2 – Mechanism of weakening. B is adsorbed and lows the energy of the A-A0 bond. If the applied stress
overpass the bond energy, A-A0 is broken, the crack advances and B is furthermore adsorbed and influence A-A1 [21].

Appendix A
90
This model, presented in a general internal situation, works also at the surface of the metal,
and if chemisorption is activated, it will occur preferentially at sites of stress concentrations.
Critics:
- Popovich states that, even if Kamdar consideres only a reduction of , there are also
changes in the value of . Moreover he asserts that LME is a ductile phenomenon at a
micro-level (so brittle fracture theory would be not applicable).
- Dimelfi in [66], anyway, demonstrated that, assuming the presence of plastic flow, this
is not contradictory with the weakening of interatomic bonds. Indeed work-hardening
aspect of plastic strain allows an accompanying increment of elastic strain and hence
allows sufficient elastic strains for bond breaking and crack propagation. Such an
explanations allows to explain the influence of cold work, strain rate and temperature.
A.5 Lynch model – decrease of the strength of interatomic
bond This model, presented by Lynch in [2] and in other papers, assumes that crack propagation
does not occur by atom rupture of the bonds and it gives an explanation for the presence of
ductility at a micro-level. It states that the weakening of the interatomic bonds eases the
nucleation of dislocations and promotes intensive slip of them, this leads to the formation of
voids and coalescence of them with the propagating crack.
Figure A0.3 – Lynch model [67].

Appendix A
91
When extensive adsorption-induced dislocations injection occurs from crack tips, only small
strains are required to link up crack tips with voids formed in a plastic zone ahead of cracks.
Voids reshapes the crack so that crack-tip-opening angles are smaller than the angle between
two slip planes. This process produces fracture surfaces that are microscopically dimpled by
macroscopically parallel to low-index crystallographic planes bisecting the two active slip
planes. In inert environments instead, relatively large strains are required to produce
coalescence cracks with the voids, larger and deeper dimples are so observed.
Critics:
- Gordon states that this model doesn't explain the delayed failure.
- Kamdar notices that adsorption effects on dislocation will be limited to several atomic
spacings due to electronic screening effects and won't be felt at larger distance in the
bulk of the solid ahead or in the vicinity of the crack tip.

Appendix A
92
A.6 Popovich model – Rebinder effect/plastic flow This model based on the Rebinder effect and on enhanced plastic flow. Popovich, as Lynch
proposes [25] a method which foresees an easier plastic flow. Popovich states that this easing
is due to the reduction of shear stress , caused by the action of liquid metal. The increased
dislocation activity leads to a work hardening in a determined region and, consequently, to a
premature failure. Moreover, he proposed that the adsorption of the liquid metal atoms can
activate new slip planes, which results in an even more enhanced plastic flow and work
hardening.
Alternatively, if the large number of dislocations is able to transfer the strain to the
neighboring grains by crossing the grain boundaries, then the overall ductility could be
increased by the absorption.
In this model LME would be expected to be more severe at high strain rates (relaxation
process are slow), low temperature (relaxation processes are faster at high temperature) and
high average grain size (in fine-grain structures the movement of dislocation is enhanced by
the high energy of disorientation).
Critics to the Popovich's model are the same moved to the Lynch's model.

Appendix A
93
A.7 Gordon model – penetration Gordon [26] postulates that the absorbed embrittler atoms are able to penetrate a short
distance into base metal grain boundaries. In these zones the presence of the embrittler lowers
the crack resistance and increases the difficulty of slip. When a sufficient concentration of
embrittler atoms has been built up to some critical depth in one penetration zone, cracks
nucleation takes place.
Gordon describes the initiation stage as the rate-controlling; the nucleation time is:
Where GS and Gd are the activation energy of the phases: 1) change from the absorbed to
the dissolved state on the surface for the embrittler atoms; 2) diffusion and penetration along
grain boundaries, respectively. Gordon developed a diagram to evaluate the initiation time.
Figure A0.4 – Gordon's diagram [26].
In this diagram if the sample is preheated to T4 and it is tested at any s between i4 (for which
the loading time equals the penetration zone formation time) and th (which is the stress

Appendix A
94
below which no LME failure takes place) thus the initiation time will be equal to t1 (times to
form penetration zones at T4 and stress 1)-t1 (time to load to 1).
In the propagation stage the rate-determining process may not be the transport of embrittler
atoms to the crack tip. In fact repeated nucleation might be necessary, leading to a process
slower than if leaded by the transport processes.
Critics to this model come from:
- Popovich: in his opinion this model does not explain the difference in the incubation
period in SME and LME, since the rate of penetration will not depend on the solid or
liquid nature of the coating.
- Gordon himself: the weak point is because it doesn't explain the existence of a
threshold stress.

95
Appendix B - Pictures of fracture surfaces from
papers on T91 and AISI316L
From [4]:
Figure B.0.1- T91/Hg (air); 6.67x10⁻⁶ ms-1. a) transgranular by shear decohesion in Hg, b) intergranular in Hg, c)
dimpled in air.
Figure B.0.2 – 316L/Hg (air), 6.67x10⁻⁶ ms-1. a) transgranular by shear band decohesion, b) transgranular dimpled in
air.

96
From [15]:
Figure B.0.3 – T91/LBE (inert environment), 160 °C. a) 6.67x10⁻⁷ ms-1, brittle in LBE, b) 6.67x10⁻⁵ ms-1 brittle-ductile
transition in LBE, c) 6.67x10⁻³ ms-1 ductility recovery in LBE, d) 6.67x10⁻⁷ ms-1 ductile fracture in inert environment
(He-4%H2)

97
Figure B.0.4 – AISI 316L/LBE (inert), 6.67x10⁻⁷ ms-1, 160°C. a) ductile fracture in He-4% H2, b) and c) quasi-brittle
(or brittle-ductile) fracture surface in LBE.
From [30]:
Figure B.0.5 – A) fracture surface of T91/LBE at 300 °C, magnification of brittle fracture surface. B) fracture surface
of AISI 316L/LBE at 300 °C, magnification of ductile fracture surface, no effect of embrittlement.
From [10]:
Figure B.0.6 - Various magnification of a T91/LBe specimen. From the left top, clockwise, specimen with surface-
nucleated cracks, brittle fracture surface (quasi cleavage), analysis of a liquid metal induced crack and
microstructure by mean of a reactive solution at the SEM.

98
From [68]:
Figure B.0.7 – Irradiated (2.29 dpa) T91/LBE, 300°C. In Figure D it visibile a non complete ductile fracture surface.


![A SINGLE-MASK SELF-ALIGNED FABRICATION PROCESS FOR ... · Wood’s metal [eutectic alloy of bismuth (50% ), lead (26.7% ), tin (13.3%), and cadmium (10%)]. Full sidewall-covering](https://static.fdocuments.net/doc/165x107/5e3415627d77ee4a3e63d567/a-single-mask-self-aligned-fabrication-process-for-woodas-metal-eutectic.jpg)