Influence of inorganic acid pickling on the corrosion...
13
Influence of inorganic acid pickling on the corrosion resistance of magnesium alloy AZ31 sheet U.C. Nwaogu a, * , C. Blawert b, * , N. Scharnagl b , W. Dietzel b , K.U. Kainer b a Technical University of Denmark, Department of Mechanical Engineering, Building 425, Room 023, DK – 2800 Kgs., Lyngby, Denmark b Institute of Materials Research, GKSS-Forschungszentrum Geesthacht GmbH, D-21502 Geesthacht, Germany article info Article history: Received 12 May 2009 Accepted 24 June 2009 Available online 2 July 2009 Keywords: A. Acid solutions A. Magnesium B. Weight loss B. EIS B. Acid corrosion C. Passive films abstract Surface contaminants as a result of thermo-mechanical processing of magnesium alloys, e.g. sheet rolling, can have a negative effect on the corrosion resistance of magnesium alloys. Especially contaminants such as Fe, Ni and Cu, left on the surface of magnesium alloys result in the formation of micro-galvanic couples and can therefore increase corrosion attack on these alloys. Due to this influence they should be removed to obtain good corrosion resistance. In this study, the effect of inorganic acid pickling on the corrosion behaviour of a commercial AZ31 magnesium alloy sheet was investigated. Sulphuric, nitric and phosphoric acids of different concentra- tions were used to clean the alloy for various pickling times. The surface morphology, composition and phases were elucidated using scanning electron microscopy, X-ray fluorescence analysis, spark dis- charge-optical emission spectroscopy, energy dispersive X-ray spectroscopy and infrared spectroscopy. The effect of surface cleaning on the corrosion properties was studied using salt spray test and electro- chemical impedance spectroscopy. The experimental results show that acid pickling reduces the surface impurities and therefore enhances the corrosion resistance of the alloy. The cleaning efficiency of the three acids used and the corrosion protection mechanisms were found to be remarkably different. Best corrosion results were obtained with nitric acid, followed closely by phosphoric acid. Only the sulphuric acid failed more or less when cleaning the AZ31 sheet. However, to obtain reasonable corrosion resis- tance at least 5 lm of the surface of AZ31 magnesium alloy sheet have to be removed. Ó 2009 Elsevier Ltd. All rights reserved. 1. Introduction The major challenge in the use of Mg alloys is their high sus- ceptibility to galvanic corrosion attack [1], and even micro-gal- vanic corrosion of the alloys without contact to other metals is possible due to heavy metal impurities such as iron, copper and nickel. Therefore, corrosion can be minimized by the use of high purity alloys that maintain heavy metal impurities below the tol- erance limits. The removal of bad design, flux inclusions, surface contaminations, galvanic couples and the avoidance of inadequate or incorrectly applied surface protection schemes can also signif- icantly decrease the corrosion of Mg alloys in service [1]. How- ever, processing of these alloys can raise the surface impurity content above the tolerance limits. To this end, the surfaces of Mg alloys are supposed to be pre-cleaned prior to further surface modification in order to enhance their corrosion resistance and surface appearance [2]. Mechanical and chemical cleaning meth- ods are used either separately or in combination, depending on the specific application and product involved [3]. The mechanical cleaning is achieved by grinding and rough polishing, dry or wet abrasive blast cleaning; wet brushing and wet barrel or bowl abrading (vibratory finishing). Chemical cleaning methods for Mg alloys include vapour degreasing, solvent cleaning, emulsion cleaning, alkaline cleaning and acid cleaning. Cleaning processes of either type (mechanical and chemical) require adequate control to ensure repetitive reliability [3]. With regard to our study, a chemical cleaning process using various acids was adopted. How- ever, most of the published work used acid cleaning only as a pre- treatment before further coating steps [4–10]. Following the re- sults of these previous studies, the reason why acid pre-treat- ments can enhance the corrosion resistance of Mg alloys was not elucidated in detail. Therefore, the present study was under- taken to determine the influence of three commonly used acids in cleaning solutions on the surface composition, phases and mor- phology of AZ31 magnesium alloy sheet. Intentionally, the pure acids without any additional components, e.g. detergents or wet- ting agents, were used to identify the effect of the acid solely. The findings were correlated with the corrosion behaviour in order to determine the required extent of etching (material removal) for enhanced corrosion resistance of the alloy. The acids HNO 3 , 0010-938X/$ - see front matter Ó 2009 Elsevier Ltd. All rights reserved. doi:10.1016/j.corsci.2009.06.045 * Corresponding authors. Tel.: +45 5027 0655; fax: +45 4593 4570 (U.C. Nwaogu). E-mail addresses: [email protected] (U.C. Nwaogu), [email protected] (C. Blawert). Corrosion Science 51 (2009) 2544–2556 Contents lists available at ScienceDirect Corrosion Science journal homepage: www.elsevier.com/locate/corsci
Transcript of Influence of inorganic acid pickling on the corrosion...

Corrosion Science 51 (2009) 2544–2556
Contents lists available at ScienceDirect
Corrosion Science
journal homepage: www.elsevier .com/locate /corsc i
Influence of inorganic acid pickling on the corrosion resistance of magnesiumalloy AZ31 sheet
U.C. Nwaogu a,*, C. Blawert b,*, N. Scharnagl b, W. Dietzel b, K.U. Kainer b
a Technical University of Denmark, Department of Mechanical Engineering, Building 425, Room 023, DK – 2800 Kgs., Lyngby, Denmarkb Institute of Materials Research, GKSS-Forschungszentrum Geesthacht GmbH, D-21502 Geesthacht, Germany
a r t i c l e i n f o
Article history:Received 12 May 2009Accepted 24 June 2009Available online 2 July 2009
Keywords:A. Acid solutionsA. MagnesiumB. Weight lossB. EISB. Acid corrosionC. Passive films
0010-938X/$ - see front matter � 2009 Elsevier Ltd. Adoi:10.1016/j.corsci.2009.06.045
* Corresponding authors. Tel.: +45 5027 0655; fax: +E-mail addresses: [email protected] (U.C. Nwaogu
Blawert).
a b s t r a c t
Surface contaminants as a result of thermo-mechanical processing of magnesium alloys, e.g. sheet rolling,can have a negative effect on the corrosion resistance of magnesium alloys. Especially contaminants suchas Fe, Ni and Cu, left on the surface of magnesium alloys result in the formation of micro-galvanic couplesand can therefore increase corrosion attack on these alloys. Due to this influence they should be removedto obtain good corrosion resistance.
In this study, the effect of inorganic acid pickling on the corrosion behaviour of a commercial AZ31magnesium alloy sheet was investigated. Sulphuric, nitric and phosphoric acids of different concentra-tions were used to clean the alloy for various pickling times. The surface morphology, composition andphases were elucidated using scanning electron microscopy, X-ray fluorescence analysis, spark dis-charge-optical emission spectroscopy, energy dispersive X-ray spectroscopy and infrared spectroscopy.The effect of surface cleaning on the corrosion properties was studied using salt spray test and electro-chemical impedance spectroscopy. The experimental results show that acid pickling reduces the surfaceimpurities and therefore enhances the corrosion resistance of the alloy. The cleaning efficiency of thethree acids used and the corrosion protection mechanisms were found to be remarkably different. Bestcorrosion results were obtained with nitric acid, followed closely by phosphoric acid. Only the sulphuricacid failed more or less when cleaning the AZ31 sheet. However, to obtain reasonable corrosion resis-tance at least 5 lm of the surface of AZ31 magnesium alloy sheet have to be removed.
� 2009 Elsevier Ltd. All rights reserved.
1. Introduction
The major challenge in the use of Mg alloys is their high sus-ceptibility to galvanic corrosion attack [1], and even micro-gal-vanic corrosion of the alloys without contact to other metals ispossible due to heavy metal impurities such as iron, copper andnickel. Therefore, corrosion can be minimized by the use of highpurity alloys that maintain heavy metal impurities below the tol-erance limits. The removal of bad design, flux inclusions, surfacecontaminations, galvanic couples and the avoidance of inadequateor incorrectly applied surface protection schemes can also signif-icantly decrease the corrosion of Mg alloys in service [1]. How-ever, processing of these alloys can raise the surface impuritycontent above the tolerance limits. To this end, the surfaces ofMg alloys are supposed to be pre-cleaned prior to further surfacemodification in order to enhance their corrosion resistance andsurface appearance [2]. Mechanical and chemical cleaning meth-ods are used either separately or in combination, depending on
ll rights reserved.
45 4593 4570 (U.C. Nwaogu).), [email protected] (C.
the specific application and product involved [3]. The mechanicalcleaning is achieved by grinding and rough polishing, dry or wetabrasive blast cleaning; wet brushing and wet barrel or bowlabrading (vibratory finishing). Chemical cleaning methods forMg alloys include vapour degreasing, solvent cleaning, emulsioncleaning, alkaline cleaning and acid cleaning. Cleaning processesof either type (mechanical and chemical) require adequate controlto ensure repetitive reliability [3]. With regard to our study, achemical cleaning process using various acids was adopted. How-ever, most of the published work used acid cleaning only as a pre-treatment before further coating steps [4–10]. Following the re-sults of these previous studies, the reason why acid pre-treat-ments can enhance the corrosion resistance of Mg alloys wasnot elucidated in detail. Therefore, the present study was under-taken to determine the influence of three commonly used acidsin cleaning solutions on the surface composition, phases and mor-phology of AZ31 magnesium alloy sheet. Intentionally, the pureacids without any additional components, e.g. detergents or wet-ting agents, were used to identify the effect of the acid solely. Thefindings were correlated with the corrosion behaviour in order todetermine the required extent of etching (material removal) forenhanced corrosion resistance of the alloy. The acids HNO3,
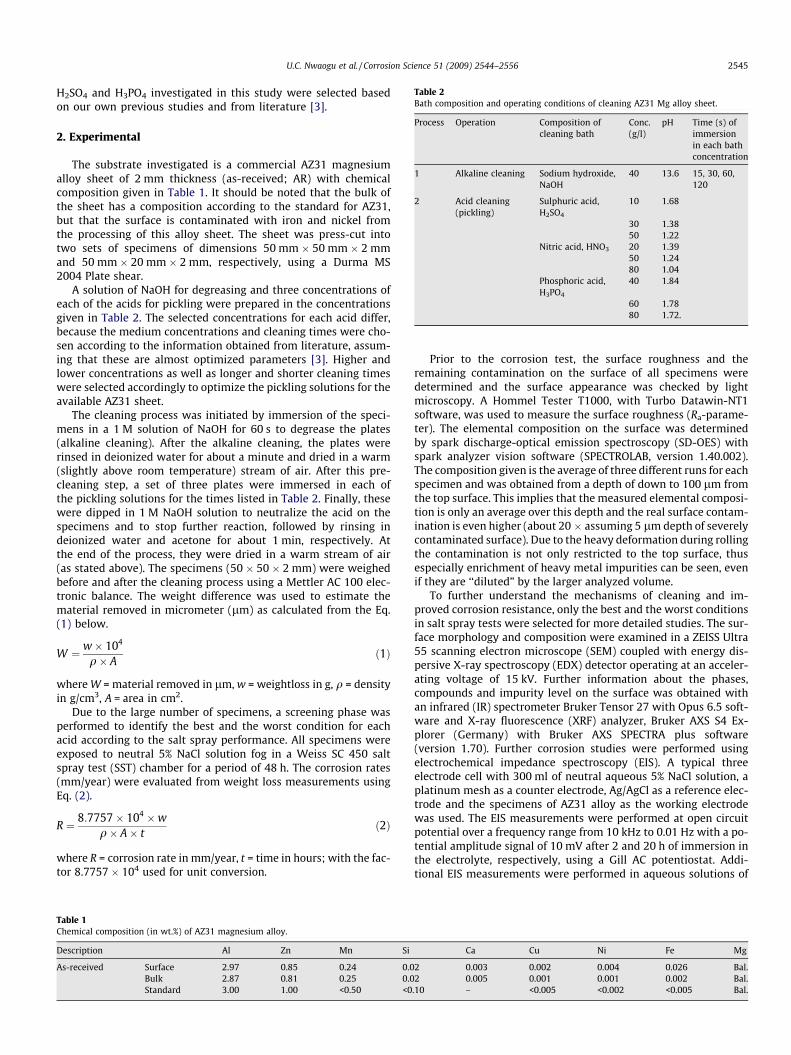
Table 2Bath composition and operating conditions of cleaning AZ31 Mg alloy sheet.
Process Operation Composition ofcleaning bath
Conc.(g/l)
pH Time (s) ofimmersionin each bathconcentration
1 Alkaline cleaning Sodium hydroxide,NaOH
40 13.6 15, 30, 60,120
2 Acid cleaning(pickling)
Sulphuric acid,H2SO4
10 1.68
30 1.3850 1.22
Nitric acid, HNO3 20 1.3950 1.2480 1.04
Phosphoric acid,H3PO4
40 1.84
60 1.7880 1.72.
U.C. Nwaogu et al. / Corrosion Science 51 (2009) 2544–2556 2545
H2SO4 and H3PO4 investigated in this study were selected basedon our own previous studies and from literature [3].
2. Experimental
The substrate investigated is a commercial AZ31 magnesiumalloy sheet of 2 mm thickness (as-received; AR) with chemicalcomposition given in Table 1. It should be noted that the bulk ofthe sheet has a composition according to the standard for AZ31,but that the surface is contaminated with iron and nickel fromthe processing of this alloy sheet. The sheet was press-cut intotwo sets of specimens of dimensions 50 mm � 50 mm � 2 mmand 50 mm � 20 mm � 2 mm, respectively, using a Durma MS2004 Plate shear.
A solution of NaOH for degreasing and three concentrations ofeach of the acids for pickling were prepared in the concentrationsgiven in Table 2. The selected concentrations for each acid differ,because the medium concentrations and cleaning times were cho-sen according to the information obtained from literature, assum-ing that these are almost optimized parameters [3]. Higher andlower concentrations as well as longer and shorter cleaning timeswere selected accordingly to optimize the pickling solutions for theavailable AZ31 sheet.
The cleaning process was initiated by immersion of the speci-mens in a 1 M solution of NaOH for 60 s to degrease the plates(alkaline cleaning). After the alkaline cleaning, the plates wererinsed in deionized water for about a minute and dried in a warm(slightly above room temperature) stream of air. After this pre-cleaning step, a set of three plates were immersed in each ofthe pickling solutions for the times listed in Table 2. Finally, thesewere dipped in 1 M NaOH solution to neutralize the acid on thespecimens and to stop further reaction, followed by rinsing indeionized water and acetone for about 1 min, respectively. Atthe end of the process, they were dried in a warm stream of air(as stated above). The specimens (50 � 50 � 2 mm) were weighedbefore and after the cleaning process using a Mettler AC 100 elec-tronic balance. The weight difference was used to estimate thematerial removed in micrometer (lm) as calculated from the Eq.(1) below.
W ¼ w� 104
q� Að1Þ
where W = material removed in lm, w = weightloss in g, q = densityin g/cm3, A = area in cm2.
Due to the large number of specimens, a screening phase wasperformed to identify the best and the worst condition for eachacid according to the salt spray performance. All specimens wereexposed to neutral 5% NaCl solution fog in a Weiss SC 450 saltspray test (SST) chamber for a period of 48 h. The corrosion rates(mm/year) were evaluated from weight loss measurements usingEq. (2).
R ¼ 8:7757� 104 �wq� A� t
ð2Þ
where R = corrosion rate in mm/year, t = time in hours; with the fac-tor 8.7757 � 104 used for unit conversion.
Table 1Chemical composition (in wt.%) of AZ31 magnesium alloy.
Description Al Zn Mn Si
As-received Surface 2.97 0.85 0.24 0.0Bulk 2.87 0.81 0.25 0.0Standard 3.00 1.00 <0.50 <0
Prior to the corrosion test, the surface roughness and theremaining contamination on the surface of all specimens weredetermined and the surface appearance was checked by lightmicroscopy. A Hommel Tester T1000, with Turbo Datawin-NT1software, was used to measure the surface roughness (Ra-parame-ter). The elemental composition on the surface was determinedby spark discharge-optical emission spectroscopy (SD-OES) withspark analyzer vision software (SPECTROLAB, version 1.40.002).The composition given is the average of three different runs for eachspecimen and was obtained from a depth of down to 100 lm fromthe top surface. This implies that the measured elemental composi-tion is only an average over this depth and the real surface contam-ination is even higher (about 20 � assuming 5 lm depth of severelycontaminated surface). Due to the heavy deformation during rollingthe contamination is not only restricted to the top surface, thusespecially enrichment of heavy metal impurities can be seen, evenif they are ‘‘diluted” by the larger analyzed volume.
To further understand the mechanisms of cleaning and im-proved corrosion resistance, only the best and the worst conditionsin salt spray tests were selected for more detailed studies. The sur-face morphology and composition were examined in a ZEISS Ultra55 scanning electron microscope (SEM) coupled with energy dis-persive X-ray spectroscopy (EDX) detector operating at an acceler-ating voltage of 15 kV. Further information about the phases,compounds and impurity level on the surface was obtained withan infrared (IR) spectrometer Bruker Tensor 27 with Opus 6.5 soft-ware and X-ray fluorescence (XRF) analyzer, Bruker AXS S4 Ex-plorer (Germany) with Bruker AXS SPECTRA plus software(version 1.70). Further corrosion studies were performed usingelectrochemical impedance spectroscopy (EIS). A typical threeelectrode cell with 300 ml of neutral aqueous 5% NaCl solution, aplatinum mesh as a counter electrode, Ag/AgCl as a reference elec-trode and the specimens of AZ31 alloy as the working electrodewas used. The EIS measurements were performed at open circuitpotential over a frequency range from 10 kHz to 0.01 Hz with a po-tential amplitude signal of 10 mV after 2 and 20 h of immersion inthe electrolyte, respectively, using a Gill AC potentiostat. Addi-tional EIS measurements were performed in aqueous solutions of
Ca Cu Ni Fe Mg
2 0.003 0.002 0.004 0.026 Bal.2 0.005 0.001 0.001 0.002 Bal.
.10 – <0.005 <0.002 <0.005 Bal.
2546 U.C. Nwaogu et al. / Corrosion Science 51 (2009) 2544–2556
0.01 M Na2SO4 or 0.01 M NaNO3 with and without addition of0.1 M NaCl after an immersion time of 2 h.
3. Results
3.1. Material removal
As expected, the amount of material removed during immersionincreased with immersion time (with the exception of specimenscleaned in 50 g/l sulphuric acid) and also with the concentrationof each acid as can be seen in Fig. 1. Sulphuric acid treated speci-mens with 50 g/l did not follow the same trend, and the amountof material removed (6.85 ± 1.43 lm) at this concentration is com-parable for all the immersion times. The maximum material re-moval for sulphuric acid cleaning is 8.01 ± 1.43 lm while theminimum is 0.45 ± 0.04 lm. From Fig. 1, it can be seen that for ni-tric and phosphoric acids the maximum material removal of8.21 ± 0.11 lm and 4.92 ± 0.20 lm, respectively, was observed atthe highest concentrations and longest immersion times whilethe minimum material removal of 0.35 ± 0.06 lm and 0.76 ±0.11 lm, respectively, was observed at the lowest concentrations
Fig. 1. Variation of material removed by each cleaning bath with immersion timeand concentration.
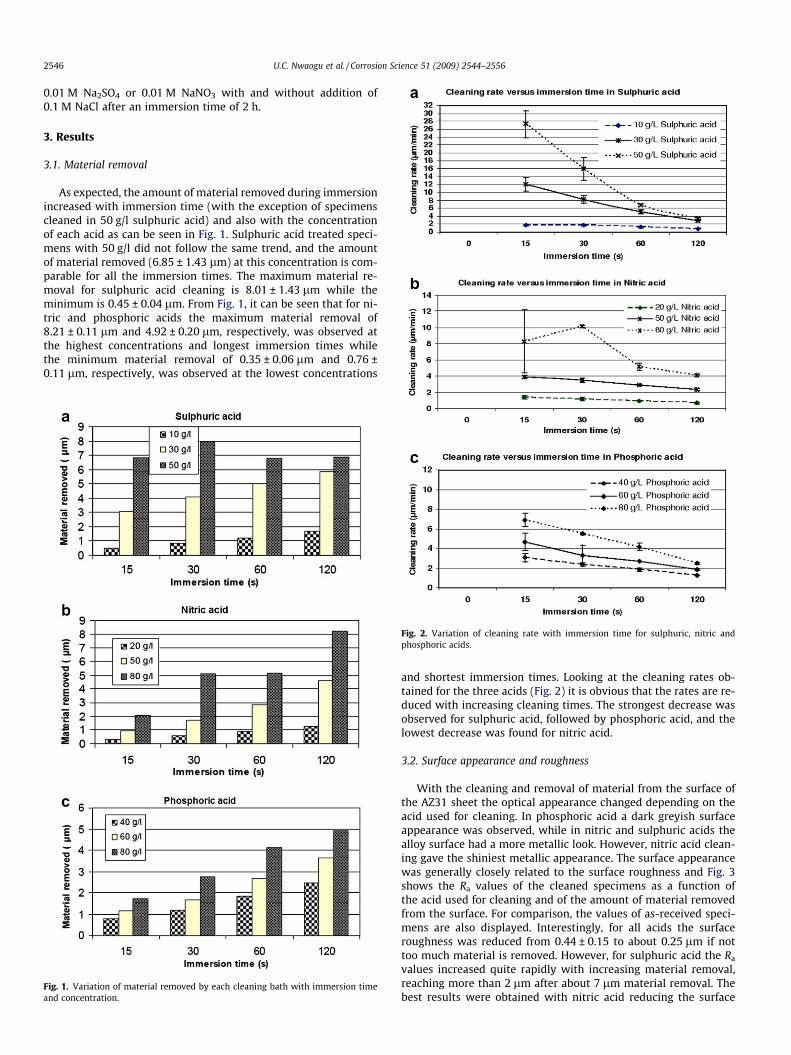
Fig. 2. Variation of cleaning rate with immersion time for sulphuric, nitric andphosphoric acids.
and shortest immersion times. Looking at the cleaning rates ob-tained for the three acids (Fig. 2) it is obvious that the rates are re-duced with increasing cleaning times. The strongest decrease wasobserved for sulphuric acid, followed by phosphoric acid, and thelowest decrease was found for nitric acid.
3.2. Surface appearance and roughness
With the cleaning and removal of material from the surface ofthe AZ31 sheet the optical appearance changed depending on theacid used for cleaning. In phosphoric acid a dark greyish surfaceappearance was observed, while in nitric and sulphuric acids thealloy surface had a more metallic look. However, nitric acid clean-ing gave the shiniest metallic appearance. The surface appearancewas generally closely related to the surface roughness and Fig. 3shows the Ra values of the cleaned specimens as a function ofthe acid used for cleaning and of the amount of material removedfrom the surface. For comparison, the values of as-received speci-mens are also displayed. Interestingly, for all acids the surfaceroughness was reduced from 0.44 ± 0.15 to about 0.25 lm if nottoo much material is removed. However, for sulphuric acid the Ra
values increased quite rapidly with increasing material removal,reaching more than 2 lm after about 7 lm material removal. Thebest results were obtained with nitric acid reducing the surface
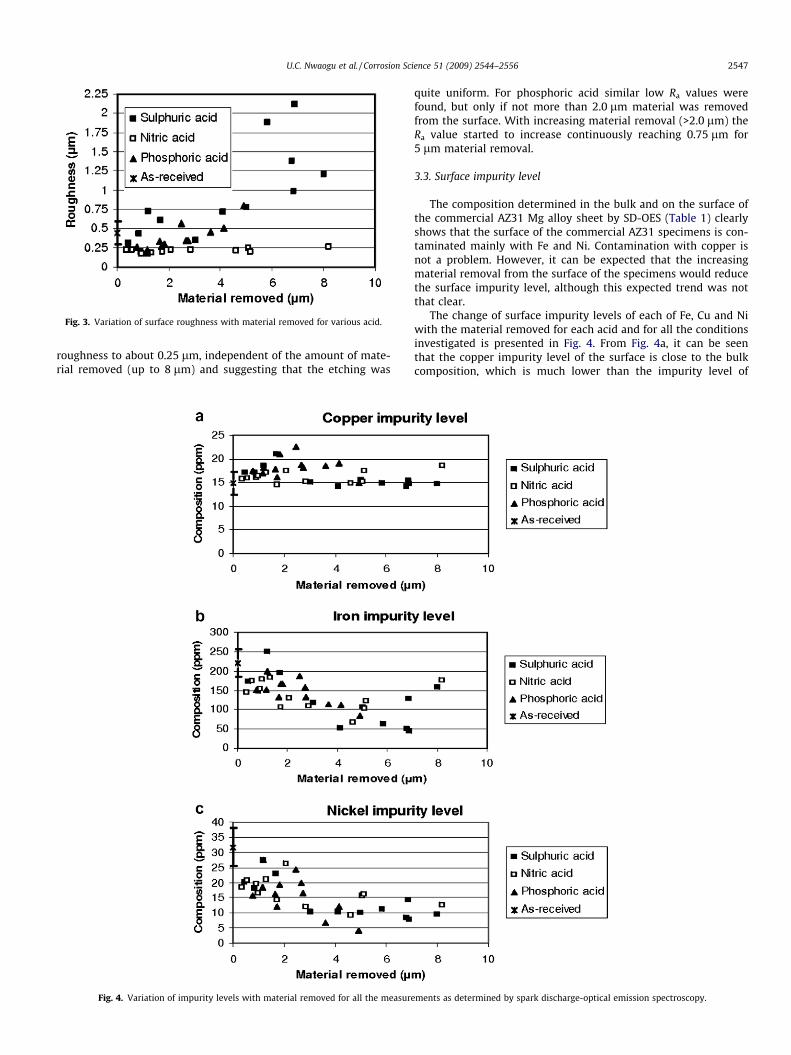
Fig. 3. Variation of surface roughness with material removed for various acid.
U.C. Nwaogu et al. / Corrosion Science 51 (2009) 2544–2556 2547
roughness to about 0.25 lm, independent of the amount of mate-rial removed (up to 8 lm) and suggesting that the etching was
Fig. 4. Variation of impurity levels with material removed for all the measure
quite uniform. For phosphoric acid similar low Ra values werefound, but only if not more than 2.0 lm material was removedfrom the surface. With increasing material removal (>2.0 lm) theRa value started to increase continuously reaching 0.75 lm for5 lm material removal.
3.3. Surface impurity level
The composition determined in the bulk and on the surface ofthe commercial AZ31 Mg alloy sheet by SD-OES (Table 1) clearlyshows that the surface of the commercial AZ31 specimens is con-taminated mainly with Fe and Ni. Contamination with copper isnot a problem. However, it can be expected that the increasingmaterial removal from the surface of the specimens would reducethe surface impurity level, although this expected trend was notthat clear.
The change of surface impurity levels of each of Fe, Cu and Niwith the material removed for each acid and for all the conditionsinvestigated is presented in Fig. 4. From Fig. 4a, it can be seenthat the copper impurity level of the surface is close to the bulkcomposition, which is much lower than the impurity level of
ments as determined by spark discharge-optical emission spectroscopy.
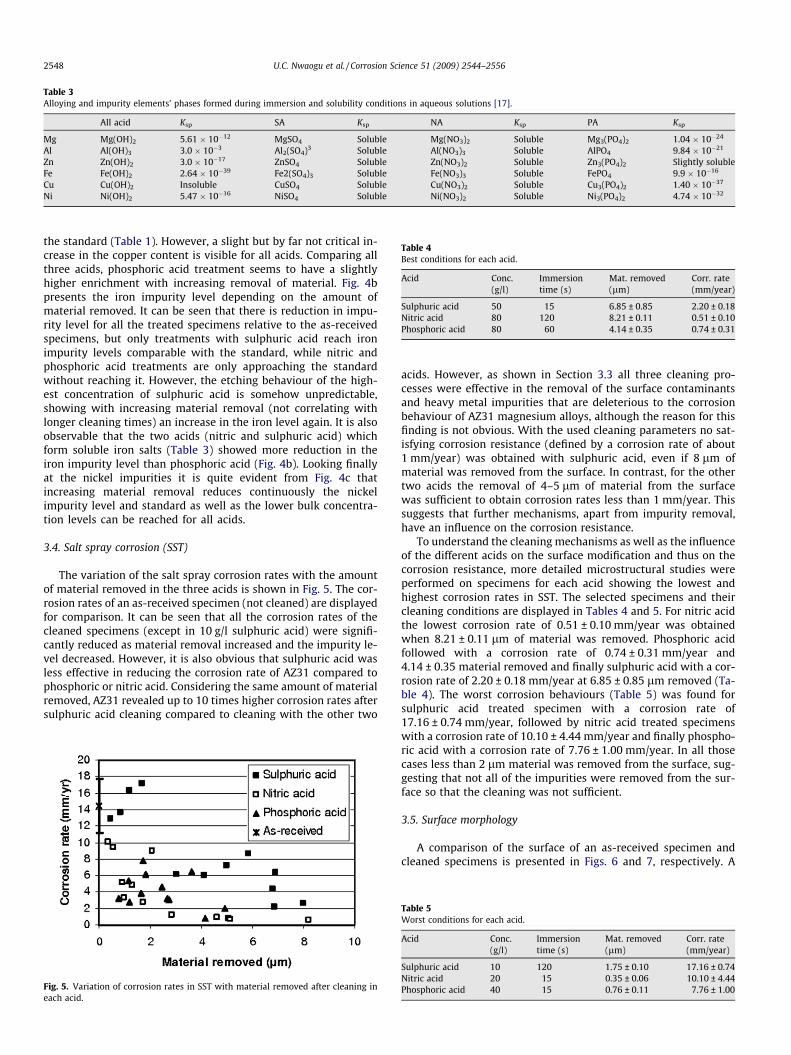
Table 3Alloying and impurity elements’ phases formed during immersion and solubility conditions in aqueous solutions [17].
All acid Ksp SA Ksp NA Ksp PA Ksp
Mg Mg(OH)2 5.61 � 10�12 MgSO4 Soluble Mg(NO3)2 Soluble Mg3(PO4)2 1.04 � 10�24
Al Al(OH)3 3.0 � 10�3 Al2(SO4)3 Soluble Al(NO3)3 Soluble AlPO4 9.84 � 10�21
Zn Zn(OH)2 3.0 � 10�17 ZnSO4 Soluble Zn(NO3)2 Soluble Zn3(PO4)2 Slightly solubleFe Fe(OH)2 2.64 � 10�39 Fe2(SO4)3 Soluble Fe(NO3)3 Soluble FePO4 9.9 � 10�16
Cu Cu(OH)2 Insoluble CuSO4 Soluble Cu(NO3)2 Soluble Cu3(PO4)2 1.40 � 10�37
Ni Ni(OH)2 5.47 � 10�16 NiSO4 Soluble Ni(NO3)2 Soluble Ni3(PO4)2 4.74 � 10�32
Table 4Best conditions for each acid.
Acid Conc.(g/l)
Immersiontime (s)
Mat. removed(lm)
Corr. rate(mm/year)
Sulphuric acid 50 15 6.85 ± 0.85 2.20 ± 0.18Nitric acid 80 120 8.21 ± 0.11 0.51 ± 0.10Phosphoric acid 80 60 4.14 ± 0.35 0.74 ± 0.31
2548 U.C. Nwaogu et al. / Corrosion Science 51 (2009) 2544–2556
the standard (Table 1). However, a slight but by far not critical in-crease in the copper content is visible for all acids. Comparing allthree acids, phosphoric acid treatment seems to have a slightlyhigher enrichment with increasing removal of material. Fig. 4bpresents the iron impurity level depending on the amount ofmaterial removed. It can be seen that there is reduction in impu-rity level for all the treated specimens relative to the as-receivedspecimens, but only treatments with sulphuric acid reach ironimpurity levels comparable with the standard, while nitric andphosphoric acid treatments are only approaching the standardwithout reaching it. However, the etching behaviour of the high-est concentration of sulphuric acid is somehow unpredictable,showing with increasing material removal (not correlating withlonger cleaning times) an increase in the iron level again. It is alsoobservable that the two acids (nitric and sulphuric acid) whichform soluble iron salts (Table 3) showed more reduction in theiron impurity level than phosphoric acid (Fig. 4b). Looking finallyat the nickel impurities it is quite evident from Fig. 4c thatincreasing material removal reduces continuously the nickelimpurity level and standard as well as the lower bulk concentra-tion levels can be reached for all acids.
3.4. Salt spray corrosion (SST)
The variation of the salt spray corrosion rates with the amountof material removed in the three acids is shown in Fig. 5. The cor-rosion rates of an as-received specimen (not cleaned) are displayedfor comparison. It can be seen that all the corrosion rates of thecleaned specimens (except in 10 g/l sulphuric acid) were signifi-cantly reduced as material removal increased and the impurity le-vel decreased. However, it is also obvious that sulphuric acid wasless effective in reducing the corrosion rate of AZ31 compared tophosphoric or nitric acid. Considering the same amount of materialremoved, AZ31 revealed up to 10 times higher corrosion rates aftersulphuric acid cleaning compared to cleaning with the other two
Fig. 5. Variation of corrosion rates in SST with material removed after cleaning ineach acid.
acids. However, as shown in Section 3.3 all three cleaning pro-cesses were effective in the removal of the surface contaminantsand heavy metal impurities that are deleterious to the corrosionbehaviour of AZ31 magnesium alloys, although the reason for thisfinding is not obvious. With the used cleaning parameters no sat-isfying corrosion resistance (defined by a corrosion rate of about1 mm/year) was obtained with sulphuric acid, even if 8 lm ofmaterial was removed from the surface. In contrast, for the othertwo acids the removal of 4–5 lm of material from the surfacewas sufficient to obtain corrosion rates less than 1 mm/year. Thissuggests that further mechanisms, apart from impurity removal,have an influence on the corrosion resistance.
To understand the cleaning mechanisms as well as the influenceof the different acids on the surface modification and thus on thecorrosion resistance, more detailed microstructural studies wereperformed on specimens for each acid showing the lowest andhighest corrosion rates in SST. The selected specimens and theircleaning conditions are displayed in Tables 4 and 5. For nitric acidthe lowest corrosion rate of 0.51 ± 0.10 mm/year was obtainedwhen 8.21 ± 0.11 lm of material was removed. Phosphoric acidfollowed with a corrosion rate of 0.74 ± 0.31 mm/year and4.14 ± 0.35 material removed and finally sulphuric acid with a cor-rosion rate of 2.20 ± 0.18 mm/year at 6.85 ± 0.85 lm removed (Ta-ble 4). The worst corrosion behaviours (Table 5) was found forsulphuric acid treated specimen with a corrosion rate of17.16 ± 0.74 mm/year, followed by nitric acid treated specimenswith a corrosion rate of 10.10 ± 4.44 mm/year and finally phospho-ric acid with a corrosion rate of 7.76 ± 1.00 mm/year. In all thosecases less than 2 lm material was removed from the surface, sug-gesting that not all of the impurities were removed from the sur-face so that the cleaning was not sufficient.
3.5. Surface morphology
A comparison of the surface of an as-received specimen andcleaned specimens is presented in Figs. 6 and 7, respectively. A
Table 5Worst conditions for each acid.
Acid Conc.(g/l)
Immersiontime (s)
Mat. removed(lm)
Corr. rate(mm/year)
Sulphuric acid 10 120 1.75 ± 0.10 17.16 ± 0.74Nitric acid 20 15 0.35 ± 0.06 10.10 ± 4.44Phosphoric acid 40 15 0.76 ± 0.11 7.76 ± 1.00
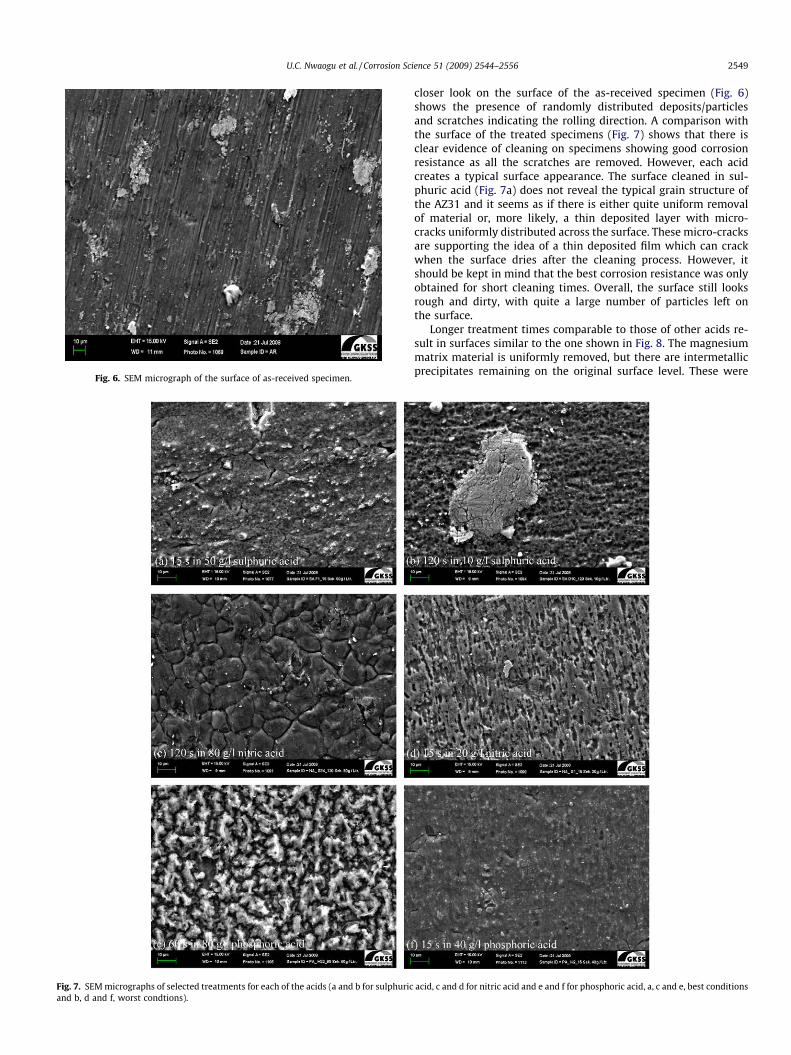
Fig. 6. SEM micrograph of the surface of as-received specimen.
Fig. 7. SEM micrographs of selected treatments for each of the acids (a and b for sulphuricand b, d and f, worst condtions).
U.C. Nwaogu et al. / Corrosion Science 51 (2009) 2544–2556 2549
closer look on the surface of the as-received specimen (Fig. 6)shows the presence of randomly distributed deposits/particlesand scratches indicating the rolling direction. A comparison withthe surface of the treated specimens (Fig. 7) shows that there isclear evidence of cleaning on specimens showing good corrosionresistance as all the scratches are removed. However, each acidcreates a typical surface appearance. The surface cleaned in sul-phuric acid (Fig. 7a) does not reveal the typical grain structure ofthe AZ31 and it seems as if there is either quite uniform removalof material or, more likely, a thin deposited layer with micro-cracks uniformly distributed across the surface. These micro-cracksare supporting the idea of a thin deposited film which can crackwhen the surface dries after the cleaning process. However, itshould be kept in mind that the best corrosion resistance was onlyobtained for short cleaning times. Overall, the surface still looksrough and dirty, with quite a large number of particles left onthe surface.
Longer treatment times comparable to those of other acids re-sult in surfaces similar to the one shown in Fig. 8. The magnesiummatrix material is uniformly removed, but there are intermetallicprecipitates remaining on the original surface level. These were
acid, c and d for nitric acid and e and f for phosphoric acid, a, c and e, best conditions

Fig. 8. SEM micrograph of cleaned surface for 120 s in sulphuric acid.
2550 U.C. Nwaogu et al. / Corrosion Science 51 (2009) 2544–2556
not undermined by the etching treatment and are sticking out ofthe surface explaining the increasing surface roughness anddecreasing corrosion resistance observed. In contrast, the speci-mens cleaned in nitric acid were strongly but relatively uniformlyetched and the typical microstructure of AZ31 with grains andgrain boundaries became visible (Fig. 7c). The surface looks reason-ably clean with only a few particles and deposits left on the sur-face. This is consistent with the observed shiny metallic opticalappearance. After phosphoric acid cleaning the surface (Fig. 7e) iscovered with small island patches, which are most likely phos-phates deposited on the surface. This morphology is similar tothe surface appearance of phosphate conversion coatings on mag-nesium alloy AZ91D as reported by Zhou et al. [11]. The formationof this surface layer may have impeded further dissolution of thesubstrate by creating a barrier between the substrate and thecleaning solution, explaining the lowest amount of material re-moval for phosphoric acid.
All of the sufficiently cleaned surfaces (except those cleanedwith sulphuric acid) reveal a clear reduction in the amount of par-ticles or deposits on the surface. There are holes in the surfacewhich were previously occupied by the particles. Due to the etch-ing and the galvanic effect the matrix was removed and these werefallen out of the surface. The presence of particles for which theprocess of being removed from the matrix was interrupted is alsovisible. The etching/cleaning time was not long enough to removethe whole matrix around these particles, so that they are still stick-ing in the surface, surrounded by a trench of enhanced removedmatrix. However, for sulphuric acid this undermining of particleswas not observed. The material around the particles was removed,but the removal proceeded not underneath the particle so thatthey were not falling out of the surface, but remained on thesurface.
Turning to the surface appearance of specimen with the poorestcorrosion resistance it is clear that there was not sufficient cleaningprogress because the cleaning times were too short and/or the con-centration of the acid was too weak. The surface cleaned in very di-luted sulphuric acid (Fig. 7b) has still the same deposits/particleson the surface as the as-received material, even though thescratches were removed. Similar features are visible for nitric acid(Fig. 7d), when low concentration of the acid and the cleaning timewas not enough to allow for sufficient material removal. Even thescratches were not completely removed, and the structure-less,strongly deformed top surface is still visible as only 0.35 lm whereremoved. For phosphoric acid the surface appears to be free fromany surface coverage, and removal of about 0.75 lm was obviously
sufficient to remove the scratches and the strongly deformed toplayer (Fig. 7f). However, some contaminants and particles are stillpresent on the surface. Some micro-cracks are also visible indicat-ing that probably a thin phosphate film already exists on the sur-face which cracks when the film dries.
3.6. Surface phases and elemental composition
The infrared spectra taken from the surfaces of an as-receivedspecimen and cleaned specimens are presented in Fig. 9. The spec-tra of cleaned specimens (Fig. 9b–d) have some bands similar tothose present in the spectrum of the as-received specimen(Fig. 9a). In addition, the spectra of cleaned specimens show bandsemanating from the products (salts) of the reaction of the acidswith the substrate elements. The bands similarity in the spectrais characteristic of a series of closely related (iso-structural) com-pounds [12]. The compounds present on the surface of cleanedspecimens according to the acid used include sulphates, nitratesor phosphates of the major divalent and trivalent metals. Their oxi-des and hydroxides are also present, but at a lower intensity. Thereis also presence of carbon dioxide (CO2) gas due to adsorption ofthe atmospheric carbon dioxide on the surface of the substrate orCO2 belonging to the unsatisfying background compensation sincethe analytical chamber was not evacuated with nitrogen. Some ofthis CO2 will react with moisture to form carbonates on the surfaceof the specimens.
The possible reaction products between the alloy and the clean-ing solutions are given in Table 3. The solubility constants Ksp ofthe possible compounds (salts) are provided to estimate whethera protective film may form on the surface of the substrate. Fromthe information given in Table 3 for the alloying elements andthe base metal, all the sulphates and nitrates formed are solublein aqueous solution; therefore, it is unlikely that they will formprotective films on the surface of the substrate. However, the phos-phates of the alloying elements and of the base metal are insoluble.This means that phosphate films composed of alloying elementsand of the base metal are possibly formed on the surface of thesubstrate (Fig. 7e). This might create a protective layer on the sur-face of the substrate. Formation and stability of Mg phosphate(Ksp = 1.04 � 10�24) should be better than those of the phosphatesof the alloying elements (for Al phosphate, Ksp = 9.84 � 10�21 andZn phosphate is slightly soluble). There is also hydroxide film for-mation on the surfaces of the substrate after the cleaning process,mainly due to the neutralisation after the acid cleaning done in 1 MNaOH solution, but also due to the reaction of the cleaned surfaceswith water vapour or moisture. These hydroxides are more or lessinsoluble in aqueous solution at the neutral pH of the corrosivemedium and can provide additional protective coverage on thesurface of the substrate. However, from the hydroxide peaks inthe spectra (Fig. 9), the amount appears to be quite low. Further-more, it is evident that remains of the cleaning operation existon the surface even for the soluble compounds, thus SO4
2� andNO3
� anions were detected on the surface, but at much lower lev-els compared to PO4
3�. The real amount can not be determinedwith the characterisation methods available, but at least traces ofthem were still present.
Additional information about the elements present at the sur-faces was gained by XRF analysis, shown in Fig. 10. All surfaces re-veal a significant percentage of oxygen (Fig. 10a). The source of thisoxygen could be the acid anions, CO2 and probably the presence ofoxides and hydroxides which formed during neutralisation andduring storage after the cleaning process. Support for the assump-tion of phosphate layer formation is visible in the surface enrich-ment with phosphorus (Fig. 10b) and also the enrichment of thesurface with sulphur in the case of sulphuric acid cleaning(Fig. 10c), suggesting the presence of sulphate anions is confirmed.
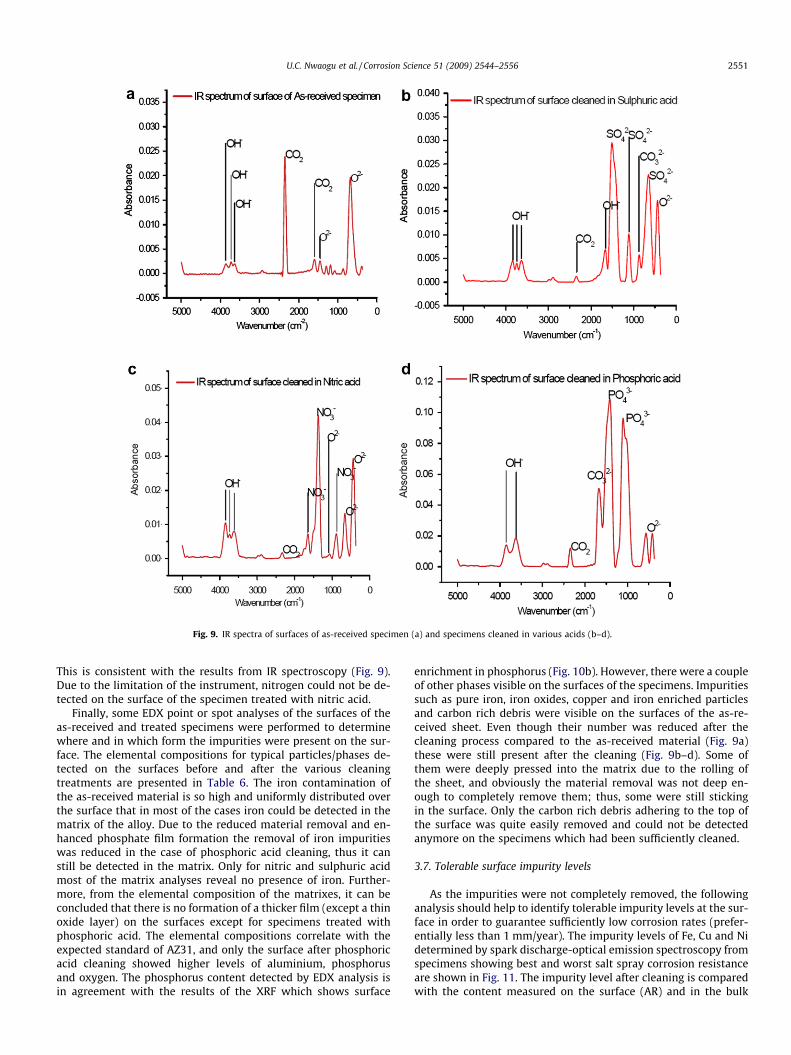
Fig. 9. IR spectra of surfaces of as-received specimen (a) and specimens cleaned in various acids (b–d).
U.C. Nwaogu et al. / Corrosion Science 51 (2009) 2544–2556 2551
This is consistent with the results from IR spectroscopy (Fig. 9).Due to the limitation of the instrument, nitrogen could not be de-tected on the surface of the specimen treated with nitric acid.
Finally, some EDX point or spot analyses of the surfaces of theas-received and treated specimens were performed to determinewhere and in which form the impurities were present on the sur-face. The elemental compositions for typical particles/phases de-tected on the surfaces before and after the various cleaningtreatments are presented in Table 6. The iron contamination ofthe as-received material is so high and uniformly distributed overthe surface that in most of the cases iron could be detected in thematrix of the alloy. Due to the reduced material removal and en-hanced phosphate film formation the removal of iron impuritieswas reduced in the case of phosphoric acid cleaning, thus it canstill be detected in the matrix. Only for nitric and sulphuric acidmost of the matrix analyses reveal no presence of iron. Further-more, from the elemental composition of the matrixes, it can beconcluded that there is no formation of a thicker film (except a thinoxide layer) on the surfaces except for specimens treated withphosphoric acid. The elemental compositions correlate with theexpected standard of AZ31, and only the surface after phosphoricacid cleaning showed higher levels of aluminium, phosphorusand oxygen. The phosphorus content detected by EDX analysis isin agreement with the results of the XRF which shows surface
enrichment in phosphorus (Fig. 10b). However, there were a coupleof other phases visible on the surfaces of the specimens. Impuritiessuch as pure iron, iron oxides, copper and iron enriched particlesand carbon rich debris were visible on the surfaces of the as-re-ceived sheet. Even though their number was reduced after thecleaning process compared to the as-received material (Fig. 9a)these were still present after the cleaning (Fig. 9b–d). Some ofthem were deeply pressed into the matrix due to the rolling ofthe sheet, and obviously the material removal was not deep en-ough to completely remove them; thus, some were still stickingin the surface. Only the carbon rich debris adhering to the top ofthe surface was quite easily removed and could not be detectedanymore on the specimens which had been sufficiently cleaned.
3.7. Tolerable surface impurity levels
As the impurities were not completely removed, the followinganalysis should help to identify tolerable impurity levels at the sur-face in order to guarantee sufficiently low corrosion rates (prefer-entially less than 1 mm/year). The impurity levels of Fe, Cu and Nidetermined by spark discharge-optical emission spectroscopy fromspecimens showing best and worst salt spray corrosion resistanceare shown in Fig. 11. The impurity level after cleaning is comparedwith the content measured on the surface (AR) and in the bulk
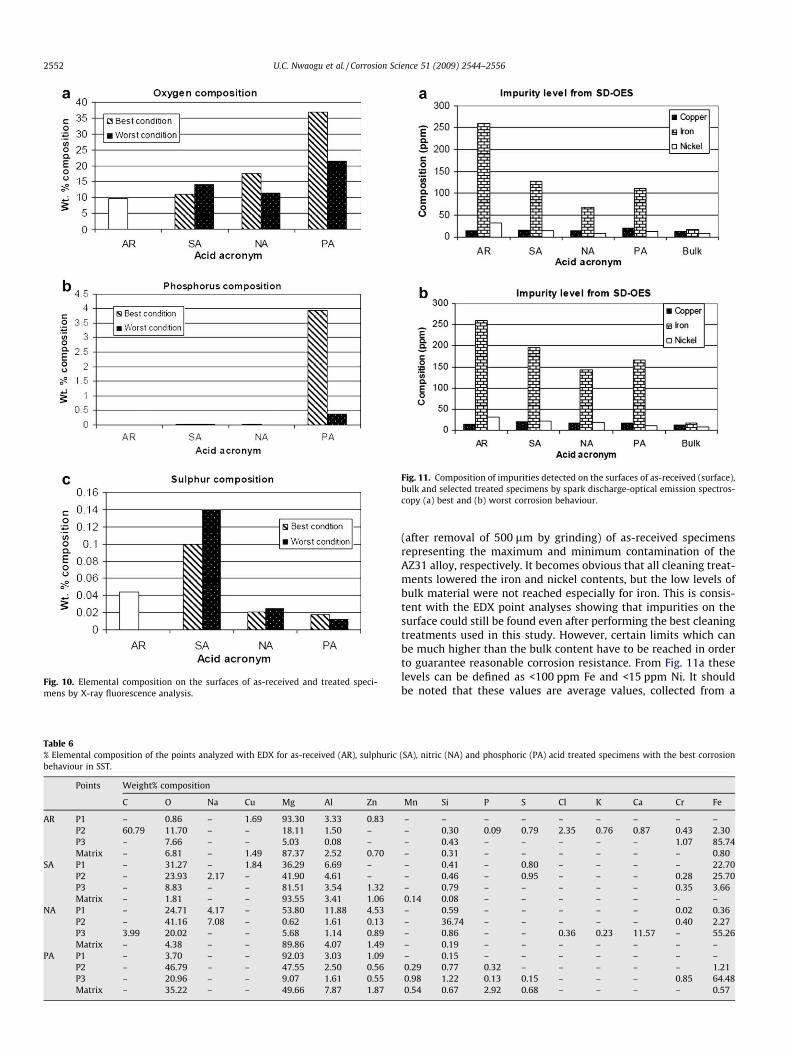
Fig. 10. Elemental composition on the surfaces of as-received and treated speci-mens by X-ray fluorescence analysis.
Table 6% Elemental composition of the points analyzed with EDX for as-received (AR), sulphuricbehaviour in SST.
Points Weight% composition
C O Na Cu Mg Al Zn
AR P1 – 0.86 – 1.69 93.30 3.33 0.83P2 60.79 11.70 – – 18.11 1.50 –P3 – 7.66 – – 5.03 0.08 –Matrix – 6.81 – 1.49 87.37 2.52 0.70
SA P1 – 31.27 – 1.84 36.29 6.69 –P2 – 23.93 2.17 – 41.90 4.61 –P3 – 8.83 – – 81.51 3.54 1.32Matrix – 1.81 – – 93.55 3.41 1.06
NA P1 – 24.71 4.17 – 53.80 11.88 4.53P2 – 41.16 7.08 – 0.62 1.61 0.13P3 3.99 20.02 – – 5.68 1.14 0.89Matrix – 4.38 – – 89.86 4.07 1.49
PA P1 – 3.70 – – 92.03 3.03 1.09P2 – 46.79 – – 47.55 2.50 0.56P3 – 20.96 – – 9.07 1.61 0.55Matrix – 35.22 – – 49.66 7.87 1.87
Fig. 11. Composition of impurities detected on the surfaces of as-received (surface),bulk and selected treated specimens by spark discharge-optical emission spectros-copy (a) best and (b) worst corrosion behaviour.
2552 U.C. Nwaogu et al. / Corrosion Science 51 (2009) 2544–2556
(after removal of 500 lm by grinding) of as-received specimensrepresenting the maximum and minimum contamination of theAZ31 alloy, respectively. It becomes obvious that all cleaning treat-ments lowered the iron and nickel contents, but the low levels ofbulk material were not reached especially for iron. This is consis-tent with the EDX point analyses showing that impurities on thesurface could still be found even after performing the best cleaningtreatments used in this study. However, certain limits which canbe much higher than the bulk content have to be reached in orderto guarantee reasonable corrosion resistance. From Fig. 11a theselevels can be defined as <100 ppm Fe and <15 ppm Ni. It shouldbe noted that these values are average values, collected from a
(SA), nitric (NA) and phosphoric (PA) acid treated specimens with the best corrosion
Mn Si P S Cl K Ca Cr Fe
– – – – – – – – –– 0.30 0.09 0.79 2.35 0.76 0.87 0.43 2.30– 0.43 – – – – – 1.07 85.74– 0.31 – – – – – – 0.80– 0.41 – 0.80 – – – – 22.70– 0.46 – 0.95 – – – 0.28 25.70– 0.79 – – – – – 0.35 3.660.14 0.08 – – – – – – –– 0.59 – – – – – 0.02 0.36– 36.74 – – – – – 0.40 2.27– 0.86 – – 0.36 0.23 11.57 – 55.26– 0.19 – – – – – – –– 0.15 – – – – – – –0.29 0.77 0.32 – – – – – 1.210.98 1.22 0.13 0.15 – – – 0.85 64.480.54 0.67 2.92 0.68 – – – – 0.57
U.C. Nwaogu et al. / Corrosion Science 51 (2009) 2544–2556 2553
depth of down to 100 lm from the top surface, and thus the valuesmeasured close to the surface might be even higher. Such lowimpurity levels in combination with low corrosion rates can onlybe obtained with nitric and phosphoric acid treated specimens.This could be attributed to the extent of etching for nitric acidand to mainly protective phosphate film formation for phosphoricacid. For sulphuric acid treatment, no corrosion rates lower than2 mm/year were observed even if the above specified tolerancelevels were achieved. In contrast, the corrosion resistance de-creased with increasing cleaning times and with reduced impuritylevels. Hence, the results of sulphuric acid in Fig. 11a were takenafter 15 s of etching and not for 120 s as for the other two acids.From this unexpected result it must be concluded that sulphuricacid is not suitable for cleaning AZ31 sheet if bare corrosion resis-tance is required. Most likely this is related to the observed pecu-liar etching behaviour not removing noble intermetallic phasesfrom the surface and thus creating sources for strong galvanic cor-rosion on the surface.
The copper level even on the surface of the as-received condi-tion was very low and was not a problem at all. Therefore, cleaningwith all the acids had no real effect on the copper impurity level.Some results indicate slightly higher levels after cleaning, whichmight indicate some enrichment of copper at the surface afteretching (re-deposition of Cu metal on the surface during etching)or, even more likely, just variations of the alloy composition.
Carbon is another element that was found on the surface of theas-received sheet. However, compared to the other impurities it is
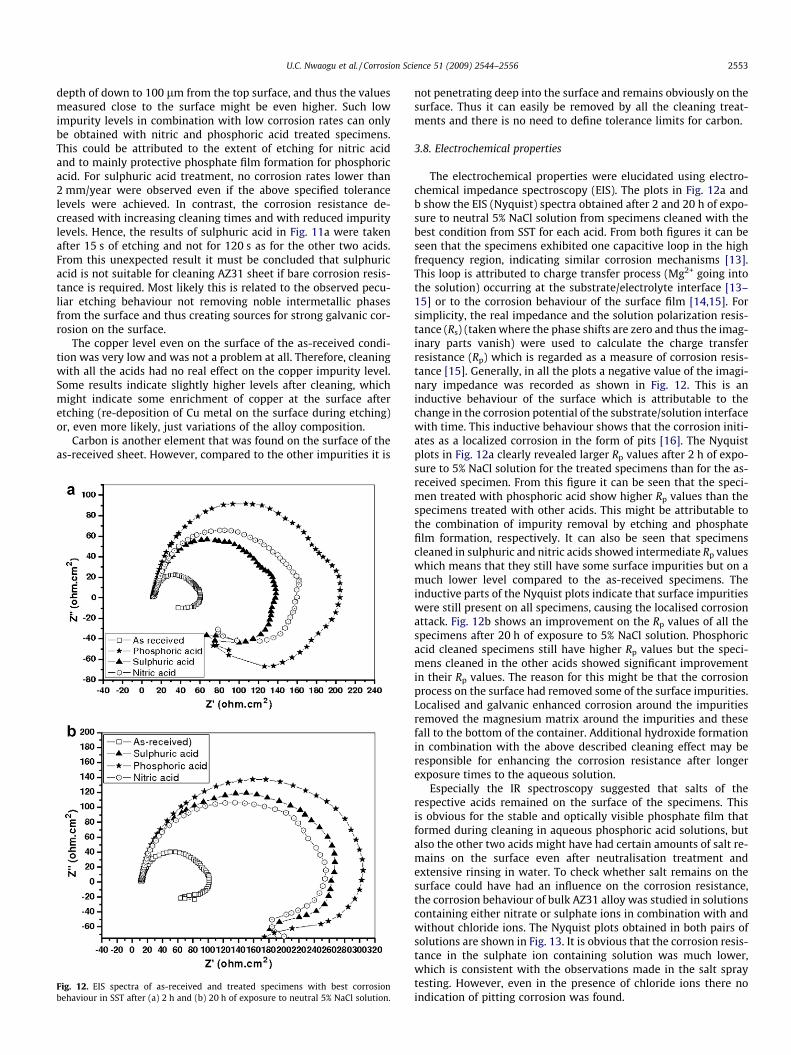
Fig. 12. EIS spectra of as-received and treated specimens with best corrosionbehaviour in SST after (a) 2 h and (b) 20 h of exposure to neutral 5% NaCl solution.
not penetrating deep into the surface and remains obviously on thesurface. Thus it can easily be removed by all the cleaning treat-ments and there is no need to define tolerance limits for carbon.
3.8. Electrochemical properties
The electrochemical properties were elucidated using electro-chemical impedance spectroscopy (EIS). The plots in Fig. 12a andb show the EIS (Nyquist) spectra obtained after 2 and 20 h of expo-sure to neutral 5% NaCl solution from specimens cleaned with thebest condition from SST for each acid. From both figures it can beseen that the specimens exhibited one capacitive loop in the highfrequency region, indicating similar corrosion mechanisms [13].This loop is attributed to charge transfer process (Mg2+ going intothe solution) occurring at the substrate/electrolyte interface [13–15] or to the corrosion behaviour of the surface film [14,15]. Forsimplicity, the real impedance and the solution polarization resis-tance (Rs) (taken where the phase shifts are zero and thus the imag-inary parts vanish) were used to calculate the charge transferresistance (Rp) which is regarded as a measure of corrosion resis-tance [15]. Generally, in all the plots a negative value of the imagi-nary impedance was recorded as shown in Fig. 12. This is aninductive behaviour of the surface which is attributable to thechange in the corrosion potential of the substrate/solution interfacewith time. This inductive behaviour shows that the corrosion initi-ates as a localized corrosion in the form of pits [16]. The Nyquistplots in Fig. 12a clearly revealed larger Rp values after 2 h of expo-sure to 5% NaCl solution for the treated specimens than for the as-received specimen. From this figure it can be seen that the speci-men treated with phosphoric acid show higher Rp values than thespecimens treated with other acids. This might be attributable tothe combination of impurity removal by etching and phosphatefilm formation, respectively. It can also be seen that specimenscleaned in sulphuric and nitric acids showed intermediate Rp valueswhich means that they still have some surface impurities but on amuch lower level compared to the as-received specimens. Theinductive parts of the Nyquist plots indicate that surface impuritieswere still present on all specimens, causing the localised corrosionattack. Fig. 12b shows an improvement on the Rp values of all thespecimens after 20 h of exposure to 5% NaCl solution. Phosphoricacid cleaned specimens still have higher Rp values but the speci-mens cleaned in the other acids showed significant improvementin their Rp values. The reason for this might be that the corrosionprocess on the surface had removed some of the surface impurities.Localised and galvanic enhanced corrosion around the impuritiesremoved the magnesium matrix around the impurities and thesefall to the bottom of the container. Additional hydroxide formationin combination with the above described cleaning effect may beresponsible for enhancing the corrosion resistance after longerexposure times to the aqueous solution.
Especially the IR spectroscopy suggested that salts of therespective acids remained on the surface of the specimens. Thisis obvious for the stable and optically visible phosphate film thatformed during cleaning in aqueous phosphoric acid solutions, butalso the other two acids might have had certain amounts of salt re-mains on the surface even after neutralisation treatment andextensive rinsing in water. To check whether salt remains on thesurface could have had an influence on the corrosion resistance,the corrosion behaviour of bulk AZ31 alloy was studied in solutionscontaining either nitrate or sulphate ions in combination with andwithout chloride ions. The Nyquist plots obtained in both pairs ofsolutions are shown in Fig. 13. It is obvious that the corrosion resis-tance in the sulphate ion containing solution was much lower,which is consistent with the observations made in the salt spraytesting. However, even in the presence of chloride ions there noindication of pitting corrosion was found.

Fig. 13. EIS spectra obtained in solutions of 0.01 M NaNO3 and 0.01 M Na2SO4 withor without addition of 0.1 M NaCl.
2554 U.C. Nwaogu et al. / Corrosion Science 51 (2009) 2544–2556
4. Discussion
All inorganic acid based cleaning solutions can be adjusted toremove about 5 lm from the surface of the AZ31 alloy sheet within1 min of cleaning operation. This is important as the minimumamount of removal in order to guarantee a sufficiently good corro-sion resistance identified by salt spray corrosion performance was5 lm. However, there are distinct differences between the threeacids not only in the cleaning effectiveness but also in the cleaningmechanisms and the final appearance and performance of thecleaned surfaces. This will be discussed in more detail in thefollowing.
Considering the initial cleaning rates it is obvious that sulphuricacid is the most aggressive acid if the concentration exceeds 30 g/l.For the highest concentration an average cleaning rate of 27 lm/min was determined within the first 15 s. The highest phosphoricand nitric acid concentrations used both exhibited similar rateswhich were remarkably lower compared to sulphuric acid, namely7 and 8 lm/min, respectively. However, this is surprising if theeffective H+ ion concentrations (pH values) are considered as anindicator for the cleaning effectiveness. The highest H+ ion concen-tration was measured for the nitric acid solution (pH 1.04), fol-lowed by sulphuric (pH 1.22) and finally phosphoric acid (pH1.72) solution. This indicates that the processes at the surface aremuch more complex and that also the anions may play a crucialrole in preventing or not forming protective films. However, theinitially very high cleaning rates are greatly reduced for all acidsif longer cleaning times are considered. The decrease may beattributed to various aspects which can contribute to differentdegrees:
1) Increasing removal of impurities resulting in more ‘‘cleaningresistant” surfaces.
2) Formation of protective reaction layers which can reduce thematerial removal.
3) Formation of gas envelopes around the specimens whichmay reduce or prevent contact with the cleaning solution.
4) H+ ions close to the surface are consumed and have to bereplaced over longer distances.
The strongest decrease was observed for sulphuric acid, fol-lowed by phosphoric acid and finally the lowest decrease wasfound for nitric acid. Averaged over a period of 2 min, the best per-formance was found for nitric acid solution with 4.1 lm/min, fol-lowed by sulphuric acid with 3.5 lm/min and phosphoric acid
with 2.5 lm/min. The latter can be clearly correlated with thephosphate film formation on the surface which is partly protectiveas it grows thicker and denser with increasing exposure to thephosphoric acid based cleaning solution. In nitric and sulphuricacid, such protective reaction layers will not form and hence theother three mechanisms should be responsible for the reducedcleaning rates. The difference between these two acids is not verylarge, but the etching by the nitric acid was much more uniform(see roughness) indicating that the strong hydrogen developmentin the beginning of the cleaning process is detrimental to a uniformcleaning result since it can prevent uniform contact with the clean-ing solution and uniform material removal. This leads to heavilyetched areas and regions with less etching, resulting in high rough-ness values as were observed for sulphuric acid if the cleaning timeincreases. In contrast, nitric acid showed a very uniform etching,indicated by a constant surface roughness independent of thecleaning time, which is also consistent with the nice and shinymetallic surface appearance. Actually, the average roughness val-ues were better than those of the as-received sheet.
Phosphoric and nitric acid showed in the beginning a similarcapability to remove material, but at the end phosphoric acidwas less effective in material removal if longer cleaning timesare considered. This is a result of the film formation on the surfacewhich is also visible in an increasing surface roughness with longercleaning times. As the layer forms and grows, small single nodallike precipitates form and increase in size and thickness which isreflected by the increasing roughness values. These values aremuch lower compared to those for sulphuric acid, but higher thanthose for nitric acid. Another possible disadvantage of the phos-phoric acid treatment is the change in colour to dark grey associ-ated with the film formation and the loss of the shiny metalappearance observed for nitric acid and partly also for sulphuricacid.
The removal of material was not the primary objective, thisbeing still the reduction of surface impurities in order to guaran-tee a good corrosion resistance. Our studies showed that the sur-face is mainly contaminated with heavy metal contaminations(particles) and debris (rich in carbon), which have to be reducedor removed in order to obtain the above objective. As the materialremoval is a question of cost, only the amount absolutely neces-sary should be removed. A first estimate of how much this needsto be can be obtained from the specified composition standard ofthe AZ31 alloy or from the composition of the bulk. The fact thatmainly iron and nickel are enriched indicates that the contamina-tion is due to the rolling process. In spite of this fact also copperwas included in the observation to check whether noble metalsmay enrich during the cleaning/etching process. The bulk of thealloy contains about 15 ppm of Cu which is by far not critical,and even after the longest etching time of 2 min none of thetreatments resulted in contents higher than 25 ppm Cu which isstill considered to be harmless for the corrosion resistance. Theslight increase might result from surface enrichment, as more no-ble precipitates containing Cu will not dissolve that easily, and/orfrom the re-deposition of Cu if it was once dissolved, due to themuch higher electrochemical potential. Furthermore, there seemsto be a slightly higher Cu concentration after cleaning with phos-phoric acid which might be due to the insolubility of the copperphosphate (Table 3) resulting in enhanced nucleation or re-depo-sition of nickel containing phosphate compounds on the surfaceof the substrate.
The iron and nickel contents show more or less the expectedreduction of their content with increasing cleaning time/materialremoval for all acids. However, after cleaning with phosphoric acidthe iron content remained much higher. Beside the fact that thisacid removed less material, another aspect might be that iron alsoforms insoluble phosphate compounds which may remain or
U.C. Nwaogu et al. / Corrosion Science 51 (2009) 2544–2556 2555
re-deposit on the surface. The same would be expected for nickel,but due to the much lower overall content re-deposition may notplay a crucial role. This leads to the question how the impuritiesare actually removed. Are they dissolving as ions or do they precip-itate on the surface when the magnesium matrix is dissolvingaround them during the cleaning process? The observation of thesurface before and after the cleaning treatment suggests that thelatter is the main process. On the surface of the as-received sheetthere are various particles which are pressed into the substrateand debris that seems to sit on the surface. The relative loose deb-ris is removed quite easily. Some of the particles deeper pressedinto the substrate were still visible with rings of enhanced re-moved matrix surrounding them after the cleaning operation.Some smaller particles were fallen out of the matrix, with theremaining holes indicating their former positions. Furthermore,due to the more negative electrochemical potential of the sur-rounding magnesium matrix, dissolution of the impurities shouldbe negligible as long as they are in contact with the matrix. How-ever, once having dropped down to the bottom of the cleaning con-tainers they may slowly dissolve, increasing the level of heavymetal ions in the cleaning solutions and adding to those whichgo directly from the surface into solution.
Also of importance for the cleaning operation are the com-pounds formed by the impurity elements with the respective acids(Table 3). As can be seen, the sulphates and nitrates of the impurityelements are all soluble in aqueous solution. This means that suchcompounds will most likely not form on the surface and that theheavy metal ions will dissolve into the solution keeping the metalcations (Fe, Cu and Ni) on the surface at lower levels. The phos-phates of these impurity elements are insoluble in aqueous solu-tion and may be partly incorporated into the phosphate depositforming on the surface of the specimens. However, in all casesre-deposition of impurity elements might occur as impurity ionscan easily be reduced by the dissolving Mg, especially if the impu-rity concentration in the cleaning solution increases during longercleaning operation. Here, the phosphate solution may have anadditional advantage if heavy metal ions once dissolved precipitatefrom the solution before they can re-deposit on the surface. Theconcentration effect of dissolved heavy metal ions in the differentcleaning solutions will be subject of future studies aiming atanswering these remaining questions.
As in the present study fresh solutions were used for each clean-ing experiment, it is not really surprising that no indication for re-deposition of dissolved impurities from the cleaning solution wasfound. There was no chance that sufficient heavy metal ions wereenriched in the cleaning solutions. Thus, as re-deposition of impu-rities may not play a major role it should be possible to achieve thebulk compositions for longer cleaning times. Therefore, an addi-tional experiment was performed with the optimised nitric acidcleaning conditions but with cleaning times extended to 5 min.The results indicate that the low impurity levels of the bulk canbe obtained at least if a fresh etching solution (without major hea-vy metal concentrations) is used.
Looking at the corrosion rates, it is obvious that with increasingremoval of the contaminated surface the corrosion resistance in-creased for all the acids. This is consistent with a reduction ofthe impurity level. However, the performance of the specimenscleaned in the various acids was different. The best performancein salt spray testing was observed for phosphoric acid and nitricacid cleaning, with the specimens cleaned in the latter acid per-forming slightly better. By far the worst performance was observedfor sulphuric acid cleaning. The good performance of nitric acidcleaned specimens is not surprising as the impurity levels wererather low and the overall surface appearance looked clean,smooth, metallic, and the etching was quite uniform. It is the per-formance of the other two acids which was to some extent unex-
pected. Even though after sulphuric acid cleaning the surface wasrougher and the etching was not that uniform, the obtained impu-rity levels were even lower than those for nitric acid. Thus, onewould expect a corrosion performance being at least comparableto that of the nitric acid. This was not the case, and the reason isnot really obvious. A possible explanation might be the observationthat the undermining process of noble particles during sulphuricacid pickling was limited compared to that in nitric and phosphoricacid. The particle number at the surface remained much higher,thus enhancing galvanic effects and reducing the corrosion resis-tance compared to that resulting from the other two pickling treat-ments. Furthermore, the remains of sulphates and nitrates on thesurface which were observed in the IR spectra even after extensiveneutralisation and rinsing in water may have had an additional ef-fect. The electrochemical studies (Fig. 13) suggest that in the pres-ence of sulphate less corrosion resistant films formed compared tothe presence of nitrate. Combinations with 0.1 M chloride ionsyielded no evidence that the film formation was greatly affectedand that localised corrosion was promoted within 2 h of exposure.The phosphoric acid cleaning lead to a good corrosion resistancecomparable to that achieved by nitric acid, even though theamount of material that was removed was the lowest and theremaining impurity level was the highest of all three acids. Thiswas obviously compensated by the formation of the magnesiumphosphate film on the surface (Fig. 7e) which offered additionalcorrosion protection.
5. Conclusion
According to the results obtained, the acid cleaning processessignificantly reduced the surface impurity levels in AZ31 Mg alloysheet, thereby reducing the formation of micro-galvanic cellswhich decreases its galvanic corrosion susceptibility. However,with reasonable cleaning times and material removal the surfaceswere not completely clean, and low impurity levels of the bulkmaterial were not obtained. Nevertheless, to obtain good corro-sion resistance for AZ31 Mg alloy sheet (1 mm/year for nitricand phosphoric and 2 mm/year for sulphuric acid), 5 lm etchingappears sufficient and would require 1 to 2 min of etching time,depending on the concentration of the cleaning solution. This willensure a reduction in impurity level to tolerance limits less than100 ppm Fe and less than 15 ppm Ni on the surface of the alloy.Other impurities, such as copper or carbon, are not a problem astheir concentration is either too low or they can easily beremoved.
Two of the three acids investigated are a better choice for clean-ing of AZ31 Mg alloy sheet at the concentrations and cleaningtimes used if bare corrosion resistance is required. These acidsare nitric and phosphoric acids. Even though sulphuric acidshowed a reasonable cleaning behaviour, the specimens sufferedfrom poor corrosion resistance although the impurity level wassufficiently low. This might be explained by a less effective re-moval of intermetallic phases as well as by the presence of sul-phate remains on the surface, offering less corrosion protectionthan nitrate remains or thick insoluble phosphate deposits. Amongnitric and phosphoric acids, according to the results of this study, aslightly better corrosion performance was obtained with nitricacid.
Acknowledgements
The work was carried out at GKSS – ForschungszentrumGeesthacht GmbH, Max-Planck-Strasse 1, 21502 Geesthacht, Ger-many. Mr. Ugochukwu Chibuzoh Nwaogu is grateful to the Euro-pean Commission for the scholarship for his studies for JointEuropean Masters in Materials Science (EMMS).
2556 U.C. Nwaogu et al. / Corrosion Science 51 (2009) 2544–2556
References
[1] J.E. Gray, B. Luan, Protective coatings on magnesium and its alloys – a criticalreview, Journal of Alloys and compounds 336 (2002) 88–113.
[2] N. Shikata, Y. Kondou, Y. Nishikawa, Y. Nishizawa, Y. Sakamoto, T. Fujiwaki,Surface-Treated Article of Magnesium or Magnesium alloys, Method of SurfacePreparation and Method of Coating, Patent Cooperation Treaty (PCT), 1999.
[3] J.E. Hillis, Surface Engineering of Magnesium Alloys, vol. 5, Surface EngineeringASM Handbook, 1994.
[4] C.E. Barchiche, E. Rocca, C. Juers, J. Hazan, J. Steinmetz, Corrsion resistance ofplasma-anodized AZ91D magnesium alloy by electrochemical methods,Electrochimica Acta 53 (2007) 417–425.
[5] K.Z. Chong, T.S. Shih, ‘‘Conversion-coating treatment for magnesium alloys by apermanganate- phosphate solution, Material Chemistry and Physics 80 (2003)191–200.
[6] F. Zucchi, V. Grassi, A. Frignani, C. Monticelli, G. Trabanelli, Influence of a silanetreatment on the corrosion resistance of a WE43 magnesium alloy, Surface andCoatings Technology 200 (2006) 4136–4143.
[7] R. Supplit, T. Koch, U. Schubert, Evaluation of the anti-corrosive effect of acidpickling and sol-gel coating on magnesium AZ31 alloy, Corrosion Science 49(2007) 3015–3023.
[8] H. Zhao, Z. Huang, J. Cui, A new method for electroless Ni–P plating on AZ31magnesium alloy, Surface and Coatings Technology 202 (2007) 133–139.
[9] k. Brunelli, M. Dabala, I. Calliari, M. Magrini, Effect of HCl pre-treatment oncorrosion resistance of cerium-based conversion coatings on magnesium andmagnesium alloys, Corrosion Science 47 (2005) 989–1000.
[10] H.H. Elsentriecy, K. Azumi, H. Konno, Effect of surface pretreatment by acidpickling on the density of stannate conversion coatings formed on AZ91 Dmagnesium alloy, Surface and Coatings Technology 202 (2007) 532–537.
[11] W. Zhou, D. Shan, E-H. Han, W. Kei, Structure and formation mechanism ofphosphate conversion coating on die-cast AZ91D magnesium alloy, CorrosionScience 50 (2008) 329–337.
[12] S. Aleksovska, V.M. Petrusevski, B. Soptrajanov, Infrared spectra of themonohydrates of manganese (III) phosphate and manganese (III) arsenate:relation to the compounds of the Kieserite family, Journal of MolecularStructure 408/409 (1997) 413–416.
[13] M. Anik, G. Celikten, Analysis of the electrochemical reaction behaviour ofalloy AZ91 by EIS technique in H3 PO4 /KOH buffered K2 SO4 solutions,Corrosion Science 49 (2007) 1878–1894.
[14] H. Ardelean, I. Frateur, P. Marcus, Corrosion protection of magnesium alloys bycerium, zirconium and niobium-based conversion coatings, Corrosion Science50 (2008) 1907–1918.
[15] K.Y. Chiu, M.H. Wong, F.T. Cheng, H.C. Man, Characterization and corrosionstudies of fluoride conversion coating on degradable Mg implants, Surface andCoatings Technology 202 (2007) 590–598.
[16] R. Ghosh, D.D.N. Singh, Kinetics, mechanism and characterization of passivefilm formed on hot dip galvanized coating exposed in simulated concrete poresolution, Surface and Coatings Technology 201 (2007) 7346–7359.
[17] David R. Lide, H.P.R. Frederike (Eds.), Solubility and Solubility Product ofCompounds, 78th ed., CRC Handbook of Chemistry and Physics, New York, pp.8–106.