
Influence of Index Table Accuracy on Roundness …metrologyindia.org/26/4_Hiroshiya...
10
37 Influence of Index Table Accuracy on Roundness Calibration in the Multi-Step Method Using Monte Carlo Simulation HIROSHI SATO National Metrology Institute of Japan (NMIJ) National Institute of Advanced Industrial Science and Technology (AIST) AIST Central 3, 1-1-1 Umezono, Tsukuba, Ibaraki 305-8563, Japan e-mail: [email protected] [Received: 09.02.2011 ; Revised: 28.02.2011 ; Accepted: 04.03.2011] Abstract The precise and accurate roundness measurement is required year by year. The multi-step method is commonly used in the high-accuracy measurement for the roundness. The multi-step method is the self- calibration of the roundness capable of performing highly-advanced precise measurement. It depends on the reason that is able to separate measurement wave from the spindle rotation component and the form component of hemispherical master. But the mathematical models of the roundness measurement using that method are very complicated, describing numerous parameters and processes. So, recently, the Monte Carlo technique has attracted increasing attention as a very useful method for uncertainty estimation. This paper describes influences of the indexing angle accuracy and the noises generated by the roundness measuring machine, on the roundness measurements, both of which were analyzed by the Monte Carlo simulation. Furthermore, an example of hemispherical master is compared with the actual measurement data between when a reference guide plate is used utilizing the magnetic rotary encoder. © Metrology Society of India, All rights reserved 2011. 1. Indroduction It has been more than 15 years since Guide to the Expression of Uncertainty in Measurement (GUM) was published by seven organizations including ISO, one of the international standardization bodies [1]. In the field of roundness calibration, modeling of the roundness measurement is mainly used to estimate the uncertainty in accordance with GUM. In this modeling method, "combined standard uncertainty" of the dimension of standard deviation is estimated by using the first-order Taylor series approximation and additivity of variance. When the mathematical model becomes complex, however, a simulation technique can be used to estimate the uncertainty. Recently, the Monte Carlo technique has attracted increasing attention as a very useful method for uncertainty estimation [2-3]. Accordingly the International Bureau of Weights and Measures (BIPM) published the Supplement 1 to GUM which stipulates a method to estimate uncertainty by using the Monte Carlo simulation [4]. Almost all the measurement models for geometrical artifacts are very complicated, describing numerous parameters and processes. In the field of roundness measurement as well, the mathematical models are composed of extremely complicated processes and parameters, and use of the MAPAN - Journal of Metrology Society of India, Vol. 26, No. 1, 2011; pp. 37-46 ORIGINAL ARTICLE
Transcript of Influence of Index Table Accuracy on Roundness …metrologyindia.org/26/4_Hiroshiya...

Influence of Index Table Accuracy on Roundness Calibration Using Monte Carlo Simulation
37
Influence of Index Table Accuracy on RoundnessCalibration in the Multi-Step Method Using
Monte Carlo Simulation
HIROSHI SATONational Metrology Institute of Japan (NMIJ)
National Institute of Advanced Industrial Science and Technology (AIST)AIST Central 3, 1-1-1 Umezono, Tsukuba, Ibaraki 305-8563, Japan
e-mail: [email protected]
[Received: 09.02.2011 ; Revised: 28.02.2011 ; Accepted: 04.03.2011]
AbstractThe precise and accurate roundness measurement is required year by year. The multi-step method iscommonly used in the high-accuracy measurement for the roundness. The multi-step method is the self-calibration of the roundness capable of performing highly-advanced precise measurement. It dependson the reason that is able to separate measurement wave from the spindle rotation component and theform component of hemispherical master. But the mathematical models of the roundness measurementusing that method are very complicated, describing numerous parameters and processes. So, recently,the Monte Carlo technique has attracted increasing attention as a very useful method for uncertaintyestimation. This paper describes influences of the indexing angle accuracy and the noises generated bythe roundness measuring machine, on the roundness measurements, both of which were analyzed by theMonte Carlo simulation. Furthermore, an example of hemispherical master is compared with the actualmeasurement data between when a reference guide plate is used utilizing the magnetic rotary encoder.
© Metrology Society of India, All rights reserved 2011.
1. Indroduction
It has been more than 15 years since Guide to theExpression of Uncertainty in Measurement (GUM)was published by seven organizations including ISO,one of the international standardization bodies [1].In the field of roundness calibration, modeling of theroundness measurement is mainly used to estimatethe uncertainty in accordance with GUM. In thismodeling method, "combined standard uncertainty"of the dimension of standard deviation is estimatedby using the first-order Taylor series approximationand additivity of variance. When the mathematical
model becomes complex, however, a simulationtechnique can be used to estimate the uncertainty.
Recently, the Monte Carlo technique has attractedincreasing attention as a very useful method foruncertainty estimation [2-3]. Accordingly theInternational Bureau of Weights and Measures (BIPM)published the Supplement 1 to GUM which stipulatesa method to estimate uncertainty by using the MonteCarlo simulation [4]. Almost all the measurementmodels for geometrical artifacts are very complicated,describing numerous parameters and processes. Inthe field of roundness measurement as well, themathematical models are composed of extremelycomplicated processes and parameters, and use of the
MAPAN - Journal of Metrology Society of India, Vol. 26, No. 1, 2011; pp. 37-46ORIGINAL ARTICLE
Hiroshi Sato
38
filtering makes the uncertainty estimation moredifficult. To address the problem of complexity in theconventional measurement models used in variousfields including dimensional measurement,simulation method has been adopted for theuncertainty estimation as it is useful and effective [5-9].
The glass hemisphere standard (hereinafterreferred to as "the master ball") used for calibratingthe spindles and the roundness measuring machinehas been significantly improved for its accuracy [10],currently featuring roundness of about 10 nm to 20nm. This is attributed not only to the improvement ofthe processing technique but also to the demand forenhanced rigorousness of the measurement. Therefore,the roundness measurement is required to be moreprecise and accurate. In addition, in order to establishunbroken chain of traceability, it has become necessaryto estimate uncertainty of the roundness measurementin accordance with the relevant internationalstandards. In this study, the author focuses on themulti-step method, which is the self-calibration of theroundness capable of performing highly-advancedprecise measurement [11-13].
This paper will report influences of (i) indexingangle accuracy and (ii) noises generated by theroundness measuring machine, on the roundness
measurements, both of which were analyzed by theMonte Carlo simulation.
2. Roundness Measurement
2.1 Roundness Measuring Machine
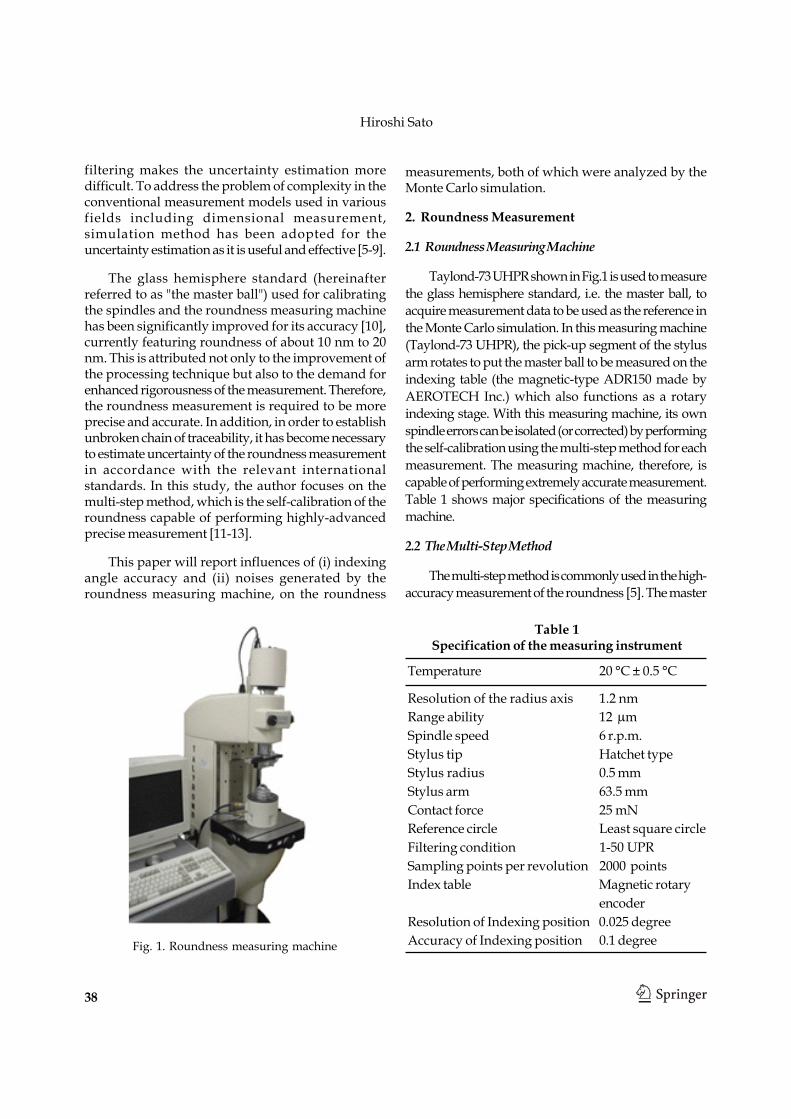
Taylond-73 UHPR shown in Fig.1 is used to measurethe glass hemisphere standard, i.e. the master ball, toacquire measurement data to be used as the reference inthe Monte Carlo simulation. In this measuring machine(Taylond-73 UHPR), the pick-up segment of the stylusarm rotates to put the master ball to be measured on theindexing table (the magnetic-type ADR150 made byAEROTECH Inc.) which also functions as a rotaryindexing stage. With this measuring machine, its ownspindle errors can be isolated (or corrected) by performingthe self-calibration using the multi-step method for eachmeasurement. The measuring machine, therefore, iscapable of performing extremely accurate measurement.Table 1 shows major specifications of the measuringmachine.
2.2 The Multi-Step Method
The multi-step method is commonly used in the high-accuracy measurement of the roundness [5]. The master
Fig. 1. Roundness measuring machine
Table 1Specification of the measuring instrument
Temperature 20 °C ± 0.5 °C
Resolution of the radius axis 1.2 nmRange ability 12 μmSpindle speed 6 r.p.m.Stylus tip Hatchet typeStylus radius 0.5 mmStylus arm 63.5 mmContact force 25 mNReference circle Least square circleFiltering condition 1-50 UPRSampling points per revolution 2000 pointsIndex table Magnetic rotary
encoderResolution of Indexing position 0.025 degreeAccuracy of Indexing position 0.1 degree
Influence of Index Table Accuracy on Roundness Calibration Using Monte Carlo Simulation
39
ball is placed at a pre-determined position on the indexingtable. Several roundness measurements are taken as thephase φ, which is expressed in Eq. (1) based on multi-step number K , is changed at each time.
= − =2 ( 1) ( 1,2, )k k K k Kφ π (1)
Equation (2) shows the measurement data taken at thek-th multi-step;
( ) ( )= − +( )kkS F Eθ θ φ θ (2)
where F(θ)is the form component, E(θ) is the rotarymotion component of the spindle, and S(θ) is thedisplacement detected by the pick-up stylus.
Based on the sum of all the multi-step measurementresults obtained through Eq. (2), the rotary motioncomponent (E(θ)) can be expressed as;
( ) ( )= =
⎧ ⎫⎪ ⎪= − −⎨ ⎬⎪ ⎪⎩ ⎭∑ ∑
1 1
1 ( )K K
k kk k
E S FK
θ θ θ φ (3)
By using Fourier series, the form component (F(θ)) can beexpressed as;
( ) ( ){ }∞
=
= +∑1
( ) cos sinn nn
F a n b nθ θ θ (4)
By using Eqs. (1) and (4), the term of the form componentin Eq. (3) can be expressed as;
( ) ( ){ }∞
= =
− = +∑ ∑1 1
( ) cos sinK
k kn knk n
F K a Kn b Knθ φ θ θ (5)
Therefore, the rotary motion component (E(θ)) can beexpressed as follows;
( ) ( ) ( ){ }∞
= =
= − +∑ ∑1 1
( ) cos sinK
k kn knk n
E S K a Kn b Knθ θ θ θ (6)
Equation (6) indicates that harmonics component ofthe multi-step number is not isolated but accumulated in
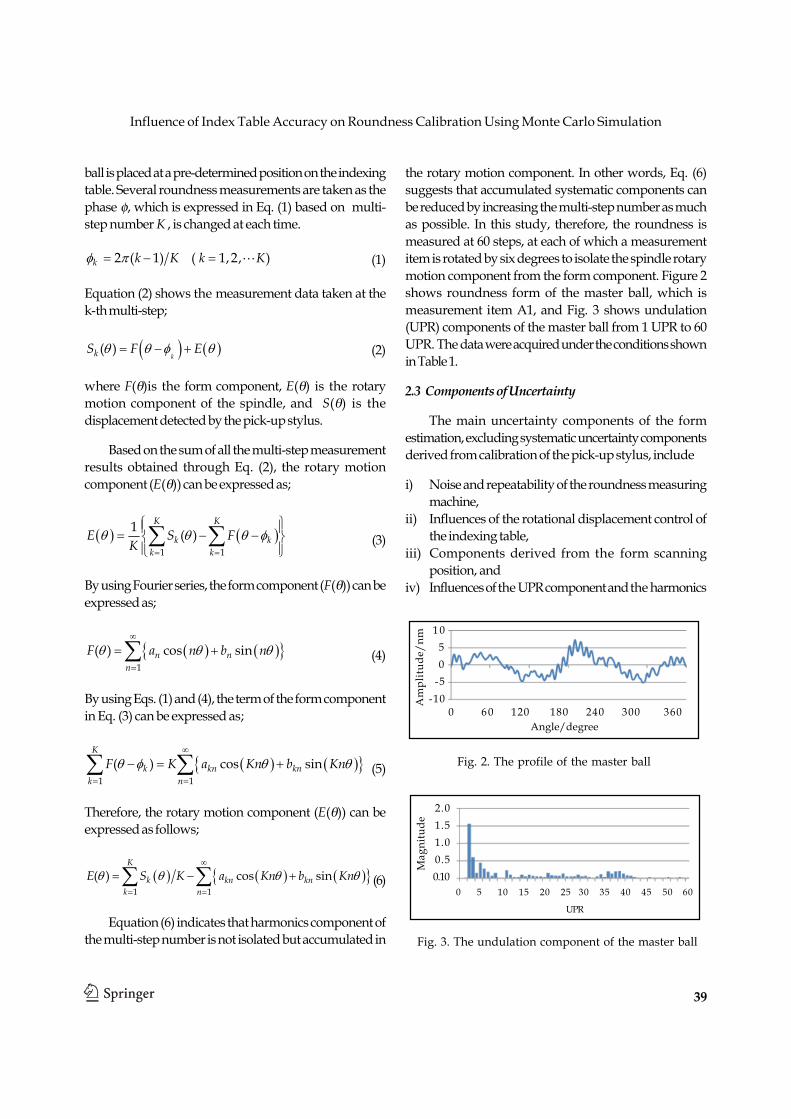
the rotary motion component. In other words, Eq. (6)suggests that accumulated systematic components canbe reduced by increasing the multi-step number as muchas possible. In this study, therefore, the roundness ismeasured at 60 steps, at each of which a measurementitem is rotated by six degrees to isolate the spindle rotarymotion component from the form component. Figure 2shows roundness form of the master ball, which ismeasurement item A1, and Fig. 3 shows undulation(UPR) components of the master ball from 1 UPR to 60UPR. The data were acquired under the conditions shownin Table 1.
2.3 Components of Uncertainty
The main uncertainty components of the formestimation, excluding systematic uncertainty componentsderived from calibration of the pick-up stylus, include
i) Noise and repeatability of the roundness measuringmachine,
ii) Influences of the rotational displacement control ofthe indexing table,
iii) Components derived from the form scanningposition, and
iv) Influences of the UPR component and the harmonics
Fig. 2. The profile of the master ball
Fig. 3. The undulation component of the master ball
1050
-5-10
0 60 120 180 240 300 360
Am
plit
ude/
nm
2 .01.51.00.50.10
0 5 10 15 20 25 30 35 40 45 50 60
UPR
Mag
nitu
de
Angle/degree

Hiroshi Sato
40
component derived from the number of steps
As shown in Eq. (6), influences of UPR componentand harmonics components derived from the multi-stepnumber constitute systematic uncertainty components ofthe multi-step method, and therefore they cannot beeliminated.
Figure 4 compares UPR of three different master balls,namely A1, A2 and A3. It is speculated that A1 is highlysensitive to noises and rotational displacement becauseit contains a number of high UPR.
Figure 5 compares roundness measurements takenby A1 with six different numbers of steps. When a smallmulti-step number is selected, the original measurementobjective cannot be met due to too much impact of thesystematic uncertainty components, as described earlier [5].
In order to take rigorous measurements, it is necessaryto consider uncertainty components derived from the formscanning position as a part of components attributed tothe position control in the Z-axis direction and toparallelism and flatness of the measurement platform. Inthis study, however, influences of these components areignored by limiting measurements at the same scanning
position.
In this study, the master ball A1 is selected as ameasurement item, and simulation is performed, whilesetting the multi-step number at 12, to evaluate influencesof, a) noises generated during roundness measurement,and, b) accuracy of rotation angle of the indexing table.
The simulation addresses those cases in whichresolution of positioning accuracy is smaller than that ofthe actual measurement. To address this problem, thereference data were obtained by linearly interpolatingadjacent data in a way to achieve the angle resolution of0.01°and the simulation was performed based on thereference data composed of 36000 sampling data.
3. Simulation Method
3.1 Measurement Noise
3.1.1 Measurement noise generation method
There are various methods proposed for randomnoise generation [14]. In every method, however, it isnecessary to understand statistical characteristics of therandom noises in order to simulate their irregularphenomena. To evaluate the measurement noise actuallygenerated by the roundness measuring machine, themaster ball is set on the machine, and roundnessmeasurement is repeated for 500 times. Then average ofthe 500 measurement results is subtracted from eachmeasurement data to obtain measurement noise. Preciselyspeaking, however, this measurement noise containsdeviation of the rotary motion component of the spindle.
Figure 6 shows an example of the measurementnoise, and Fig. 7 shows their UPR to the 60th order. Noisewaveform G(θ) expressed with the Fourier series is asfollows;
( ) ( ){ }∞
=
= +∑0
( ) cos sinn nn
G c n d nθ θ θ (7)
cn is coefficient of the real part of UPR, and dn is a coefficientof the imaginary part of UPR. Histograms of both the realpart and the imaginary part of the Fourier componentconstitute occurrence probability based on the normal
Fig. 4. UPR Comparison among the master balls
Fig. 5. The roundness at different multi-step numbers
2.52.01.51.00.50.0
0 5 10 15 20 25 30 35 40 45 50 60
UPR
Mag
nitu
de A 1A 2A 3
13121110
9876
Rou
ndne
ss/n
m
2 3 6 12 2 0 60Multi-Steps

Influence of Index Table Accuracy on Roundness Calibration Using Monte Carlo Simulation
41
distribution, and occurrence probability of phase angle isdependent on the rectangular distribution. In this study,therefore, random noise is generated with the inverse FastFourier Transform by fitting values obtained throughrandom number generation to Fourier components; therandom number generation is performed based on thenormal distribution for the coefficient of the real part ofUPR and on the rectangular distribution for the phaseangle.
3.1.2 Parameters of measurement noise
Figure 8 shows the histogram representingdifferences (range R) between the maximum and theminimum of the measurement noise amplitude. Thishistogram very much looks like the probability densityfunction of the extreme value distribution.
The Type 1 extreme value distribution is often appliedto modeling of the maximum value of measurements. Theprobability density function L (x) for the extreme valuedistribution [15] having a location parameter (α) and ascale parameter (σ) is expressed as;
− −⎛ ⎞⎛ ⎞ ⎛ ⎞= − − −⎜ ⎟ ⎜ ⎟⎜ ⎟⎝ ⎠ ⎝ ⎠⎝ ⎠
1( ) exp exp expx xL x α ασ σ σ (8)
Equation (9) shows the maximum likelihoodestimates of the parameters of the Type 1 extreme valuedistribution calculated by using the histogram in Fig. 8.
α = 6.13σ = 0.97 (9)
The probability density function obtained from theseestimates is plotted with a solid line in Fig. 8. Thehistogram and the solid line are almost equivalent to eachother.
The noise waveform was generated as follows;
i) define a representative value of the maximumamplitude as a location parameter (α) , so as to makethe maximum waveform amplitude generated withthe inverse Fast Fourier Transform consistent withthe extreme value distribution,
ii) consider a scale parameter (σ) to be constant,iii) generate random numbers by applying the
parameters set in i) and ii),iv) adjust the amplitude by using the random numbers
3.2 The Influence of the Indexing Angle Accuracy
3.2.1 Classification of the indexing angle accuracy in termsof function
The error angle of the phase movement using the
Fig. 6. An example of the measurement noise generatedby the roundness measuring machine
Fig. 7. UPR of the measurement noise generated by theroundness measuring machine
Fig. 8. Histogram of the maximum amplitude of themeasurement noise
6420
-2-4
0 60 120 180 240 300 360Angle/degree
Am
plit
ude/
nm
0 .40.30.20.10.0
0 5 10 15 20 25 30 35 40 45 50 60
UPR
Mag
nitu
de
100
80
60
40
20
02 4 6 8 10 12 14 16
Noise Amplitude/nm
His
tgra
m

Hiroshi Sato
42
indexing table is classified into two groups by functionand mechanism of the indexing table.
A) Indexing is driven by pulse transmission: eachrevolution is independent and indexing error angleis accumulated each time
B) Scale is defined and a target of indexing is set inadvance: indexing error angle is not accumulated.
In this study, Group A is named "cumulative type"and Group B is named "random type.” Figure 9 showsthe conceptual diagrams of the cumulative type and therandom type. For the cumulative type (A), setting accuracyis applied to length of the arrows in accordance with therectangular distribution. For the random type (B), settingaccuracy is applied to the scales in accordance with therectangular distribution.
3.3 Parameter Setting
Table 2 shows the parameters set for the simulation.In this simulation, the noise amplitude parameter is variedto 16 different values, the indexing angle accuracyparameter is varied to 12 different values and the indexingerror is addressed in two different ways.
4. Simulation Results
4.1 Evaluation of Sensitivity to Measurement Noise
Figure 10 shows results of the simulation for A1measurement, in which amplitude of the measurementnoise is added to the form component. Medians of the
simulation results are plotted with 95% boot strappercentile interval. Figure 10 demonstrates that boththe medians and the upper values of the 95% intervalof the roundness go up systematically along with theincrease of measurement noise amplitude. No majorchange is observed for the lower limit of the 95%interval [16].
4.2 Influence of the Indexing Angle Accuracy
With regard to the master ball A1, influences of
Fig. 9. Concept of the phase setting precision
Table 2Simulation parameters
Noise Amplitude 2.5, 5.0, 7.5, 10.0 / nm (16 values) 12.5, 15.0, 17.5, 20.0
22.5, 25.0, 27.5, 30.032.5, 35.0, 37.5, 40.0
Probability Extreme value distributiondistributionfunction of the noiseamplitude rangeIndexing position 0.25, 0.5, 0.75, 1.0,accuracy / degree 1.5, 2.0, 2.5, 3.0,(12 values) 3.5, 4.0, 4.5, 5.0Probability Rectangular distributiondistributionfunction of the indexingposition accuracyIndexing position A) Cumulativeerror B) RandomRepetitive 500operation
Fig. 10. Influences of the noise amplitude on A1
A)
B)
16
15
14
13
12
11
10
Rou
ndne
ss/n
m
0 10 20 30 40Noise Amplitude/nm

Influence of Index Table Accuracy on Roundness Calibration Using Monte Carlo Simulation
43
With regard to the master ball A1, influences ofindexing angle accuracy are simulated for both thecumulative type and the random type. The simulationresults are plotted in the same way as in Section 4.1.Figure 11 and 12 show the simulation results of thecumulative type and the random type, respectively.As described in Table 2, the probability densityfunction of the indexing angle accuracy is regardedas the rectangular distribution in both the cases.
The measurement values of the roundness getsmaller, both in Figs. 11 and 12, due to influences ofthe indexing angle accuracy. The systematicdecreasing trend is smaller in the random type thanthe cumulative type, but the median of the roundnessshifts by 1 nm with the indexing angle accuracy ofthree degrees.
4.3 Monte Carlo Simulation
4.3.1When magnetic rotary encoder is used
The Monte Carlo simulation is repeated for 1000
times with the multi-step number of 12 for the masterball A1 (a calibration item). The location parameterand scale parameter both of which are estimated inEq. (8) are used in this simulation due to thecharacteristics of the roundness measuring machineused to calibrate the master ball. The cumulative typeis applied with the indexing angle accuracy set at 0.1degree.
Figure13 shows the histogram of the roundnesssimulation results. The median of the simulationresults with 95% interval is 11.8 nm ± 0.4 nm.
4.3.2 When the reference guide plate is used
Next the Monte Carlo simulation is performedwith the multi-step number of 12 by using the referenceguide plate shown in Fig.14. In performing thissimulation, the following assumptions, are made;
i) The maximum indexing error of about fourdegrees may be potentially caused due to thethickness of the scale, diameter of the red circle
Fig.12. Influences of the indexing angle accuracy for therandom type
Fig.11. Influences of the indexing angle accuracy for thecumulative type
Fig.13. The Monte Carlo simulation result for the existingmeasuring machine
Fig.14. A multi-step with the reference guide plate
13121110
987
Rou
ndne
ss/n
m
0 1 2 3 4 5Accuracy of rotation/degree
13
12
11
10
9
Rou
ndne
ss/n
m
0 1 2 3 4 5Accuracy of rotation/degree
200
150
100
50
011 11.5 12 12.5 13
Roundness/nm

Hiroshi Sato
44
used as a reference of indexing and diameter ofthe master ball.
ii) Influences of the misalignment induced by manualhandling of the master ball and of thermalexpansion can be ignored.
Based on the above assumptions, the simulationis performed with the multi-step number of 12. Therandom type is applied with the indexing angleaccuracy set at four degrees. Figure 15 shows thehistogram of the roundness simulation results. Thesimulation was repeated for 1000 times. The medianof the simulation results with 95% interval is 10.3 nm± 0.8 nm.
5. Discussion
5.1 Influences of the Noise and the Indexing Angle Accuracy
The simulation results indicate that measurementvalues of the roundness tend to rise along withincrease of the noise amplitude, but that they tend todecrease when tolerance of the indexing angleaccuracy increases, i.e. indexing angle accuracy goesdown. Due to these contradicting characteristics, itshould be noted that there is a potential problem thata measurement result may become equivalent to thecorrect roundness value when a measuring instrumentfeaturing big noise amplitude and big tolerance of theindexing angle accuracy.
To address this problem, it should be necessaryto realize indexing with low noise and highreproducibility and to take repetitive measurements,so that the random uncertainty components derivedfrom measurement noise can be reduced in theroundness measurement.
5.2 Comparison Measurement
The results shown in Figs. 13 and 15 suggest thatthe use of a reference guide plate should have asignificant impact on the measurement results. In anattempt to demonstrate this speculation, the authorcompares the actual measurement data between whenthe reference guide plate is used and when it reallyused the magnetic rotary encoder. Manual indexingis performed with extra care when the reference guideplate is used. Figure 16 shows the measuredroundness curve. The dashed line represents themeasurement results when the magnetic rotaryencoder is used while the solid line represents themeasurement results when the reference guide plateis used.
Although manual indexing is performedextremely carefully when the reference guide plate isused, high-order UPR components are decreasedbecause indexing error has equivalent effects on theform component waveform to smoothing average andlow-pass filter. However, the roundness obtainedfrom the roundness curve shown in Fig.16 is 11.6 nmwith the magnetic rotary encoder and 11.0 nm withthe reference guide plate, which are almost equivalentto each other. This is considered because each one ofthe actual indexing angle accuracy is higher than thepre-set accuracy due to extra attention paid to themanual indexing.
Fig. 15. The Monte Carlo simulation result for the use ofthe reference guide plate
Fig. 16. Comparison of actual measurements with multi-step number of 12
200
150
100
50
0
9 9.5 10 10.5 11 11.5 12Roundness/nm
1050
-5-10
60 110 160 210 260 310 360Angle/degree
Am
plit
ude/
nm

Influence of Index Table Accuracy on Roundness Calibration Using Monte Carlo Simulation
45
Before this study, the author was afraid thatcalibration of the master ball with roundness of about10 nm by using the reference guide plate could not besufficiently accurate due to poor accuracy of scalingon the plate and of the manual indexing. It is revealed,however, that the calibration using the reference guideplate is capable of delivering a measurement curveequivalent to the calibration using 1-50 UPR filteringif the manual indexing is performed with extra care.Nonetheless, the calibration using the reference guideplate is not recommended because of its poor efficiency.
5.3 The Comparison Simulation of the Master Balls
For the three master balls shown in Fig.4,influences of indexing angle accuracy are simulatedfor the random type, which is just like the simulationshown in Fig. 12. Figure 17 shows the gap betweenthe simulation results and the reference valueincluding no indexing error. Figure 17 indicates theA1 results which are more affected by the indexingangle accuracy than the A2 and A3 results becauseA1 features high UPR in large number.
In order to improve measurement efficiency andsimplify uncertainty estimation, indexing angleaccuracy should be 0.5 degree or less when aroundness measuring machine features maximumnoise amplitude of about 7 nm. With this condition,uncertainty of the roundness after filtering will be 0.5nm or less and influences of the indexing angleaccuracy and noise amplitude can be almost ignored.
6. Conclusion
Influences of the indexing angle accuracy of the
indexing table and the measurement noise amplitudeon the roundness measurement were simulated. TheMonte Carlo simulation was performed both for thecurrent measuring system and for the simplifiedmeasurement using a reference guide plate. Thefollowings are revealed in the simulation;
i) The parameter of the extreme value distributionis estimated by using the Fourier component ofthe noise waveform which is obtained in theexperiment, by which the virtual noise isgenerated. Then influences of the noise amplitudeare simulated.
ii) Influences of the indexing angle accuracy in themulti-step method are simulated both for thecumulative type and for the random type,depending on the characteristic of the indexingtable.
iii) The simulation results indicate that the influencesof the indexing angle accuracy and the noiseamplitude are contradictory to each other.
iv) Even with the calibration using the referenceguide plate, the roundness of the master ball canbe estimated within the uncertainty if manualindexing is performed with extra care.
v) If indexing angle accuracy is 0.5 degrees or less,the uncertainty will be improved to 0.5 nm or less,and influences of the indexing angle accuracy andthe noise amplitude can be almost ignored.
References
[1] BIPM, IEC, IFCC, ISO, IUPAC, IUPAP, OIML:Guide to the Expression of Uncertainty inMeasurement, ISO, (1993)
[2] T.J. Esward, et al., A Monte Carlo Method forUncertainty Evaluation Implemented on aDistributed Computing System, Metrologia, 44(2007) 319.
[3] S.V. Crowder and R. Moyer , A Two-Stage MonteCarlo Approach to the Expression ofUncertainty with Non-Linear MeasurementEquation and Small Sample Size, Metrologia,43 (2006) 34.
[4] JCGM 101 : Evaluation of Measurement Data -Supplement 1 to the "Guide to the Expressionof Uncertainty in Measurement" - Propagationof Distributions Using a Monte Carlo Method:BIPM, (2008).
Fig. 17. Indexing angle accuracy comparison among themaster ball
1.00.50.0
-0.5-1.0-1.5-2.0-2.5
Rou
ndne
ss/n
m
0 1 2 3 4 5Accuracy of rotating/degree
A 1
A 2
A 3

Hiroshi Sato
46
[5] T. Tsukada, et al, Correction and Its Assessmentof Systematic Errors in Cylindrical FormMeasurements, Design and Drawing, 23, (1988),291-296 (in Japanese).
[6] C.L. Giusca, A.B. Forbes and R.K. Leach,Uncertainty Evaluation for A New TraceableAreal Surface Texture Measuring Instrument,12th International Conference on Metrologyand Properties of Engineering Surfaces,Proceedings, 37 (2009).
[7] M.G. Cox and A. Lazzari, Modeling andUncertainty for High-Accuracy RoundnessMeasurement, 10th IMEKO TC7, Proceedings,(2004).
[8] M.G. Cox and B.R.L. Siebert, The Use of a MonteCarlo Method for Evaluating Uncertainty andExpanded Uncertainty, Metrologia, 43 (2006)S178-188.
[9] M. Muller, M. Wolf and M. Rosslein, MUSE :Computational Aspects of a GUM SupplementImplementation, Metrologia, 45 (2008) 586-594
[10] JIS B 7451, Instruments for the Assessment offrom Roundness - Measurement of Variationsin Radius, (1997) (in Japanese).
[11] Whitehouse, Some Theoretical Aspects of ErrorSeparation Techniques in Surface Metrology, J.of Physics E, 9 (1976) 531.
[12] T. Watanabe, K. Naoi and H. Fujimoto, Researchon High Precision Profile Evaluation Methodfor Circular Forms (1st Report) - Profile AnalysisTechnique of the Roundness Measurement,Journal of the Japan Society for PrecisionEngineering, 73 (2007) 145-149 (in Japanese).
[13] K. Naoi, Development of Calibration Methodfor Roundness, AIST TODAY, 7 (2007) 26 (inJapanese).
[14] M. Hino, Spectral Analysis, Asakura PublishingCo. Ltd, (1977) (in Japanese).
[15] T. Minotani, Handbook of Distribution inStatistics, Asakura Publishing Co. Ltd, (2010)(in Japanese).
[16] R.V. Hogg, J.W. McKean and A.T. Craig,Introduction to Mathematical Statistics 6th
Edition, Asakura Publishing Co. Ltd. inJapanese Edition, (2006).


