
Influence of Hydration Temperature on the Durability and...
24
Myers, J.J., Carrasquillo, R.L., “Influence of Hydration Temperature on the Durability and Mechanical Property Performance of HPC Prestressed/Precast Beams”, Journal of the Transportation Research Board, Fifth International Bridge Engineering Conference, pp 131-142, No. 1696, Volume 1, Publication 5B0038, April 2000. Influence of Hydration Temperature on the Durability and Mechanical Property Performance of HPC Prestressed/Precast Beams John J. Myers, Ph.D., P.E. Assistant Professor of Civil Engineering The University of Missouri at Rolla Center for Infrastructures Engineering Studies 218 Engineering Research Lab Rolla, Missouri, USA 65409-0710 Ramon L Carrasquillo, Ph.D., P.E. Professor of Civil Engineering The University of Texas at Austin Construction Materials Research Group 10100 Burnet Road, Building 18B Austin, Texas, USA 78758 Abstract Concrete technology has continued to advance throughout the years to meet the demands of designers and innovative structural systems. With the advent of high performance concrete (HPC) which contains high contents of cementitious materials, the need to further investigate the impact of concrete temperature development during hydration relative to concrete performance is of keen interest. The study conducted herein utilized the use of match curing technology to investigate the influence of concrete temperature development during hydration on the mechanical and material property performance of HPC prestressed/precast beams. These members were fabricated for use in two recently constructed HPC bridges in Texas. The investigation was conducted in conjunction with the design, instrumentation, and construction of the Louetta Road Overpass in Houston, Texas and the North Concho River US 87 & S.O. RR Overpass in San Angelo, Texas. The Federal Highway Administration (FHWA) and the Texas Department of Transportation (TxDOT) cosponsored these projects as part of the Strategic Highway Research Program (SHRP) to stimulate the use of HPC and to demonstrate the suitability of HPC in highway structures. Results of this study indicated that for HPC’s which contain high contents of cementitious materials, the concrete temperature during hydration can have a dramatic impact on both the mechanical and material (durability) performance of the
Transcript of Influence of Hydration Temperature on the Durability and...
Myers, J.J., Carrasquillo, R.L., “Influence of Hydration Temperature on the Durability and Mechanical Property Performance of HPC Prestressed/Precast Beams”, Journal of the Transportation Research Board, Fifth International Bridge Engineering Conference, pp 131-142, No. 1696, Volume 1, Publication 5B0038, April 2000.
Influence of Hydration Temperature on the Durability and Mechanical Property Performance of HPC Prestressed/Precast Beams
John J. Myers, Ph.D., P.E.
Assistant Professor of Civil Engineering
The University of Missouri at Rolla
Center for Infrastructures Engineering Studies
218 Engineering Research Lab
Rolla, Missouri, USA 65409-0710
Ramon L Carrasquillo, Ph.D., P.E.
Professor of Civil Engineering
The University of Texas at Austin
Construction Materials Research Group
10100 Burnet Road, Building 18B
Austin, Texas, USA 78758
Abstract
Concrete technology has continued to advance throughout the years to meet the demands of
designers and innovative structural systems. With the advent of high performance concrete
(HPC) which contains high contents of cementitious materials, the need to further investigate the
impact of concrete temperature development during hydration relative to concrete performance is
of keen interest. The study conducted herein utilized the use of match curing technology to
investigate the influence of concrete temperature development during hydration on the
mechanical and material property performance of HPC prestressed/precast beams. These
members were fabricated for use in two recently constructed HPC bridges in Texas. The
investigation was conducted in conjunction with the design, instrumentation, and construction of
the Louetta Road Overpass in Houston, Texas and the North Concho River US 87 & S.O. RR
Overpass in San Angelo, Texas. The Federal Highway Administration (FHWA) and the Texas
Department of Transportation (TxDOT) cosponsored these projects as part of the Strategic
Highway Research Program (SHRP) to stimulate the use of HPC and to demonstrate the
suitability of HPC in highway structures. Results of this study indicated that for HPC’s which
contain high contents of cementitious materials, the concrete temperature during hydration can
have a dramatic impact on both the mechanical and material (durability) performance of the
Myers, J.J., Carrasquillo, R.L., “Influence of Hydration Temperature on the Durability and Mechanical Property Performance of HPC Prestressed/Precast Beams”, Journal of the Transportation Research Board, Fifth International Bridge Engineering Conference, pp 131-142, No. 1696, Volume 1, Publication 5B0038, April 2000.
2
2
concrete. Temperature recommendations are provided herein to avoid less than optimal concrete
performance based on the member shapes and mix design investigated within this study.
INTRODUCTION
When portland cement reacts with water an exothermic chemical reaction occurs which
produces heat. The heat that is generated is dependent upon the composition and amount of
each of the cement or cementitious materials within the concrete, and the mass of the concrete
that is poured. Several cement compositions have been developed over the years to
accommodate various casting conditions (rate of hardening) and exposures to improve long-term
concrete performance. With the advent of high performance concrete (HPC), the issue of
concrete performance relative to heat generation raises concerns since many HPC incorporate
very high contents of cementitious materials to attain the desirable level of strength required
either at early or later-ages. This issue of temperature development is particularly important for
many precasters who need to meet high early release strengths in a timely fashion to maintain
plant productivity, but cannot afford detrimental later-age performance.
In 1993 the FHWA initiated a series of bridge projects that included the complete incorporation
of HPC from design to long-term monitoring to investigate and demonstrate the suitability of HPC
for use in highway structures. Two of these bridges, the Louetta Road Overpass in Houston,
Texas and the North Concho River Overpass in San Angelo, Texas, were recently constructed in
the State of Texas. A research program for these bridges was developed to investigate aspects of
mix design, concrete properties, applicability of current design requirements, applicability of
current construction practices, predictability of short and long-term performance as well as
recommendations for a quality control/quality assurance testing and inspection program. As part
of this research study, the influence of concrete temperature development during hydration on the
mechanical and material property performance of HPC prestressed/precast beams was
investigated as discussed herein. The following sections discuss the test methods and
procedures used, the instrumentation and monitoring plan, as well as the in-situ results and
conclusions reached.
TEST METHODS AND PROCEDURES
The following test methods and procedures were observed during the scope of this
investigation.
Compressive Strength ASTM C39-94
The compressive strength tests were performed in accordance with ASTM C39-94 “Standard
Test Method for Compressive Strength of Cylindrical Concrete Specimens” using a 272 ton (600
Myers, J.J., Carrasquillo, R.L., “Influence of Hydration Temperature on the Durability and Mechanical Property Performance of HPC Prestressed/Precast Beams”, Journal of the Transportation Research Board, Fifth International Bridge Engineering Conference, pp 131-142, No. 1696, Volume 1, Publication 5B0038, April 2000.
3
3
kip) capacity hydraulically operated compression test machine. The specimens were loaded at a
rate of 241 ± 103 kPa per second (35 ± 15 psi per second) until failure. Special care was taken to
test the specimens in a moist condition if they were moist-cured cylinders to eliminate any
variation associated with their moisture condition at the time of testing. Neoprene pads inserted in
steel retaining caps were used throughout this study. Neoprene pads used for HS/HPC had a
manufacturer stated minimum hardness of 70 durameter. Specimens for the prestressed/precast
beams were tested at release of pre-tensioning (22 to 26 hours) and at the specification
requirement for design strength (56 days).
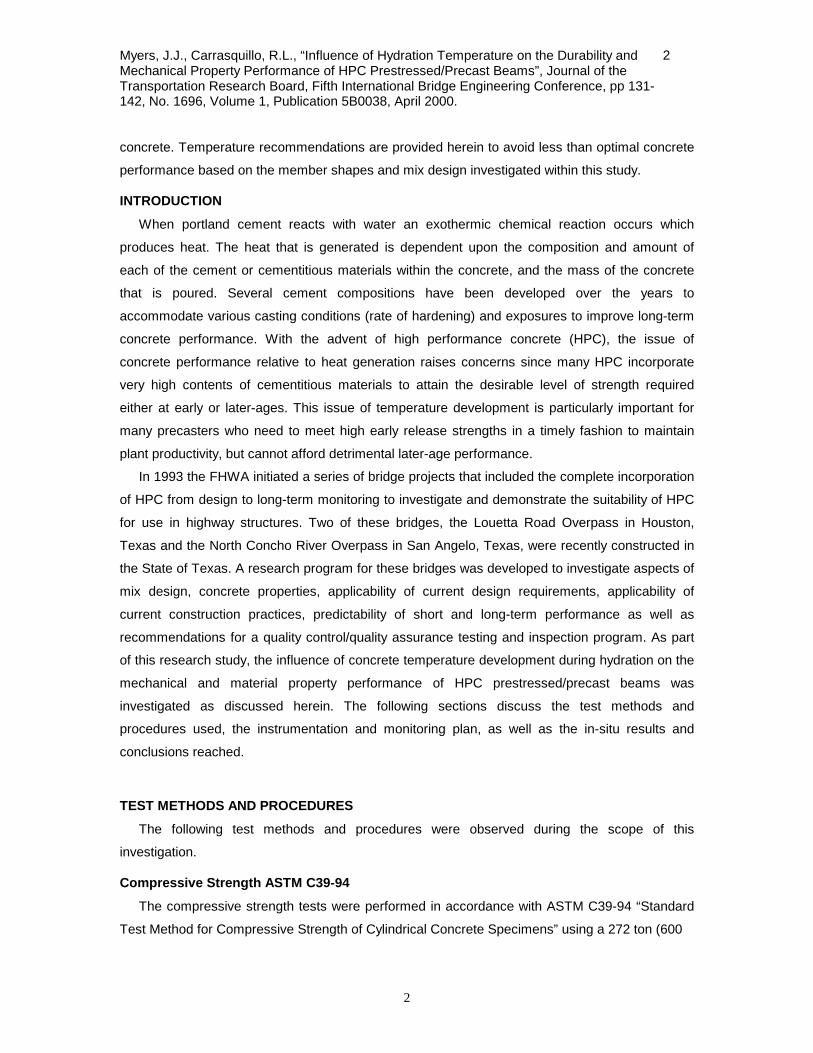
Modulus of Elasticity ASTM C469-94
Elastic moduli were determined in accordance with ASTM C469-94 “Standard Test Method for
Static Modulus of Elasticity and Poisson’s Ratio of Concrete
in Compression”. The elastic modulus test set-up is illustrated
in Figure 1. Elastic modulus was evaluated at release and 56
days.
Rapid Chloride Permeability AASHTO T277
Rapid chloride permeability testing was performed in
accordance with AASHTO T277 “Standard Method of Test for
Rapid Determination of the Chloride Permeability of
Concrete”. The test measured, in coulombs, the amount of current that flowed through a slice of
saturated concrete when placed between two electrolytic solutions and subjected to a 60-volt DC
voltage. The permeability results were averaged based on a minimum of four slices for any one
casting date under any one curing condition or thermocouple location selected.
INSTRUMENTATION AND CONCRETE TEMPERATURE-TIME MODELING
In order to investigate the influence of concrete temperature during hydration on the
mechanical and material (durability) performance of HPC prestressed/precast members, a
commercially available match curing system was used. The concept of match curing technology
is to produce quality control specimens that closely represent the actual concrete in the member
by monitoring and matching the temperature-time profile of the concrete in the member to the
quality control specimens. Through the use of a data acquisition system, the temperature-time
profile for the actual member was monitored at six-minute intervals. This system was located in
an enclosed temperature controlled building located adjacent to the precasting beds. The data
acquisition system and interface box contained eight controllable channels and six uncontrollable
Figure 1: Static Elastic Modulus
Testing Ring and Set-Up
Myers, J.J., Carrasquillo, R.L., “Influence of Hydration Temperature on the Durability and Mechanical Property Performance of HPC Prestressed/Precast Beams”, Journal of the Transportation Research Board, Fifth International Bridge Engineering Conference, pp 131-142, No. 1696, Volume 1, Publication 5B0038, April 2000.
4
channels to monitor temperature-time profiles. Each controllable channel was capable of
controlling the temperatures of six match curing molds. The steel molds were standard 100-mm
dia. x 200-mm long (4-in. dia. x 8-in. long) cylinders and were surrounded by an internal heating
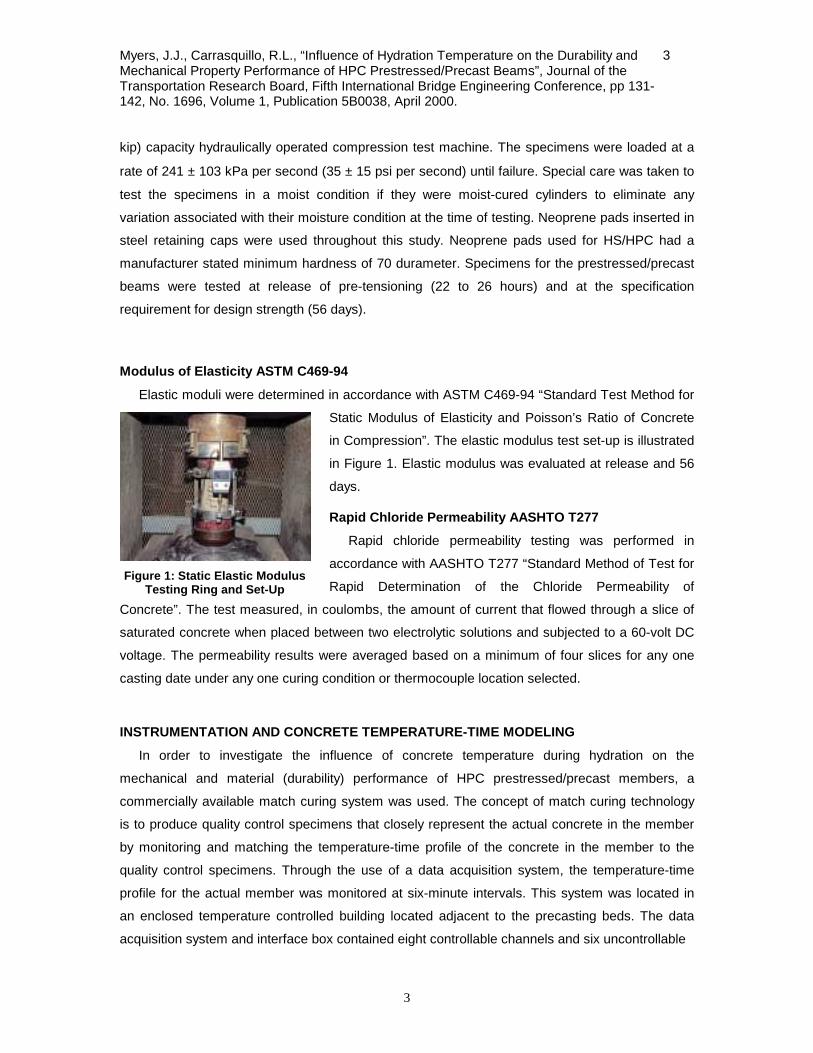
coil that was insulated by a protective material. The match curing steel molds were located in a
room where the temperature of the environment could be controlled (Figure 2) since the match
curing system could not cool the specimens, only heat the specimens.
The room was maintained at a constant
temperature of 21.1 ± 1.7°C (70 ± 3°F), so that
the temperature profile of the match cured
specimens would not “lag” behind the actual
temperature-time profile of the concrete in the
precast member. The temperature-time
development of the concrete was monitored at
four critical locations for the Louetta Road
Overpass U-Beams for each casting date
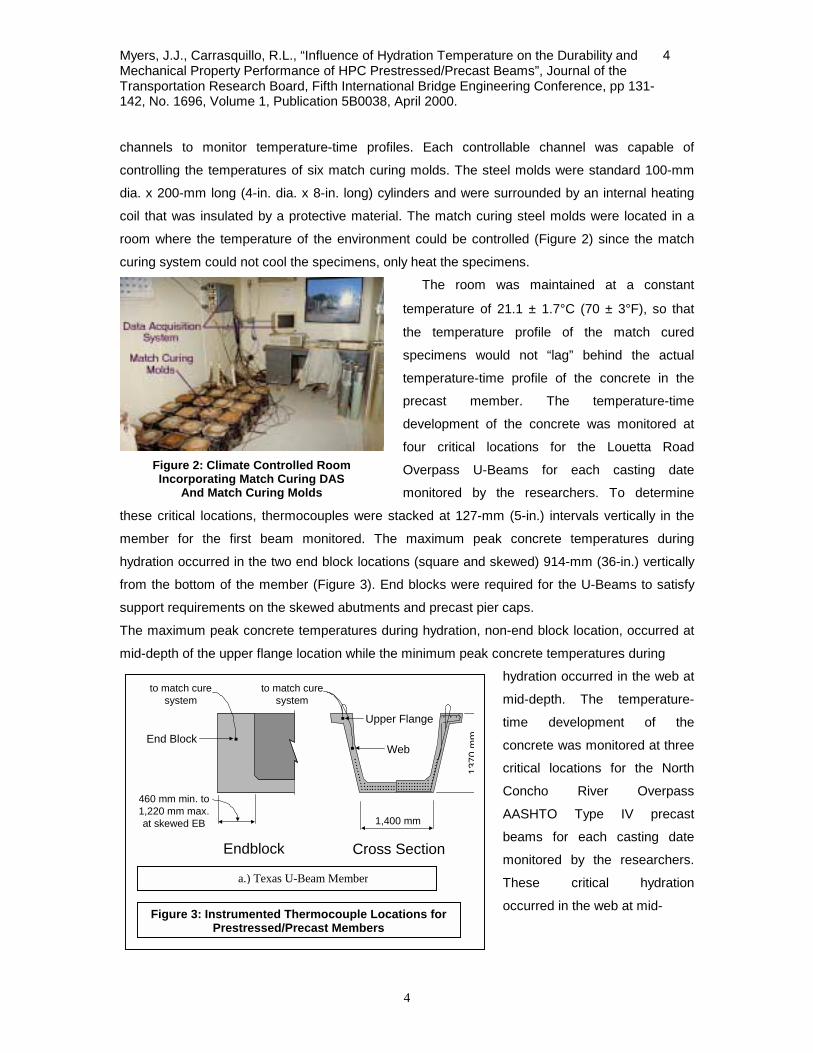
monitored by the researchers. To determine
these critical locations, thermocouples were stacked at 127-mm (5-in.) intervals vertically in the
member for the first beam monitored. The maximum peak concrete temperatures during
hydration occurred in the two end block locations (square and skewed) 914-mm (36-in.) vertically
from the bottom of the member (Figure 3). End blocks were required for the U-Beams to satisfy
support requirements on the skewed abutments and precast pier caps.
The maximum peak concrete temperatures during hydration, non-end block location, occurred at
mid-depth of the upper flange location while the minimum peak concrete temperatures during
hydration occurred in the web at
mid-depth. The temperature-
time development of the
concrete was monitored at three
critical locations for the North
Concho River Overpass
AASHTO Type IV precast
beams for each casting date
monitored by the researchers.
These critical hydration
Figure 2: Climate Controlled Room Incorporating Match Curing DAS
And Match Curing Molds
460 mm min. to1,220 mm max.at skewed EB
Endblock Cross Section
Upper Flange
End BlockWeb
to match curesystem
to match curesystem
1,400 mm
1370
mm
a.) Texas U-Beam Member
occurred in the web at mid-
Figure 3: Instrumented Thermocouple Locations forPrestressed/Precast Members4
Myers, J.J., Carrasquillo, R.L., “Influence of Hydration Temperature on the Durability and Mechanical Property Performance of HPC Prestressed/Precast Beams”, Journal of the Transportation Research Board, Fifth International Bridge Engineering Conference, pp 131-142, No. 1696, Volume 1, Publication 5B0038, April 2000.
5
5
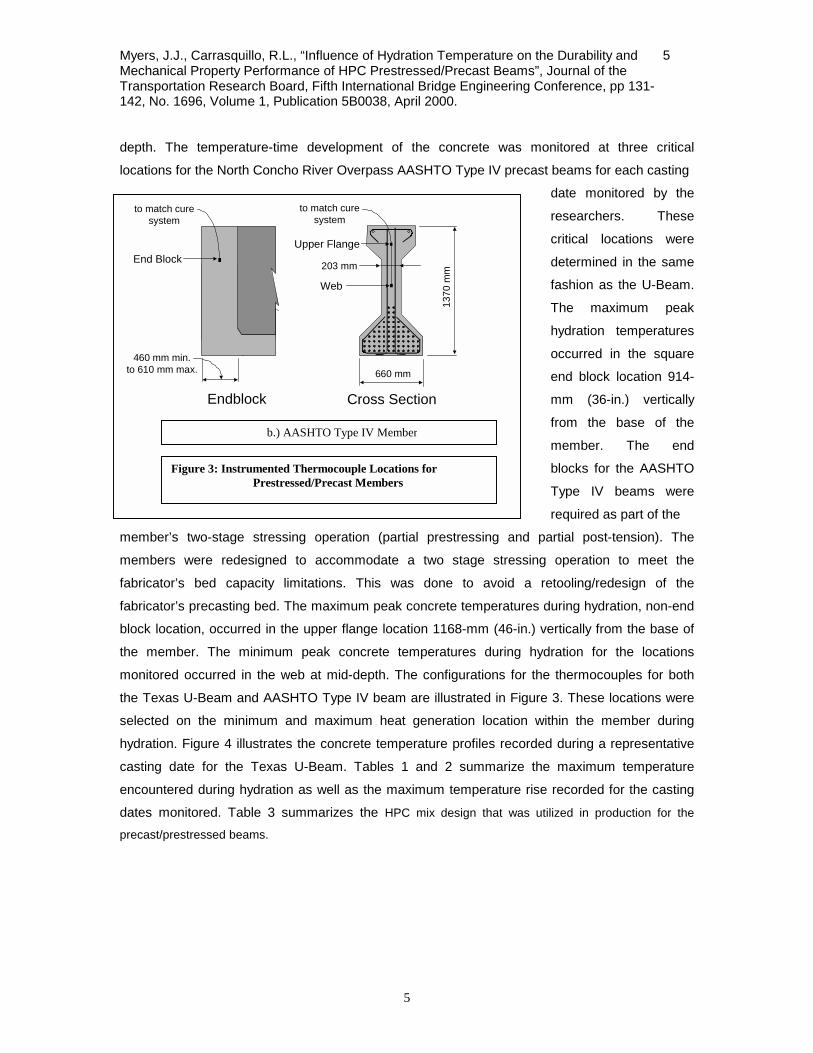
depth. The temperature-time development of the concrete was monitored at three critical
locations for the North Concho River Overpass AASHTO Type IV precast beams for each casting
date monitored by the
researchers. These
critical locations were
determined in the same
fashion as the U-Beam.
The maximum peak
hydration temperatures
occurred in the square
end block location 914-
mm (36-in.) vertically
from the base of the
member. The end
blocks for the AASHTO
Type IV beams were
required as part of the
member’s two-stage stressing operation (partial prestressing and partial post-tension). The
members were redesigned to accommodate a two stage stressing operation to meet the
fabricator’s bed capacity limitations. This was done to avoid a retooling/redesign of the
fabricator’s precasting bed. The maximum peak concrete temperatures during hydration, non-end
block location, occurred in the upper flange location 1168-mm (46-in.) vertically from the base of
the member. The minimum peak concrete temperatures during hydration for the locations
monitored occurred in the web at mid-depth. The configurations for the thermocouples for both
the Texas U-Beam and AASHTO Type IV beam are illustrated in Figure 3. These locations were
selected on the minimum and maximum heat generation location within the member during
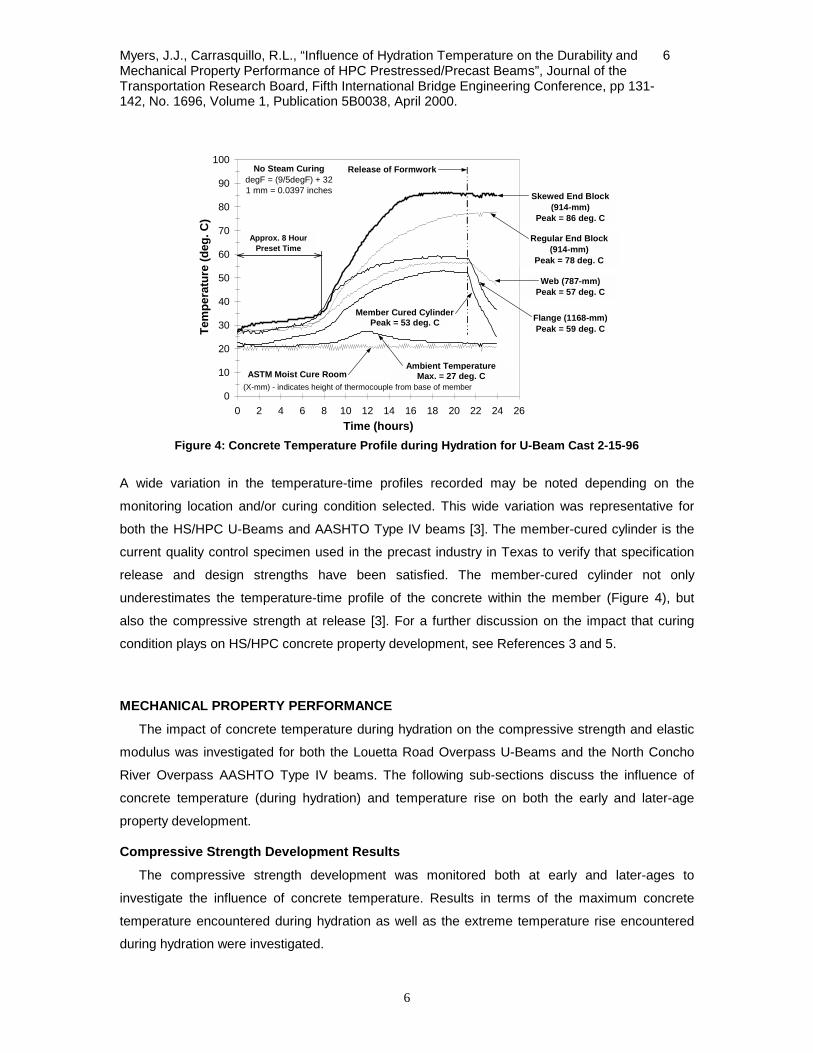
hydration. Figure 4 illustrates the concrete temperature profiles recorded during a representative
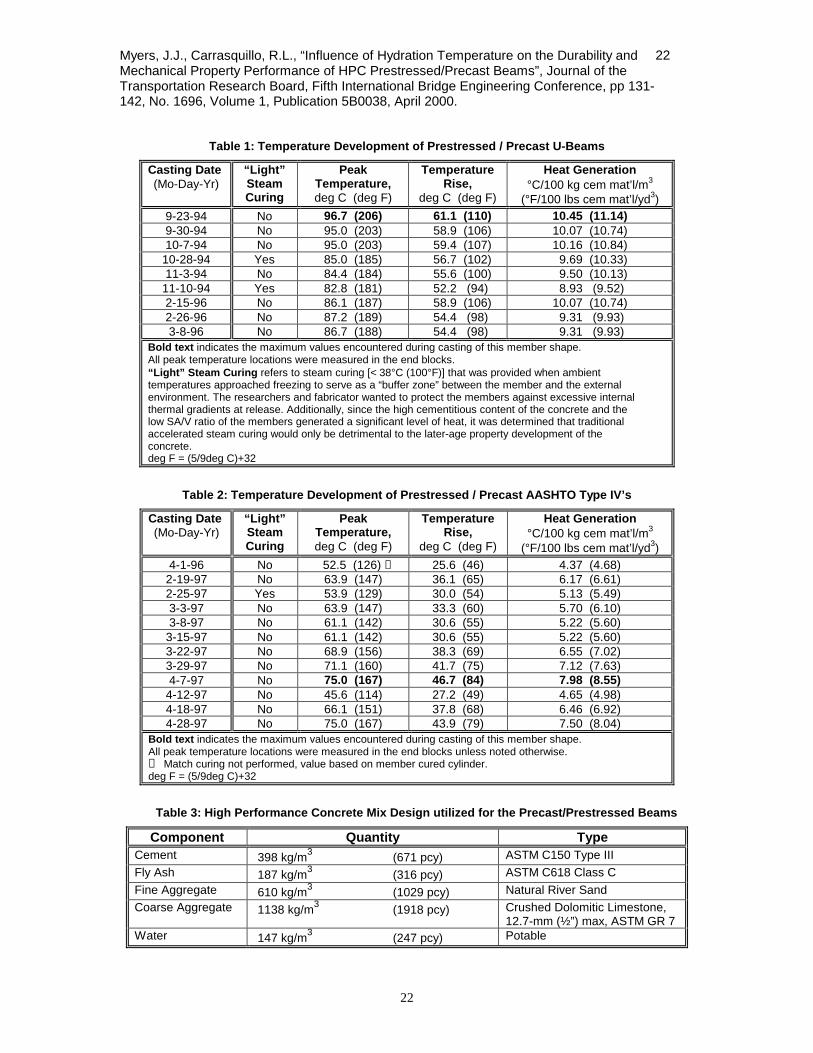
casting date for the Texas U-Beam. Tables 1 and 2 summarize the maximum temperature
encountered during hydration as well as the maximum temperature rise recorded for the casting
dates monitored. Table 3 summarizes the HPC mix design that was utilized in production for the
precast/prestressed beams.
460 mm min.to 610 mm max.
Endblock Cross Section
Upper FlangeEnd Block
Web
to match curesystem
to match curesystem
660 mm
1370
mm203 mm
b.) AASHTO Type IV Member
Figure 3: Instrumented Thermocouple Locations for Prestressed/Precast Members
Myers, J.J., Carrasquillo, R.L., “Influence of Hydration Temperature on the Durability and Mechanical Property Performance of HPC Prestressed/Precast Beams”, Journal of the Transportation Research Board, Fifth International Bridge Engineering Conference, pp 131-142, No. 1696, Volume 1, Publication 5B0038, April 2000.
6
6
A wide variation in the temperature-time profiles recorded may be noted depending on the
monitoring location and/or curing condition selected. This wide variation was representative for
both the HS/HPC U-Beams and AASHTO Type IV beams [3]. The member-cured cylinder is the
current quality control specimen used in the precast industry in Texas to verify that specification
release and design strengths have been satisfied. The member-cured cylinder not only
underestimates the temperature-time profile of the concrete within the member (Figure 4), but
also the compressive strength at release [3]. For a further discussion on the impact that curing
condition plays on HS/HPC concrete property development, see References 3 and 5.
MECHANICAL PROPERTY PERFORMANCE
The impact of concrete temperature during hydration on the compressive strength and elastic
modulus was investigated for both the Louetta Road Overpass U-Beams and the North Concho
River Overpass AASHTO Type IV beams. The following sub-sections discuss the influence of
concrete temperature (during hydration) and temperature rise on both the early and later-age
property development.
Compressive Strength Development Results
The compressive strength development was monitored both at early and later-ages to
investigate the influence of concrete temperature. Results in terms of the maximum concrete
temperature encountered during hydration as well as the extreme temperature rise encountered
during hydration were investigated.
0
10
20
30
40
50
60
70
80
90
100
0 2 4 6 8 10 12 14 16 18 20 22 24 26Time (hours)
Tem
pera
ture
(deg
. C)
Skewed End Block(914-mm)
Peak = 86 deg. C
Web (787-mm)Peak = 57 deg. C
Regular End Block(914-mm)
Peak = 78 deg. C
Ambient TemperatureASTM Moist Cure Room
Flange (1168-mm)Peak = 59 deg. C
Max. = 27 deg. C(X-mm) - indicates height of thermocouple from base of member
Release of Formwork
Approx. 8 HourPreset Time
Peak = 53 deg. CMember Cured Cylinder
No Steam CuringdegF = (9/5degF) + 321 mm = 0.0397 inches
Figure 4: Concrete Temperature Profile during Hydration for U-Beam Cast 2-15-96
Myers, J.J., Carrasquillo, R.L., “Influence of Hydration Temperature on the Durability and Mechanical Property Performance of HPC Prestressed/Precast Beams”, Journal of the Transportation Research Board, Fifth International Bridge Engineering Conference, pp 131-142, No. 1696, Volume 1, Publication 5B0038, April 2000.
7
7
Influence of Concrete Temperature during Hydration on Compressive Strength Development
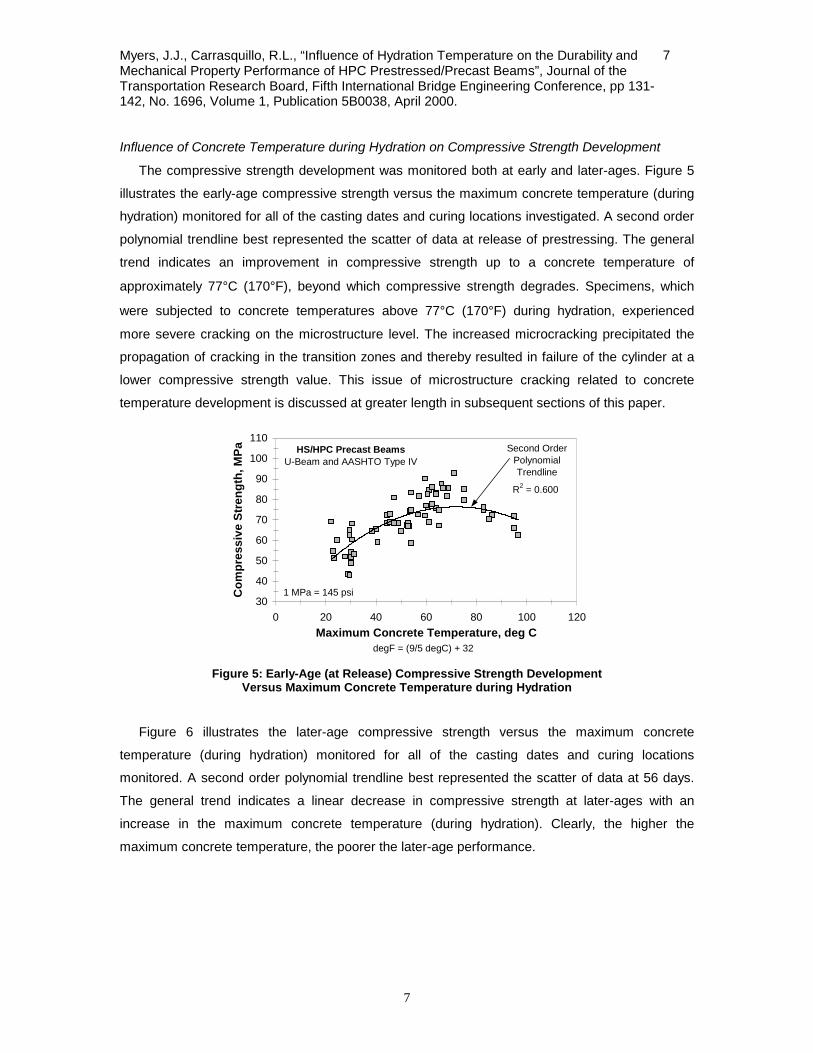
The compressive strength development was monitored both at early and later-ages. Figure 5
illustrates the early-age compressive strength versus the maximum concrete temperature (during
hydration) monitored for all of the casting dates and curing locations investigated. A second order
polynomial trendline best represented the scatter of data at release of prestressing. The general
trend indicates an improvement in compressive strength up to a concrete temperature of
approximately 77°C (170°F), beyond which compressive strength degrades. Specimens, which
were subjected to concrete temperatures above 77°C (170°F) during hydration, experienced
more severe cracking on the microstructure level. The increased microcracking precipitated the
propagation of cracking in the transition zones and thereby resulted in failure of the cylinder at a
lower compressive strength value. This issue of microstructure cracking related to concrete
temperature development is discussed at greater length in subsequent sections of this paper.
R2 = 0.600
30
40
50
60
70
80
90
100
110
0 20 40 60 80 100 120Maximum Concrete Temperature, deg C
Com
pres
sive
Str
engt
h, M
Pa HS/HPC Precast BeamsU-Beam and AASHTO Type IV
Second Order PolynomialTrendline
1 MPa = 145 psi
degF = (9/5 degC) + 32 Figure 5: Early-Age (at Release) Compressive Strength Development
Versus Maximum Concrete Temperature during Hydration
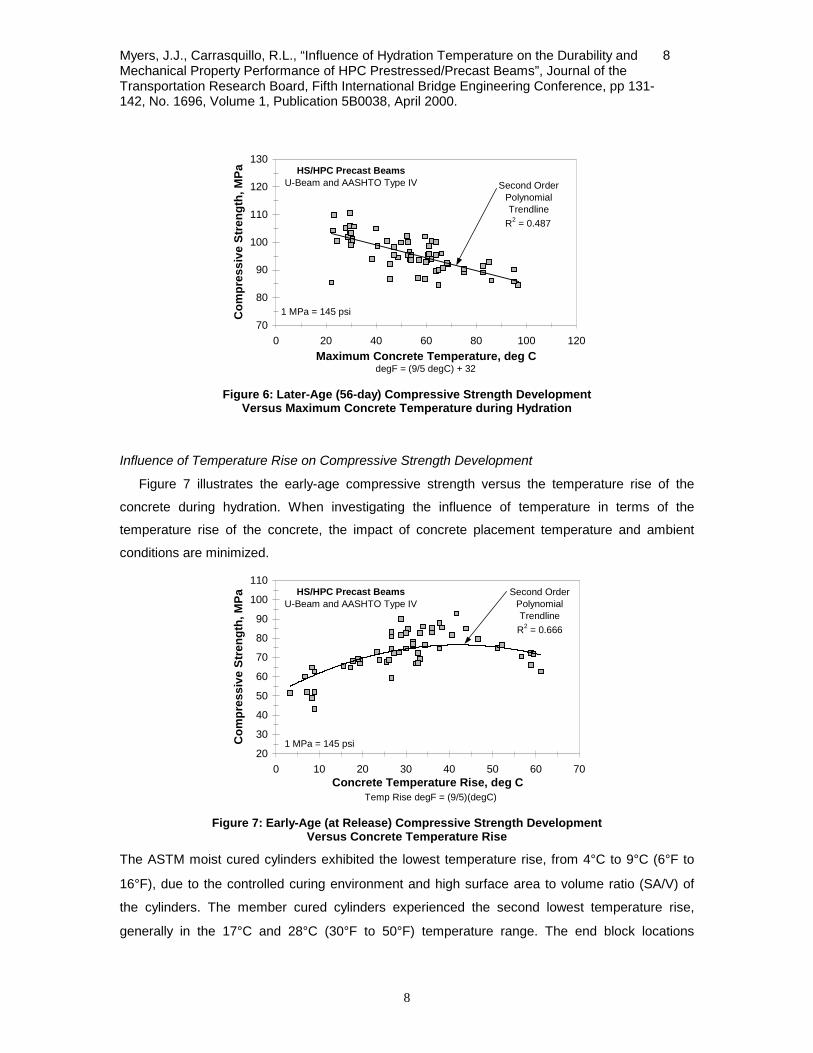
Figure 6 illustrates the later-age compressive strength versus the maximum concrete
temperature (during hydration) monitored for all of the casting dates and curing locations
monitored. A second order polynomial trendline best represented the scatter of data at 56 days.
The general trend indicates a linear decrease in compressive strength at later-ages with an
increase in the maximum concrete temperature (during hydration). Clearly, the higher the
maximum concrete temperature, the poorer the later-age performance.
Myers, J.J., Carrasquillo, R.L., “Influence of Hydration Temperature on the Durability and Mechanical Property Performance of HPC Prestressed/Precast Beams”, Journal of the Transportation Research Board, Fifth International Bridge Engineering Conference, pp 131-142, No. 1696, Volume 1, Publication 5B0038, April 2000.
8
8
R2 = 0.487
70
80
90
100
110
120
130
0 20 40 60 80 100 120Maximum Concrete Temperature, deg C
Com
pres
sive
Str
engt
h, M
Pa HS/HPC Precast BeamsU-Beam and AASHTO Type IV Second Order
PolynomialTrendline
degF = (9/5 degC) + 32
1 MPa = 145 psi
Figure 6: Later-Age (56-day) Compressive Strength Development
Versus Maximum Concrete Temperature during Hydration
Influence of Temperature Rise on Compressive Strength Development
Figure 7 illustrates the early-age compressive strength versus the temperature rise of the
concrete during hydration. When investigating the influence of temperature in terms of the
temperature rise of the concrete, the impact of concrete placement temperature and ambient
conditions are minimized.
20
30
40
50
60
70
80
90
100
110
0 10 20 30 40 50 60 70Concrete Temperature Rise, deg C
Com
pres
sive
Str
engt
h, M
Pa
HS/HPC Precast BeamsU-Beam and AASHTO Type IV
Second OrderPolynomialTrendline
R2 = 0.666
Temp Rise degF = (9/5)(degC)
1 MPa = 145 psi
Figure 7: Early-Age (at Release) Compressive Strength Development
Versus Concrete Temperature Rise
The ASTM moist cured cylinders exhibited the lowest temperature rise, from 4°C to 9°C (6°F to
16°F), due to the controlled curing environment and high surface area to volume ratio (SA/V) of
the cylinders. The member cured cylinders experienced the second lowest temperature rise,
generally in the 17°C and 28°C (30°F to 50°F) temperature range. The end block locations
Myers, J.J., Carrasquillo, R.L., “Influence of Hydration Temperature on the Durability and Mechanical Property Performance of HPC Prestressed/Precast Beams”, Journal of the Transportation Research Board, Fifth International Bridge Engineering Conference, pp 131-142, No. 1696, Volume 1, Publication 5B0038, April 2000.
9
9
exhibited the highest temperature rise followed by the flange and web locations. The end block
locations for the U-Beams experienced a temperature rise between 51°C and 61°C (92°F to
110°F), while the AASHTO Type IV’s varied between 27°C and 47°C (49°F to 84°F). The
maximum heat generation for the U-Beam and AASHTO Type IV end blocks was 10.45 and
7.98°C/100 kg of cementitious material per cubic meter of concrete (11.14 and 8.55°F/100 lb.
cementitious material per cubic yard of concrete), respectively. Tables 1 and 2 summarize the
peak temperatures and heat generation for each precast member casting date. The general trend
for the temperature rise of the concrete indicates an improvement in compressive strength up to a
temperature rise of approximately 39°C (70°F). Beyond this temperature rise, a decrease in the
release strength is exhibited. As noted previously, this may be attributed to increased
microcracking resulting in failure of the cylinder at a lower compressive strength value. The only
location that experienced temperature rises above this level were the end block locations
primarily on the U-Beams. Due to the higher SA/V ratio of the AASHTO Type IV’s, excessive
temperature development during casting did not appear to be as large of a concern since these
members could dissipate heat faster due to the larger SA/V ratio of these members.
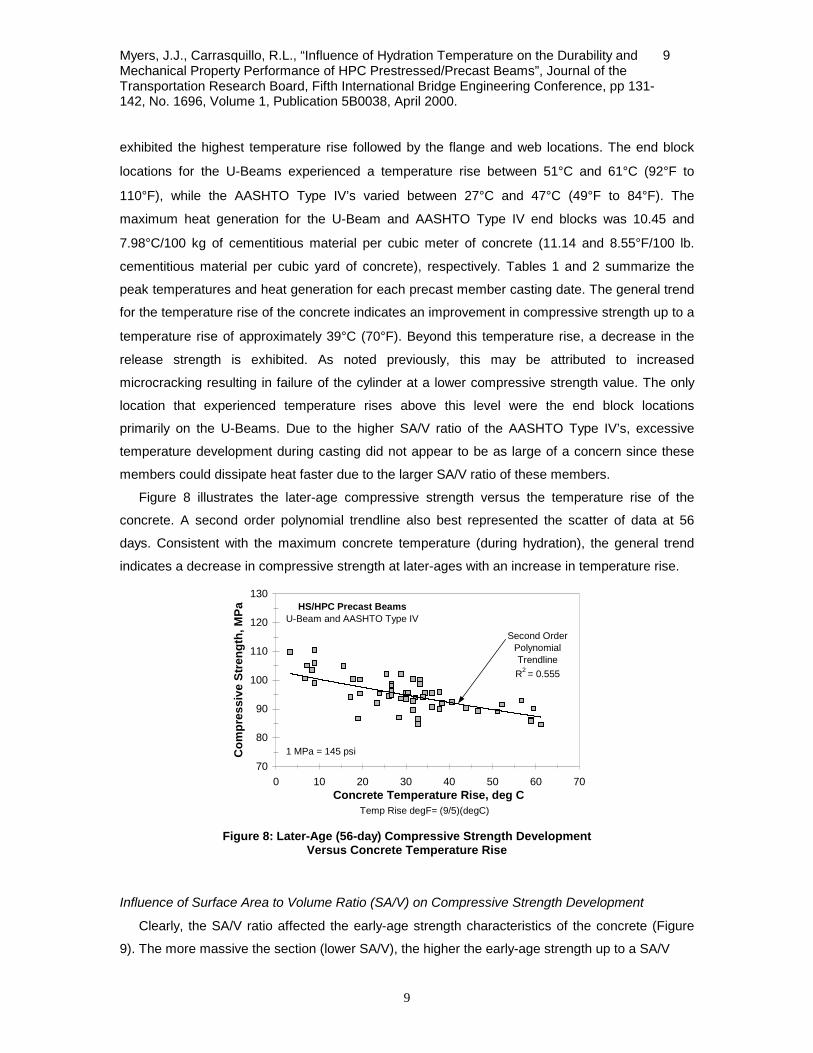
Figure 8 illustrates the later-age compressive strength versus the temperature rise of the
concrete. A second order polynomial trendline also best represented the scatter of data at 56
days. Consistent with the maximum concrete temperature (during hydration), the general trend
indicates a decrease in compressive strength at later-ages with an increase in temperature rise.
70
80
90
100
110
120
130
0 10 20 30 40 50 60 70Concrete Temperature Rise, deg C
Com
pres
sive
Str
engt
h, M
Pa HS/HPC Precast BeamsU-Beam and AASHTO Type IV
Second OrderPolynomialTrendlineR2 = 0.555
Temp Rise degF= (9/5)(degC)
1 MPa = 145 psi
Figure 8: Later-Age (56-day) Compressive Strength Development
Versus Concrete Temperature Rise
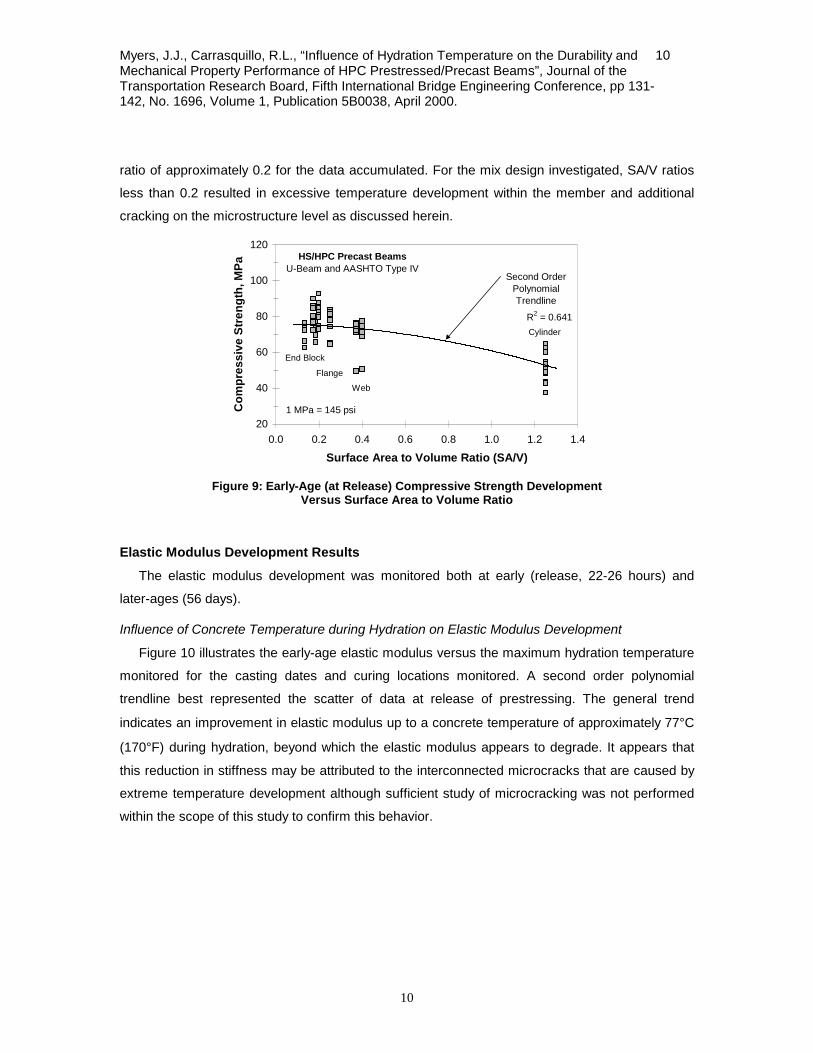
Influence of Surface Area to Volume Ratio (SA/V) on Compressive Strength Development
Clearly, the SA/V ratio affected the early-age strength characteristics of the concrete (Figure
9). The more massive the section (lower SA/V), the higher the early-age strength up to a SA/V
Myers, J.J., Carrasquillo, R.L., “Influence of Hydration Temperature on the Durability and Mechanical Property Performance of HPC Prestressed/Precast Beams”, Journal of the Transportation Research Board, Fifth International Bridge Engineering Conference, pp 131-142, No. 1696, Volume 1, Publication 5B0038, April 2000.
10
10
ratio of approximately 0.2 for the data accumulated. For the mix design investigated, SA/V ratios
less than 0.2 resulted in excessive temperature development within the member and additional
cracking on the microstructure level as discussed herein.
R2 = 0.641
20
40
60
80
100
120
0.0 0.2 0.4 0.6 0.8 1.0 1.2 1.4
Surface Area to Volume Ratio (SA/V)
Com
pres
sive
Str
engt
h, M
PaHS/HPC Precast Beams
U-Beam and AASHTO Type IVSecond Order
PolynomialTrendline
End Block
Web
Flange
Cylinder
1 MPa = 145 psi
Figure 9: Early-Age (at Release) Compressive Strength Development
Versus Surface Area to Volume Ratio
Elastic Modulus Development Results
The elastic modulus development was monitored both at early (release, 22-26 hours) and
later-ages (56 days).
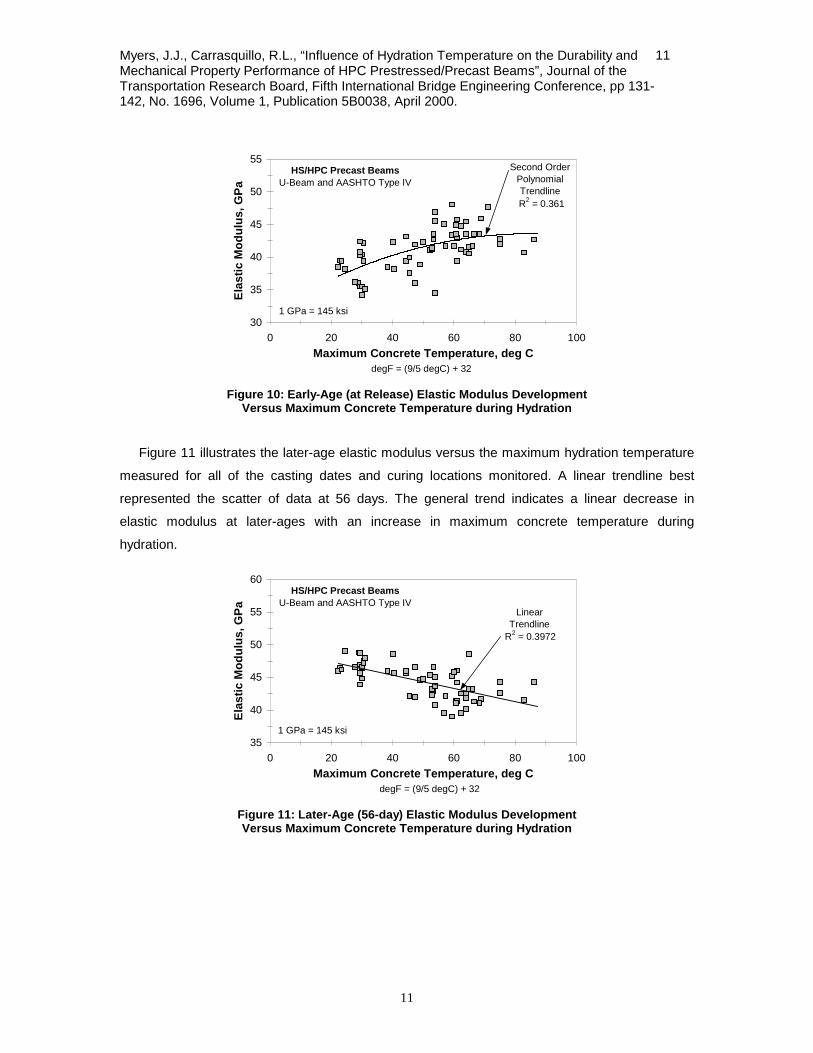
Influence of Concrete Temperature during Hydration on Elastic Modulus Development
Figure 10 illustrates the early-age elastic modulus versus the maximum hydration temperature
monitored for the casting dates and curing locations monitored. A second order polynomial
trendline best represented the scatter of data at release of prestressing. The general trend
indicates an improvement in elastic modulus up to a concrete temperature of approximately 77°C
(170°F) during hydration, beyond which the elastic modulus appears to degrade. It appears that
this reduction in stiffness may be attributed to the interconnected microcracks that are caused by
extreme temperature development although sufficient study of microcracking was not performed
within the scope of this study to confirm this behavior.
Myers, J.J., Carrasquillo, R.L., “Influence of Hydration Temperature on the Durability and Mechanical Property Performance of HPC Prestressed/Precast Beams”, Journal of the Transportation Research Board, Fifth International Bridge Engineering Conference, pp 131-142, No. 1696, Volume 1, Publication 5B0038, April 2000.
11
11
R2 = 0.361
30
35
40
45
50
55
0 20 40 60 80 100Maximum Concrete Temperature, deg C
Elas
tic M
odul
us, G
Pa
HS/HPC Precast BeamsU-Beam and AASHTO Type IV
Second Order PolynomialTrendline
1 GPa = 145 ksi
degF = (9/5 degC) + 32 Figure 10: Early-Age (at Release) Elastic Modulus Development
Versus Maximum Concrete Temperature during Hydration
Figure 11 illustrates the later-age elastic modulus versus the maximum hydration temperature
measured for all of the casting dates and curing locations monitored. A linear trendline best
represented the scatter of data at 56 days. The general trend indicates a linear decrease in
elastic modulus at later-ages with an increase in maximum concrete temperature during
hydration.
R2 = 0.3972
35
40
45
50
55
60
0 20 40 60 80 100Maximum Concrete Temperature, deg C
Elas
tic M
odul
us, G
Pa
HS/HPC Precast BeamsU-Beam and AASHTO Type IV
LinearTrendline
1 GPa = 145 ksi
degF = (9/5 degC) + 32 Figure 11: Later-Age (56-day) Elastic Modulus Development Versus Maximum Concrete Temperature during Hydration
Myers, J.J., Carrasquillo, R.L., “Influence of Hydration Temperature on the Durability and Mechanical Property Performance of HPC Prestressed/Precast Beams”, Journal of the Transportation Research Board, Fifth International Bridge Engineering Conference, pp 131-142, No. 1696, Volume 1, Publication 5B0038, April 2000.
12
12
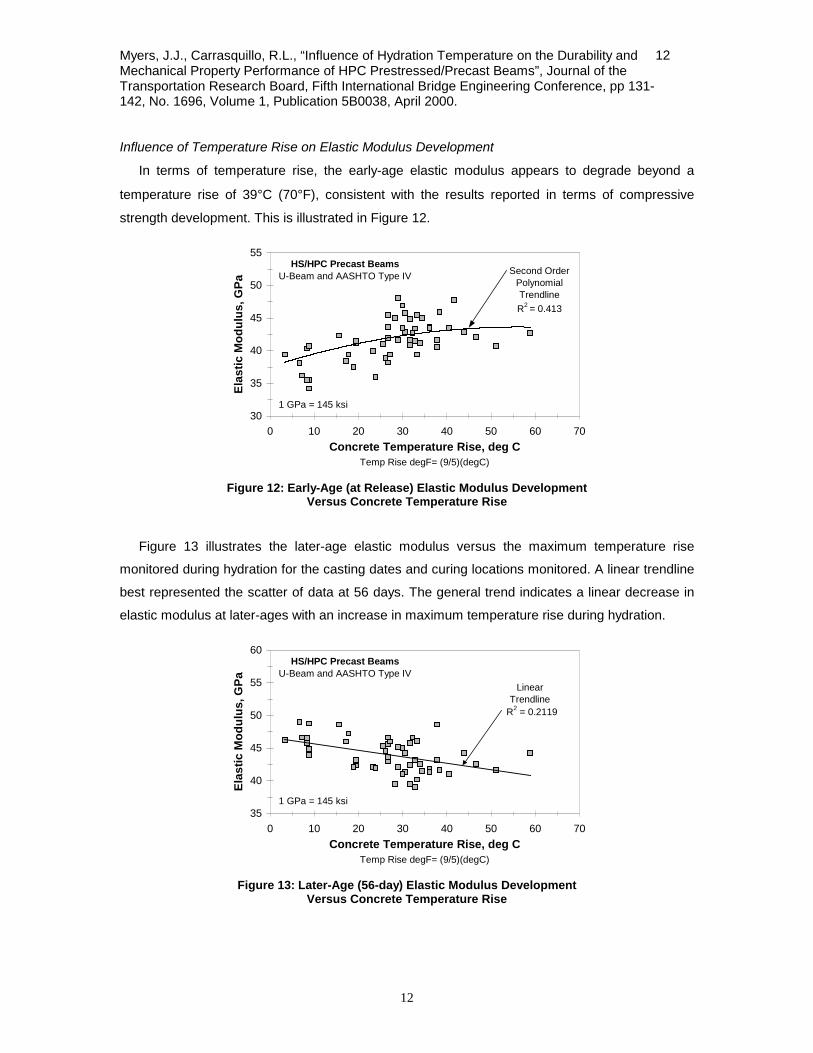
Influence of Temperature Rise on Elastic Modulus Development
In terms of temperature rise, the early-age elastic modulus appears to degrade beyond a
temperature rise of 39°C (70°F), consistent with the results reported in terms of compressive
strength development. This is illustrated in Figure 12.
30
35
40
45
50
55
0 10 20 30 40 50 60 70Concrete Temperature Rise, deg C
Elas
tic M
odul
us, G
Pa
HS/HPC Precast BeamsU-Beam and AASHTO Type IV Second Order
PolynomialTrendlineR2 = 0.413
Temp Rise degF= (9/5)(degC)
1 GPa = 145 ksi
Figure 12: Early-Age (at Release) Elastic Modulus Development
Versus Concrete Temperature Rise
Figure 13 illustrates the later-age elastic modulus versus the maximum temperature rise
monitored during hydration for the casting dates and curing locations monitored. A linear trendline
best represented the scatter of data at 56 days. The general trend indicates a linear decrease in
elastic modulus at later-ages with an increase in maximum temperature rise during hydration.
R2 = 0.2119
35
40
45
50
55
60
0 10 20 30 40 50 60 70Concrete Temperature Rise, deg C
Elas
tic M
odul
us, G
Pa
HS/HPC Precast BeamsU-Beam and AASHTO Type IV
LinearTrendline
Temp Rise degF= (9/5)(degC)
1 GPa = 145 ksi
Figure 13: Later-Age (56-day) Elastic Modulus Development
Versus Concrete Temperature Rise
Myers, J.J., Carrasquillo, R.L., “Influence of Hydration Temperature on the Durability and Mechanical Property Performance of HPC Prestressed/Precast Beams”, Journal of the Transportation Research Board, Fifth International Bridge Engineering Conference, pp 131-142, No. 1696, Volume 1, Publication 5B0038, April 2000.
13
13
MATERIAL (DURABILITY) PERFORMANCE
Precast/prestressed concrete has long had the reputation of being a very durable long lasting
concrete as evidenced by performance of many P/C bridges to date. Much of this reputation has
been attributed to the prestressing, which reduces any crack widths, thereby slowing the ingress
of chlorides and other harmful chemicals. Furthermore, the durability performance has also been
attributed to the higher quality concretes and the tighter quality control measures instituted by
many precast plants. This investigation was undertaken to examine if the higher concrete
temperatures during hydration associated with the precast/prestressed concrete members
influenced the permeability of the concrete and thereby the durability performance.
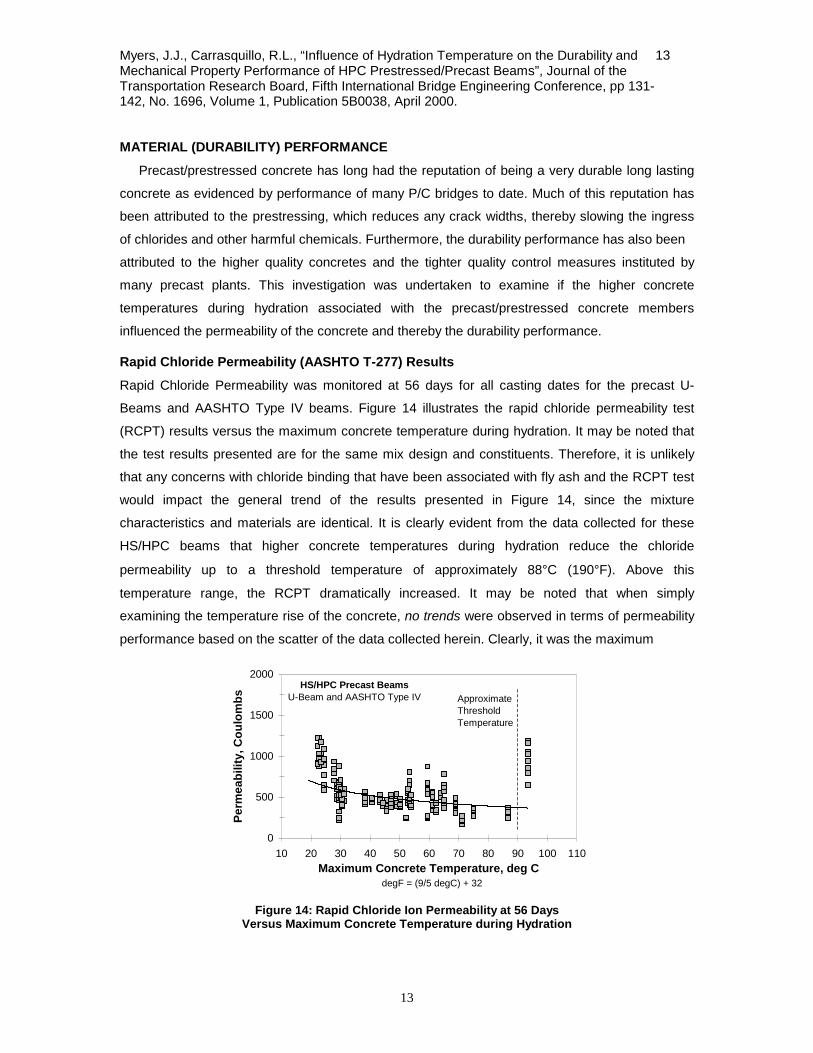
Rapid Chloride Permeability (AASHTO T-277) Results
Rapid Chloride Permeability was monitored at 56 days for all casting dates for the precast U-
Beams and AASHTO Type IV beams. Figure 14 illustrates the rapid chloride permeability test
(RCPT) results versus the maximum concrete temperature during hydration. It may be noted that
the test results presented are for the same mix design and constituents. Therefore, it is unlikely
that any concerns with chloride binding that have been associated with fly ash and the RCPT test
would impact the general trend of the results presented in Figure 14, since the mixture
characteristics and materials are identical. It is clearly evident from the data collected for these
HS/HPC beams that higher concrete temperatures during hydration reduce the chloride
permeability up to a threshold temperature of approximately 88°C (190°F). Above this
temperature range, the RCPT dramatically increased. It may be noted that when simply
examining the temperature rise of the concrete, no trends were observed in terms of permeability
performance based on the scatter of the data collected herein. Clearly, it was the maximum
0
500
1000
1500
2000
10 20 30 40 50 60 70 80 90 100 110Maximum Concrete Temperature, deg C
Perm
eabi
lity,
Cou
lom
bs
HS/HPC Precast BeamsU-Beam and AASHTO Type IV
degF = (9/5 degC) + 32
ApproximateThreshold Temperature
Figure 14: Rapid Chloride Ion Permeability at 56 Days
Versus Maximum Concrete Temperature during Hydration
Myers, J.J., Carrasquillo, R.L., “Influence of Hydration Temperature on the Durability and Mechanical Property Performance of HPC Prestressed/Precast Beams”, Journal of the Transportation Research Board, Fifth International Bridge Engineering Conference, pp 131-142, No. 1696, Volume 1, Publication 5B0038, April 2000.
14
14
concrete temperature during hydration that affected the permeability performance rather than a
specific temperature rise of the concrete.
Microscopic Examinations
In order to determine what caused the behavior exhibited in the RCPT, the authors conducted
a three phase microscopic investigation. This included a low-level microscopic petrographic
investigation, a high-level microscopic microstructure examination, and a BSE scanning electron
microscope microstructure examination. Concrete from the same casting date and specimens
were used for each of these three investigations for consistency in sample evaluation. The results
from each of these investigations are presented below.
Petrographic Examination – Low Level Microscopic Examination
The first phase was a low-level microscopic petrographic examination. This investigation was
conducted by an independent private consultant [4] to examine three representative specimens
from the same casting date. The only variation in the three specimens was the maximum
concrete temperature during hydration encountered during casting. The three specimens attained
a maximum concrete temperature during hydration of 29°C, 71°C, and 93°C (85°F, 160°F, and
200°F). To conduct an unbiased investigation, no preconditions were specified to the
petrographer other than to optically inspect the specimens and report any discerning features.
The cylinders were examined using methods given in ASTM C856, “Petrographic Examination of
Hardened Concrete”.
To the unaided eye, the only distinguishing feature that was observed by the petrographer
was a slightly lighter color of the paste in specimen 3 [maximum concrete temperature during
hydration of 93°C (200°F)]. Close-up photomicrographs of the paste matrix did not show
distinguishing features. Powdered paste studies showed cement and fly ash particles, as well as
normal hydrated products, but there were no distinguishing features that might relate to curing
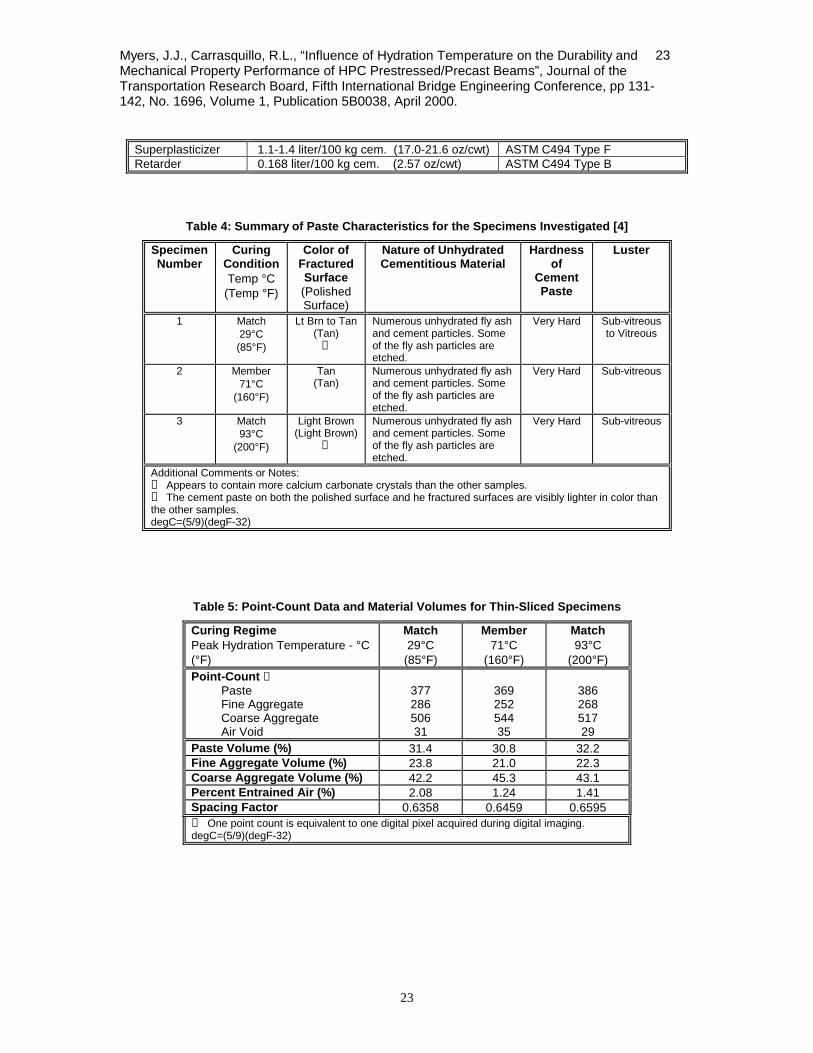
conditions or maximum hydration temperatures. The petrographer’s paste characteristics are
summarized in Table 4.
In summary, the petrographer noted that there were no outstanding optical or material
features that appeared to be influenced by the maximum concrete temperature during hydration.
The results of the low-level microscopic investigation did not indicate any reason for the variation
in permeability, as both the paste matrix and material features optically appeared similar.
Microstructure Analysis – High Level Microscopic Analysis
A higher level microscopic analysis was undertaken to more precisely optically examine the
microstructure of the concrete specimens. As noted previously, the same concrete specimens
were investigated. Thin-slices were prepared and examined at the Texas Department of
Myers, J.J., Carrasquillo, R.L., “Influence of Hydration Temperature on the Durability and Mechanical Property Performance of HPC Prestressed/Precast Beams”, Journal of the Transportation Research Board, Fifth International Bridge Engineering Conference, pp 131-142, No. 1696, Volume 1, Publication 5B0038, April 2000.
15
15
Transportation Materials and Tests Division in Austin, Texas. These slices were impregnated with
epoxy and mounted for optical examination. The epoxy impregnated any void space or
microcracks present on the thin slice. Table 5 summarizes the accumulated point-count data and
the resulting modified point-count results for the thin-sliced specimens after they were inspected
optically. Volume percentages were on the same order for each of the thin slices. Minor variations
in the counts may be attributed to sample location and the surface area size of the thin slices
examined.
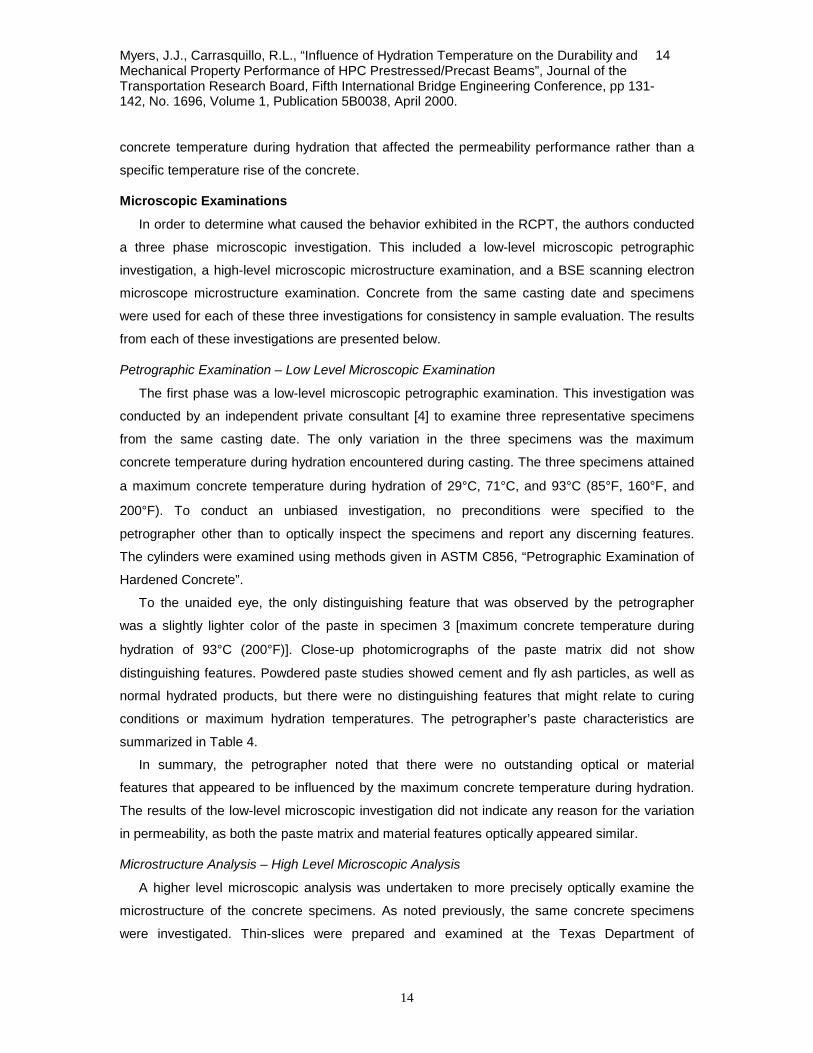
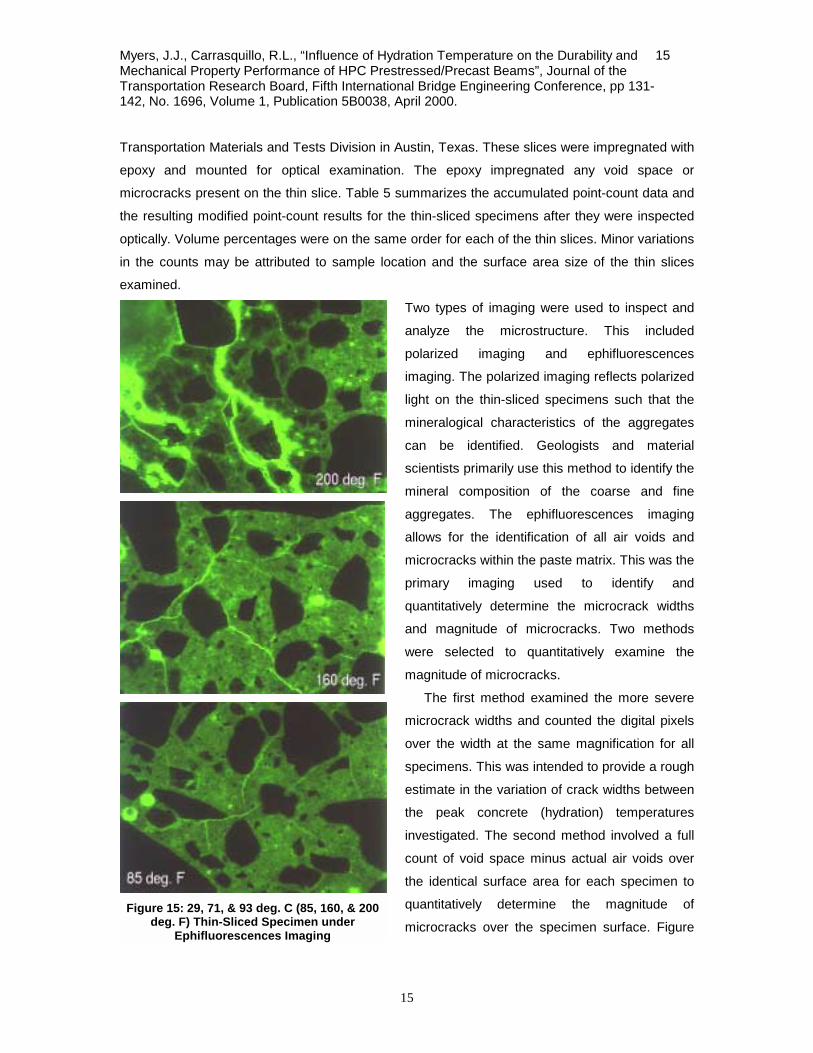
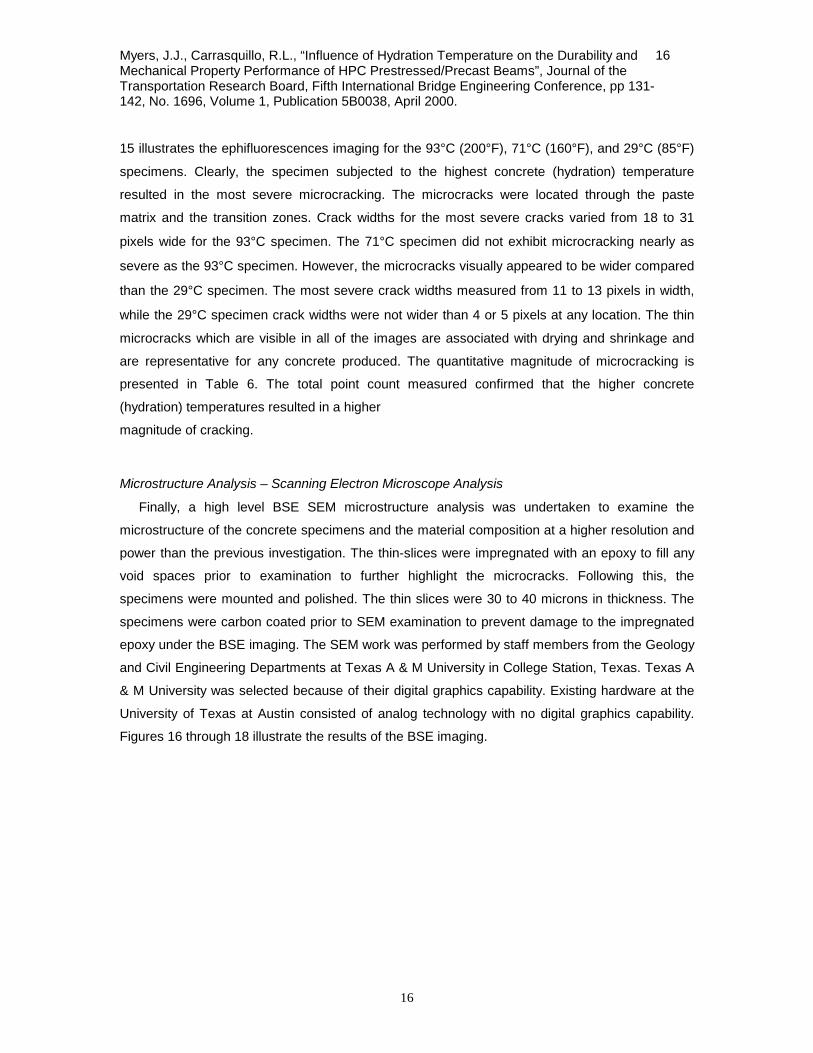
Two types of imaging were used to inspect and
analyze the microstructure. This included
polarized imaging and ephifluorescences
imaging. The polarized imaging reflects polarized
light on the thin-sliced specimens such that the
mineralogical characteristics of the aggregates
can be identified. Geologists and material
scientists primarily use this method to identify the
mineral composition of the coarse and fine
aggregates. The ephifluorescences imaging
allows for the identification of all air voids and
microcracks within the paste matrix. This was the
primary imaging used to identify and
quantitatively determine the microcrack widths
and magnitude of microcracks. Two methods
were selected to quantitatively examine the
magnitude of microcracks.
The first method examined the more severe
microcrack widths and counted the digital pixels
over the width at the same magnification for all
specimens. This was intended to provide a rough
estimate in the variation of crack widths between
the peak concrete (hydration) temperatures
investigated. The second method involved a full
count of void space minus actual air voids over
the identical surface area for each specimen to
quantitatively determine the magnitude of
microcracks over the specimen surface. Figure
Figure 15: 29, 71, & 93 deg. C (85, 160, & 200
deg. F) Thin-Sliced Specimen under Ephifluorescences Imaging
Myers, J.J., Carrasquillo, R.L., “Influence of Hydration Temperature on the Durability and Mechanical Property Performance of HPC Prestressed/Precast Beams”, Journal of the Transportation Research Board, Fifth International Bridge Engineering Conference, pp 131-142, No. 1696, Volume 1, Publication 5B0038, April 2000.
16
16
15 illustrates the ephifluorescences imaging for the 93°C (200°F), 71°C (160°F), and 29°C (85°F)
specimens. Clearly, the specimen subjected to the highest concrete (hydration) temperature
resulted in the most severe microcracking. The microcracks were located through the paste
matrix and the transition zones. Crack widths for the most severe cracks varied from 18 to 31
pixels wide for the 93°C specimen. The 71°C specimen did not exhibit microcracking nearly as
severe as the 93°C specimen. However, the microcracks visually appeared to be wider compared
than the 29°C specimen. The most severe crack widths measured from 11 to 13 pixels in width,
while the 29°C specimen crack widths were not wider than 4 or 5 pixels at any location. The thin
microcracks which are visible in all of the images are associated with drying and shrinkage and
are representative for any concrete produced. The quantitative magnitude of microcracking is
presented in Table 6. The total point count measured confirmed that the higher concrete
(hydration) temperatures resulted in a higher
magnitude of cracking.
Microstructure Analysis – Scanning Electron Microscope Analysis
Finally, a high level BSE SEM microstructure analysis was undertaken to examine the
microstructure of the concrete specimens and the material composition at a higher resolution and
power than the previous investigation. The thin-slices were impregnated with an epoxy to fill any
void spaces prior to examination to further highlight the microcracks. Following this, the
specimens were mounted and polished. The thin slices were 30 to 40 microns in thickness. The
specimens were carbon coated prior to SEM examination to prevent damage to the impregnated
epoxy under the BSE imaging. The SEM work was performed by staff members from the Geology
and Civil Engineering Departments at Texas A & M University in College Station, Texas. Texas A
& M University was selected because of their digital graphics capability. Existing hardware at the
University of Texas at Austin consisted of analog technology with no digital graphics capability.
Figures 16 through 18 illustrate the results of the BSE imaging.
Myers, J.J., Carrasquillo, R.L., “Influence of Hydration Temperature on the Durability and Mechanical Property Performance of HPC Prestressed/Precast Beams”, Journal of the Transportation Research Board, Fifth International Bridge Engineering Conference, pp 131-142, No. 1696, Volume 1, Publication 5B0038, April 2000.
17
17
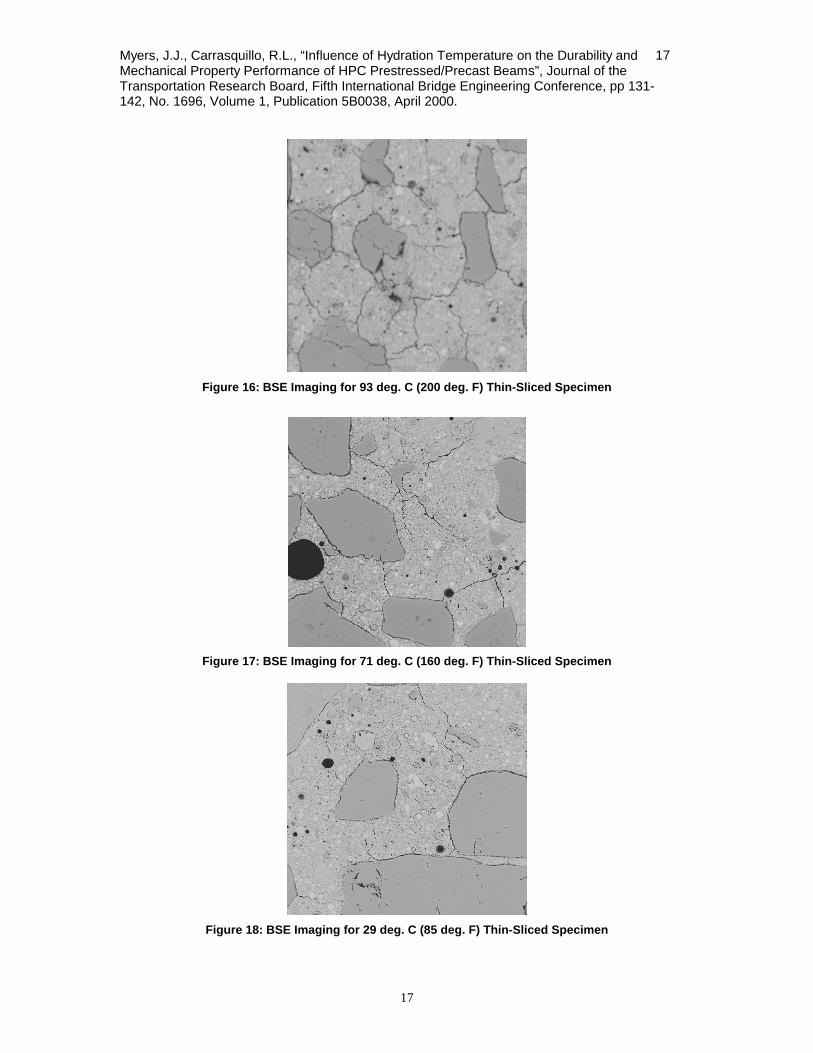
Figure 16: BSE Imaging for 93 deg. C (200 deg. F) Thin-Sliced Specimen
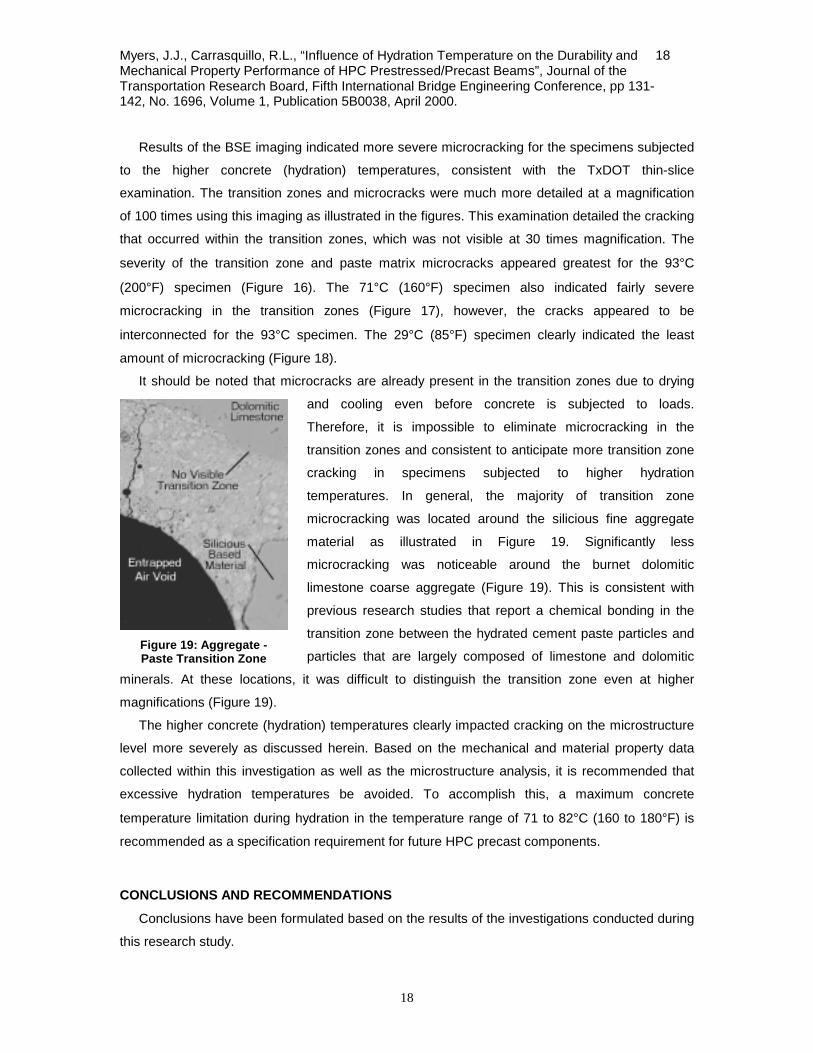
Figure 17: BSE Imaging for 71 deg. C (160 deg. F) Thin-Sliced Specimen
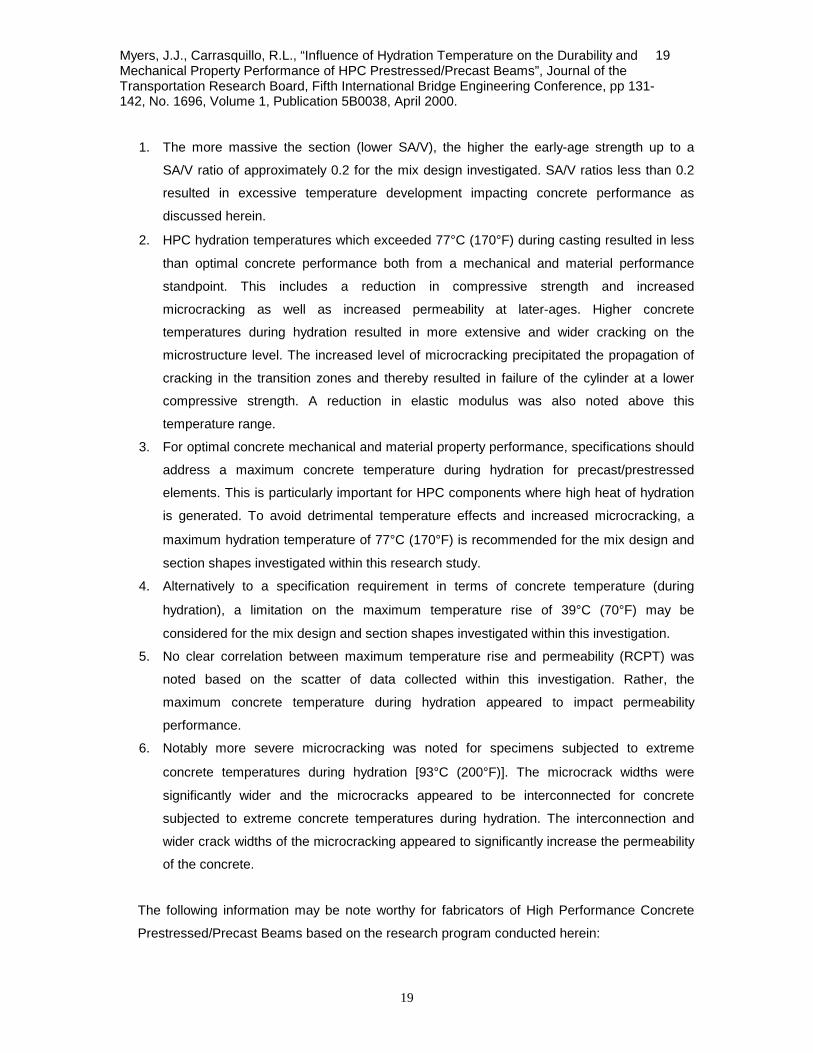
Figure 18: BSE Imaging for 29 deg. C (85 deg. F) Thin-Sliced Specimen
Myers, J.J., Carrasquillo, R.L., “Influence of Hydration Temperature on the Durability and Mechanical Property Performance of HPC Prestressed/Precast Beams”, Journal of the Transportation Research Board, Fifth International Bridge Engineering Conference, pp 131-142, No. 1696, Volume 1, Publication 5B0038, April 2000.
18
18
Results of the BSE imaging indicated more severe microcracking for the specimens subjected
to the higher concrete (hydration) temperatures, consistent with the TxDOT thin-slice
examination. The transition zones and microcracks were much more detailed at a magnification
of 100 times using this imaging as illustrated in the figures. This examination detailed the cracking
that occurred within the transition zones, which was not visible at 30 times magnification. The
severity of the transition zone and paste matrix microcracks appeared greatest for the 93°C
(200°F) specimen (Figure 16). The 71°C (160°F) specimen also indicated fairly severe
microcracking in the transition zones (Figure 17), however, the cracks appeared to be
interconnected for the 93°C specimen. The 29°C (85°F) specimen clearly indicated the least
amount of microcracking (Figure 18).
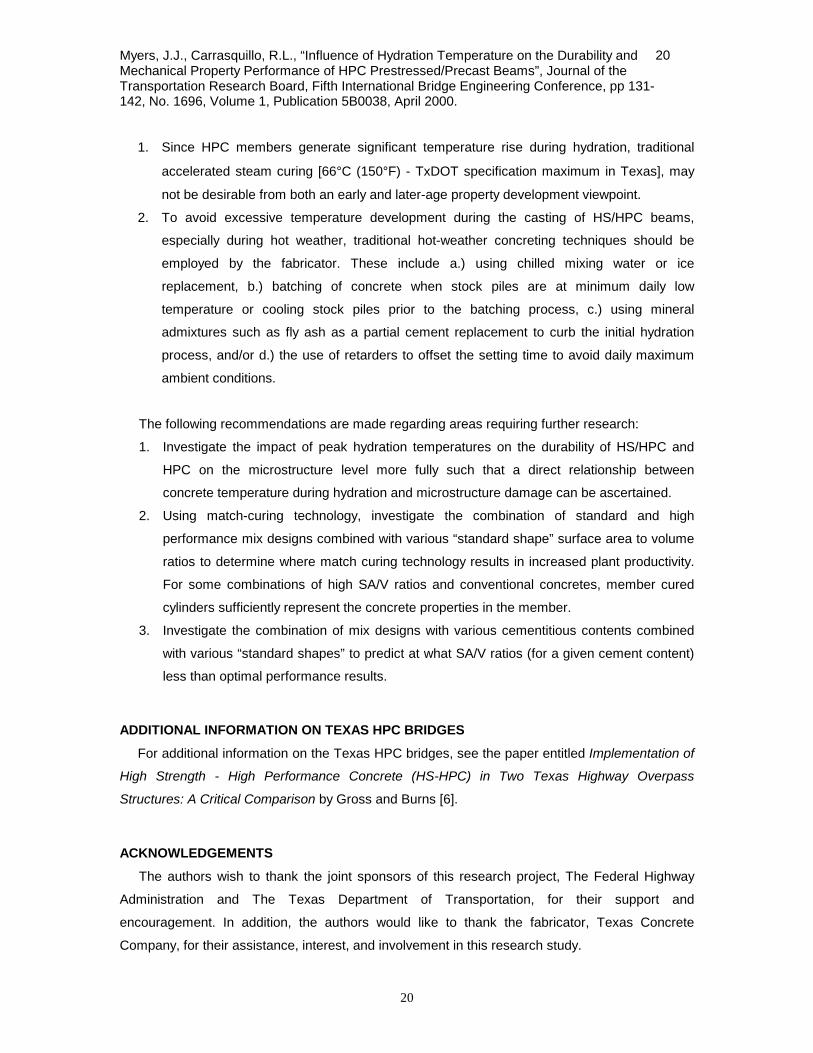
It should be noted that microcracks are already present in the transition zones due to drying
and cooling even before concrete is subjected to loads.
Therefore, it is impossible to eliminate microcracking in the
transition zones and consistent to anticipate more transition zone
cracking in specimens subjected to higher hydration
temperatures. In general, the majority of transition zone
microcracking was located around the silicious fine aggregate
material as illustrated in Figure 19. Significantly less
microcracking was noticeable around the burnet dolomitic
limestone coarse aggregate (Figure 19). This is consistent with
previous research studies that report a chemical bonding in the
transition zone between the hydrated cement paste particles and
particles that are largely composed of limestone and dolomitic
minerals. At these locations, it was difficult to distinguish the transition zone even at higher
magnifications (Figure 19).
The higher concrete (hydration) temperatures clearly impacted cracking on the microstructure
level more severely as discussed herein. Based on the mechanical and material property data
collected within this investigation as well as the microstructure analysis, it is recommended that
excessive hydration temperatures be avoided. To accomplish this, a maximum concrete
temperature limitation during hydration in the temperature range of 71 to 82°C (160 to 180°F) is
recommended as a specification requirement for future HPC precast components.
CONCLUSIONS AND RECOMMENDATIONS
Conclusions have been formulated based on the results of the investigations conducted during
this research study.
Figure 19: Aggregate - Paste Transition Zone
Myers, J.J., Carrasquillo, R.L., “Influence of Hydration Temperature on the Durability and Mechanical Property Performance of HPC Prestressed/Precast Beams”, Journal of the Transportation Research Board, Fifth International Bridge Engineering Conference, pp 131-142, No. 1696, Volume 1, Publication 5B0038, April 2000.
19
19
1. The more massive the section (lower SA/V), the higher the early-age strength up to a
SA/V ratio of approximately 0.2 for the mix design investigated. SA/V ratios less than 0.2
resulted in excessive temperature development impacting concrete performance as
discussed herein.
2. HPC hydration temperatures which exceeded 77°C (170°F) during casting resulted in less
than optimal concrete performance both from a mechanical and material performance
standpoint. This includes a reduction in compressive strength and increased
microcracking as well as increased permeability at later-ages. Higher concrete
temperatures during hydration resulted in more extensive and wider cracking on the
microstructure level. The increased level of microcracking precipitated the propagation of
cracking in the transition zones and thereby resulted in failure of the cylinder at a lower
compressive strength. A reduction in elastic modulus was also noted above this
temperature range.
3. For optimal concrete mechanical and material property performance, specifications should
address a maximum concrete temperature during hydration for precast/prestressed
elements. This is particularly important for HPC components where high heat of hydration
is generated. To avoid detrimental temperature effects and increased microcracking, a
maximum hydration temperature of 77°C (170°F) is recommended for the mix design and
section shapes investigated within this research study.
4. Alternatively to a specification requirement in terms of concrete temperature (during
hydration), a limitation on the maximum temperature rise of 39°C (70°F) may be
considered for the mix design and section shapes investigated within this investigation.
5. No clear correlation between maximum temperature rise and permeability (RCPT) was
noted based on the scatter of data collected within this investigation. Rather, the
maximum concrete temperature during hydration appeared to impact permeability
performance.
6. Notably more severe microcracking was noted for specimens subjected to extreme
concrete temperatures during hydration [93°C (200°F)]. The microcrack widths were
significantly wider and the microcracks appeared to be interconnected for concrete
subjected to extreme concrete temperatures during hydration. The interconnection and
wider crack widths of the microcracking appeared to significantly increase the permeability
of the concrete.
The following information may be note worthy for fabricators of High Performance Concrete
Prestressed/Precast Beams based on the research program conducted herein:
Myers, J.J., Carrasquillo, R.L., “Influence of Hydration Temperature on the Durability and Mechanical Property Performance of HPC Prestressed/Precast Beams”, Journal of the Transportation Research Board, Fifth International Bridge Engineering Conference, pp 131-142, No. 1696, Volume 1, Publication 5B0038, April 2000.
20
20
1. Since HPC members generate significant temperature rise during hydration, traditional
accelerated steam curing [66°C (150°F) - TxDOT specification maximum in Texas], may
not be desirable from both an early and later-age property development viewpoint.
2. To avoid excessive temperature development during the casting of HS/HPC beams,
especially during hot weather, traditional hot-weather concreting techniques should be
employed by the fabricator. These include a.) using chilled mixing water or ice
replacement, b.) batching of concrete when stock piles are at minimum daily low
temperature or cooling stock piles prior to the batching process, c.) using mineral
admixtures such as fly ash as a partial cement replacement to curb the initial hydration
process, and/or d.) the use of retarders to offset the setting time to avoid daily maximum
ambient conditions.
The following recommendations are made regarding areas requiring further research:
1. Investigate the impact of peak hydration temperatures on the durability of HS/HPC and
HPC on the microstructure level more fully such that a direct relationship between
concrete temperature during hydration and microstructure damage can be ascertained.
2. Using match-curing technology, investigate the combination of standard and high
performance mix designs combined with various “standard shape” surface area to volume
ratios to determine where match curing technology results in increased plant productivity.
For some combinations of high SA/V ratios and conventional concretes, member cured
cylinders sufficiently represent the concrete properties in the member.
3. Investigate the combination of mix designs with various cementitious contents combined
with various “standard shapes” to predict at what SA/V ratios (for a given cement content)
less than optimal performance results.
ADDITIONAL INFORMATION ON TEXAS HPC BRIDGES
For additional information on the Texas HPC bridges, see the paper entitled Implementation of
High Strength - High Performance Concrete (HS-HPC) in Two Texas Highway Overpass
Structures: A Critical Comparison by Gross and Burns [6].
ACKNOWLEDGEMENTS
The authors wish to thank the joint sponsors of this research project, The Federal Highway
Administration and The Texas Department of Transportation, for their support and
encouragement. In addition, the authors would like to thank the fabricator, Texas Concrete
Company, for their assistance, interest, and involvement in this research study.
Myers, J.J., Carrasquillo, R.L., “Influence of Hydration Temperature on the Durability and Mechanical Property Performance of HPC Prestressed/Precast Beams”, Journal of the Transportation Research Board, Fifth International Bridge Engineering Conference, pp 131-142, No. 1696, Volume 1, Publication 5B0038, April 2000.
21
21
REFERENCES
1. Myers, J.J., Carrasquillo, R.L., Production and Quality Control of High Performance Concrete in Texas Bridge Structures, The University of Texas at Austin, Center for Transportation Research, Preliminary Research Report, Number 580/589-1, December 1998.
2. Myers, J.J., Carrasquillo, R.L., Quality Control & Quality Assurance Program for Precast Plant Produced High Performance Concrete U-Beams, PCI/FHWA International Symposium on High Performance Concrete, Advanced Concrete Solutions for Bridges and Transportation Structures, New Orleans, October 1997, pp. 368-382
3. Patty, T.S., Deno, D.W., “Petrographic Studies of High Performance Concrete Test Cylinders,” Wiss, Janney, Elstner Associates, Inc., WJE No. 981061, July 2, 1998.
4. Gross, S.P., Burns, N.H., Implementation of High Strength - High Performance Concrete (HS-HPC) in Two Texas Highway Overpass Structures: A Critical Comparison, IBEC Conference Proceedings, Tampa, Florida, 2000.
Myers, J.J., Carrasquillo, R.L., “Influence of Hydration Temperature on the Durability and Mechanical Property Performance of HPC Prestressed/Precast Beams”, Journal of the Transportation Research Board, Fifth International Bridge Engineering Conference, pp 131-142, No. 1696, Volume 1, Publication 5B0038, April 2000.
22
22
Table 1: Temperature Development of Prestressed / Precast U-Beams
Casting Date (Mo-Day-Yr)
“Light” Steam Curing
Peak Temperature, deg C (deg F)
Temperature Rise,
deg C (deg F)
Heat Generation °C/100 kg cem mat’l/m3
(°F/100 lbs cem mat’l/yd3) 9-23-94 No 96.7 (206) 61.1 (110) 10.45 (11.14) 9-30-94 No 95.0 (203) 58.9 (106) 10.07 (10.74) 10-7-94 No 95.0 (203) 59.4 (107) 10.16 (10.84)
10-28-94 Yes 85.0 (185) 56.7 (102) 9.69 (10.33) 11-3-94 No 84.4 (184) 55.6 (100) 9.50 (10.13)
11-10-94 Yes 82.8 (181) 52.2 (94) 8.93 (9.52) 2-15-96 No 86.1 (187) 58.9 (106) 10.07 (10.74) 2-26-96 No 87.2 (189) 54.4 (98) 9.31 (9.93) 3-8-96 No 86.7 (188) 54.4 (98) 9.31 (9.93)
Bold text indicates the maximum values encountered during casting of this member shape. All peak temperature locations were measured in the end blocks. “Light” Steam Curing refers to steam curing [< 38°C (100°F)] that was provided when ambient temperatures approached freezing to serve as a “buffer zone” between the member and the external environment. The researchers and fabricator wanted to protect the members against excessive internal thermal gradients at release. Additionally, since the high cementitious content of the concrete and the low SA/V ratio of the members generated a significant level of heat, it was determined that traditional accelerated steam curing would only be detrimental to the later-age property development of the concrete. deg F = (5/9deg C)+32
Table 2: Temperature Development of Prestressed / Precast AASHTO Type IV’s
Casting Date (Mo-Day-Yr)
“Light” Steam Curing
Peak Temperature, deg C (deg F)
Temperature Rise,
deg C (deg F)
Heat Generation °C/100 kg cem mat’l/m3
(°F/100 lbs cem mat’l/yd3) 4-1-96 No 52.5 (126) ➊ 25.6 (46) 4.37 (4.68)
2-19-97 No 63.9 (147) 36.1 (65) 6.17 (6.61) 2-25-97 Yes 53.9 (129) 30.0 (54) 5.13 (5.49) 3-3-97 No 63.9 (147) 33.3 (60) 5.70 (6.10) 3-8-97 No 61.1 (142) 30.6 (55) 5.22 (5.60)
3-15-97 No 61.1 (142) 30.6 (55) 5.22 (5.60) 3-22-97 No 68.9 (156) 38.3 (69) 6.55 (7.02) 3-29-97 No 71.1 (160) 41.7 (75) 7.12 (7.63) 4-7-97 No 75.0 (167) 46.7 (84) 7.98 (8.55)
4-12-97 No 45.6 (114) 27.2 (49) 4.65 (4.98) 4-18-97 No 66.1 (151) 37.8 (68) 6.46 (6.92) 4-28-97 No 75.0 (167) 43.9 (79) 7.50 (8.04)
Bold text indicates the maximum values encountered during casting of this member shape. All peak temperature locations were measured in the end blocks unless noted otherwise. ➊ Match curing not performed, value based on member cured cylinder. deg F = (5/9deg C)+32
Table 3: High Performance Concrete Mix Design utilized for the Precast/Prestressed Beams
Component Quantity Type Cement 398 kg/m3 (671 pcy) ASTM C150 Type III Fly Ash 187 kg/m3 (316 pcy) ASTM C618 Class C Fine Aggregate 610 kg/m3 (1029 pcy) Natural River Sand Coarse Aggregate 1138 kg/m3 (1918 pcy) Crushed Dolomitic Limestone,
12.7-mm (½”) max, ASTM GR 7 Water 147 kg/m3 (247 pcy) Potable
Myers, J.J., Carrasquillo, R.L., “Influence of Hydration Temperature on the Durability and Mechanical Property Performance of HPC Prestressed/Precast Beams”, Journal of the Transportation Research Board, Fifth International Bridge Engineering Conference, pp 131-142, No. 1696, Volume 1, Publication 5B0038, April 2000.
23
23
Superplasticizer 1.1-1.4 liter/100 kg cem. (17.0-21.6 oz/cwt) ASTM C494 Type F Retarder 0.168 liter/100 kg cem. (2.57 oz/cwt) ASTM C494 Type B
Table 4: Summary of Paste Characteristics for the Specimens Investigated [4]
Specimen Number
Curing Condition Temp °C
(Temp °F)
Color of Fractured Surface (Polished Surface)
Nature of Unhydrated Cementitious Material
Hardness of
Cement Paste
Luster
1 Match 29°C (85°F)
Lt Brn to Tan (Tan)
➊
Numerous unhydrated fly ash and cement particles. Some of the fly ash particles are etched.
Very Hard Sub-vitreous to Vitreous
2 Member 71°C
(160°F)
Tan (Tan)
Numerous unhydrated fly ash and cement particles. Some of the fly ash particles are etched.
Very Hard Sub-vitreous
3 Match 93°C
(200°F)
Light Brown (Light Brown)
➋
Numerous unhydrated fly ash and cement particles. Some of the fly ash particles are etched.
Very Hard Sub-vitreous
Additional Comments or Notes: ➊ Appears to contain more calcium carbonate crystals than the other samples. ➋ The cement paste on both the polished surface and he fractured surfaces are visibly lighter in color than the other samples. degC=(5/9)(degF-32)
Table 5: Point-Count Data and Material Volumes for Thin-Sliced Specimens
Curing Regime Peak Hydration Temperature - °C (°F)
Match 29°C
(85°F)
Member 71°C
(160°F)
Match 93°C
(200°F) Point-Count ➊
Paste Fine Aggregate Coarse Aggregate Air Void
377 286 506 31
369 252 544 35
386 268 517 29
Paste Volume (%) 31.4 30.8 32.2 Fine Aggregate Volume (%) 23.8 21.0 22.3 Coarse Aggregate Volume (%) 42.2 45.3 43.1 Percent Entrained Air (%) 2.08 1.24 1.41 Spacing Factor 0.6358 0.6459 0.6595 ➊ One point count is equivalent to one digital pixel acquired during digital imaging. degC=(5/9)(degF-32)

Myers, J.J., Carrasquillo, R.L., “Influence of Hydration Temperature on the Durability and Mechanical Property Performance of HPC Prestressed/Precast Beams”, Journal of the Transportation Research Board, Fifth International Bridge Engineering Conference, pp 131-142, No. 1696, Volume 1, Publication 5B0038, April 2000.
24
24
Table 6: Quantitative Magnitude of Microcracking
Curing Condition - Temp °°°°C (°°°°F)
Total Point Count of Microcracking ➊
Maximum Crack Widths
Match - 29°C (85°F) 216 5 pixels Member - 71°C (160°F) 309 13 pixels Match - 93°C (200°F) 500 31 pixels
➊ Point count measured over the same surface area for each specimen and does not include any air voids. One point count is equivalent to one digital pixel acquired during digital imaging.