INFLUENCE OF HUMAN PROTEINS ON THE RELAXiVITY OF Gd(lll ...
22
1.2 Cover Letter Attachment Page NiVE-.SITY CF MOfcS-HAINAUT MEDICAL SCHOOL Department of Organic Chemistry and NMR Laboratory 7000 MONS - BELGIUM tel.: 32-65-373516 Fax : 32-65-373520 N INFLUENCE OF HUMAN PROTEINS ON THE RELAXiVITY OF Gd(lll) COMPLEXES Authors: F. MATON L VANDER ELST R.N. MULLER To: K. vSAEBO Nycomed Imaging Analytical Dpt. March. 1995 GEHC Company Confidential - Exempt from FOIA
Transcript of INFLUENCE OF HUMAN PROTEINS ON THE RELAXiVITY OF Gd(lll ...

1.2 Cover Letter Attachment Page
NiVE-.SITY CF MOfcS-HAINAUT MEDICAL SCHOOL
Department of Organic Chemistry and NMR Laboratory
7000 MONS - BELGIUM tel.: 32-65-373516 Fax : 32-65-373520
N
INFLUENCE OF HUMAN PROTEINS ON THE RELAXiVITY OF
Gd(lll) COMPLEXES
Authors: F. MATON L VANDER ELST R.N. MULLER
To: K. vSAEBO Nycomed Imaging Analytical Dpt.
March. 1995
GEHC Company Confidential - Exempt from FOIA

1.2 Cover Letter Attachment Page 2 of 21
Introduction
We proceeded to a short term stability evaluation of MAGNEVIST, OMNISCAN and GADODIAMIDE in protein containing aqueous solutions by measuring their proton longitudinal relaxivity over a period of 27 hours at variable magnetic fields (NMRD).
To unambiguously distinguish the effect of Gd(lll) complex dissociation from its simple non-covalent association with the biological proteins, we also measured the rotationnal correlation time of the organic ligand throught the 2H relaxation rate of the deuterated molecules (labelled on the a position of carboxylate group). These last experiments were limited to the MAGNEVIST and the GADODIAMIDE. The calculations were carried out on Ti and T2 data.
Preparation
Gd(DTPA) dimeglumine salt
MAGNEVIST- SCHERING 82004 300690 - 0.469mg/ml Stock solution (468.9 ± 11.5)mM (checked by relaxometric method)
Gd(DTPA-BMA)
OMNISCAN - SQ-14-042288 S041 - 500mM - containing 25mM of Gd(DTPA-BMA)CaNa Stock solution (447.9 ± 7.0)mM (checked by relaxometric method)
GADODIAMIDE - SQ-14-042288 S041 - 500mM Stock solution (424.3 ± 8.0)mM (checked by relaxometric method)
2H Labelled DTPA and (DTPA-BMA)
The synthesis and characterization of DTPAd10 and (DTPA-BMA)d8 will be described in a further report.
Human Serum Albumin (HSA)
Fraction V Sigma Chemical Co. A-1653 Batch 126F-9357 The solution 4% by weight was prepared in ditilled water
Globulins
Cohn Fraction IV-4 Sigma Chemical Co. G-3637 Batch 115F-9358
Mixed Biological Proteins
We mixed up HSA and globulin in physiological amounts (36g/l HSA, 24g/l G) in distilled water.
2 GEHC Company Confidential ~ Exempt from FOIA
4
1.2 Cover Letter Attachment Page 3 of 21
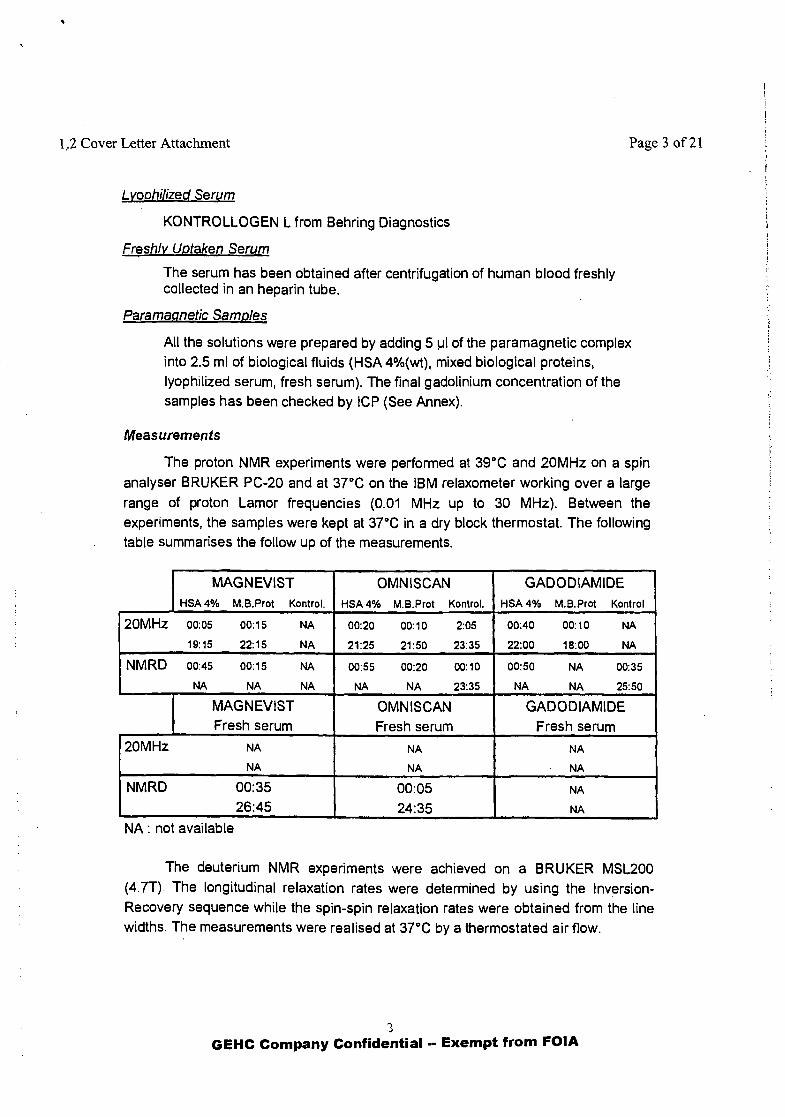
Lyophilized Serum
KONTROLLOGEN L from Behring Diagnostics
Freshly Uptaken Serum
The serum has been obtained after centrifugation of human blood freshly collected in an heparin tube.
Paramagnetic Samples
All the solutions were prepared by adding 5 ul of the paramagnetic complex into 2.5 ml of biological fluids (HSA4%(wt), mixed biological proteins, lyophilized serum, fresh serum). The final gadolinium concentration of the samples has been checked by ICP (See Annex).
Measurements
The proton NMR experiments were performed at 39°C and 20MHz on a spin analyser BRUKER PC-20 and at 37°C on the IBM relaxometer working over a large range of proton Lamor frequencies (0.01 MHz up to 30 MHz). Between the experiments, the samples were kept at 37°C in a dry block thermostat. The following table summarises the follow up of the measurements.
MAGNEVIST HSA 4% M.B.Prot Kontrol.
OMNISCAN HSA 4% M.B.Prot Kontrol.
GADODIAMIDE HSA 4% M.B.Prot Kontrol
20MHz 00:05 19:15
00:15 NA
22:15 NA
00:20
21:25
00:10
21:50
2:05
23:35
00:40
22:00
00:10
18:00
NA
NA
N M R D 00:45
NA
00:15
NA
NA
NA
00:55
NA
00:20
NA
00:10
23:35
00:50
NA
NA
NA
00:35
25:50
MAGNEVIST Fresh serum
OMNISCAN Fresh serum
GADODIAMIDE Fresh serum
20MHz NA
NA
NA
NA
NA
NA
NMRD 00:35 26:45
00:05 24:35
NA
NA
NA: not available
The deuterium NMR experiments were achieved on a BRUKER MSL200 (4 7T). The longitudinal relaxation rates were determined by using the Inversion-Recovery sequence while the spin-spin relaxation rates were obtained from the line widths. The measurements were realised at 37°C by a thermostated air flow.
-> GEHC Company Confidential -- Exempt from FOIA

1.2 Cover Letter Attachment Page 4 of21
Results
Proton experiments
From the table 1, it can be seen that in aqueous mixture of albumin and globulins, the 20MHz relaxivities of Gd(lll) complexes is slightly larger than those measured in distilled water but are not time dependent. This increase is likely due to a microviscosity change and a water content reduction (4% -6%).
20MHz 39°C
Table 1 - Relaxivities (s'mftQ MAGNEVIST OMNISCAN GADODIAMIDE
HSA 4% Mixed Prot Kontrol. HSA 4% Mixed Prot Kontrol. HSA 4% Mixed Prot Kontrol.
±00:30 ±24:00
4.20+0.14 4.40+0.19 NA
4.13+0.16 4.12+0.16 NA
3.2010.05 3.54±0.10 NA
3.18±0.07 3.36+0.07 NA
3.53±0.09 3.79±0.27 NA
3.40±0.05 3.67±0.13 NA
WATElv 3.84 ±0.16 3.85 ±0.19 3.85 ± 0.19
T̂ by IR pulse sequence -Mean values calculated on 8 measurements.
While the NMRD data (figures 1a,2a,3a) confirm the behaviour of the compounds in this protein containing medium, the relaxation profiles of OMNISCAN and GADODIAMIDE recorded in fresh or in lyophilized serum indicate a time dependence over ca.24 hours. The figures 2b,c and 3b show a net increase of the high field relaxivities which is a consequence of a T R lengthening. These results confirm previous studies which already suggested that a dissociation of the complex followed by the complexation of the released Gd(lll) by the proteins was taking place. This is demonstrated by deuterium experiments developped in the next section. We unsuccessfully tried to remove the Gd(lll) from the proteins by adding inorganic phosphate in the 26 hours old seric samples. On formation of insoluble GdP04, the relaxivities shoud have dropped. Since no such evolution was observed within 2 hours, we may conclude that either the protein complex is very stable or the degradation reaction is kinetically slow (figures 2b,3b).
4
GEHC Company Confidential -- Exempt from FOIA

1.2 Cover Letter Attachment Page 5 of21
Figures 1a, b
MAGNEVIST Protein Medium
7 - T= 37°C
5 6 • = : • • - ' - - _ r i N
6 ? V V * V » ^ v \ •W 1
_W 3 -
>. *
J5 3 J D Mixed Biological Proteins "~ £ j Elapsed time: 20 min
2 ^ • USA 4% (wt) 3 Elapsed time: 45 min
1 1 ' " " " I
0.01 0.1 1 10
Proton Larmor Frequencies (MHz)
Fresh Human Serum 10 -T-
9 -J
s o CC.
T = 37°C
1 4 1 3 -=
J 2 1 1 -5
O Elapsed time: 10 min • Elapsed time: 26 hours
Saline (reference)
0.01 0.1 1 10
Proton Larmor Frequencies (MHz)
Figures 2a, b, c
Protein Medium OMNISCAN
Lyophilized Serum
j T V-E J2. 5
* 4 --.5 Saline (reference) x f e -•2 3 Q Mixed Biological P r o t e i n s ^ LX 3 Elapsed time: 20 min
2 - i T HSA 4% (wt) i Elapsed time: 45 min
1 T T - m q -
0.01 0.1 •nnr
1
_ 6
J 5 jo
2 - 4
.2 * 7 JH "5 LX
T = 37"C
1
2-?
O
•
Elapsed time: 10 min
Elapsed time: 26 hours
2 mmol. PO4 added
after 26 hours
10
Proton Larmor Frequencies (MHz)
1 - 1 1 1 1 I I I ! M | | 1 I ' n u l l T - r J
0.01 0.1 1 10
Proton Larmor Frequencies (MHz)
S E
:§ X JO
or
Fresh Human Serum
T = 37"C Elapsed time 5 min
Elapsed lime 27 hours
Reference (aqueous)
0.01 0.1 1 10
Proton Larmor Frequencies (MHz)
GEHC Company Confidential - Exempt from FOIA

1.2 Cover Letter Attachment Page 6 of21
Figures 3a,b
GADODIAMIDE Protein Medium Lyophilised Serum
8 -H
~ 7 | g ° ° 8 a - ^ s i
E 5 Yis-.
2> > '5 j o 4) CC
4 - T=37°C riN
3 J Saline (reference) i Q Mixed Biological Proteins
, 1 Elapsed time: 20 min "j T HSA4%(wt) j Elapsed time: 45 min
1 I " " . I TTTTl] 1 • I I .11|| m
0.01 0.1 1 10
Proton Larmor Frequencies (MHz)
5 -; 'in
1 2-3 1
0
T=»37"C
O Elapsed time: 35 min
• Elapsed time: 26 hours
• 2 mmol. P04 3" added after 26 hours
1111 n i | i 11 u i i ' i — i T 0.01 0.1 1 10
Proton Larmor Frequencies (MHz)
Deuterium experiments
Knowing that Gd(DTPA) does not to interact with serum, the effect observed on Ri when the complex is dissolved in serum must be due to microviscosity effects SinceR] = est*TR, where xR is temperature dependent (eq.1), the ratio of Ri observed in water and in serum over the explored temperature rangewill be proportional to the change of viscosity between water and serum.
Figure 4 Table 2 Ratio of Ri in water and serum calculated from the fitted curves (figure 4)
Rl(»rum/
Rl (water)
5°C 15'C 25'C 37'C 1.437 1.387 1.343 1.294
10 _, , — 0 0031 0.0032 0 0033 0 0034 0 0035 0 0036 0.0037
3kT R ^1 Eft RT
Eq.1
From these results and knowing the Ri of the (DTPA-BMA) in water (fig.5), one can estimate its relaxation rate in serum at each temperature when only viscosity and microviscosity effects are considered and are assumed to be identical to those observed for DTPA solutions (fig.6)
GEHC Company Confidential - Exempt from FOIA

1.2 Cover Letter Attachment Page 7 of 21
Table 3 Estimated and observed values of R, of (DTPA-BMA) in serum (Fig 5, 6) - 50mM
5°C 15°C 25°C 37'C
R i »sf
R l measured
93.06 66.53 48.27 33.7 82.6±4.1 67.1 ±3.2 47.95±1.4 36.2 ±1.2
* R l es t imated = R l (wat«r) fitted * R l (wa te r )DTPA/R l (SERUM) OTPA
Figure 5
• DTPABMA H.O
regression
Figure 6
• DTPABMA »mm obs • DTPABMA serum calc |
10 ; , 10 1 :
0.0031 0.0032 0 0033 0.0034 0.0035 0.0036 0.0037 0 0032 0 0033 0 0034 0 0035 0 0036
1/T 1/T
From the similitude of observed and calculated R1 , one could indeed conclude that the effect seen on RT is due only to viscosity and preclude additionnal reduction of the mobility due to interactions with serum proteins.
The NMR line at half height is related to T 2 and thus also to TR. Consequently, its measurement allows a direct evaluation of the change of small ligands mobility induced by their interaction with the macromolecules. Deuterium linewidths of DTPA-d i 0 and (DTPA-BMA)-d8 50 mM have been measured in saline solutions and serum (Kontrollogen L). The broadening of DTPA resonances in serum solution as compared to saline solution is * 6.2 Hz (figure 7). Since DTPA is known not to bind to proteins, this increase is attributed to viscosity or microviscosity effect on TR. After two hours, (DTPA-BMA) linebroadening is of the same order of magnitude (a 7.5 Hz) (figure 8). After 24 hours in serum (6 hours at 310°K), the line broadening is = 5 Hz. This confirms that (DTPA-BMA) does not bind to serum proteins.
It has to be noticed that a significant broadening has been observed for DTPA derivatives carrying lipophilic groups
GEHC Company Confidential - Exempt from FOIA

1.2 Cover Letter Attachment Page 8 of21
Figure 7
DTPAd, 10
Figure 8
(DTPA-BMAU
Water Water
US t HERTZ
-18B 183 3 HESTI
-I3B
Serum Serum after 2 hours
ma HERTZ
133 • ia HERTZ
Serum after 24 hours
8 GEHC Company Confidential -- Exempt from FOIA

1.2 Cover Letter Attachment Page 9 of21
Conclusion
None of the compounds evolves in aqueous mixture of albumin and globulins over a period 24H00. The higher high field relaxivities observed in those media are attributed to both the microviscosity change and the water content reduction. In serum (both fresh and lyophilized material), the high field relaxivities of OMNISCAN and GADODIAMIDE significantly increase during period. The formulation of samples does not influence the stability of the gadolinium complex in those media.
Previous investigations concerning the interactions between Gd(lll) ion and human proteins indicate that this behaviour is a consequence of a partial dissociation of complexes. This conclusion is confirmed by 2H measurements. It has to be mentionned that the time course of the dissociation process is long in comparison with the excretion kinetics of OMNISCAN. The interesting question of the reason why the dissociation takes place in serum and not in the simple mixture of proteins remains unsolved but would deserve more research work.
9 GEHC Company Confidential ~ Exempt from FOIA

1.2 Cover Letter Attachment Page 10 of 21
Annex
ICP Measurements
The Gd(lll) content was directly measured on samples involved in NMR experiments. The following table includes the actual Gd(lll) concentration of samples and the correction factor which has to be onlv applied on NMRD relaxivities stored on the floppy disk and in the next tables1.
Gd(lll) Concentration (mM) Correction factor
MAGNEVIST HSA 4% M.B.Prot Kontrol.
OMNISCAN HSA 4% M.B.Prot Kontrol.
GADODIAMIDE HSA 4% M.B.Prot Kontrol.
1.077+0.027 1.10710.039 NA 1.08210.009 1.07010.017 0.94810.011 1.11010.011 1.06110.029 0.99010.010
0.8690 0.8454 NA 0.8263 0.8355 0.9428 0.7631 0.7963 0.8559
MAGNEVIST Fresh serum
OMNISCAN Fresh serum
GADODIAMIDE Fresh serum
1.138 ±0.009 0.826 ±0.011 NA 0.8225 1.0823 NA
NA: not available.
Additionnal NMRD Relaxivities æncernina the lipphilized serum
"NYCOMED - KAREN - 0.847MM GADODIAMIDE IN KONTROLLOGEN L TEMP = 37.00"
0.010 7.832 0.020 7.815 0.040 8.000 0.100 7.934 0.200 7.920 0.200 7.602 0.400 8.116 1.000 7.987 2.000 7.571 2.000 7.564 4.000 7.048 6.000 6.268 10.000 5.850 10.000 5.432 20.000 5.436 20.000 5.137 30.000 4.902
"NYCOMED - KAREN • 0.847 MM GADODIAMIDE IN KONTROLLOGEN L - 24H00 TEMP = 37.00"
0.010 7.261 0.020 7.358 0.040 6.900 0.100 6.620 0.200 6.769 0.400 7.123 1.000 6.734 2.000 6.481 4.000 6.185 6.000 5.751 10.000 5.450 20.000 5.662 30.000 6.044
' By this way you will get the same NMRD profiles that we present In this report.
10
GEHC Company Confidential - Exempt from FOIA

1.2 Cover Letter Attachment Page 11 of21
"NYCOMED - KAREN - 0.840 MM GADODIAMIDE IN KONTROLLOGEN L - 24H00 - 2.65 MM EXOGENEOUS (P04)3- TEMP = 37.00" 0.010 6.454 0.020 6.544 0.040 6.550 0.100 6.824 0.200 6.732 0.400 6.344 1.000 6.210 2.000 6.085 4.000 5.938 6.000 5.614 10.000 5.557 20.000 5.900 30.000 6.467
"NYCOMED - KAREN OMNISCAN 0.894MM IN KONTROLLOGEN L TEMP = 37.00" 0.010 7.125 0.020 7.060 0.040 7.078 0.100 6.978 0.200 7.008 0.400 7.102 1.000 6.830 2.000 6.521 4.000 5.954 6.000 5.827 10.000 4.801 20.000 4.456 30.000 4.597
"NYCOMED - KAREN - 0.894MM OMNISCAN IN KONTROLLOGEN L - 24H TEMP = 37.00 0.010 6.117 0.020 6.221 0.040 6.270 0.100 5.859 0.200 6.048 0.400 6.142 1.000 6.192 2.000 6.009 4.000 5.432 6.000 5.615 10.000 5.072 20.000 5.584 30.000 5.806
"NYCOMED - KAREN - 0.887MM OMNISCAN IN KONTROLLOGEN L - 24H00 - 2.65 MM EXOGENEOUS (P04)3- TEMP = 37 00
0.010 5.752 0.020 5.843 0.040 5.814 0.100 6.038 0.200 5.679 0.400 5.870 1.000 5.611 2.000 5.546 4.000 5.335 6.000 5.156
10.000 4.950 10.000 4.955 20.000 5.032 30.000 5.404
"NYCOMED - KAREN • 0.894 MM OMNISCAN IN PLASMA OF K. TEMP = 37.00" 0.010 7.293 0.020 7.666 0.040 7.342 0.100 7.287 0.200 7.594 0.400 7.330 1.000 7.457 2.000 7.215 4.000 6.968 6.000 6.438 10.000 5.494 20.000 4.801 30.000 4.565
"NYCOMED - KAREN - 0.894 MM OMNISCAN IN PLASMA OF K. - 24H00 TEMP = 37.00" 0.010 7.210 0.020 7.058 0.040 7.199 0.100 7.022 0.200 6.898 0.400 6.595 1.000 7.051 2.000 6.655 4.000 6.155 6.000 6.261 10.000 5.673 20.000 5.216 30.000 5.303
11
G E H C C o m p a n y Conf iden t ia l -- E x e m p t f rom F O I A

PROTEIN MEDIUM Magnevist
6 -n
0.01
X] Q_ -B-
T= 37°C
Saline (reference)
• Mixed Biologicai Proteins Elapsed time: 20 min
HSA 4% (wt) Elapsed time: 45 min
"1 T 1 \ ~ T T T r ~i 1 r — i — r -T- i -T
0.1 1
Proton Larmor Frequencies (MHz)
10
O u.
o L .
a E o x Ul
ffl
c Cl
c o o > l c n a E o o o X Ul
o

TIME DEPENDENCE OF THE RELAXIVITY Magnevist
Fresh Human Serum
• Elapsed time: 26 hours
Saline (reference)
T ~ i i i i i i i j i i i—i—i—i i i j 1 1 1—i—i—i i i g 1 1 r
0.01 0.1 1 10
Proton Larmor Frequencies (MHz)

PROTEINS MEDIUM Omniscan
T= 37°C
6 -
El-
— 5 -
4 -tn
> 'x CTJ OJ
a: 3
2 -
• -B- JQ. -O-
T = 37°C
•
Saline (reference)
Mixed Biological Proteins Elapsed time: 20 min
HSA 4% (wt) Elapsed time: 45 min
o u. o
a E o X Ul
c 0) sc c 0 o >» c a a E o u o X Ul
o -1 1 1—I—I I I I 1 1 1 — I — I ' l I I ~ I 1—I—I I I I
0.01 0.1 10
Proton Larmor Frequencies (MHz)

TIME DEPENDENCE OF THE RELAXIVITY OMNISCAN
Serum Kontrollogen L
Proton Larmor Frequencies (MHz)

<4-l O
<u CS
TIME DEPENDENCE OF THE RELAXIVITY OMNISCAN
Human Fresh Plasma
03
IU
U i (U
> O
u CN
> X
<u 4 al
2 -
0.01
o Elapsed time: 5 min
• Elapsed time: 27 hours
Reference (aqueous)
o u. E p o. E o x
IU
n
c o o > l c n a E o o
Ul o
n 1—i—i i i i - i 1 1—i—i i i i | - i 1 1 — i — i i i
0.1 10
Proton Larmor Frequencies (MHz)

PROTEINS MEDIUM Gadodiamide
6 -
• -e- • • n XL
T= 37°C
Saline (reference)
• Mixed Biological Proteins Elapsed time: 20 min
T HSA 4% (wt) Elapsed time: 45 min
T 1 1 1 1 I I I j
0.01 ~l 1 1—I—I—I I I
0.1
"1 1—I—I I I I I—
10 - i 1 r
Proton Larmor Frequencies (MHz)

1.2 Cover Letter Attachment Page 18 of 21
TIME DEPENDENCE OF THE RELAXIVITY Gadodiamide
Serum Kontrollogen L o U. E o
7 -cr
6 -
[3-
i
' > x - ?
2 -
1 -
X T -0 0 -o
o
-B -
T = 37°C
o Elapsed time: 35 min
• Elapsed time: 26 hours
s 2 mmol. PO43" added after 26 hours
a E o X Ul I
•3 • mm *• C
u sc c o o > l c CO
a E o o o X Ul
o
0.01 r
0.1 1 -r-r-T-r—
10
Proton Larmor Frequencies (MHz)

1.2 Cover Letter Attachment Page 19 of 21
100
TEMPERATURE DEPENDENCE OF R 1
SALINE AND LYOPHILIZED SERUM SOLUTIONS (DTPA) d 1 0
SALINE MEDIUM
LYOPHILIZED SERUM
00
X CM
oT
o IL E o
a E at x ui i
.2 C 0)
!C C o o >» c (0
a E o O a z Ul
o 10
0.0031
1
0.0032 0.0033 0.0034 0.0035
1/T(°K"1) 0.0036 0.0037

TEMPERATURE DEPENDENCE OF Ri IN SALINE SOLUTION
(DTPA-BMA)d8
- j | | , 1 n 1
0031 0.0032 0.0033 0.0034 0.0035 0.0036 0.0037
1/T

1.2 Cover Letter Attachment Page 21 of 21 «
X CM
100
90
80
70
60
50
of 40
30
20
TEMPERATURE DEPENDENCE OF Ri IN LYOPHILISED SERUM
Microviscosity Effects (DTPA-BMA)d8
• Observed Values
A Calculated Values from data collected in saline medium
< o
2 a. E « x ui i w c tt *. c o o > l c n a E o o o X IU
o
I I I I I I I I
0.00320 0.00325 0.00330 0.00335 0.00340 0.00345 0.00350 0.00355 0.00360 0.00365
1/T