
Influence of Fibrin Network Conformation and Fibrin Fiber...
9
Influence of Fibrin Network Conformation and Fibrin Fiber Diameter on Fibrinolysis Speed Dynamic and Structural Approaches by Confocal Microscopy J.P. Collet, D. Park, C. Lesty, J. Soria, C. Soria, G. Montalescot, J.W. Weisel Abstract—Abnormal fibrin architecture is thought to be a determinant factor of hypofibrinolysis. However, because of the lack of structural knowledge of the process of fibrin digestion, relationships between fibrin architecture and hypofibrinolysis remain controversial. To elucidate further structural and dynamic changes occurring during fibrino- lysis, cross-linked plasma fibrin was labeled with colloidal gold particles, and fibrinolysis was followed by confocal microscopy. Morphological changes were characterized at fibrin network and fiber levels. The observation of a progressive disaggregation of the fibrin fibers emphasizes that fibrinolysis proceeds by transverse cutting rather than by progressive cleavage uniformly around the fiber. Plasma fibrin clots with a tight fibrin conformation made of thin fibers were dissolved at a slower rate than those with a loose fibrin conformation made of thicker (coarse) fibers, although the overall fibrin content remained constant. Unexpectedly, thin fibers were cleaved at a faster rate than thick ones. A dynamic study of FITC–recombinant tissue plasminogen activator distribution within the fibrin matrix during the course of fibrinolysis showed that the binding front was broader in coarse fibrin clots and moved more rapidly than that of fine plasma fibrin clots. These dynamic and structural approaches to fibrin digestion at the network and the fiber levels reveal aspects of the physical process of clot lysis. Furthermore, these results provide a clear explanation for the hypofibrinolysis related to a defective fibrin architecture as described in venous thromboembolism and in premature coronary artery disease. (Arterioscler Thromb Vasc Biol. 2000;20:1354-1361.) Key Words: fibrin n fibrinolysis n confocal microscopy T he fibrin matrix has a much more complicated role than that of providing the scaffolding of the thrombus or being the target of fibrinolysis. Abnormal fibrin structure in vitro has been related to in vivo premature coronary artery disease in young patients and to severe venous thromboembolic disease in patients with dysfibrinogenemias. 1,2 In those situ- ations, an abnormal fibrin matrix made up of abnormally thin fibers has been shown to promote hypofibrinolysis and embolization. Although much is known about the molecular basis of fibrinolysis, relationships between fibrin conforma- tion and fibrinolysis need to be clarified. Fibrin actively regulates its self-dissolution through nu- merous interactions with fibrinolytic and antifibrinolytic components. Activation of plasminogen by tissue plasmino- gen activator (tPA) that is initiated on the conversion of fibrinogen into fibrin is a critical step that is affected by fibrin structure. The theory of a decrease of plasminogen binding to fibrin 3 has been strengthened from observations showing that clots with a fine fibrin (tight) conformation display a slower lysis rate than those with a coarse fibrin (loose) conforma- tion. 2,4,5 So far, neither a molecular nor a structural basis has been detected for these differences. Moreover, a recent report demonstrates that under other conditions clots made of thin fibers may be lysed faster. 6 Recent structural studies have emphasized that fibrin di- gestion proceeds locally by transverse cutting across fibers rather than by progressive cleavage uniformly around the fiber and that changes of the fibrin network structure are spatially restricted to a zone in which high accumulation of fibrinolytic components takes place. 7–10 However, none of these findings provide sufficient conclusions regarding the impact of the fibrin network structure and the fibrin fiber diameter on fibrinolysis speed. In the present work, a dynamic approach using confocal microscopy was designed to assess the impact of fibrin network conformation and fibrin fiber diameter on the speed of fibrinolysis. Simultaneously, dynamic measurements of the distribution of fibrinolytic components in thin and coarse fibrin types were made. This work reveals that tight fibrin networks are dissolved at a slower rate than loose ones but Received December 6, 1999; revision accepted January 28, 2000. From the Department of Cardiology (J.P.C., G.M.) and the Hemostasis Laboratory (C.L.), Pitie ´-Salpe ´trie `re Hospital, and the Research Laboratory Sainte Marie (J.S., C.S.), Hotel Dieu Hospital, Paris, France, and the Department of Cell and Developmental Biology (J.P.C., D.P., J.W.W.), University of Pennsylvania, Philadelphia. Presented in part as an abstract at the meeting of the International Society of Thrombosis and Haemostasis, August 16 to 20, Washington, DC, 1999. Correspondence to J.P. Collet, MD, PhD, Department of Cardiology, Centre Hospitalier Universitaire Pitie ´-Salpe ´trie `re, 47, boulevard de l’Ho ˆpital, 75013 Paris, France. E-mail [email protected] © 2000 American Heart Association, Inc. Arterioscler Thromb Vasc Biol. is available at http://www.atvbaha.org 1354 by guest on May 6, 2018 http://atvb.ahajournals.org/ Downloaded from
Transcript of Influence of Fibrin Network Conformation and Fibrin Fiber...

Influence of Fibrin Network Conformation and Fibrin FiberDiameter on Fibrinolysis Speed
Dynamic and Structural Approaches by Confocal Microscopy
J.P. Collet, D. Park, C. Lesty, J. Soria, C. Soria, G. Montalescot, J.W. Weisel
Abstract—Abnormal fibrin architecture is thought to be a determinant factor of hypofibrinolysis. However, because of thelack of structural knowledge of the process of fibrin digestion, relationships between fibrin architecture andhypofibrinolysis remain controversial. To elucidate further structural and dynamic changes occurring during fibrino-lysis, cross-linked plasma fibrin was labeled with colloidal gold particles, and fibrinolysis was followed by confocalmicroscopy. Morphological changes were characterized at fibrin network and fiber levels. The observation of aprogressive disaggregation of the fibrin fibers emphasizes that fibrinolysis proceeds by transverse cutting rather than byprogressive cleavage uniformly around the fiber. Plasma fibrin clots with a tight fibrin conformation made of thin fiberswere dissolved at a slower rate than those with a loose fibrin conformation made of thicker (coarse) fibers, although theoverall fibrin content remained constant. Unexpectedly, thin fibers were cleaved at a faster rate than thick ones. Adynamic study of FITC–recombinant tissue plasminogen activator distribution within the fibrin matrix during the courseof fibrinolysis showed that the binding front was broader in coarse fibrin clots and moved more rapidly than that of fineplasma fibrin clots. These dynamic and structural approaches to fibrin digestion at the network and the fiber levels revealaspects of the physical process of clot lysis. Furthermore, these results provide a clear explanation for thehypofibrinolysis related to a defective fibrin architecture as described in venous thromboembolism and in prematurecoronary artery disease.(Arterioscler Thromb Vasc Biol. 2000;20:1354-1361.)
Key Words: fibrin n fibrinolysis n confocal microscopy
The fibrin matrix has a much more complicated role thanthat of providing the scaffolding of the thrombus or being
the target of fibrinolysis. Abnormal fibrin structure in vitrohas been related to in vivo premature coronary artery diseasein young patients and to severe venous thromboembolicdisease in patients with dysfibrinogenemias.1,2 In those situ-ations, an abnormal fibrin matrix made up of abnormally thinfibers has been shown to promote hypofibrinolysis andembolization. Although much is known about the molecularbasis of fibrinolysis, relationships between fibrin conforma-tion and fibrinolysis need to be clarified.
Fibrin actively regulates its self-dissolution through nu-merous interactions with fibrinolytic and antifibrinolyticcomponents. Activation of plasminogen by tissue plasmino-gen activator (tPA) that is initiated on the conversion offibrinogen into fibrin is a critical step that is affected by fibrinstructure. The theory of a decrease of plasminogen binding tofibrin3 has been strengthened from observations showing thatclots with a fine fibrin (tight) conformation display a slowerlysis rate than those with a coarse fibrin (loose) conforma-
tion.2,4,5 So far, neither a molecular nor a structural basis hasbeen detected for these differences. Moreover, a recent reportdemonstrates that under other conditions clots made of thinfibers may be lysed faster.6
Recent structural studies have emphasized that fibrin di-gestion proceeds locally by transverse cutting across fibersrather than by progressive cleavage uniformly around thefiber and that changes of the fibrin network structure arespatially restricted to a zone in which high accumulation offibrinolytic components takes place.7–10 However, none ofthese findings provide sufficient conclusions regarding theimpact of the fibrin network structure and the fibrin fiberdiameter on fibrinolysis speed.
In the present work, a dynamic approach using confocalmicroscopy was designed to assess the impact of fibrinnetwork conformation and fibrin fiber diameter on the speedof fibrinolysis. Simultaneously, dynamic measurements ofthe distribution of fibrinolytic components in thin and coarsefibrin types were made. This work reveals that tight fibrinnetworks are dissolved at a slower rate than loose ones but
Received December 6, 1999; revision accepted January 28, 2000.From the Department of Cardiology (J.P.C., G.M.) and the Hemostasis Laboratory (C.L.), Pitie-Salpetriere Hospital, and the Research Laboratory
Sainte Marie (J.S., C.S.), Hotel Dieu Hospital, Paris, France, and the Department of Cell and Developmental Biology (J.P.C., D.P., J.W.W.), Universityof Pennsylvania, Philadelphia.
Presented in part as an abstract at the meeting of the International Society of Thrombosis and Haemostasis, August 16 to 20, Washington, DC, 1999.Correspondence to J.P. Collet, MD, PhD, Department of Cardiology, Centre Hospitalier Universitaire Pitie-Salpetriere, 47, boulevard de l’Hopital,
75013 Paris, France. E-mail [email protected]© 2000 American Heart Association, Inc.
Arterioscler Thromb Vasc Biol.is available at http://www.atvbaha.org
1354
by guest on May 6, 2018
http://atvb.ahajournals.org/D
ownloaded from
that thin fibers are cleaved at a faster rate than thick (coarse)ones. Fibrin network architecture rather than fibrin fiberdiameter regulates the distribution of fibrinolytic componentsduring the course of fibrinolysis and may account for thisapparent paradox.
MethodsMaterialsHuman thrombin was purchased from Enzyme Research Laborato-ries Inc and stored at 1000 IU/mL. Unconjugated colloidal goldsolution for light microscopy was from British Biocell International.Average particle size was 5 nm, and the particle concentration was531013/mL. Recombinant tPA (rtPA) was purchased from Boehring-er-Ingelheim. FITC was purchased from Biocell. Calcium chloridewas from Sigma Chemical Co.
Procedures
Preparation of Cross-Linked Plasma Fibrin ClotsBlood from healthy informed volunteers was anticoagulated withtrisodium citrate (1 vol of 0.13 mol/L citrate for 9 vol of blood).Platelet-poor plasma was obtained by centrifugation of the bloodsamples at 10 000gfor 15 minutes. A volume of 0.10 mL of plasmawas recalcified up to a final concentration of 20 mmol/L. After a1-minute incubation, 10mL of thrombin was added. Thrombin fromthe stock solution was diluted in TNE buffer (0.15 mol/L NaCl and0.01 mol/L Tris-HCl, pH 7.4). Final concentration was adjusted to0.9 IU/mL and 0.09 IU/mL to obtain tight and loose cross-linkedplasma fibrin clots, respectively. Mixing and incubation were con-ducted in polypropylene tubes. A final volume of 0.12 mL of themixture, as described above, was soaked up into a glass microcham-ber designed for flow measurements. Clotting was allowed for atleast 20 minutes in a moist atmosphere at 37°C.
Preparation of FITC-tPAFITC-rtPA was prepared as previously described.8 To a stocksolution of 2 mg/mL rtPA in TNE buffer (140 mmol NaCl andTris-HCl 20 mmol, pH 7.4) was added FITC dissolved in 0.01 mol/LTris, 0.1 mol/L NaCl, and 1 mmol/L EDTA, pH 8, at a finalconcentration of 50mg/mL. After 1 hour of incubation, free FITCwas removed by gel filtration on a G-25 Sephadex column (3.5 mL)equilibrated with TNE buffer. The absorbance ratio of 494 nm to 280nm in preparations of FITC-tPA was 1.6, corresponding to 2 FITCmolecules per molecule of rtPA.
Reflection Laser Scanning MicroscopyMicrochambers holding plasma fibrin clots were connected to areservoir, and the clots were extensively washed with 500mL ofTNE buffer. Then, regular TNE buffer was replaced by 200mL ofTNE buffer containing 5-nm-diameter colloidal gold particles at afinal concentration of 2.531012/mL. The excess of beads that did notbind to fibrin was washed out with 500mL of TNE buffer.
Labeled specimens were scanned with an LSM 510 confocal laserscanning microscope (Carl Zeiss, Inc) linked to a Zeiss invertedmicroscope equipped with a Zeiss363 water immersion objective.A 5-W argon ion laser was used in combination with a 488-nmband-pass filter for the excitation. The microscope was automaticallyset up in reflection mode by replacing the dichroic filter, typicallyused in fluorescence mode, by a 80/20 beam splitter that directed'20% of the reflected light by the sample to the detector.
A computer equipped with standard Carl Zeiss software (version1.5) was used for operating the system and for the processing ofimages that were collected in a format of 5123512 pixels, with 1024gradations of intensity. Optical sectioning was achieved by closingthe pinhole in front of the detector to 120mm and collecting thereflected light of multiple optical planes in the z direction. Detectorgain and pinhole aperture were automatically adjusted. Twentyoptical sections were collected at intervals of 1.0mm in the z-axis.Collecting a single scan took 1.5 seconds. Optical resolution in thex-y–axis was 0.5mm and'0.7mm in the z-axis. These sections werethen projected at 6 different angles 10° apart and combined into 1
image, generating 6 different 3D reconstructed images of the fibrinnetwork.
The design of the present system, especially the reflection mode,allowed images to be collected periodically during ongoing lysiswithin a very short interval because bleaching was avoided.
Lysis ExperimentsTwo different types of experiments were conducted. In the first set ofexperiments, gold-labeled plasma fibrin clots were loaded with 10mL rtPA, which was dissolved in platelet-poor plasma. After 15minutes of incubation in a moist atmosphere, the edge of thethrombus was processed for 20 scans with the confocal microscopeset up in the reflection mode. At the network level, scanning wasperformed at low magnification every 2 minutes, and the lysis-frontvelocity of the 2 different types of fibrin conformation was recordedat different rtPA concentrations (1, 2, 5, and 10 nmol/L). At the fiberlevel, scanning was performed at a higher magnification every 30seconds and with lower rtPA concentration (1 nmol/L). Otherexperiments had shown that colloidal gold particles did not affectlysis when fibrinogen was labeled before clot formation (data notshown).
In a second set of experiments, fresh native plasma fibrin clotsheld in microchambers were carefully loaded with 10mL of asolution containing FITC-rtPA at a final concentration of 5 nmol/L.After 15 minutes of incubation, the edge of the clot was located byusing the transmitted light mode, and then scanning was startedevery 2 to 5 minutes in the regular fluorescence mode. Thebinding-front velocity of FITC-rtPA and the lysis-front velocity ofthe clot were simultaneously recorded in different types of fibrinclots.
Image Analysis
Morphological Properties of Tight and CoarseFibrin ConformationsAverage fibrin fiber diameters (n5150) in loose and tight fibrinconformations were determined on high-magnification images byuse of the image analysis software package that came with themicroscope workstation. These measurements were determined onreconstructed images.
Fiber branches and branching point densities were determined atlower magnification in tight and loose fibrin conformations. Branch-ing points were very carefully distinguished from crossing fibers byusing the series of reconstructed images at different angles and by theanalysis of each scan.
Image Analysis of Lysis ExperimentsMeasurements of the lysis-front velocity, of the rate of fiberdigestion, and of the fiber shape modifications (area in micrometers)2
were performed on the 2 different types of fibrin conformation andat different rtPA concentrations with the use of gold-labeledspecimens.
Measurements of binding-front velocity and lysis-front velocitywere also conducted with the 2 different types of native plasma fibrinclots.
Statistical AnalysisConventional tests were used for calculation of means and standarddeviations. Group differences in continuous variables were deter-mined by 1-way ANOVA. A risk of error of 0.05 was accepted toevaluate the statistical significance. Equality of variances betweengroups was first evaluated by the F test. When the overall F statisticwas significant, the Bonferroni test was used to ascertain thesedifferences in normal and logarithmic scales.
ResultsMorphological Properties of the 2 DifferentFibrin TypesFibrin networks visualized with confocal microscopy con-sisted of straight rodlike elements organized in a 3D network(Figure 1). A branch point usually looked like a forked-shapeelement with a small angle between the 2 fibers emerging
Collet et al Approach to Fibrinolysis by Confocal Microscopy 1355
by guest on May 6, 2018
http://atvb.ahajournals.org/D
ownloaded from

from a third fiber (Figure 1A, arrow). Branches were firstdetected on single scans and then visualized on the recon-structed images. Crossing fibers were recognized when the 2fibers were sliding past each other instead of rotating with thesame angle when looking at the dynamic tilting of thereconstructed images projected at 6 different angles.
Confocal microscopy in the reflection mode allowed theaccurate determination of the morphological properties ofloose and tight fibrin conformations without the fading thataccompanies a fluorescent signal. Figure 1 shows dramaticdifferences of the fibrin network architecture between loose(Figure 1A) and tight (Figure 1D) fibrin networks, althoughthe total fibrin amount remains identical. Measurements offibrin fiber diameter, fiber length, fiber density, and branchpoint density in loose and tight conformations are summa-rized in the Table. Tight fibrin clots are made of thinner fiberswith significantly higher densities of both branches and fibersthan a coarse fibrin network (Table). Repartition of the fibrinfiber–diameter histogram shows that.50% of the fibrinfibers display a diameter.350 nm in the loose conformation,whereas 75% of the fibers display a diameter,350 nm in thetight fibrin conformation.
Fibrinolysis at the Network Level
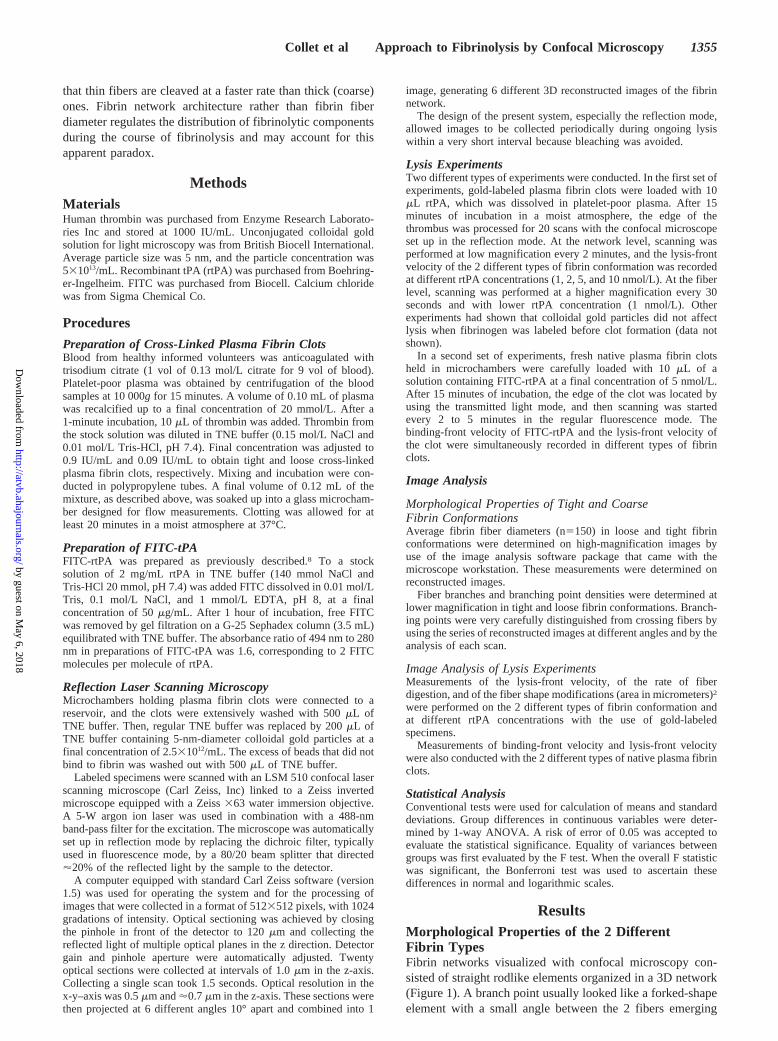
Lysis-Front Velocity According to Fibrin ConformationLysis progresses as a straight and sharp front moving acrossthe entire area of scanning, indicating a homogeneous layer-by-layer elimination of the clot. Following the motion of thelysis front in real time was possible because use of thecolloidal gold labeling avoided fading while the specimenwas scanned (Figure 1). As seen in Figure 2, lysis-frontvelocity increases with rtPA concentration in a linear fashion,with an average rate of 3.5mm z min21 z nmol21 rtPA. Asignificant reduction of the lysis velocity was observed in
Figure 1. Three-dimensional reconstruction images of loose (coarse fibrin, A to C) and tight (fine fibrin, D to F) plasma fibrin networksobtained by scanning confocal laser microscopy (73373 mm2). Native plasma fibrin was labeled with gold particles. Loose and tightfibrin network architectures were obtained by adding 0.09 and 0.9 IU/mL of human thrombin to recalcified platelet-poor plasma. Fibers(arrow) and branch point (arrowhead) are highlighted. Progression in real time of the lysis front in loose (B and C) and tight (E and F)plasma fibrin networks are also shown (1463146 mm2). Lysis was initiated by rtPA (5 nmol/L) loaded at the edge of the clot. Time inter-val between each micrograph is 5 minutes.
Morphological Analysis of Loose and Tight Fibrin Conformationby Confocal Scanning Microscopy in the Reflection Mode
Fibrin Conformation
PCoarse Fine
Average fiber diameter, nm 3766104 299670 ,0.0001
Fiber density, 1023 mm3 4.860.3 9.861.1 0.019
Branching density, 1023 mm3 1.460.15 2.860.46 0.02
Values are mean6SD.
1356 Arterioscler Thromb Vasc Biol. May 2000
by guest on May 6, 2018
http://atvb.ahajournals.org/D
ownloaded from
clots with a tight fibrin conformation, namely, an average rateof 0.58 mm z min21 z nmol21 tPA (P,0.01).
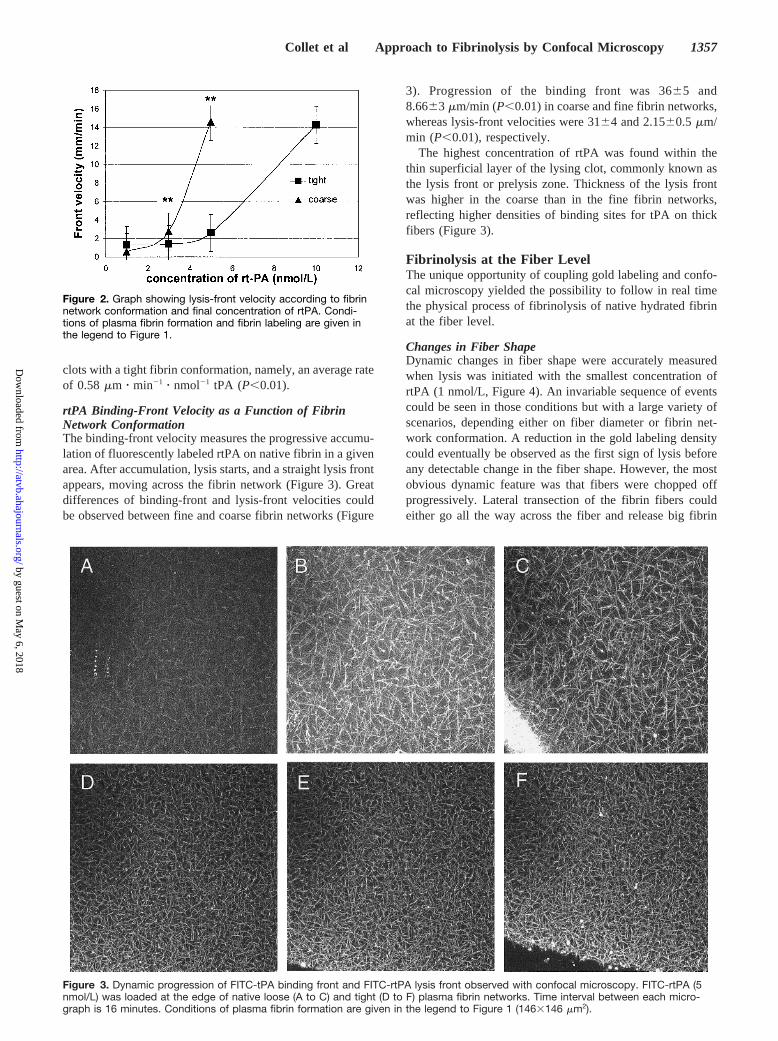
rtPA Binding-Front Velocity as a Function of FibrinNetwork ConformationThe binding-front velocity measures the progressive accumu-lation of fluorescently labeled rtPA on native fibrin in a givenarea. After accumulation, lysis starts, and a straight lysis frontappears, moving across the fibrin network (Figure 3). Greatdifferences of binding-front and lysis-front velocities couldbe observed between fine and coarse fibrin networks (Figure
3). Progression of the binding front was 3665 and8.6663mm/min (P,0.01) in coarse and fine fibrin networks,whereas lysis-front velocities were 3164 and 2.1560.5mm/min (P,0.01), respectively.
The highest concentration of rtPA was found within thethin superficial layer of the lysing clot, commonly known asthe lysis front or prelysis zone. Thickness of the lysis frontwas higher in the coarse than in the fine fibrin networks,reflecting higher densities of binding sites for tPA on thickfibers (Figure 3).
Fibrinolysis at the Fiber LevelThe unique opportunity of coupling gold labeling and confo-cal microscopy yielded the possibility to follow in real timethe physical process of fibrinolysis of native hydrated fibrinat the fiber level.
Changes in Fiber ShapeDynamic changes in fiber shape were accurately measuredwhen lysis was initiated with the smallest concentration ofrtPA (1 nmol/L, Figure 4). An invariable sequence of eventscould be seen in those conditions but with a large variety ofscenarios, depending either on fiber diameter or fibrin net-work conformation. A reduction in the gold labeling densitycould eventually be observed as the first sign of lysis beforeany detectable change in the fiber shape. However, the mostobvious dynamic feature was that fibers were chopped offprogressively. Lateral transection of the fibrin fibers couldeither go all the way across the fiber and release big fibrin
Figure 2. Graph showing lysis-front velocity according to fibrinnetwork conformation and final concentration of rtPA. Condi-tions of plasma fibrin formation and fibrin labeling are given inthe legend to Figure 1.
Figure 3. Dynamic progression of FITC-tPA binding front and FITC-rtPA lysis front observed with confocal microscopy. FITC-rtPA (5nmol/L) was loaded at the edge of native loose (A to C) and tight (D to F) plasma fibrin networks. Time interval between each micro-graph is 16 minutes. Conditions of plasma fibrin formation are given in the legend to Figure 1 (1463146 mm2).
Collet et al Approach to Fibrinolysis by Confocal Microscopy 1357
by guest on May 6, 2018
http://atvb.ahajournals.org/D
ownloaded from
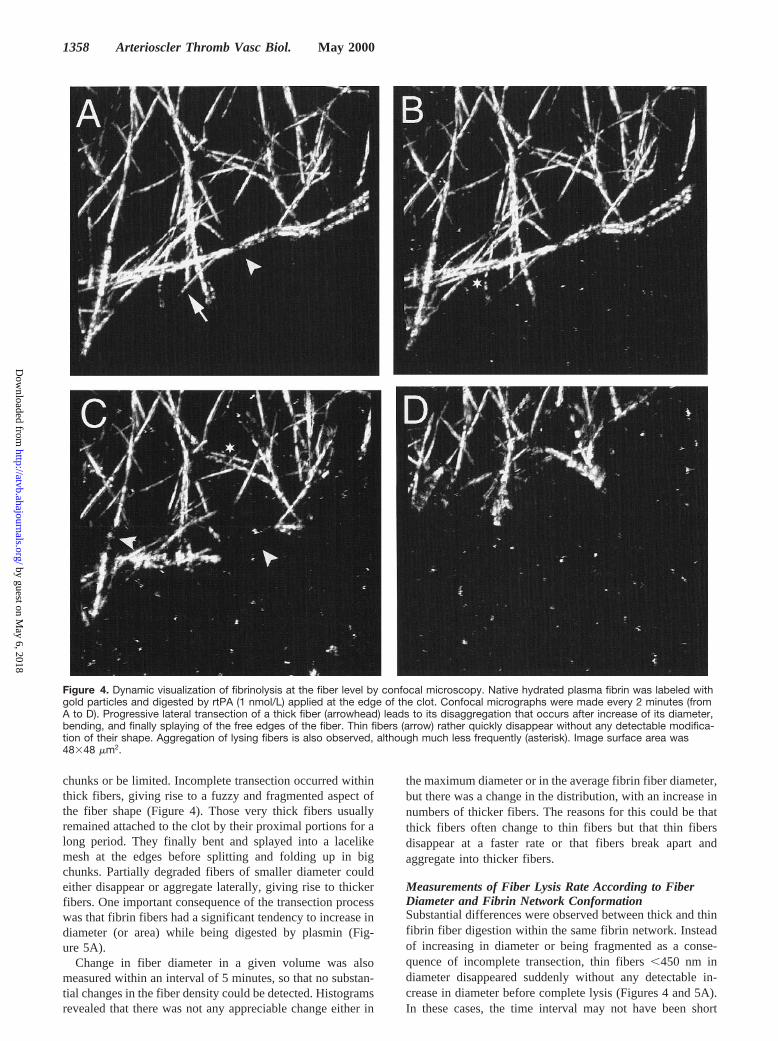
chunks or be limited. Incomplete transection occurred withinthick fibers, giving rise to a fuzzy and fragmented aspect ofthe fiber shape (Figure 4). Those very thick fibers usuallyremained attached to the clot by their proximal portions for along period. They finally bent and splayed into a lacelikemesh at the edges before splitting and folding up in bigchunks. Partially degraded fibers of smaller diameter couldeither disappear or aggregate laterally, giving rise to thickerfibers. One important consequence of the transection processwas that fibrin fibers had a significant tendency to increase indiameter (or area) while being digested by plasmin (Fig-ure 5A).
Change in fiber diameter in a given volume was alsomeasured within an interval of 5 minutes, so that no substan-tial changes in the fiber density could be detected. Histogramsrevealed that there was not any appreciable change either in
the maximum diameter or in the average fibrin fiber diameter,but there was a change in the distribution, with an increase innumbers of thicker fibers. The reasons for this could be thatthick fibers often change to thin fibers but that thin fibersdisappear at a faster rate or that fibers break apart andaggregate into thicker fibers.
Measurements of Fiber Lysis Rate According to FiberDiameter and Fibrin Network ConformationSubstantial differences were observed between thick and thinfibrin fiber digestion within the same fibrin network. Insteadof increasing in diameter or being fragmented as a conse-quence of incomplete transection, thin fibers,450 nm indiameter disappeared suddenly without any detectable in-crease in diameter before complete lysis (Figures 4 and 5A).In these cases, the time interval may not have been short
Figure 4. Dynamic visualization of fibrinolysis at the fiber level by confocal microscopy. Native hydrated plasma fibrin was labeled withgold particles and digested by rtPA (1 nmol/L) applied at the edge of the clot. Confocal micrographs were made every 2 minutes (fromA to D). Progressive lateral transection of a thick fiber (arrowhead) leads to its disaggregation that occurs after increase of its diameter,bending, and finally splaying of the free edges of the fiber. Thin fibers (arrow) rather quickly disappear without any detectable modifica-tion of their shape. Aggregation of lysing fibers is also observed, although much less frequently (asterisk). Image surface area was48348 mm2.
1358 Arterioscler Thromb Vasc Biol. May 2000
by guest on May 6, 2018
http://atvb.ahajournals.org/D
ownloaded from
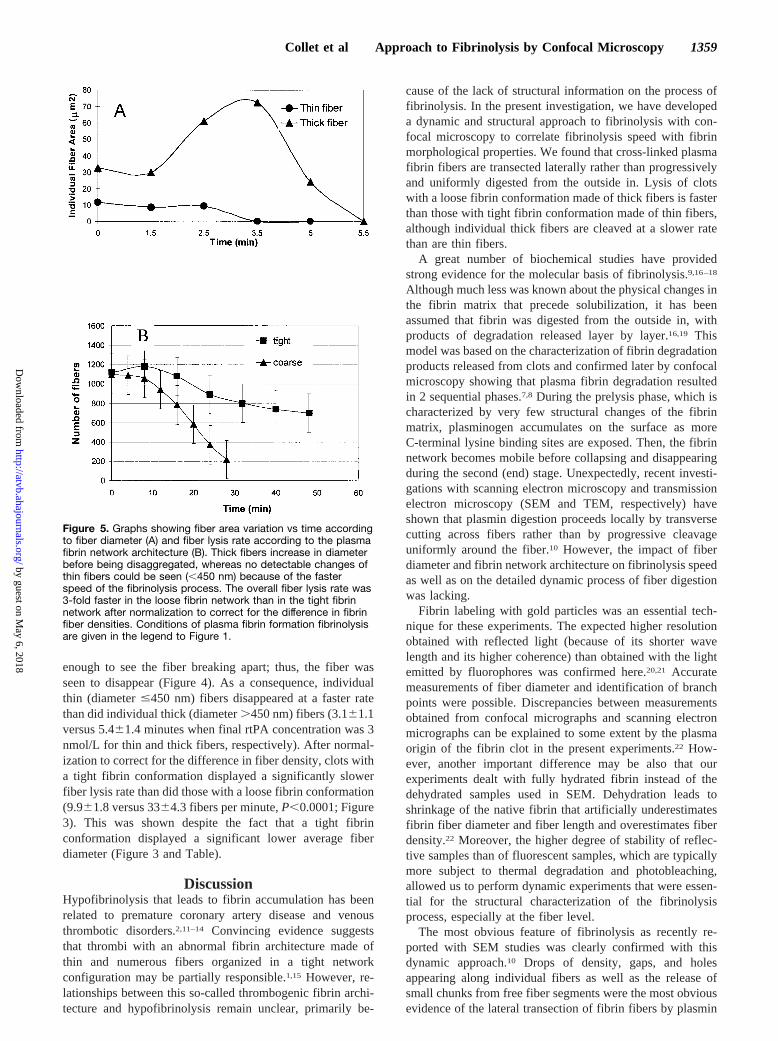
enough to see the fiber breaking apart; thus, the fiber wasseen to disappear (Figure 4). As a consequence, individualthin (diameter#450 nm) fibers disappeared at a faster ratethan did individual thick (diameter.450 nm) fibers (3.161.1versus 5.461.4 minutes when final rtPA concentration was 3nmol/L for thin and thick fibers, respectively). After normal-ization to correct for the difference in fiber density, clots witha tight fibrin conformation displayed a significantly slowerfiber lysis rate than did those with a loose fibrin conformation(9.961.8 versus 3364.3 fibers per minute,P,0.0001; Figure3). This was shown despite the fact that a tight fibrinconformation displayed a significant lower average fiberdiameter (Figure 3 and Table).
DiscussionHypofibrinolysis that leads to fibrin accumulation has beenrelated to premature coronary artery disease and venousthrombotic disorders.2,11–14 Convincing evidence suggeststhat thrombi with an abnormal fibrin architecture made ofthin and numerous fibers organized in a tight networkconfiguration may be partially responsible.1,15 However, re-lationships between this so-called thrombogenic fibrin archi-tecture and hypofibrinolysis remain unclear, primarily be-
cause of the lack of structural information on the process offibrinolysis. In the present investigation, we have developeda dynamic and structural approach to fibrinolysis with con-focal microscopy to correlate fibrinolysis speed with fibrinmorphological properties. We found that cross-linked plasmafibrin fibers are transected laterally rather than progressivelyand uniformly digested from the outside in. Lysis of clotswith a loose fibrin conformation made of thick fibers is fasterthan those with tight fibrin conformation made of thin fibers,although individual thick fibers are cleaved at a slower ratethan are thin fibers.
A great number of biochemical studies have providedstrong evidence for the molecular basis of fibrinolysis.9,16–18
Although much less was known about the physical changes inthe fibrin matrix that precede solubilization, it has beenassumed that fibrin was digested from the outside in, withproducts of degradation released layer by layer.16,19 Thismodel was based on the characterization of fibrin degradationproducts released from clots and confirmed later by confocalmicroscopy showing that plasma fibrin degradation resultedin 2 sequential phases.7,8 During the prelysis phase, which ischaracterized by very few structural changes of the fibrinmatrix, plasminogen accumulates on the surface as moreC-terminal lysine binding sites are exposed. Then, the fibrinnetwork becomes mobile before collapsing and disappearingduring the second (end) stage. Unexpectedly, recent investi-gations with scanning electron microscopy and transmissionelectron microscopy (SEM and TEM, respectively) haveshown that plasmin digestion proceeds locally by transversecutting across fibers rather than by progressive cleavageuniformly around the fiber.10 However, the impact of fiberdiameter and fibrin network architecture on fibrinolysis speedas well as on the detailed dynamic process of fiber digestionwas lacking.
Fibrin labeling with gold particles was an essential tech-nique for these experiments. The expected higher resolutionobtained with reflected light (because of its shorter wavelength and its higher coherence) than obtained with the lightemitted by fluorophores was confirmed here.20,21 Accuratemeasurements of fiber diameter and identification of branchpoints were possible. Discrepancies between measurementsobtained from confocal micrographs and scanning electronmicrographs can be explained to some extent by the plasmaorigin of the fibrin clot in the present experiments.22 How-ever, another important difference may be also that ourexperiments dealt with fully hydrated fibrin instead of thedehydrated samples used in SEM. Dehydration leads toshrinkage of the native fibrin that artificially underestimatesfibrin fiber diameter and fiber length and overestimates fiberdensity.22 Moreover, the higher degree of stability of reflec-tive samples than of fluorescent samples, which are typicallymore subject to thermal degradation and photobleaching,allowed us to perform dynamic experiments that were essen-tial for the structural characterization of the fibrinolysisprocess, especially at the fiber level.
The most obvious feature of fibrinolysis as recently re-ported with SEM studies was clearly confirmed with thisdynamic approach.10 Drops of density, gaps, and holesappearing along individual fibers as well as the release ofsmall chunks from free fiber segments were the most obviousevidence of the lateral transection of fibrin fibers by plasmin
Figure 5. Graphs showing fiber area variation vs time accordingto fiber diameter (A) and fiber lysis rate according to the plasmafibrin network architecture (B). Thick fibers increase in diameterbefore being disaggregated, whereas no detectable changes ofthin fibers could be seen (,450 nm) because of the fasterspeed of the fibrinolysis process. The overall fiber lysis rate was3-fold faster in the loose fibrin network than in the tight fibrinnetwork after normalization to correct for the difference in fibrinfiber densities. Conditions of plasma fibrin formation fibrinolysisare given in the legend to Figure 1.
Collet et al Approach to Fibrinolysis by Confocal Microscopy 1359
by guest on May 6, 2018
http://atvb.ahajournals.org/D
ownloaded from

(Figure 4). Progressive fragmentation of the fiber as a resultof lateral transection led first to an increase of the fiberdiameter, with progressive bending of the fiber, sometimessplaying of the edges, and finally disaggregation into smallchunks. Thick fibers undergoing digestion did not turn intothin fibers, as previously thought.16,19 This increase in fiberdiameter seems to be related to a progressive transection ofthick fibers occurring simultaneously in different places overthe length of the fibers rather than to aggregation of lysedfiber segments, as previously suspected.10 Fiber aggregationwas unusual and was mostly observed within clots with atight network configuration digested with high concentrationsof rtPA. This dynamic cascade of events that we were able tovisualize with the confocal microscope at the level of indi-vidual fibers corroborate the findings of Veklich and al,10
who demonstrated by SEM and TEM that plasmic degrada-tion of fibrin reverses the process of fibrin assembly, leadingto a disaggregation of the ordered fiber structure. In the caseof clots made of thin fibers, the entire cascade could not beseen because of the high speed of the process responsible fora sudden disappearance of the fibers (Figure 4).
A unique opportunity provided by this dynamic and struc-tural approach was the possibility of measuring the fiber lysisrate with respect to fiber diameter and fibrin network config-uration. Thin fibers were cleaved at a significant faster ratethan were thick fibers. However, the lysis-front velocity ofplasma cross-linked fibrin clots made of thin fibers organizedin a tight network was always found to be slower than plasmacross-linked fibrin clots made of thicker fibers organized in aloose configuration, whatever the amount of rtPA (Figure 2).This apparent paradox arises for 2 reasons. First, it seemslikely that fibrin configuration rather than fibrin fiber diam-eter is a determinant of fibrinolysis speed. Hence, althoughthin fibers are digested more rapidly than are thicker fibers,plasma clots with a tight network configuration display asignificant higher fibrin fiber density than clots with a loosenetwork configuration but with the same amount of totalprotein. Second, although of unknown molecular mechanism,fibrin fiber retraction phenomena that occur in the prelysiszone of plasma clots (a region of few micrometers away fromthe lysis front) are another potential explanation for thisparadox.8 Impaired retraction in plasma clots with a tightnetwork conformation could explain the significant differ-ence of the lysis-front thickness between coarse and fine clots(Figure 3) and may contribute to hindered lysis.23
Measurements of FITC-rtPA binding-front velocity ofnative hydrated cross-linked plasma fibrin clots providestrong evidence for the crucial role of the fibrin networkarchitecture rather than fibrin fiber diameter as a limitingfactor of fibrinolysis speed. It is obvious that the higheraccessibility of fibrin to FITC-rtPA is related to the fasterprogression of the lysis front in the loose plasma fibrinnetworks, which have a higher average fibrin fiber diameterthan that of the tight plasma fibrin network architecture(Figure 3). It is also likely that thicker fibers may have agreater potential than thin fibers for local enhancement andacceleration of the fibrinolytic process as lysis proceeds,24
whereas the time needed for plasmin to reach new fibers inthe case of tight plasma fibrin network architecture may alsodelay fibrinolysis, even if thin fibers are cleaved at a fasterrate than thick fibers. These findings are in accordance with
the observed resistance to fibrinolysis of cross-linked plasmafibrin with a tight network architecture.2,4,5 However, oppo-site results have been reported with purified and non–cross-linked fibrin, depending on the conditions of fibrin forma-tion.3,6 Unlike clots made of purified fibrinogen with a tightnetwork obtained under high salt conditions, those obtainedby adding contrast media before clotting were found to bemore resistant to fibrinolysis than coarse purified fibrinobtained without contrast media. The absence of cross-linking and the different conditions of fibrin formation mayaccount for these differences between purified and plasmafibrin.
The present study was conducted in a very specific set ofconditions. The lytic agent rtPA was neither incorporated norpermeated, and there were no other blood elements within thecross-linked plasma clots. This may explain why structuralmodifications of fibrin were restricted to the lysis-front area.However, changes could eventually occur all over the net-work in the case of extremely coarse fibrin network digestedwith a high concentration of rtPA. In these particular condi-tions, convective transport might have occurred, and the hugearea of tPA binding would have led to modifications of thefibers all over the fibrin network so that lysis could start indifferent places simultaneously without any individualizedlysis front.23 This is more likely to be the case in vivobecause, ordinarily, plasminogen and tPA bind simulta-neously to the forming fibrin and because pressure-drivenpermeation markedly enhances lysis.25 These conditions andthe effect of platelets require further investigation.
In conclusion, these structural and dynamic features offibrinolysis confirm what was suspected from recent SEMexperiments and are in accordance with the most recentmolecular modeling of fibrinolysis.23,26 The crawling ofplasmin across fibrin leads to a progressive lateral transectionof the fibrin and to the disaggregation of the fibers instead ofa progressive and uniform digestion from the outside in, withproducts of degradation released layer by layer. rtPA bindingregulates the lysis speed and is dependent on the fibrinconformation rather than on the fibrin fiber diameter. Finally,these results demonstrate that the so-called thrombogenicfibrin consisting of thin fibers organized in a tight 3Dnetwork is thrombogenic because of its resistance to lysis thatarises directly from its network architecture.
AcknowledgmentsThis study was supported in part by National Institutes of Healthgrant HL-30954 and by a grant from Parke-Davis Co. We wish toacknowledge Dr Y. Veklich for his technical assistance andhis advice.
References1. Fatah K, Silveira A, Tornvall P, Karpe F, Blomback M, Hamsten A.
Proneness to formation of tight and rigid fibrin gel structures in men withacute myocardial infarction at a young age.Thromb Haemost. 1996;76:535–542.
2. Collet JP, Soria J, Mirshahi M, Hirsh M, Dagonnet FB, Caen J, Soria C.Dusart syndrome: a new concept of the relationship between fibrin clotarchitecture and fibrin clot degradability: hypofibrinolysis related to anabnormal clot structure.Blood. 1993;82:2462–2469.
3. Gabriel DA, Muga K, Boothroyd EM. The effect of fibrin structure onfibrinolysis. J Biol Chem. 1992;267:24259–24265.
4. Carr ME, Alving BM. Effect of fibrin structure on plasmin-mediateddissolution of plasma clots.Blood Coagul Fibrinolysis. 1995;6:567–573.
1360 Arterioscler Thromb Vasc Biol. May 2000
by guest on May 6, 2018
http://atvb.ahajournals.org/D
ownloaded from

5. Williams S, Fatah K, Ivert T, Blomback M. The effect of acetylsalicylicacid on fibrin gel lysis by tissue plasminogen activator.Blood CoagulFibrinolysis.1995;6:718–724.
6. Kolev K, Tenekedjiev K, Korowicz E, Machovich R. Functional eval-uation of the structural features of proteases and their substrate in fibrinsurface degradation.J Biol Chem. 1997;272:13666–13675.
7. Sakahrov DV, Rijken DC. Superficial accumulation of plasminogenduring plasma clot lysis.Circulation. 1995;92:1883–1889.
8. Sakharov DV, Nagelkerke JF, Rijken DC. Rearrangements if the fibrinnetwork and spatial distribution of fibrinolytic components during plasmaclot lysis.J Biol Chem. 1995;271:2133–2138.
9. Francis CW, Marder VJ, Barlow GH. Plasmic degradation of cross-linkedfibrin: characterization of new macromolecular soluble complexes and amodel of their structure.J Clin Invest. 1980;66:1033–1041.
10. Veklich Y, Francis CW, White J, Weisel JWW. Structural studies offibrinolysis by electron microscopy.Blood. 1998;92:4721–4729.
11. Salomaa V, Stinson V, Kark JD, Folsom AR, Davis CE, Wu KK.Association of fibrinolytic parameters with early atherosclerosis.Circu-lation. 1995;91:284–290.
12. Carter AM, Ossei-Gerning N, Wilson IJ, Grant PJ. Association of theplatelet PlA polymorphism of glycoprotein IIb/IIIa and the fibrinogen Bb448 polymorphism with myocardial infarction and extent of coronaryartery disease.Circulation. 1997;96:1424–1431.
13. Thompson SG, Kienast J, Pyke SD, Haverkate F, van de Loo JCV.Hemostatic factors and the risk of myocardial infarction or sudden deathin patients with angina pectoris.N Engl J Med. 1995;332:635–641.
14. Wada Y, Lord ST. A correlation between thrombotic disease and aspecific fibrinogen abnormality (A alpha 554 Arg-Cys) in two unrelatedkindred: Dusart and Chapel Hill III.Blood.1994;84:3709–3713.
15. Collet JP, Woodhead JL, Soria J, Soria C, Mirshahi M, Caen JP, WeiselJW. Fibrinogen Dusart: electron microscopy of molecules, fibers andclots and viscoelastic properties of clots.Biophys J. 1996;70:500–510.
16. Francis CW, Marder VJ. A molecular model of plasmic degradation ofcross-linked fibrin.Semin Thromb Haemost. 1982;8:25–31.
17. Marder VJ, Shulman NR, Carroll WR. High molecular weight derivativesof human fibrinogen produced by plasmin, I: physicochemical and immu-nological characterization.J Biol Chem. 1969;244:2111–2119.
18. Marder VJ, Budzynski AZ. Data for defining fibrinogen in its plasmicdegradation products.Thromb Diath Haemorrh. 1975;33:199–207.
19. Diamond SL, Anand S. Inner clot diffusion and permeation during fibri-nolysis.Biophys J. 1993;65:2622–2643.
20. Cornelisse-ten Velde I, Bonnet J, Tanke HJ. Reflection contrastmicroscopy performed on epi-illumination microscope stands: com-parison of reflection contrast- and epipolarization microscopy.J Microsc.1990;159:1–14.
21. Uriel J, Lorenzo HK, Macho A, de Feijter AW, Mishal Z. Visualizationof silver-enhanced reaction products from protein and immuno-colloidalgold probes by laser scanning confocal microscopy in reflection mode.Histochemistry. 1995;103:355–361.
22. Baradet TC, Haselgrove JC, Weisel JW. Three-dimensional recon-struction of fibrin clot networks from stereoscopic intermediate voltageelectron microscope images and analysis of branching.Biophys J. 1995;68:1551–1560.
23. Diamond SL. Engineering design of optimal strategies for blood clotdissolution.Annu Rev Biomed Eng. 1999;01:427–461.
24. Suenson E, Lutzen O, Thorsen S. Initial plasmin-degradation of fibrin asthe basis of a positive feedback mechanism in fibrinolysis.EurJ Biochem. 1984;149:193–200.
25. Blinc A, Kennedy SD, Bryant RG, Marder VJ, Francis CW. Flow throughclots determines the rate and pattern of fibrinolysis.Thromb Haemost.1994;71:330–337.
26. Weisel JW, Veklich Y, Collet JP, Francis CW. Structural studies offibrinolysis by electron and light microscopy.Thromb Haemost. 1999;82:277–282.
Collet et al Approach to Fibrinolysis by Confocal Microscopy 1361
by guest on May 6, 2018
http://atvb.ahajournals.org/D
ownloaded from

J. P. Collet, D. Park, C. Lesty, J. Soria, C. Soria, G. Montalescot and J. W. WeiselSpeed: Dynamic and Structural Approaches by Confocal Microscopy
Influence of Fibrin Network Conformation and Fibrin Fiber Diameter on Fibrinolysis
Print ISSN: 1079-5642. Online ISSN: 1524-4636 Copyright © 2000 American Heart Association, Inc. All rights reserved.
Greenville Avenue, Dallas, TX 75231is published by the American Heart Association, 7272Arteriosclerosis, Thrombosis, and Vascular Biology
doi: 10.1161/01.ATV.20.5.13542000;20:1354-1361Arterioscler Thromb Vasc Biol.
http://atvb.ahajournals.org/content/20/5/1354World Wide Web at:
The online version of this article, along with updated information and services, is located on the
http://atvb.ahajournals.org//subscriptions/
at: is onlineArteriosclerosis, Thrombosis, and Vascular Biology Information about subscribing to Subscriptions:
http://www.lww.com/reprints
Information about reprints can be found online at: Reprints:
document. Question and AnswerPermissions and Rightspage under Services. Further information about this process is available in the
which permission is being requested is located, click Request Permissions in the middle column of the WebCopyright Clearance Center, not the Editorial Office. Once the online version of the published article for
can be obtained via RightsLink, a service of theArteriosclerosis, Thrombosis, and Vascular Biologyin Requests for permissions to reproduce figures, tables, or portions of articles originally publishedPermissions:
by guest on May 6, 2018
http://atvb.ahajournals.org/D
ownloaded from