INFLUENCE OF EXTRINSIC FACTORS ON EMPLOYEES’
82
INFLUENCE OF EXTRINSIC FACTORS ON EMPLOYEES’ MOTIVATION: A CASE OF CABIN CREW AT KENYA AIRWAYS LIMITED BY DENNIS MWANGANGI MWILITYA A Research Project Report submitted in partial fulfillment of the requirements for the award of the Degree of Master of Arts in Project Planning and Management of the University of Nairobi 2015
Transcript of INFLUENCE OF EXTRINSIC FACTORS ON EMPLOYEES’

INFLUENCE OF EXTRINSIC FACTORS ON EMPLOYEES’
MOTIVATION: A CASE OF CABIN CREW AT KENYA
AIRWAYS LIMITED
BY
DENNIS MWANGANGI MWILITYA
A Research Project Report submitted in partial fulfillment of the requirements for the
award of the Degree of Master of Arts in Project Planning and Management of the
University of Nairobi
2015

ii
DECLARATION
This research project report is my original work and has not been presented for any degree in any
other University.
Signature…………………………. Date …………………………….
Name: Dennis Mwangangi Mwilitya
Reg No: L50/68903/2013
This research project report is submitted for examination with my approval as the university
supervisor.
SUPERVISOR:
Signature……………………. Date ………...…..............
Prof. Christopher Gakuu
Department: Extra Mural Studies
University of Nairobi

iii
DEDICATION
This study is dedicated to my parents, my father Mr. Simon Mwilitya and my mother Mrs.
Naomi Musyawa. To my siblings Esther, Lisa, Kevin and Joan. A very special dedication to
Kaydence Mwilitya and to all my friends who have helped me throughout this entire period.

iv
ACKNOWLEDGEMENTS
I acknowledge that it has been through the generous dedication and able guidance of my
committed supervisor Prof. Christopher Gakuu that this research project report has been
accomplished. By equal measure, I recognize the contribution of all my lecturers at the
Department of Extra Mural Studies who facilitated the Project Planning and Management Master
program. Special thanks to the entire staff at the Extra Mural Department of the University of
Nairobi for their support in this endeavor. I thank the University of Nairobi for providing an
enabling environment for me to gain academic skills and expand my professional networks.
Many thanks to my colleagues and classmates whom we have toiled together and supported each
other throughout this undertaking. I thank the Kenya airways limited cabin crew who
participated as the respondents in this study.

v
TABLE OF CONTENT
DECLARATION.......................................................................................................................... II
DEDICATION............................................................................................................................. III
TABLE OF CONTENT ............................................................................................................... V
LIST OF FIGURES ................................................................................................................. VIII
LIST OF TABLES ...................................................................................................................... IX
ABBREVIATIONS AND ACRONYMS ................................................................................... XI
ABSTRACT ............................................................................................................................... XII
CHAPTER ONE: INTRODUCTION ......................................................................................... 1
1.1 Background of the study .......................................................................................................................................... 1
1.2 Statement of the Problem ......................................................................................................................................... 2
1.3 Purpose of the study ................................................................................................................................................ 3
1.4 Objectives of the study ............................................................................................................................................ 3
1.5 Research Questions .................................................................................................................................................. 3
1.6 Significance of the study ......................................................................................................................................... 4
1.7 Delimitations of the study ........................................................................................................................................ 4
1.8 Limitation of the study............................................................................................................................................. 5
1.9 Assumption of the study .......................................................................................................................................... 5
1.10 Definition of significant terms ............................................................................................................................... 5
1.11 Organization of study ............................................................................................................................................ 6
CHAPTER TWO: LITERATURE REVIEW ............................................................................ 8

vi
2.1 Introduction ...................................................................................................................................................... 8
2.2 Economic factors and employees’ motivation ......................................................................................................... 8
2.3 Social factors and employees’ motivation ............................................................................................................. 10
2.4 Environmental factors and employees’ motivation ............................................................................................... 12
2.5 Theoretical frameworks on motivational of employees ......................................................................................... 18
2.6 Conceptual Framework .......................................................................................................................................... 19
2.7 Knowledge Gap ..................................................................................................................................................... 21
2.8 Summary of Literature Review.............................................................................................................................. 21
CHAPTER THREE: RESEARCH METHODOLOGY ......................................................... 22
3.1 Introduction ........................................................................................................................................................... 22
3.2 Research Design .................................................................................................................................................... 22
3.3 Target Population .................................................................................................................................................. 22
3.4 Sample size and sampling procedure ..................................................................................................................... 22
3.5 Research instrument .............................................................................................................................................. 24
3.5.1 Pilot testing of the instrument ............................................................................................................................. 25
3.6. Data collection procedure ..................................................................................................................................... 26
3.7. Data analysis techniques ....................................................................................................................................... 26
3.8. Ethical considerations ........................................................................................................................................... 27
3.9 Operational definition of the variables of the study ............................................................................................... 27
CHAPTER FOUR: DATA ANALYSIS, PRESENTATION, INTERPRETATION AND
DISCUSSION .............................................................................................................................. 30
4.1 Introduction ........................................................................................................................................................... 30
4.2 Questionnaire Response Rate ................................................................................................................................ 30
4.3 Profiles of the Respondents ................................................................................................................................... 30
4.4 Economic factors of motivation ............................................................................................................................. 33

vii
4.5 Social factors of motivation ................................................................................................................................... 37
4.6 Environmental factors of motivation ..................................................................................................................... 41
4.7 Employees’ motivation .......................................................................................................................................... 45
4.8 Inferential statistics ................................................................................................................................................ 49
4.9 Discussion of the findings ..................................................................................................................................... 50
CHAPTER FIVE: SUMMARY OF FINDINGS, CONCLUSIONS AND
RECOMMENDATIONS ............................................................................................................ 53
5.1 Introduction ........................................................................................................................................................... 53
5.2 Summary of Findings ............................................................................................................................................ 53
5.3 Conclusions ........................................................................................................................................................... 55
5.4 Recommendation ................................................................................................................................................... 57
5.6 Suggestions for Further Research .......................................................................................................................... 57
APPENDICES ............................................................................................................................. 64
Appendix I: Letter of Transmittal ................................................................................................................................ 64
Appendix II: Questionnaire ......................................................................................................................................... 65
Appendix III: Summary Data on Motivational factors ................................................................................................ 69

viii
LIST OF FIGURES
Figure 1: Conceptual Framework for the employee motivation.................................................20

ix
LIST OF TABLES
Table 3.1: Operational definition of the variables of the study.....................................................28
Table 4.1: Distribution of Respondents by Gender.......................................................................31
Table 4.2: Distribution of Respondents by Age Group.................................................................31
Table 4.3: Distribution of Respondents by Marital Status............................................................32
Table 4.4: Distribution of Respondents by Level of Education....................................................32
Table 4.5: Benefits given to best employees.................................................................................33
Table 4.6: Fabulous vacation policy..............................................................................................34
Table 4.7: Satisfactory pay policies...............................................................................................35
Table 4.8: Employee receive fair allowances................................................................................35
Table 4.9: Salary equitable to work output....................................................................................36
Table 4.10: Motivation of employee..............................................................................................37
Table 4.11: Employees allowed to join unions..............................................................................38
Table 4.12: KQ provide good support services such as counseling..............................................38
Table 4.13: Promotion is on competitive basis..............................................................................39
Table 4.14: Company appreciates employee’s services................................................................40
Table 4.15: Employee in good terms with colleagues at KQ........................................................40
Table 4.16: There is team work spirit at KQ.................................................................................41
Table 4.17: Work life is of high quality.........................................................................................42
Table 4.18: There is commitment and engagement by management.............................................42
Table 4.19: Facilities are adequate for all staff..............................................................................43
Table 4.20: Organizational structure is clear and specified...........................................................44
Table 4.21: Supervisor offer support needed to employees...........................................................44
Table 4.22: Level of productivity..................................................................................................45
Table 4.23: Level of performance..................................................................................................46
Table 4.24: Level of punctuality....................................................................................................46
Table 4.25: Level of discipline......................................................................................................47
Table 4.26: Level of teamwork......................................................................................................48

x
Table 4.27: Level of absenteeism .................................................................................................48
Table 4.28: Chi-sqaure analysis Summary ................................................................................... 50

xi
ABBREVIATIONS AND ACRONYMS
CBD: Central business district
ERG: Existence, relatedness and growth
GNS: Growth needs strength
IBM: International business machines
SACCOS: Savings and credit co-operative society

xii
ABSTRACT
Several theories have shown that there is a strong positive correlation between intrinsic and
extrinsic factors in the motivation of the employees at the work place. Motivated employees are
known to be productive and hence promote the performance of the company. This objective of
this study was to determine the influence of extrinsic factors; economic, environmental and
social factors on the motivation of employees following the case of Kenya Airways. This was a
cross sectional case study for Kenya Airways. The study adopted descriptive survey design. Both
qualitative and quantitative approaches were used. Employees of Kenya Airways were the
respondents in this study. The respondents were assessed using questionnaire having both open
and closed ended questions. Using a target population of 4002, a total of 233 employees were
sampled for this study. Data collected was cleaned, presented in tables and figures and presented
descriptively to represent responses collected in the study. Data analysis was performed using
SPSS v21. It was assumed that the respondents used would enable the generalization of the
findings to the study populations. Research findings revealed low implementation of the social,
economic and environmental factors at Kenya Airways. Inferential statistics revealed a
significant association between environmental, social and economic factors to the motivation of
employees at the Kenya Airways. It was concluded that the implementation of extrinsic
motivation factors in the company would be significant in increasing productivity, teamwork,
increase discipline, punctuality and as well as reduce absenteeism in the company. This study is
therefore hoped to inform on the policy formulation on employee motivation at Kenya Airways
and other companies in Kenya. Moreover, this study is also is also a contribution to the
knowledge, theory and practice on the relationship between social, economic and environmental
factors and motivation of the employees in Kenya.

1
CHAPTER ONE
INTRODUCTION
1.1 Background of the study
Motivation is defined as the physiological deficiency that activates the urge to achieve specific
set goals (Luthan, 1998). Motivation is based on the relationships, needs, rewards and other
incentives. Motivation is composed of three key interdependent elements; they consist of the
needs, drives and incentives (Minner, Ebrahimi and Watchel, 1995). Motivation is also described
as the psychological pressure that enhances an employee’s level of commitment (Evans, 1986).
He also asserts that pressure promote, channels and sustains human behavior in the direction of
commitment and goal to be achieved.
Motivation and satisfaction of employees have been reported to be benefiting to a company. It
has been associated with a good feeling which drives motivation and performance in a company
(Ademoyo, 1999). Secondly, motivation exerts pressure on the personal performance. In
addition, motivation is believed to be a rare factor that is short in supply. Therefore, there is
always a need to replenish it periodically. It is important for the manager to understand what
makes their employees motivated so that they can be able to invent the job descriptions and
reward them according to their expectations. This is believed to have a significant impact on the
motivation and was also increase the employee’s performance (Ademoyo, 1999). The best
motivational factors need to be goal directed and within the objectives of an organization
(Olajide, 2000).
Understanding the perceptions and expectations of the stakeholders on the services offered by
the company is important for the top management of the company. It was govern the
development of diverse strategies and policies required to promote motivation of employees and
to accommodate the multicultural and multinational perspectives of their brands. It is also

2
significant in the implementation of the Total Quality control strategy through the targeting of
employees (Manville & Ober, 2003).
The major problem facing Kenya Airways is low morale and motivational levels of employees
cabin crew staff which extends to the satisfaction of the customers of Kenya Airways Limited.
Low motivation level amongst staff is reflected by various factors for example increasing rate of
absenteeism, decrease turnover ratio, decreasing team work amongst crew and increasing
number of complaints from passengers as suggested by West and Anderson (1996).
Economic factors such as the pay of the employees have been deemed low and unfair with
respect to work condition and environment. The company has also opted to use low cadre staff
with low technical training and lower pay leading to low motivation of the employees at Kenya
airways cabin crew.
Working environment and social factors have also been suggested not to be conducive; Kenya
Airways Limited prefers to employ foreign workers to local workers in Kenya leading to poor
work relations and communication among the cabin crew staff. This had led to high turnover of
cabin crew employees at Kenya airways, many complains of stolen properties by the customers,
delays in Kenya airways flight schedules and poor workmanship leading to poor service. As a
result, Kenya airways had lost a very high number of customers and the profit margins has also
gone down leading to poor performance of Kenya airways airline compared to other Airline
companies in Kenya.
This study is interested in establishing the effect of low motivation among the cabin crew
employees in Kenya Airways. It was also the interest of this study to understand the
environmental, social and economic factors that motivate the employees at Kenya Airways. It
was expected that by improving the motivation of the employees, the performance of the
company in East and Central Africa was be greatly improved.
1.2 Statement of the Problem
Kenya Airways have had a declining performance with significant losses made in the financial
year ending 2014 (Kenya Airways, 2015). Probably, the low motivation of the employees may

3
be a factor in low performance of the employees leading to loss of potential customers and hence
low sales. Kenya airway has faced significant competition from other airlines in East and Central
Africa including other international airways such as the Emirates Airlines. Previous studies have
reported a possibility of increasing company’s profits after reduction of the customer migrations.
Employee motivation had been established to be important in increasing the performance of the
companies, leading to higher profits, increased number of customers and customer satisfaction. It
has been suggested that the social, economic and environmental factors have a role to play in the
motivation of the employees. This study was to evaluate the influence of employee motivation in
the improvement of the performance of Kenya Airways airline.
1.3 Purpose of the study
The study investigated the influence of extrinsic factors on the motivation of employees using a
case of Kenya Airways, Kenya.
1.4 Objectives of the study
The study was guided by the following objectives:
1. To determine the influence of economic factors on level of employee motivation at
Kenya Airways Limited.
2. To evaluate the influence of social factors on level of employee motivation at Kenya
Airways Limited.
3. To assess the influence of environmental factors on level of employee motivation at
Kenya Airways Limited.
1.5 Research Questions
These studies sought to address the following questions:
1. To what extent do the economic factors influence level of motivation of employees at
Kenya Airways Limited?
2. In what ways do the social factors influence the level of motivation of the employees at
Kenya Airways Limited?
3. In what ways do environmental factors influence the level motivation of employees at
Kenya Airways Limited?

4
1.6 Significance of the study
The economic, social and environmental factors have a significant impact in the motivation of
employees in a company. This study of economic, social and environmental factors may provide
significant contribution to the knowledge on employee motivation for the case of Kenya
Airways. It was also anticipated that this may improve the understanding and application of the
knowledge at Kenya Airways limited towards becoming the “Pride of Africa”. It was also hoped
that this study would improve the knowledge of the relationship between motivation of
employees and performance of organizations which is indicated by customer satisfaction,
increase in number of customers, retaining of employees, reduce turn over and increase profits in
the company.
This study hoped to provide rich data which could be used by Kenya Airways in mainstreaming
the performance of the company through use of relevant and applicable motivation factors which
can lead to enhancement of the right behavior. It was also projected that understanding the
motivation of the employees may enable Kenya Airways to achieve it strategic goal of customer
satisfaction and becoming a number one Airline in Kenya and Africa in service provision.
1.7 Delimitations of the study
This study focused on the external factors that influence the motivation of the employees in an
organization. The extrinsic factors to be assessed include the social, economic and environmental
factors of motivation.
The rationale in the use of the extrinsic factors was that most of the companies attribute much
relevance in the use of the external factors in motivating the employees of an organization more
than the intrinsic factors. In addition, it had also been shown that there is a likelihood of increase
in performance of the employee with offering of reward and other benefits.
The institutional scope and delimitation was on the influence of extrinsic factors on motivation
and employee satisfaction on the performance of employees and customer satisfaction. This
study focused on Kenya Airways employees as a case study in Kenya.
The geographical/spatial scope and delimitation of the study was on the employees serving the
customers at the Jomo Kenyatta International Airport and employees in the ticketing centers

5
within the CBD of Nairobi County located at Barclays Plaza. The employees at these two centers
made the population for the study.
The scope of time to be used in this study was the last one year of their term of employment. The
main rationale behind the study was to appraise the employees in an order to provide useful
detail that was to provide significant responses to the research questions and objectives of the
study. This also captured the different factors that promote their motivation and satisfaction and
other challenges they encounter as employees at Kenya Airways that affect their motivation.
1.8 Limitation of the study
The employees at Kenya Airways were always busy and this study therefore required more time
to be able to collect data from the employees who were to be the respondents for the study. The
employees at Kenya Airways were also bound by privacy and confidentiality to information
pertaining to the company information and therefore limit the accessibility of information for this
study. However, this study had introduced the privacy and confidentiality statement together
with the questionnaire so as to guarantee the respondents that the study was to be used for
academic purposes. It was hoped that this would not be a challenge while requesting for
information regarding their perceptions about Kenya Airways limited.
1.9 Assumption of the study
This study assumed that it would be able to access all the cabin crew staff at Kenya Airways
within the one week duration over which data collection was to be carried out. In addition, it was
assumed that the responses offered by the respondents would be a true reflection of the status of
employee motivation at Kenya Airways. This study also assumed that the internal factors were
not a major contributing factor to the motivation of the employees at Kenya Airways.
1.10 Definition of significant terms
Cabin Crew: Employees working at an airline whose responsibility is to guide and serve the
customers of the airline.
Economic factors: Set of fundamental information that associated with increase in wages,
income or remunerations to an employee with monetary influence.

6
Environmental factors: Elements outside the personality of an individual that influence his
personal experiences
Level of Motivation: The general desire or willingness of someone to do something.
Performance: The ability to produces positive results or accomplishment in a company set on
known standards such as increase profits, increase customers, and sales etc. It can also be
described as the action or process of carrying out or accomplishing an action, task, or function.
Social factors: Experiences that influences an individual’s personality, perception, attitudes
thoughts and lifestyle
1.11 Organization of study
This study is organized in five chapters. In the first chapter on introduction to the study, is the
background of the study and the problem the study seeks to address are examined. The purpose
of the study, research objectives and research questions are then examined. This is followed by
examining the significance, limitations, delimitations, basic assumptions and definition of
significant terms in the study. Chapter two had the introduction to the literature review, the
theoretical concept of financial performance and management, and a detailed empirical literature
review of the past and present studies done on the financial performance on donor funded
projects for both local and international studies and conceptual framework. This chapter was
concluded with a brief summary of the literature review that was important for this study in
accordance with the objectives for this study.
Chapter three for this study was the research methodology, this section captured the research
design, target population, sampling plan, data collection instruments and presentation and
analysis.
The chapter four of the study was the data presentation, discussion and interpretation of the
empirical findings from the studies and data collection process. This section provided a detailed
presentation of the research findings from the study in line with the research objectives and
research questions for the study.
Finally, the study would have chapter five that contained the summary of the study, conclusion
and recommendations and suggestions for further research. References made in the study are
appended in the Reference section of this research project. In addition, authorization letter to

7
collect data and research instrument are appended in the Appendices section of this research
project.

8
CHAPTER TWO
LITERATURE REVIEW
2.1 Introduction
The literature review captures the theoretical concepts that have been proposed on motivation of
the employees. In addition, a detailed empirical literature for this study was performed to capture
all the work that has been done on motivation of the employees. This focused on the economic,
social and environmental factors and how they contribute to employee motivation and therefore
performance. The conceptual framework was provided in this section to capture all the variables
that was used for this study. This took into consideration both the international and local studies
done and their relevance to this study in Kenya and more specifically Kenya Airways.
2.2 Economic factors and employees’ motivation
Jobs satisfaction has often been associated with the benefits received at the work place that have
economic value. This includes factors such as remuneration, fringe benefits, bonuses and
promotion in position (Ryan and Deci, 2000). They are also determined as an extrinsic factor
since they are tangible and observable by others (Bellenger et al., 1984). Promotion and pay
when offered to the employees have direct impact on employee job satisfaction. When an
employee is underpaid or has a feeling that the pay is not commensurate to the required salary
and other benefits with economic value when compared to others in a similar position in the
same company or outside. This is one demotivating factor and greatly contributes to employee
dissatisfaction leading to poor performance (Rehman et al., 2007).
Research has shown that individual behaviors are driven by factors that can be perceived by an
individual and the benefits of that can also be received in return for the actions. The fundamental
goals for extrinsically motivating factors have been expressed as reciprocal benefits (Valler and,
2000; Kowal and Fortier, 1999).
An advantage of using reward in an organization is to motivate the individuals to perform the
expected desires of the company (Bartol and Locke, 2000). Rewards in an organization can take
the form of increments in salary, and bonuses through elements that are not associated with

9
money such as promotions at the work place and job security (Davenport and Prusak. 1998).
There are several international companies that have introduced the use of rewards as a way of
motivating and giving encouragement to the employees. For instance, it has been documented
that companies like Lotus Development, a subsidiary of IBM, has been shown to base about 25%
of performance evaluations of employees working in the customers support department on their
ability to share knowledge and their involvement on other activities supporting the sharing on
knowledge (Bartol and Srivastava, 2002).
Similarly, Buckman Laboratories also appreciates and recognizes the first 100 knowledge
contributors in an annual conference always being held in a resort. It can therefore be suggested
that when employees receive rewards in an organization for offering knowledge, it can be used
positively in an organization; this would boost their positive attitude towards the organization
and also develop better intentions of knowledge sharing and therefore better performance for the
organization
This is the process of setting up strategies for rewarding the people fairly, equitably and
consistently as determined by the objectives and goals of the organization. Management of the
reward entails analysis and control of the employee remuneration and for all the benefits of the
employees (Brooks, 2009). The objective of reward management is to create and efficiently
operate a reward structure that was used by the organization. This strategy includes creating
policies, structures, salaries and payroll administration, executive pay for the senior employees
of the company and team reward.
The extrinsic rewards comprise rewards like bonuses, salary raise, gifts, promotions and
tangibles rewards (Armstrong, 2007). Reward management can be done with the assessment of
the motivational factors by using the motivational theories. They name and analyze the factors
that motivate people so that they can improve their performance and improve their efficiency.
They also help improve the physiological circumstances of the employees in an organization.
Reward management can also be done through the use of job evaluation so that the value of the
job can be defined. Decision making is done by the manager to determine the amount and to

10
whom that should be paid. It also gives the basis for grading, paying and managing jobs.
Performance appraisal can also be done to justify the pay of the employee. This also measures
the productivity of finding solutions in the order for productivity and the capability of the
employees and effectiveness (Armstrong, 2007).
This is the process offsetting up strategies that help in the rewarding the people fairly, equitably
and consistently as determined by the objective and the goals of the organization. Management
of the reward entails analysis and control of the employee remuneration and for all the benefits
of the employees (Brooks, 2009). The objective of reward management is to create and
efficiently operate a reward structure that is to be used by the organization. This strategy includes
the policies and the structures of an organization, salaries and payroll administration, executive
pay for the senior employees of the company and team reward. The rewards can be classified as
either intrinsic or extrinsic. The extrinsic rewards comprise rewards like bonuses, salary raise,
gifts, promotions and tangibles rewards. Intrinsic rewards include information /feedback,
recognition at the work place, relationship with the managers and empowerment (Armstrong,
2007).
Reward management can be done with the assessment of the motivational factors by using the
motivational theories. They name and analyze the factors that motivate people so that they can
improve their performance and improve their efficiency. They also help improve the
physiological circumstances of the employees in an organization. In addition, reward
management can be done through the use of job evaluation so that the value of the job can be
defined. This enables the managers to make a decision of the amount and to whom that should be
paid. It also gives the basis for grading, paying grading and managing jobs. Performance
appraisal can also be done to justify pay of the employee. This also measures the productivity of
finding solutions in the order for productivity and the capability of the employees and
effectiveness. This also helped improve motivation as a motivation tool (Kelly et al., 2011).
2.3 Social factors and employees’ motivation
The relations at the work place play a significant role in the motivation of the employees. This is
an example of an extrinsic factor for the employee motivation. The extrinsic factor puts pressure,

11
anxiety, tension on the employees and impacts on their abilities to achieve specific results
(Lindenberg, 2001).Most employees are interested in self-autonomy, promotion and other forms
of incentives as external factors. However, social factors significantly also contribute to the
relationship with the clients they serve, colleagues at the work place, employer and even the
management of the company.
Constant communication is required between the stakeholders on job satisfaction. Good social
relationship plays a significant role in the motivation of the employees. Studies have shown that
social factors have been able to predict beyond the task and knowledge abilities. It was also not
correlated to training and compensation (Meyers, 2007). Team work has also been supported by
studies done by Jex (2002), suggesting that when an individual works with a team, they develop
a positive attitude towards their job would be generated, especially when their work was
approved by the surrounding people leading to job satisfaction. There has been a consensus that
the social environment has strong influence on employee's attitudes and behaviors.
On the other hand, the interaction of staff in an organization promotes better knowledge
exchange association. The nature of the exchange can be economic or social emotional.
Economic exchange takes the form of money, goods and services as a form of reward. In
addition, a socioeconomic resource entails development of trust, devotion and trust. This ability
to develop exchange as a behavior in an organization is known to develop better individuals
participating in social exchange (Blau, 1964). It has been demonstrated that the benefits of
reciprocity behavior leads to the growth of the sense of mutual indebtedness, which promote
feeling of the contributors to always expect help from other employees. As a result, it ensures
that there is growth of supportive knowledge and sharing abilities according to the economies of
online cooperation as demonstrated by Kollock, (1999).
Research finding on online community shows that knowledge sharing is based on the strong
sense of reciprocity (Wasko and Faraj, 2005). Similar studies have also demonstrated that
reciprocity can be a strong basis of employee motivation so as to be able to provide knowledge
which leads to the development of long term cooperation between the employees and the

12
employers (Kankanhalli, Tan and Wei, 2005). This boosts the attitude of the employees in
sharing knowledge that would promote better relations among the employees in an institution.
2.4 Environmental factors and employees’ motivation
The workplace condition is a key factor contributing to an employee behavior or attitude towards
a job. Several factors have been suggested to interfere with a good working environment, such
as; stress level, leadership and climatic change at the workplace, they interfere with the mood
and energy of the employees. It has been shown that employees perform better when in a more
conducive work place environment and work conditions (Busch and Bush, 1978). Furthermore,
Ritter and Anker (2002) have also illustrated the role of job security and its direct relationship to
job satisfaction. Risks subjecting employee to losing his job as a result of the tasks that he does
that do not add value to an employee, company, or not recognized employee, would always
degenerate to demotivation and psychological stress. This impedes job satisfaction of the
employees at the work place.
It has been suggested that employees do work for their social determination, and self-
competence. Locke (1976) has defined job satisfaction as pleasurable or promoting positive
emotional state which is a product of one job appraisal. Similarly, Spreitzer et al, (2005) has also
suggested that job satisfaction allows the thriving of a work concept which is a combination of
emotions of vigor and enthusiasm. The employees also believe that they benefit through studying
and growing leading to personal growth in value. Furthermore, it has been argued by Bakker and
Demerouti (2008) by suggesting that it is a positive, fulfillment and a work-related state of mind
with unique attributes of vigor, and dedication. This is also characterized by the high states of
energy and mental resilience when working. Some of the employees also get motivated through
the experience of challenges and significance at the work place. Absorption has been expressed
as a key attribute in a fully concentrated and happily satisfied employee engrossed in one's work,
they seldom realize time passing by quickly and find it hard to get detached from work (Shirom,
2003).

13
External factors are not controlled by the feelings of the individual and hence considered to be
outside an ideal. Study findings show significant impact of reward and motivation on employees
and more especially, in increasing the employee performance which eventually reflects in the
organizational performance. An external source of motivation is considered to be in the form of
reward, money, coercion, threats, and punishment as a positive motivator. Competition is a major
motivational factor since it has also been shown to contribute to increase in the employee
performance. Gift vouchers given to employees at the apple Stores and other rewards such as
certificates to the employees on their good performance have been known to serve as extrinsic
motivators to the employees (Jain, 2005). In some cases, extrinsic factors are also considered to
be motivational factors that do not relate to their job descriptions through monetary terms and
elevation in grading at the work place. Motivation promotes job satisfaction and increased
performance of employees and overall company (Mustafa, 2011).
Research finding has demonstrated that the value of an employee determines the factors that
would be considered for their satisfaction at the work place, more especially, the unfulfilled work
values that contribute to their satisfaction (Locke (1976). A close relation has also been
established between the characteristic of a job and satisfaction in relation to the individual’s
growth need strength (GNS). This refers to the desire of employees for personal growth and
development while at the work place pursuing their career.
Research has demonstrated that employees with higher GNS are wasing to give their
contributions on ideas that would put more value on their job. They have also observed that they
are mainly interested in taking over tasks that are more challenging and rewarding. GNS
employees would also prefer opportunities that are creative and challenging in nature other than
a good pay since they are interesting and innovative and want an opportunity that is more
creative and challenging to help them grow and meet their career objectives. Furthermore,
Higher GNS have more job satisfactions when compared to low GNS employees (Locke, 1976).
Giving a low GNS to an employee with a challenging job made them more dissatisfied. Other
studies addressing the characteristics factors for challenging and job fulfillment have established

14
five different factors which include: Task identity, skill variety, task significance, autonomy and
finally, feedback as an important factor in motivating the higher GNS employees.
Similar studies have also identified that motivational factors can be positive or negative. For
instance, positive motivators have been categorized to include: monetary rewards, bonuses,
salary increments and other incentives, while negative motivators includes use of bribes and
threats which are considered to be outside the job requirements of the employee. It has been
expressed that the employee benefits from his actions.
Research done by Kalleberg (1977) has proposed that employees have greater job satisfaction
when they are linked to less employee absence and lower turnover rates which are important to
an organizations success. The employees are motivated by several factors such as job
enlargement, job rotation and job enrichment. Job enlargement refers to increase in work
activities and responsibilities so as to overcome boredom at the place or felt overspecialized in
his field of work. Job rotation allows the employees to be introduced to different work areas with
different roles and responsibilities in an organization. This enables them to increase their
perspective and knowledge of the company (Einhorn & Gallegher, 1976). Job enrichment is used
to allow the employee take higher responsibilities and tasks at the work place. This is believed to
offer psychological motivation to employees as an endorsement of their capabilities.
Motivational factors are known to be co-dependent. They all rely on the culture, environment,
society and awareness. This dependence makes the effectiveness of a certain method of
motivation debatable. There is a divergent view that the role of rewards in promoting the
productivity is not verifiable. This is despite the massive attribution by management of
companies to improvement in production after giving rewards to employees. Production is
controlled by many factors including the motivational factors. In this study, the influence of
motivation on work performance in an organizational setting was to be identified. It has been
shown that most organizations apply the use of extrinsic factors in influencing the motivation of
the workers (Vroom, 1964). In addition, he asserts that employees performed even better when
their wages are related to performance through an objective criterion that evaluates their

15
performance and merit; this attaches greater application of extrinsic motivation compared to
intrinsic motivation.
There is therefore a very strong connection between work efforts and motivation at the work
place; they are synonymous to one another as pointed out in the literature. Work motivation as
defined is a set of energetic powers that emanates from within and beyond the individual to
display special work related behavior’s that provide direction, intensity, and duration (Pinder,
2008). According to Latham (2007), a work motivation directly manifests itself through the work
efforts displayed by the individuals at the work place. Hence, it can be concluded that the work
effort comes as a critical result of the work motivation which can be expressed in terms of the
extent at which the employees were able to be create time and energy to productively exert effort
on the tasks discretionarily or allocated at the work place (Kanfer, 1987). This suggests that for
better performance to be realized in an organization, better and higher than the standard levels of
motivation is required to greatly enhance the productivity levels and more especially with the
discretionary work levels. It must be recognized that nobody has the potential of observing the
motivation of the individuals but it can be reflected as a stream of behaviour’s and hence, the
work effort can be used as a key indicator of the work motivation at the work place (Kanfer,
1990).
In studies done by Morris (2009) titled “Employees work motivation and discretionary efforts”
with the aim of establishing the impact of discretionary work effort on motivation of employees
at the work place. It is known that any work effort that is voluntary is above and beyond what
has been set as the minimal requirement and is expected. This study therefore emphasizes on the
value of discretionary work effort on the individuals work performance as well on the efficiency
and efficacy of organizations. This is also valuable with regard to the optimization of
organizational performance on long term competitiveness and sustainability. The organizations
need to allow employees to work at their own peak levels and individuals was be required to
supply their own discretionary effort to work at their required peak levels. This study has
recognized the importance of discretionary work effort in the promotion of organizational
performance and effectiveness it brings to the organizational performance.

16
The study adopted a monetary and non-monetary work environment in determination of
discretionary work effort. This study combined the efforts of organizational behavior’s and
economics in the discussion of value of discretionary efforts at the work place. These studies
were conducted in 12 different organizations in local government sectors of Western Australia.
The findings of this study showed that non-monetary work environment are common
characteristics with common perks and two of the three hypotheses set held the characteristics of
the of common Irks. Hence, it showed that the perks, irks, and monetary rewards were so
differently related to the different states of the discretionary work efforts. It was concluded that
organizations need to maximize on their potential of the human resources managers by
addressing the perks, irks and monetary rewards. Training is the most important to both the
managers and non-managers in cultivation of the positive interpersonal relationships.
Similar studies also done on motivation and productivity of the employees have shown that
motivated employees are more productive, happier and always stayed with the company for a
longer period of time. Thomas (2009) has been able to identify the main challenges at the work
place and he asserts that identifying what motivates every individual employee and taking into
the consideration of the their individual differences. Conceptual theories and frameworks have
been defined over the aspects that motivate an individual and the processes involved in
motivation. However, there are recent reports which state that the work place motivation theories
have not been able to adequately address issues at the work place and in the business
environments and hence they have as well failed to provide managers with the required guidance
for the managers with the required guidance of management in the contemporary organizations
(Steers et al, 2004; Manville & Ober, 2003).
Special reviews by the Harvard business school have shown the significance of work motivation
to the management of employee’s organization in an organization. However, most of the papers
suggest the need for intellectual energy channeled into the formulation of more relevant new
theories and models that define work motivations (Manville & Ober, 2003; Locke & Latham,
2004). Locke and Latham as well go ahead to identify that the current theories have limitations
and hence the limitation in the understanding of the factors that motivates the employees which

17
is incomplete in nature, this include the lack of defined definition of the concepts of motivations,
inadequate considerations of the relevance of theories, and absence of disciplinary boundaries in
the theories. The theories need to be broad in design and application to be useful for managers in
their application in the contemporary work place and in business (Locke and Latham, 2004).
Previous studies done on ecological, economic and social sustainability influence in employee
motivation showed that these factors vary from one company to the other. It has also been
suggested that this may contribute to sustainability of the company’s performance. Determining
the impact of motivation of employees on the company’s sustainability is important. Research
finding have showed that economic sustainability is the most basic level of sustainability at the
Wagner Solar company; the case under consideration in the study. It however, had its own
limitations.
Ecologically, it represented their interest, committed to the mission and vision. Moreover, the
ability to socialize people was not important, but was shown to improve communication,
information policy and promotion of the company values (Krenz, 2011). Maslow’s theory has
demonstrated the role of the environment to the work place. It has also been suggested that this
can be used to improve the motivation of the employees which boost the performance of the
organization. The Maslow’s theory of needs postulates that the work environment motivates
employees and it can be used to express the behavior of the workers at the work place a,
employees strive to be able to satisfy their needs in the hierarchy of the needs orders (Jex &
Britt, 2008).
Equity theory has also been shown to be a cognitive process where the employee sought to
achieve a balance between the inputs or the efforts at the work place and compare it with the
outcomes or the rewards to be received or anticipated by the employee. Reduction in the belief
matched the level of compensation. There was also an adjustment on the comparative standards
to his personal situation. Similarly, it has been shown that the cognitive power is adjusted
according to perception of inputs or the outputs received. This leads to psychological withdrawal
from responsibilities by demanding for a raise (Ambrose & Kulik, 1999).

18
2.5 Theoretical frameworks on motivational of employees
Motivation factors of employees can be characterized as intrinsic and extrinsic factors.
Motivational theory assumes that people do things in order to get what they want, this makes
them the needs. These developed into a behavior and which can be used to satisfy those needs to
bring about the satisfaction of the employees. Motivation theory therefore explains how wants
can be met in order to satisfy the needs for employees in an organization. There are several
motivational theories that determine the satisfaction and motivation of the employees: Maslow’s
laws for instance addresses the aspects of self-actualization, it address the aspects of education
religions, hobbies, personal growth, personal esteem, sense of belongingness, safety, and
physiological needs. In addition, it also proposes that lower needs take priority; they need to be
filled before others can be activated. It however, does not reflect the order in which they are
supposed to be fulfilled (Kelly and Cole, 2011).
In addition, Alderfer’s ERG theory classifies the needs into three different categories that are
ordered on the basis of their hierarchy. First is the growth needs such as the development of the
competence and realization of the potential within the work environments. Secondly, relatedness
needs and finally, needs of existence which includes the physical wellbeing. There is a high level
of similarity between Alderfer’s ERG theory and Maslow’s theory of needs they correspond to a
specific order. Moreover, acquired needs theory is also similar to Maslow’s and Alderfer’s
theory; the needs are associated with life experiences such as the need for achievement,
affiliation, and power which can be assessed using the thematic powers.
Cognitive Evaluation theory addresses both intrinsic and extrinsic factors as the main factors of
motivation. The intrinsic motivators include achievements, responsibilities and competence.
Extrinsic factors include pay, promotion, and feedback, working conditions (Armstrong and
Stephens, 2005). This are factors that are exists in the environment and are controlled by others.
Research has shown that intrinsically motivated individuals perform better since it is for their
own satisfaction. On the contrary, extrinsic factors may reduce the intrinsic motivation of an
individual. The intrinsic factors are closely related to the Maslow’s Theory.

19
Equity theory has also been proposed, it postulates that it is not the rewards that motivates but
the perception. Positive reinforcement has been a strengthening factor in the motivation of the
employees. Negative reinforcement on the other hand is the process of having a stressor
separated from the behavior (Stredwick, 2005). Punishment comes as a consequence of the
behavior
2.6 Conceptual Framework
There are several factors that affect the level of motivation of the employees in an organization.
This includes economic factors which is in the form of salary or wages; allowances; pay policy
such as pension, medical covers and insurance policies; vacation policy and rewards in the form
of benefits such in tickets at half price to specific destination one in a season. In addition, it can
also be controlled by the environmental factors such as the nature of the work life in the
organization, team work, and availability of facilities such as personally picking employees from
their homes, nature of organizational leadership, sharing of knowledge among employees, and
the nature of supervision support provided by the organization.
Finally, social factors may also affect the motivation of employees in an organization. This may
be in the form of formation and membership to social communities as SACCOS and Unions,
provision of support services such as marriage counseling, promotion at the work place, positive
reinforcement with good performance, and a cohesive relationship among the employees. All this
factors are believed to influence the motivation of the employees at the work place.

20
Independent Variables
Dependent variable
Moderating Variables
Figure 1: Conceptual Framework
Economic factors:
- Salary/wage
increment/Bonuses
- Allowances
- Pay policies
- Vacation policy
- Benefits half price tickets
Environmental factors
- Work life
- Teamwork
- Availability of facilities
- Organization leadership
- Supervision support
Level of motivation
- Productivity
- Performance
- Punctuality
- Discipline
- Dissatisfied
- Team work
Social factors
- Membership groups
- Support groups
- Promotion
- Positive reinforcement
- Employee associations
- Rate of absenteeism
- Employee turnover ratio
- Increased team work
- Number of complaints
- Number of customers

21
2.7 Knowledge Gap
The influence of motivation of employees has been widely studied in many companies of the
world as has been illustrated in this literature review. Many studies have focused on intrinsic
motivational factors of employees. However, very few studies have been able to demonstrate the
role of extrinsic factors on employee motivation. In fact, no data has been determined for our
local companies in Kenya. This study used a case of Kenya Airways; an international company
with international presence to determine the influence of extrinsic factors and more specifically;
social, economic and environmental factors on employee motivation. Moreover, this study also
provided more knowledge on the link between these extrinsic factors and the theory and practice
in employee motivation in Kenya.
2.8 Summary of Literature Review
This chapter has addressed the various motivational factors such as cognitive, psychological,
social, economic factors for employees. This study has also captured the needs of the employees
and how they are related to the job satisfaction. Moreover, the role of the extrinsic motivation
factors on job motivation has also been covered in this literature. The link between performance
and motivation has also been addressed and how reward can be managed and the techniques that
are applicable in the motivation of employees. Evidence of motivation of employees from
previous studies has also been provided to indicate the strength of employee motivation to Kenya
Airways which is the case of this study. The theoretical framework for this study involved the
application of motivational theory including Alderfer’s and Maslow’s theory. The conceptual
framework has also been illustrated in this study.

22
CHAPTER THREE
RESEARCH METHODOLOGY
3.1 Introduction
Research methodology provides the steps adopted by the researcher to logically study a research
problem. This chapter discusses the research design, target population, the sample size and
sampling technique, research instrument, data collection procedure, data analysis technique,
ethical consideration and operationalization of variables..
3.2 Research Design
This study adapted descriptive survey design. Orodho (2004) observes that a descriptive survey
involves collecting information about people’s attitudes, opinions, and habits on a phenomenon
by interviewing or administering a questionnaire to a sample of individuals. This point is
espoused by Kothari (2004) who stress that descriptive survey is used to describe characteristics
of a population or a phenomenon being studied. It is concerned with finding out who, what,
where and how of a phenomenon (Mugenda & Mugenda, 2003). This allowed us to capture the
different economic, social and environments factors and how they affect the motivation of the
employees.
3.3 Target Population
According to Kenya Airways website, it was anticipated that the total number of employees at
Kenya Airways is about 4,002 employees working in Kenya and abroad. This was the total
number of employees from the senior to the lowest cadre staff at Kenya Airways. It was
therefore a heterogeneous population with unique characteristics for this study. The Sample size
to be used for this study was determined from this population. It was assumed that the findings
made using the sample was representative of the total population of the study.
3.4 Sample size and sampling procedure
Fisher et al, (1999) formula for sample size determination was adopted;

23
n=
Where:
n=the sample size
z=the standard normal deviation at 95% confidence interval i.e. 1.96
p=expected population correlation coefficient (population effect size)
d= degree of accuracy
Since no studies have been done on these subjects, 50% (large effect size) or 0.5 was used to
determine the sample size.
q=1-p
e=level of precision (set at +/-5% or 0.05)
Thus,
n=
=384.16
Therefore,
n=384
Since the target population was less than 10,000, the sample size was adjusted using the
following formula;
n = N/ (1-N(e)2
Where;
nf = Desired sample size when population is less than 10,000
Desired sample size when population is more than 10,000
N=the estimate of the population size
Hence,
=350.46
Therefore, 350 employees were sampled assumed to be normally distributed.

24
In consideration of some of the factors influencing the reduction of the sample size, some of the
target respondents were on leave, some were off duty and other at work in planes out of the
country. Hence, only two thirds of the sample was administered with the questionnaires.
Hence: 2/3 of 350 = 233
Therefore, a sample size of 233 employees was used for this study.
3.5 Research instrument
Donald & Delno (2006) indicate that both primary and secondary sources of data are permitted
in research. The main focus was data obtained from primary sources through a self- structured
administered questionnaire which was customized for the research objectives of the study. This
is a significant way of collecting perceptions and attitude to work for employees at Kenya
Airways as a way of capturing their behavior and factors that can be used to motivate them to
increase their work performance. The key respondents were the employees of Kenya Airways.
The questionnaire to be used had specifically set questions that assess the respondents on the
different aspects of their motivation as employees. The questionnaire used both open and closed
ended questions to attain the research objectives. The significance of the open ended questions
enabled the respondents to provide their feedback freely and offer more explanation to support
their ideas. The closed ended question included options to be selected as responses in the Likert
type data.
A Likert five scale design was used to code the responses of the participants in the study so as to
quantify the responses collected from the respondents. The level of their responses w involved:
(1) Very High, (2) High, (3) neutral, (4) Low (5) very Low. The main purpose of using this
particular method was to enable the collection of quantitative data. This qualitative method
highly depends on the access and availability of that particular participant. Stratified sampling
technique a specific age, marital status and educational levels was selected for the survey,
ranging from 18 – 24, 25-35, 36- 60 years old in order to make sure the outcome of the survey
provides proper and unbiased results.

25
An introduction preceded the questionnaire for this study. The questionnaire was structured into
five sections labeled A-E: Section A contained the general bio-data about the respondents;
section B captured the economic factors of motivation; section C addressed the social factors of
motivation; section D focused on the environmental factors and finally, section E captured the
levels of motivation for the employees at Kenya airway’s.
3.5.1 Pilot testing of the instrument
This involves checking for the suitability of the questionnaire. The quality of research instrument
determines the outcome of the study (Alan & Emma, 2011). This was applied on 10% of the
sample size determined for this study. The questionnaires were administered to 23 cabin crew
members but not part of the sample. The selected individuals for piloting were expected to
respond to the items in the questionnaires. Piloting established whether the instrument was able
to measure the construct adequately; established whether the respondents found the items easy to
respond to; established whether the instrument was comprehensive enough to elicit the intended
information and the level of the respondent; and established whether the time allocated for the
data collection was adequate. The respondents in the piloting exercise were not included in the
final administration of the questionnaires.
3.5.2. Validity of the instrument
Testing the validity of research instruments helps the researcher to be sure that the items measure
the desired constructs. Mugenda & Mugenda (2003) define validity as the accuracy and
meaningfulness of the inferences which are based on research results. In other words validity is
the degree to which results obtained from the data actually represents the phenomena under
study. The instrument for this study was validated through application of content validity, which
is determined by expert judgment. Content validity is a matter of judgment by the researcher and
professionals, and has no specific formula for determination (Kothari, 2004). Therefore, to test
for validity of the research instrument in this study, opinion from three experts was sought.
While determining the validity of the items in the research instruments, the advice of three
experts was followed as proposed by Kothari (2004).
3.5.3. Reliability of the instrument

26
Reliability is the degree to which an assessment tool produces stable and consistent results.
Orodho (2004) defines reliability as the degree to which the particular measuring procedure
gives similar results over a number of repeated trials. To establish the reliability of the
instrument, the researcher used the test retest technique for testing for reliability was applied.
The test was given to the same study group twice one week apart. Cronbach’s Alpha (α) was
used to test the reliability of the items in the instrument. Creswell (2012) indicates that a reliable
research instrument should have a composite Cronbach Alpha, α of at least 0.7 for all items
under study. Thus, reliability coefficient, α, of 0.7 was considered acceptable. The instrument
was revised and had a composite α of 0.8945 when going to the field.
3.6. Data collection procedure
A brief introduction was provided at the top of every questionnaire to serve as a guide to
respondents on how to answer the questions and give an assurance of confidentiality to the study.
The questionnaires were administered to the sample population for the duration of time allowed
by the administration. This also qualified for the small number of sample per center as set out in
sampling procedure due to time and availability constraints. The people to be interviewed were
the employees of Kenya Airways. This enabled this study to determine the factors of employee
motivation and challenges they face that influence their performance and therefore understand
the reasons for the high number of customer complaints.
3.7. Data analysis techniques
According to (Sharma, 2005) data analysis is the process of collecting, modeling and
transforming data in order to highlight useful information, suggesting conclusions and supporting
decision making. It involves examining what has been collected in a survey or experiment and
making decision and inferences (Donald &Delno, 2006).The data collected through the use of
questionnaires was analyzed descriptively. The data was then presented in percentages,
frequencies and measures of central tendency.
The simplest way to present data according to Brinker (1988) is in frequencies or percentage
tables, which summarizes data about a single variable. Frequencies were converted to
percentages so that they could be easier to interpret. In view of the above, the researcher

27
analyzed the data and represented the findings of the research in percentage, frequency tables.
Chi-square analysis was performed for the data for inferential analysis. Chi-square data analysis
was used to explain the association the economic, social and environmental factors to the
motivation of the employees at Kenya Airways. A Statistical Package (SPSSv18) was used for
analysis of data in this study.
3.8. Ethical considerations
In this study, research ethics were considered to avoid any form of harm, suffering or violation.
The researcher ensured that research ethics were strictly followed when developing and
administering data collection tool and techniques. The researcher obtained a letter from
University of Nairobi allowing him to conduct the research. The researcher then sought
permission from National Commission for Science, Technology and Innovation (NACOSTI) to
conduct the research in Kenya Airways. Permission was sought from the relevant offices at
Kenya Airways to collect information from the employees. This clarified the aim of the research
and the nature of the study thus improving cooperation from the respondents during data
collection.
The respondents were assured of the privacy and confidentiality of any information collected by
the study instruments in this research. The study also sought informed consent before they were
allowed to participate in the study. The information provided by the respondents was kept
confidential as agreed and was only be used for academic purposes only in this study. Further,
the researcher committed to make compensations in the event of any damages to the
organizations under study or individual respondents, especially reputational related, arising as a
result of this research.
3.9 Operational definition of the variables of the study
The operational variables were set on the basis of the research objective of the study. This was
also linked to the main concept to be measured and the specific procedure by which they would
be measured. In addition, this sections outlined how this section was going to be measured using
the social, economic and environmental dimensions and indicators. Both objective measures and
subjective measures were applied in order to meet the objective of the study.

28
Table 3.1: Operational definition of the variables
Objectives Variables Indicators Measurement Scale Data
collection tool
Data
analysis
Dependent
variable:
Employees’
motivation
Productivity
Performance
Punctuality
Discipline
Dissatisfied
Team work
What is the level of productivity
What is the level of performance
What is the level of punctuality
What is the level of discipline
What is the level of team work
What is the level of absenteeism
Ordinal Questionnaire Descriptive
analysis
Chi-square
analysis
To determine the
influence of
economic factors
on level of
employee
motivation at
Kenya Airways
Limited
Independent
variable:
Economic
factors
Salary/wage
increment/Bonuses
Allowances
Pay policies
Vacation policy
Benefits half price
tickets
The salary/wage is equitable to my
work out put
Employee receive fair allowances
The pay policies are satisfactory
The vacation policy is fabulous
Benefits are given to best
employees
The employee is very motivated
Ordinal Questionnaire Descriptive
analysis
Chi-square
analysis
To evaluate the
influence of social
Independent
variable:
Membership
groups
The employee is allowed to join
unions
Ordinal Questionnaire Descriptive
analysis

29
factors on level of
employee
motivation at
Kenya Airways
Limited
Social factors
Support groups
Promotion
Positive
reinforcement
Employee
associations
KQ provide good support services
such as counseling
Promotion is on competitive basis
Company appreciates employees’
services
The employee is in good terms with
the colleagues at KQ
Chi-square
analysis
To assess the
influence of
environmental
factors on level of
employee
motivation at
Kenya Airways
Limited
Independent
variable:
Environmental
factors
Work life
Teamwork
Availability of
facilities
Organization
leadership
Supervision
support
There is team work spirit at KQ
Work life is of high quality
There is commitment and
engagement by management
Facilities are adequate for all staff
Organizational structure is clear
and specified
Supervisors offer support needed to
employees
Ordinal Questionnaire Descriptive
analysis
Chi-square
analysis

30
CHAPTER FOUR
DATA ANALYSIS, PRESENTATION, INTERPRETATION AND DISCUSSION
4.1 Introduction
This chapter is on data analysis, presentation and interpretation. The first section in this chapter
is on the response rate of the respondents. The second section of this chapter presents the profiles
of respondents. The third section in this chapter is on the analysis, presentation and interpretation
of the relationships under investigation. The presentation and interpretation was in line with the
study’s objective. The findings are presented in the form of tables showing frequencies and
percentages. Since descriptive research design was used in this study, descriptive analysis was
carried out in this chapter. For each research objective, descriptive analysis was first done by use
of the percentiles and frequencies.
4.2 Questionnaire Response Rate
A sample size of 233 employees from a research population of 4002 was selected. Out of the 233
questionnaires that were administered, 95 questionnaires were duly filled and returned and
therefore regarded as the responsive instrument and formed the basis for data analysis. This
formed a questionnaire return rate of 40.77%. Saunders et al. (2003) indicate that 30 to 50
percent response rate is reasonable enough for statistical generalizations.
4.3 Profiles of the Respondents
This section profiles the respondents in respect to gender, age group, level of educational and
marital status. Profiling of the respondents was informed by the items in the research instruments
used in the study.
4.3.1 Distribution of Respondents by Gender
Data was sought on whether respondents were males or females. The study gave no preferential
consideration to none of the gender in the selection of respondents. Respondents were therefore
asked to indicate their gender. The responses were as shown in Table 4.1

31
Table 4.1: Distribution of Respondents by Gender
Gender Frequency Percentage
Male 35 36.84
Female 60 63.16
Total 95 100
Table 4.1 indicates that the females were the highest with 63.16% response rate compared to the
males with 36.84% response rate. Due to women empowerment policies, more women are being
employed to bridge the gap that has previously existed. Moreover, some work are culturally
considered feminine explaining the high number of women.
4.3.2 Distribution of Respondents by Age Group
Respondents were asked to indicate their age group in years. Age groups were classified into five
categories. The responses were as shown in Table 4.2.
Table 4.2: Distribution of Respondents by Age Group
Age group Frequency Percentage
18 – 24 years 12 12.63
25 – 34 years 52 54.74
35 – 44 years 28 29.47
45 – 54 years 3 3.16
Over 55 years 0 0
Total 95 100
The results in Table 4.2 indicate that 3.16% of the respondents were at the age group of 45-54
years, 29.47% for the age group 35-44 years, 54.74% for the age group of 25-34 years and finaly
12.63% for the age of 18-24 years of age. Hence, there are more youth in the age of 25-34 years
compared to those between 35-44 years. The extreme ages of 18-24 years and above 45 years of
age were very few in this study. This shows that all the respondents were 54 years and below
thus, all the respondents were productive employees and therefore in respect to employee
motivation, age of the respondents would be an insignificant factor.

32
4.3.3 Distribution of Respondents by Marital Status
Respondents were asked to indicate their marital status. Marital statuses were classified into four
categories. The responses were as shown in Table 4.3.
Table 4.3: Distribution of Respondents by Marital Status
Marital status Frequency Percentage
Single 48 50.53
Married 39 41.05
Divorced 6 6.32
Widowed 2 2.11
Total 95 100
The results in Table 4.3 indicate that most of the employees are single (50.53%), followed by the
group that are married (41.05%). The number of respondents that were divorced and widowed
was very few in numbers; 6.32% and 2.11% respectively. 67.37% of the respondents were
youths; this explains why the majority of the respondents were single. 32.63% of the respondents
were 35 years and above supporting why 41.05% were married given that some youths were also
married.
4.2.4 Distribution by level of education
The respondents were asked to indicate their highest level of education. The options that were
provided in this item were: high school; diploma; bachelor’s degree; and post graduate degree.
The responses were as shown in Table 4.4.
Table 4.4: Distribution of Respondents by Level of Education
Highest education level Frequency Percentage
High School 0 0
Diploma 13 13.68
Bachelor Degree 64 67.37
Post graduate Degree 18 18.95
Total 95 100

33
The results in Table 4.4 indicate that most of the employees employed in the cabin crew have
qualified education status. Most of the employees had a bachelor’s degree as a level of education
(67.37%). The rest had either a diploma at 13.68% or post graduate (18.95%). There was no
employee with a basic high school education working as a cabin crew at Kenya airways. The
level of education for the respondents was considered important in this study because the
respondents were required to fill in the questionnaire individually. Therefore the data collection
procedures used in the study were based on the assumption that the respondents were literate and
had basic understanding of the importance of research and therefore they would willingly act as
the respondents in the study.
4.4 Economic factors of motivation
The study sought to determine the influence of the economic factors on employees’ motivation.
The responses are presented in Table 4.5 to Table 4.10.
4.4.1 Benefits given to best employees
The study sought data on whether awarding of benefits in the company is based on performance.
The responses were as shown in Table 4.5
Table 4.5: Benefits given to best employees
Employee benefits Frequency percentage
Very high 2 2.11
High 5 5.26
Neutral 8 8.42
Low 60 63.16
Very low 20 21.05
Total 95 100
The results in Table 4.5 indicate that benefits are not offered to the best employees as suggested
by 63.16% and 21.05% who suggested low and very low ranking scores for the question. Only
2.11% and 5.26% of the respendents indicated that the benefits offered were to the best
employees in the company. An even higher number of respondents (8.42%) were neutral to the
question. The methods of awarding benefits determine the employee motivation. 84.21% of the

34
respondents felt that the company do not award benefits based on peformance. This is reflected
in the low motivation level. Thefore, employees should be given benefits based on performance.
4.4.2 Fabulous vacation policy
The study sought data on whether the vacation policy of the company is fabulous. The responses
were as shown in Table 4.6.
Table 4.6: Fabulous vacation policy
Vacation policy Frequency percentage
Very high 20 21.05
High 19 20.00
Neutral 42 44.21
Low 4 4.21
Very low 10 10.53
Total 95 100
The results in Table 4.6 indicate that the vacation policy for the respondents was neither high nor
low as suggested by 44.21% of the respondents who took a neutral position. However, 21.05%
and 20.00% of the respondents indicated that the pay policy was favourable with scores of very
high and high respectively. While 4.21% and 10.53% suggested low and very low responses
respectively as their responces. 41.05% of the respondents concurred that the vacation policy is
fabulous because of wonderful experiences it comes along with. However, 44.21% were unsure
given limited number of such vacations. Morever, 14.74% of the respondents disapproved the
vacation policy mainly because of unwanted destination. Thefore, the company should heighten
the number of vacation as well as involve the employees indecision making regarding vactions.
4.4.3 Satisfactory pay policies
The study sought data on the pay policies are satisfactory. The responses were as shown in Table
4.7.

35
Table 4.7: Satisfactory pay policies
Pay policies Frequency percentage
Very high 8 8.42
High 13 13.68
Neutral 20 21.05
Low 44 46.32
Very low 10 10.53
Total 95 100
The results in Table 4.7 indicate that majority of respondents were unsatisfied by the pay
policies. This is reflected in the low and very low scores of 46.32% and 10.53% respectively.
Only a few of the respondents believe that the pay policies are satisfactory with scores of 8.42%
and 13.68% for very high and high respectively. The rest (21.05%) took a neutral position on the
question. 56.85% felt that pay policies is not satisfactory compared to 22,10% who supported the
pay policies. Majority of the rspondents feel underpaid compared to the work they do. Thefere,
the pay policies should consider all the perimeters to ensure that the employees not only get what
they merit but also equitable.
4.4.4 Employee receive fair allowances
The study sought data on whether the employees receive fair allowances. The responses were as
shown in Table 4.8.
Table 4.8: Employee receive fair allowances
Fair allowances Frequency percentage
Very high 7 7.37
High 17 17.89
Neutral 9 9.47
Low 38 40.00
Very low 24 25.26
Total 160 100

36
The results in Table 4.8 indicate that there was a high response rate of 40.00% and 25.26% for
low and very low allowances compared to 7.37% and 17.89% who suggest that the allowances
they receive are very high. Only 9.47% did not know whether to state that the allowances are
high or low compared to their work output. This translate to 65.26% of respondents who are
dissatisfied by the amount of allowances they received. Therefore, the company should ensure
that the employees get fair allowances commensurate to the work output.
4.4.5 Salary equitable to work output
The study sought data on whether the salary/wage is equitable to my work output. The responses
were as shown in Table 4.9.
Table 4.9: Salary equitable to work output
Equitable salary Frequency percentage
Very high 5 5.26
High 12 12.63
Neutral 6 6.32
Low 49 51.58
Very low 23 24.21
Total 95 100
The results in Table 4.9 indicate that 51.58% of respondents agreed that the wage/salary that they
receive in the company is low when compared to the work output they produce in the company.
This was also supported by 24.21% of the respondents who suggest that the amount of wages
paid to them is very low compared to their work output. However, only 5.26% and 12.63%
indicated that their work output was equitable to the wage that they receive compared to 6.32%
who were neutral on this question. In total 75.79% of the respondents lamented that the salary
they receive is not equitable to their work output. This is associated with poor pay policy, poor
policies on awarding on benefits and allowances. Therefore, the company need to review its pay,
benefit and allowance policies.
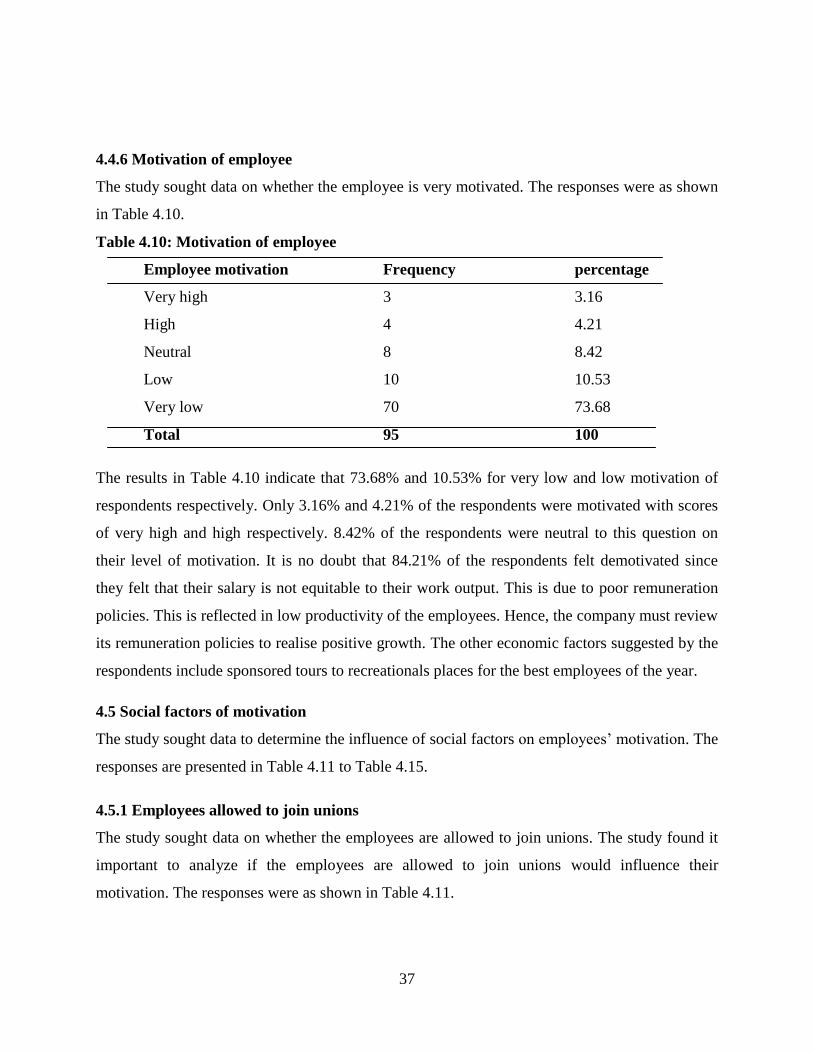
37
4.4.6 Motivation of employee
The study sought data on whether the employee is very motivated. The responses were as shown
in Table 4.10.
Table 4.10: Motivation of employee
Employee motivation Frequency percentage
Very high 3 3.16
High 4 4.21
Neutral 8 8.42
Low 10 10.53
Very low 70 73.68
Total 95 100
The results in Table 4.10 indicate that 73.68% and 10.53% for very low and low motivation of
respondents respectively. Only 3.16% and 4.21% of the respondents were motivated with scores
of very high and high respectively. 8.42% of the respondents were neutral to this question on
their level of motivation. It is no doubt that 84.21% of the respondents felt demotivated since
they felt that their salary is not equitable to their work output. This is due to poor remuneration
policies. This is reflected in low productivity of the employees. Hence, the company must review
its remuneration policies to realise positive growth. The other economic factors suggested by the
respondents include sponsored tours to recreationals places for the best employees of the year.
4.5 Social factors of motivation
The study sought data to determine the influence of social factors on employees’ motivation. The
responses are presented in Table 4.11 to Table 4.15.
4.5.1 Employees allowed to join unions
The study sought data on whether the employees are allowed to join unions. The study found it
important to analyze if the employees are allowed to join unions would influence their
motivation. The responses were as shown in Table 4.11.

38
Table 4.11: Employees allowed to join unions
Joining unions Frequency percentage
Very high 30 31.58
High 0 0.00
Neutral 0 0.00
Low 0 0.00
Very low 65 68.42
Total 95 100
The results in Table 4.11 indicate that 68.42% of the respondents felt that they are not allowed to
join unions. Yet 31.58% of the respondents suggested that they can join unions as employees of
Kenya airways. Given that the employees have limited bargaining power as many of them are
not allowed to join unions. This explains why they feel underpaid as the fear airing their
greviances for fear of victimization. Thus, the employees are demotivated resulting in poor
performance.
4.5.2 KQ provide good support services such as counseling
The study sought data on whether KQ provide good support services such as counseling. The
responses were as shown in Table 4.12.
Table 4.12: KQ provide good support services such as counseling
Good support Frequency percentage
Very high 10 10.53
High 25 26.32
Neutral 15 15.79
Low 33 34.74
Very low 12 12.63
Total 95 100
The results in Table 4.12 indicate that the employees are also not provided with support services
since a high response rate of 34.74% and 12.63% were recorded for low and very low

39
respectively. This was followed by a response rate of 36.85% for very high and high combibed
with 10.53% and 26.32% respectively. Only 15.79% of the respondents were neutral in this study
suggesting they are not aware of counselling or any other support service offered by the
company. With 47.37% lacking social support, many respondents could be emotionally
overwhelmed which physically drain them leading to less productivity. Thus, the company must
invest in social support to the employees to easen their emotional burdens and to increase
productivity by boosting their motivation.
4.5.3 Promotion is on competitive basis
The study sought data on whether Promotion is on competitive basis. The responses were as
shown in Table 4.13.
Table 4.13: Promotion is on competitive basis
Competitive promotion Frequency percentage
Very high 3 3.16
High 5 5.26
Neutral 7 7.37
Low 35 36.84
Very low 45 47.37
Total 95 100
The results in Table 4.13 suggest that promotion in the company is not on competitive basis.
84.21% of the respondents had a very low and low scores for this study with 36.84% and 47.37%
respectively. While very few respondents had very high and low scores of 3.16% and 5.26%
respectively. 7.37% of the respondents were neutral in this study. The promtion is based on
favours and merit is never considers. Best performing employees are never rewarded with
promotion which lowers their productivity as they become demotivated. This results to low
productivity of the company.
4.5.4 Company appreciates employee’s services
The study sought data on whether the company appreciates the employees’ services. The
responses were as shown in Table 4.14.

40
Table 4.14: Company appreciates employee’s services
Company appreciation Frequency percentage
Very high 20 21.05
High 19 20.00
Neutral 23 24.21
Low 13 13.68
Very low 20 21.05
Total 95 100
The results in Table 4.14 indicate that Kenya Airway’s appreciate the employees work since
about 41.05% of the employees had very high and high scores of 21.05% and 20.00%
respectively. However, 34.73% of the respondents had a very low score suggesting that the
employees are not appreciated by Kenya Airways. 24.21% of the emlployees were neutral to the
question of company appreciation. The company appreciate employees as supported by 41.05%
of the respondents. However, the procedures for appreciating the employees are obscure as well
as the low frequency explaining why 34.73% felt that there is low appreciation of employees.
The company need to come with clear guidelines of appreciating the employees.
4.5.5 Employee in good terms with colleagues at KQ
The study sought data on whether the employees have good working relations. The responses
were as shown in Table 4.15.
Table 4.15: Employee in good terms with colleagues at KQ
Working relations Frequency percentage
Very high 60 63.16
High 12 12.63
Neutral 4 4.21
Low 15 15.79
Very low 4 4.21
Total 95 100

41
The results in Table 4.15 indicate that the relationship and association between the employees
was perfect with a response of 75.79%. Only 20.00% had a low response while 4.21% were
neutral in their response. There is enhance communication among the employees due to good
working relation. Open communication among the employees boost employees confidence
which greatly enhance productivity. Other social factors include team buiding events organized
and sponsored by Kenya Airways that would be able to involve the participation of management
and employees at the same time. This would allow communication betweeen employees and
allow reciprocity. It was also suggested that the company can sponsor the participation of
employees in social events. This would motivate the employees and make them feel appreciated
in the company.
4.6 Environmental factors of motivation
The study sought data to determine the influence of environmental factors on employees’
motivation. The responses are presented in Table 4.16 to Table 4.21.
4.6.1 There is team work spirit at KQ
The study sought data on whether there is team work spirit at KQ. The responses were as shown
in Table 4.16.
Table 4.16: There is team work spirit at KQ
Team work Frequency percentage
Very high 2 2.11
High 17 17.89
Neutral 40 42.11
Low 5 5.26
Very low 40 42.11
Total 95 100
The results in Table 4.16 indicate that there is weak team work spirit at Kenya Airways as
represented by a high score of 42.11% of the very low score for the respondents and a neutral of
42.11% of the respondents. A few of the respondents indicated that there is team work at the
work place with 2.11%and 17.89% response rate. Only 5.26% of the respondents suggested that

42
they team work spirit was very low. There is little interaction among the employees mainly due
to the nature of the work the cabin crew do.
4.6.2 Work life is of high quality
The study sought data on whether work life is of high quality. The responses were as shown in
Table 4.17.
Table 4.17: Work life is of high quality
Quality work life Frequency percentage
Very high 5 5.26
High 26 27.37
Neutral 19 20.00
Low 12 12.63
Very low 33 34.74
Total 95 100
The results in Table 4.17 indicate that the work life quality of the respondents is very low with
responses of 12.63% and 34.74% while others suggested that the quality of life is higher with
responses of 5.26% and 27.37% for very high and high respectively. Only 20.00% of the
responses indicated that they were neutral. Due to job dissatisfaction the The employees are not
dedicated and committed to their work. This result in poor quality work and low performance.
4.6.3 There is commitment and engagement by management
The study sought data on whether there is commitment and engagement by management. The
responses were as shown in Table 4.18.

43
Table 4.18: There is commitment and engagement by management
Management commitment Frequency percentage
Very high 0 0.00
High 2 2.11
Neutral 5 5.26
Low 40 42.11
Very low 48 50.53
Total 95 100
The results in Table 4.18 indicate that there is very little commitment and engagement by the
management at Kenya Airways. There was a very low response of 50.53% followed by a low
response of 42.11% for commitment and engagement. Only 2.11% of the respondents indicated a
high score for commitment and engagement and 5.26% of the respondents were neutral to the
question. The top management rarely engage the employees, this explains why 92.64% of the
respondents felt that the management is less concerned. This reduces productivity of the
employees as there is lack of urgency and importance is barely discerned.
4.6.4 Facilities are adequate for all staff
The study sought data on whether facilities are adequate for all staff. The responses were as
shown in Table 4.19.
Table 4.19: Facilities are adequate for all staff
Adequate facilities Frequency percentage
Very high 3 3.16
High 7 7.37
Neutral 29 30.53
Low 21 22.11
Very low 35 36.84
Total 95 100
The results in Table 4.19 indicate that the facilities at the work place are not sufficient for all the
employees at the work place following the very low and low response of 36.84% and 22.11%
respectively. Many of the staff at Kenya Airways (30.53%) were neutral about the sufficiency of

44
the facilities while only 3.16% and 7.37% respectively. The facilities facilitate the operations of
the employees and improve the employees’ performance. Hence, limited facilitate limit the
realization of the full potential of the employeees. Thus, the company should facilities to
improve performance.
4.6.5 Organizational structure is clear and specified
The study sought data on whether the organizational structure is clear and specified. The
responses were as shown in Table 4.20.
Table 4.20: Organizational structure is clear and specified
Organisational structure Frequency percentage
Very high 10 10.53
High 19 20.00
Neutral 26 27.37
Low 38 40.00
Very low 2 2.11
Total 95 100
The results in Table 4.20 indicate that many of the respondents believe that the organizational
structure of Kenya airways is not clear since 40.00% of the respondents indicated a low score
while only 2.11% had a very low score. Only 30.53% of the respondents indicated confidence
with the organiational structure with a scores of 10.53% and 20.00% for very high and high
values. 27.37% of the respondents were neutral on this subject. The vague organisation sturcture
of the company makes it vulnerable to miscommunication and competition of interests.
4.6.6 Supervisors offer support needed to employees
The study sought data on whether the supervisors offer support needed to employees. The
responses were as shown in Table 4.21.

45
Table 4.21: Supervisor offer support needed to employees
Supervisor support Frequency percentage
Very high 30 31.58
High 29 30.53
Neutral 30 31.58
Low 0 0.00
Very low 6 6.32
Total 95 100
The results in Table 4.21 indicate that the supervisors offered support needed by the employees
in the company. About 62% of the employees suggested that the supervisors offers support to
employees with scores of very high and high values of 31.58% and 30. 53% respectively. Only
6.32% of the respondents indicated that they had very low score on supervisory support. 31.58%
of the respondents were neutral. The supervisors offer a helping hand to the employees whenever
their demanded.
4.7 Employees’ motivation
The study sought data on employees’ motivation. This was done so as to determine influence of
extrinsic factors. The responses are presented in Table 4.22 to Table 4.27.
4.7.1 Level of productivity
The study sought data on level of productivity of the employees. The responses were as shown in
Table 4.22
Table 4.22: Level of productivity
Level of productivity Frequency percentage
Very high 2 2.11
High 16 16.84
Neutral 44 46.32
Low 33 34.74
Very low 10 10.53
Total 95 100

46
The results in Table 4.22 indicate that many of the respondents are not sure of the level of
productivity as suggested by 46.32% of the respondents. However, 18.95% of the respondents
suggests that there was some productivity in the company as indicated by 2.11% for very high
and 16.84% for high scores respectively. This was contrary to the view of 45.27% of the
respondents who hold that the productivity of the company is very low as shown by value sof
34.74% for low and 10.53% for very low. Dut to low motivation level, it is no surprise that the
productivity of the employees is very low and even hard to tell.
4.7.2 Level of performance
The study sought data on level of performance of the employees. The responses were as shown
in Table 4.23.
Table 4.23: Level of performance
Level of performance Frequency percentage
Very high 8 8.42
High 16 16.84
Neutral 22 23.16
Low 40 42.11
Very low 9 9.47
Total 95 100
The results in Table 4.23 indicate that performance was the lowest in the company with a
combined score of 51.58% representing 42.11% for low and 9.47% for very low responses
respectively. A few of the respondents suggested that the company had a higher performance as
indicated by 8.42% for very high and 16.84% for high level of performance for the company.
23.16% of the respondents were neutral in responding to the level of performance of Kenya
Airways. The dissatified employees carry out poor quality work. This result into low
performance which is reflected in the low work output.

47
4.7.3 Level of punctuality
The study sought data on level of punctuality of the employees. The responses were as shown in
Table 4.24.
Table 4.24: Level of punctuality
Level of punctuality Frequency percentage
Very high 36 37.89
High 18 18.95
Neutral 24 25.26
Low 7 7.37
Very low 10 10.53
Total 95 100
The results in Table 4.24 indicate that punctuality in the company was very high with a score of
56.84% combined for high and very high while a combined low response was a total of 17.90%
indicating the lack of punctuality among this groups. Only 25.26% of the respondents indicated a
neutral position on the level of punctuality in this study. However, the good punctuality is never
converted to performance as the employees lack dedication and commitment to their work.
4.7.4 Level of discipline
The study sought data on level of discipline of the employees. The responses were as shown in
Table 4.25
Table 4.25: Level of discipline
Level of discipline Frequency percentage
Very high 20 21.05
High 27 28.42
Neutral 4 4.21
Low 4 4.21
Very low 40 42.11
Total 95 100

48
The results in Table 4.25 indicate that discipline at the work place was higher in the company as
suggested by the combined high score of 50.47% compared to the combined low response of
46.32%. Only 4.21% of the respondents were neutral for this question. The discipline level is
average in the company. However, more needs to be done to instill high level of discipline.
4.7.5 Level of teamwork
The study sought data on level of teamwork of the employees. The responses were as shown in
Table 4.26.
Table 4.26: Level of teamwork
Level of teamwork Frequency percentage
Very high 4 4.21
High 21 22.11
Neutral 19 20.00
Low 28 29.47
Very low 23 24.21
Total 95 100
The results in Table 4.26 indicate that team work was very poor with a very low score of
53.68%, on the contrary, 26.32% was the combined score for the high score which was far much
lower. 20.00% of the respondents were very neutral to teamwork. The employees experience
minimal contact among themselves due to the nature of the work. Dissatisfied employees are
never dedicated and committed to their work resulting in poor quality work and eventually poor
performance.
4.7.6 Level of absenteeism
The study sought data on level of absenteeism of the employees. The responses were as shown in
Table 4.27.

49
Table 4.27: Level of absenteeism
Level of absenteeism Frequency percentage
Very high 25 26.32
High 26 27.37
Neutral 15 15.79
Low 19 20.00
Very low 10 10.53
Total 95 100
The results in Table 4.27 indicate that absenteeism among the respondents was average with a
high score of 53.69% and a low score on absenteeism with 30.53%. Only 15.79% of the
respondents had neutral score for this question in this study. Low motivation breeds dissatified
employees which leads to high absenteeism. When the company experiences high absenteeism,
the performance is generally low.
4.8 Inferential statistics
A chi square analysis of the association between economic factos on motivation of employees
revealed that there as a significant relationship between economic factors and motivation of
employees at Kenya Airways ( X2 = 161.52, p > 0.001). Hence, low economic status in this study
was associated with low motivation of the employeees at Kenya Airways.
The social factors was also significantly associated wth employeee motivation (( X2 = 150.62, p
> 0.001). This suggests that the social factors affecting the employees are associated with the low
motivation of the employees at Kenya Airways.
Similarly, the environmental factors are also closely associated with the motivation of the
employees at the Kenya Airways ( X2 = 195.61, p > 0.001). This indicated that there is an
association between the various environmental factors at the work place and the motivation of
the employees at the work place in Kenya Airways. This suggest that the prevailing
environmental factors at the workplace may be the reason behind the poor motivation of
employees at the Kenya Airways.

50
A chi-square analysis of the various levels of motivation of Kenya Airways on punctuality,
peformance, productivity and others indicated that there was a close association between this
factors and motivation of employees at Kenya Airways ( X2 =100.49, p > 0.001). This suggests
that there low level of motivation among employees of various asoects as punctuality,
performance, productivity, team work, absenteeism are associated with the low motivation of the
employees at Kenya Airways as shown in Table 4.28.
Table 4.28: Chi-square analysis Summary
Measure of motivation chi-square DF significance
Economic factors 161.52 10 p < 0.001
Social factors 150.62 8 p < 0.001
Environmental factors 195.61 10 p < 0.001
Levels of motivation 100.49 10 p < 0.001
4.9 Discussion of the findings
The study has found out that the advantage of using reward in an organization is to motivate the
individuals to perform the expected desires of the company. This is in agreement with the
findings by Bartol and Locke (2000). However, the employees performed even better when their
wages are related to performance. This mirrors Vroom (1964) observation compensation should
be through an objective criterion that evaluates their performance and merit. The study has also
revealed that poor promotions and pay policies lead to low motivation of employees. This
espouses the findings of (Rehman et al (2007) that promotion and pay when offered to the
employees have direct impact on employee job satisfaction.
When the pay is not equitable alongside other fringe benefits the employees become demotivated
leading to poor performance. The study has shown extrinsic rewards determine the motivational
level of the employees which is agreement with the findings by Armstrong (2007) that extrinsic
rewards improve employees performance and efficiency. They also help improve the
physiological circumstances of the employees in an organization. As put forward by Mustafa

51
(2011) motivation promotes job satisfaction and increase performance of employees and overall
company.
The study has found out that team work is crucial to employees’ motivation as they share and
learn from one another which lead to job satisfaction. Thus, the study supports the findings of
Jex (2002) that team work enables the employees to develop a positive attitude towards their job
leading to job satisfaction. The study has also revealed that low motivation is a contributor to
increased absenteeism by the employees. This confirms the findings by Kalleberg (1977) that
employees have greater job satisfaction when they are linked to less employee absence.
The study has been shown that employees perform better when in a more conducive work place
environment and work conditions which avers the same sentiments as Busch and Bush (1978).
The study has further shown that job dissatisfaction leads to poor work quality. This concurs
with Latham (2007) that work motivation directly manifests itself through the work efforts
displayed by the individuals at the work place. Hence, it can be concluded that the work effort
comes as a critical result of the work motivation which can be expressed in terms of the extent at
which the employees create time and energy to productively exert effort on the tasks
discretionarily or allocated at the work place.
However, it is worth noting that the employees can have high punctuality at work yet little to
show for that except poor performance. When the employees are dissatisfied due to low
motivation they do poor quality work resulting in poor performance. This suggests that for better
performance to be realized in an organization, better and higher than the standard levels of
motivation is required to greatly enhance the productivity levels and more especially with the
discretionary work levels.
The chi-Square analysis also demonstrated that economic factors are significantly associated
with the motivation of employees. Hence, the low scores in the responses suggest low motivation
of the employees at Kenya Airways. According to Krenz (2011), economic factors are the most
basic level of motivation, in this case of Kenya Airway’s; it also serves as a very important

52
indicator of employee motivation. Economic stability of the employees also determines the
sustainability of the company, performance and productivity.
The social factors in this study also showed a significant association with the motivation of the
employees at Kenya Airway’s (p < 0.001). Despite having a low score in this study leading to
low motivation of the employees, research findings from a similar study has demonstrated that
the ability to socialize people was not important, but was shown to improve communication,
information policy and promotion of the company values (Krenz, 2011). The social factors
assessed in this study indicated a very low score for scores by respondents for the ability to join
labor unions, support from management such as counseling and promotion incentives on
competitive basis.
However, many respondents suggested that they are appreciated for service offered by the
management and they also have a very good relationship among employees at Kenya Airways.
Social factors are known to provide supportive environment and allows sharing of knowledge
allowing cooperation (Kollock, 1999). Moreover, it has been shown that sharing only becomes
practical with a very strong sense of reciprocity among the employees (Wasko and Faraj, 2005).
Reciprocity is a significant element in employee motivation and in promotion of knowledge
sharing allowing long term association between employer and employees leading to motivation,
low turnover, and retention of employees (Kankanhalli, Tan and Wei, 2005).

53
CHAPTER FIVE
SUMMARY OF FINDINGS, CONCLUSIONs AND RECOMMENDATIONS
5.1 Introduction
This chapter presents and discusses briefly the summary of findings, then offers a conclusion and
recommendations from the findings, and finally gives suggestions for further research.
5.2 Summary of Findings
The study has established that economic, social, and environmental factors affect the motivation
of the employees at the work place. An evaluation of the economic factors as suggested by the
respondents shows they agree that the salary/wage offered is not commensurate to the work that
they do in the company as indicated by 51.58% of the respondents as the mode of the study and a
combined low score of 75.79% Vs 17.89% that indicate that the wage was high for the work they
do. Similarly, a low versus high allowances was also reported in this study with values of
65.26% Vs 25.26% indicating the low satisfaction and hence motivation of the employees in this
study.
They also consider the policy unsatisfactory since a low vote of 56.84% verses a high vote of
22.11% was indicated in this study finding. However, vacation policy was fabulous as
represented by a high of 41.05% Vs 14.74 low score. Albeit, even a higher percentage of
respondents (44.21%) than both high’s and low’s combined in this study for this factor reported a
neutral score suggesting they were not sure of the benefits of the vacation benefits. The
respondents however strongly disagree that the benefits are given fairly to the best employees in
the company following the low score of 84.21% vs 7.37% high score combined for very high and
high for this question. The same number and percentage of employees suggested that they lack
motivation as employees of Kenya Airways.
Social factors on the other hand showed a general low response indicating that it strongly affects
the motivation of the employees of Kenya Airways. This section sought to understand the

54
relationship between joining unions, support services offered to employees by the company,
perceptions towards promotions in the company, attitude to appreciations offered by Kenya
Airways and the general relationship between the employees at Kenya Airways. It is evident that
they are not allowed to join unions as employees at Kenya Airways following a low to high
response of 68.42% vs 31.58%.
This is also the same case with the provision of employee support services as counseling which
was shown to be low by most of the respondents compared to those that indicated a high with
score values of 47.37% vs 36.84%. Promotion is biased as well with a very high group
supporting this assertion with values of 84.21% vs 8.42% for low compared to high responses.
Their services are appreciated as suggested by 41.05% who reported a high, however, 34.74%
disagree with a low score while 24.21% were neutral indicating that probably, the company does
not appreciate equally for most of the work performed by the employees of the company. The
relationship between the employees is very strong and this is the only positive motivational
factors for the employees as suggested by most of the respondents (75.79%). However, this is not
a key factor influenced the company.
Environmental factors in the company have also been demonstrated to be a vital element in the
motivation of the employees of the company. The environmental factors assessed included team
work spirit among employees, quality of work life, commitment of the management, adequacy of
facilities, attitude towards the organizational structure, and perception of the supervisory support
offered to them. The findings demonstrate that there team work spirit is low indicated by a high
number of respondents with a low score when compared to those who suggest they have a high
spirit (47.37% vs 20.00%). An even a high number of respondents were neutral (42.11%).
Similarly the work life quality of the employees is poor with a low to high respondent’s score of
47.37% vs 32.63%.
The absence of commitment and engagement by management is conspicuous with a very
variation between the low to high response rate of 92.64% vs 2.11% for low to high in this study.
Facilities have also been indicated to be few compared to the staff population as indicated by

55
58.95% employees with a low value compared to 10.53% who suggest they are sufficient. It also
seems that the organizational structure of Kenya Airways is not well understood since a high low
score was recorded when compared who said it is clear with a high score (42.11% vs 30.53%).
The only positive aspect is that the supervisors are available to offer the support that is needed by
the employees at the work place as indicated by a high score of 62.11% vs 6.32 who had a low
score indicating poor support services by supervisors.
When assessing the levels of motivation, several parameters were assessed including
performance, productivity, punctuality, discipline, team work and absenteeism. It is clear that
productivity, performance, team work is very low with a high response rate of low scores when
compared to high scores of 45.26% vs 18.95%; 51.58% vs 25.26% and 53.68% vs 26.32%
respectively. However, a high scores were record for punctuality, discipline, and absenteeism at
Kenya Airways suggesting that the employees are punctual, have exercised a very high level of
discipline at the work place, however, there is a very high rate of absenteeism which is an
indicators of absence of motivation among the employees. This may be the reason for the poor
performance and productivity of the employees at the work place.
The significant values (p < 0.001) from chi-square analysis is a positive indicator that the role of
the economic, social and environmental factors strongly influence motivation of employees at
the work place.
5.3 Conclusions
The finding in this study has shown that there low economic, social and environmental
motivation of the employees at the work place. This study therefore has established a close
finding that is supported by the motivational theories as addressed in this study. According to the
motivational theory, the needs of the employers can be met so as to satisfy the needs of the
organization. This can be represented by the theory of needs referred to as the Maslow’s theory.
It is a self-actualization theory which supposes that personal needs have to be met so as to be
able to have a motivated employee at the work place.

56
The economic factors in this study are therefore believed to promote such elements and hence
the low motivation of the employees linked to the low response rate in this study may be
associated to the absence of economic factors in the motivation of the employees in this study.
This study has demonstrated that Kenya Airways has not put into consideration the role of
environmental factors assessed in this study into consideration as factors that would promote the
motivation of employees as suggested by the study findings. Team work, quality of life of
employees, commitment by management and facilities were scored low by many of the
respondents in this study. Moreover, the organizational structure of the Kenya Airways was not
clearly understood by many of the respondents. However, the supervisors offered the support
required by all the employees at the work place indicating a good point of motivation. These
factors are ecological and similar findings from other studies showed that they represent the
interest of the company. Moreover, they also indicate the commitment to the mission, vision and
aims of the company. Hence, a low score on these factors indicate poor motivation of the
employees. Consequently, it may be directly associated with the failure of Kenya Airways in
meeting the mission and vision.
The level of motivation of employees was assessed and evaluated the motivation and factors that
promote motivation and whether they can be associated with performance, productivity and
discipline, team work and as well absenteeism. The study findings shows poor performance,
productivity and team work while punctuality, disciple and abseentism have high scores in this
study. The study demonstrates that productivity is directly related to the motivation of an
employee. Motivation at work is directly manifested in the work itself through the work efforts
displayed by the individuals at the work place.
Hence, it can be concluded that the work effort comes as a critical result of the work motivation.
Moreover, this can be expressed in terms of the extent at which the employees were able to
create time and energy to productively exert effort on the tasks discretionarily or allocated at the
work place. However, another school of thought holds that productivity is not verifiable. This is
despite the massive attribution by management of companies to improvement in production and

57
performance after giving rewards to employees. It is evident that production is controlled by
many factors including the intrinsic and extrinsic motivational factors. In this study, the
influence of motivation on work performance, team work, and productivity was absent.
5.4 Recommendation
1. The findings of study suggest that most of the employees lack the motivation to work at
Kenya Airway’s. The company may therefore need to consider meeting the employees
intrinsic and extrinsic factors so that they can be able to meet all the needs of the
employees. It is hoped that this was be able to satisfy the employees and hence
motivating the employees and promote the improvement of performance, productivity,
teamwork, discipline, punctuality and reduce the high levels of absenteeism which affects
the performance of Kenya Airways.
2. Kenya Airways may also need to consider changing the culture of the company. The
company uses a top bottom kind of management strategy. It is recommended that the
company may need to consider using a bottom top organizational management structure
so that the employees may be able to understand the clear organizational structure and as
well as in the decision making process in the policies of the company. This was allow
accessibility to administration by the employees hence raising their issues and hence
allowing for motivation of the employees.
3. There is also need to increase the communication between the employees and employer
at Kenya Airways. This was able to promote reciprocity among the employees and
promote the social growth and development allowing for motivation of the employees at
the work place.
5.6 Suggestions for Further Research
1. A study to determine the attitude and perception of the employees at the Kenya Airway’s
need to be performed to ensure that the challenges facing the employees are assessed to
provide information about the challenges facing employees at the Airline.
58
2. It is also recommended that other theories need to be tested to add to the knowledge and
to capture the intrinsic factors of motivation for employees at Kenya Airways. This is
because this study focused on the economic, social and environmental factors which are
all extrinsic factors of motivation for employees.
3. It is also important to determine the relationship between motivation of the employees
and performance of Kenya Airways. This can be evaluated by using financial indicators
of performance and motivational indicators in a company.
4. Comparative analysis on companies can also be done to evaluate the repeatability of the
findings as made in this study under the same setting of the study on other companies.
This will be able to confirm the findings of the link between the economic, social and
environmental factors on motivation of employees.
5. There is need to do more studies on the environmental factors on the motivation of the
employees at Kenya Airways. There is also very little information on the effect of
environment on motivation of employees. This was be significant in the contribution to
knowledge, theory and practice to boost the motivation of employees, which is hoped to
increase productivity, performance, team work, punctuality, reduce absenteeism and
discipline in the company.

59
REFERENCES
Adeyemo, D.A. (1999). Relative influence of gender and working experience on job satisfaction
of primary school teachers. The Primary School Educators, 1: 86-89
Ambrose, M & Kulik, C. (1999). Old friends, new faces: Motivation research in the 1990s.
Journal of Management, 25 (3), 231–92.
Armstrong, M. (2007). A handbook of employee reward management and practice (2nd ed. ed.).
Philadelphia:
Armstrong, M. and Stephens, T. (2005). A Handbook of Employee Reward Management and
Practice. United Kingdom: Kogan Page Limited.
Bakker, A.B. and Demerouti, E. (2008). Towards a model of work engagement. Career
Development International, 13: 209-223
Bellenger, D., Wilcox, J. & Ingram, T. (1984).An examination of reward preferences for sales
managers. Journal of Personal Selling and Sales Management, 4: 1-6.
Blau, P.M. (1964). Exchange and power in social life. New York: John Wiley.
Brooks, Ian (2009). Organisational Behaviour (4th ed). Essex England: Pearson Education
Limited. pp. 81–89.
Busch, P. and Bush, R. (1978). Women Contrasted to men in the industrial sales force: Job
satisfaction, values, role clarity, performance and propensity to leave. Journal of
Marketing Research, 15: 438 – 448.
Davenport, T. and Prusak, L. (1998). Working Knowledge. Cambridge, MA: Harvard Business
School Press.
Einhorn, H., and Gallagher, W. (1976). Motivation theory and job design. The Journal of
Business, 49: 358-373
Evans, M.G. (1986). Organizational behaviour: The central role of motivation. Journal of
management 12: 203-204

60
Jain, P. (2005). A comparative analysis of strategic human resource management issues in an
organization context. Library Review, 54: 166-179.
Jex, S. (2002). Organizational Psychology: A Scientist-Practitioner Approach. New York, NY:
John Wiley & Sons, Inc.
Kleberg, A., (1977). Work Values and Job Rewards: A Theory of Job Satisfaction. American
Sociological Review, 42, 124-143.
Kanfer, R. (1990). Motivation theory and industrial and organizational psychology. In M.D.
Dunnette & Hough, L.M (Eds). Handbook of industrial and organizational Psychology.
(Vol. 1, pp.75-170). CA: Consulting Psychologists Press.
Kanfer, R. (1987). Task-specific motivation: An integretive approach to issues of measurement
mechanisms, processes and determinants. Journal of Social and clinical psychology, 5
(2), 237-264.
Kankanhalli, A., Tan, B.C.Y. and Wei, K.K. (2005). Contributing knowledge to electronic
repositories: an empirical investigation, Management Information Systems Quarterly, 29:
113–143
Kelly, P and Cole, G. A. (2011). Management Theory and Practice (7th ed.). Hampshire, United
Kingdom: Cengage Learning EMEA
Kelly, P. and Cole, G. A. (2011). Management Theory and Practice (7th ed.). Hampshire,
United Kingdom: Cengage Learning EMEA.
Kenya Airways (2015). Kenya Airways Ltd Summary Audited Group Results for the year Ended
31st March 2014. Retrieved from the web address: https://www.kenya-
airways.com/uploadedfiles/Global/About_Kenya_Airways/Investor_Information/KenyaA
irwaysLtdPressAnnouncement.pdf. Accessed on the 25th
March 2015.
Kollock, P. (1999). The economies of online cooperation: gifts and public goods in Cyberspace.
In Smith, M. and Kollock, P. (eds), Communities in Cyberspace (New York:
Routledge, 220–239.
Kothari, C.K. (2004). Research Methodology. New Delhi. New Age International

61
Kowal, J. and Fortier, M.S. (1999). Motivational determinants of flow: contributions from self-
determination theory. Journal of Social Psychology, 139: 355–68.
Krenz, S. (2011). How do ecological, economic and social sustainability influence on employee
motivation? A case study of German company in the solar energy sector. Thesis. UMEA
University.
Latham, G. & Pinder, C. (2005). Work motivation theory and research at the dawn of the
twenty-first century. Annual Review of Psychology, 56, 485–516
Latham, G.P (2007). Work motivation. Thousands of Oaks: sage Publications.
Lindenberg, S. (2001), Intrinsic motivation in a new light. Kyklos, 54: 317–342.
Locke, E. (1976). The nature and causes of job satisfaction. Chicago: Rand Mcnally.
Locke, E.A. & Latham, G.P. (1990). A theory of goal setting and task performance.
Englewood Cliffs, NJ: Prentice-Hall
Locker, E. A & Latham, G.P. (2004). What should we do about motivation theory? Six
recommendations for the 21st century. Academy of management review, 29(3), 388-
483.
Luthans, F. (1998). Organizational behavior. 8th ed. Boston: Irwin McGraw-Hill.
Manville, B & Ober, J. (2003). Beyond empowerment: Building a company of citizens.
Harvard Business Reviews, 81(1), 48-53.
Manville, B. and Ober, J. (2003). Beyond empowerment: Building a company of citizens.
Harvard Business Reviews, 81: 48-53
Meyers, L. (2007). Social relationships matter in job satisfaction. Journal of Applied
Psychology, 38: 14.
Miner, J.B., Ebrahimi, B., and Wachtel, J.M. (1995). How deficiency in management contributes
to the United States' competiveness problem and what can be done about it? Human
Resource Management. Fall, p. 363.

62
Morris, J. R (2009). Employee work Motivation and discretionary work effort. Thesis,
presented at Brisbane School of Business. PhD
Mugenda, O., & Mugenda, A. (2003). Research Methods: Quantitative and qualitative
approaches. Nairobi
Mustafa, G. (2011). Research Methods. London: Prentice Hall.
Olajide, A. (2000). Getting the best out of the employees in a developing economy. A Personnel
Psychology Guest Lecture Series. Department of Guidance and Counseling. University
of Ibadan, Nigeria.
Pinder, C. C. (2008). Work motivation in organizational behavior (2nd edition). New York:
Psychology Press
Ritter, J.A. and Anker, R. (2002). Good Jobs, bad jobs: Workers evaluation in five countries.
International labor review, 141: 332-339
Ryan, R. M. & Deci, E. L. (2000). Self-determination theory and the facilitation of intrinsic
motivation, social development, and well-being. American Psychologist, 55, 68-78
Shirom, A, (2003). Feeling Vigorous at Work? The Construct of Vigor and the Study of Positive
affect in Organizations. Research in Organizational Stress and Well-Being, 3:135-165.
Spreitzer, G., Sutcliffe, K., Dutton, J., Sonenshein, S. and Grant, A.M. (2005). A socially
embedded model of thriving at work. Organization Science, 16: 537-549.
Steers, R.M., Mowdays, R.T., & Shapiro, D.L. (2004). The future of work motivation theory.
Academy of management review, 29(3), 379-387).
Stredwick, J. (2005). Introduction to Human Resource Management (1st ed). Oxford, United
Kingdom: Elsevier Butterworth-Heinemann.
Vallerand R.J. (2000). Deci and Ryan self-determination theory: a view from the hierarchical
model of intrinsic and extrinsic motivation. Psychological Inquiry, 11:312–18.
Vroom, V. H. (1964). Work Motivation. New York: John Wiley and Sons.

63
Wasko, M.M and Faraj, S. (2005). Why should I share? Examining social capital and knowledge
contribution in electronic networks of practice. Management Information Systems
Quarterly, 29: 35–57.
West, M. and Anderson, N. (1996). Innovation in top management teams. Journal of Applied
Psychology, 81, 680–693.

64
APPENDICES
Appendix I: Letter of Transmittal
Dear Respondent.
I am a student at the University of Nairobi undertaking a course in Masters in Project Planning
and Management I am conducting a research on “The influence of Extrinsic factors on
employees’ motivation: A case of cabin crew at Kenya Airways Limited”.
I kindly ask you to complete the questionnaire to help me collect the data.
Your information alongside other respondents was be used strictly for academic purpose and
your identity was be treated with confidentiality. You do not need to write your name on the
questionnaire.
I thank you in advance
Thank you.
Sign. _______________
Name: Dennis Mwilitya
Reg No: L50/68903/2013

65
Appendix II: Questionnaire
SECTION A: BIO-DATA
Instructions: Kindly tick (√) or write your answer in the space provided
1- Gender: ⬜ Male ⬜ Female
2- Age: ⬜ 18 -24 ⬜ 25 – 34 ⬜ 35 – 44 ⬜ 45 – 54 ⬜ 55 and above
3- Marital Status: ⬜ Single ⬜ Married ⬜ Divorced / widow
4- Educational Level:
⬜ High school
⬜ Diploma
⬜ Bachelor’s degree
SECTION B: ECONOMIC FACTORS
5 Kindly provide your response to the following economic factors on the level on which
they influence your motivation (Kindly tick (√) in the space provided).
No. Questions Very
High High Neutral Low
Very
Low
1 The salary/wage is equitable to my work out put
2 I receive fair allowances
3 The pay policies are satisfactory
4 The vacation policy is fabulous
5 Benefits are given to best employees
6 I am very motivated as an employee
6 State any other economic factor that is able to motivate you as an employee at Kenya Airways.
a. _________________________________________________________________
b. __________________________________________________________________
c. __________________________________________________________________
d. __________________________________________________________________
e. __________________________________________________________________

66
SECTION C: SOCIAL FACTORS
7 Kindly provide your response to the following social factors on the level on which they
influence your motivation (Kindly tick (√) in the space provided).
No. Questions Very
High High Neutral Low
Very
Low
1 I am allowed to join unions
2 Kenya airways provide support services such as
counseling
3 Promotion is on competitive basis
4 Company appreciates our services
5 I am in good terms with my colleagues at Kenya
airways
6
8 State any other social factor that is able to motivate you as an employee at Kenya Airways.
a. _________________________________________________________________
b. __________________________________________________________________
c. __________________________________________________________________
d. __________________________________________________________________
e. __________________________________________________________________
SECTION D: ENVIRONMENTAL FACTORS
9 Kindly provide your response to the following environmental factors on the level on which
they influence your motivation (Kindly tick (√) in the space provided).

67
No. Questions Very
High High Neutral Low
Very
Low
1 There is team work spirit at Kenya airways
2 Work life is of high quality.
3 There is commitment and engagement by
management
4 Facilities are adequate for all staff.
5 Organizational structure is clear and specified.
6 Supervisor offer support needed to employees
10 State any other environmental factor that is able to motivate you as an employee at Kenya
Airways.
a. _________________________________________________________________
b. __________________________________________________________________
c. __________________________________________________________________
d. __________________________________________________________________
e. __________________________________________________________________
SECTION E: LEVEL OF MOTIVATION
No. Questions Very
High High Neutral Low
Very
Low
1 What is the level of productivity
2 What is the level of performance
3 What is the level of punctuality
4 What is the level of discipline
5 What is the level of team work
6 What is the level of absenteeism

68
11 State any other factor that serves as a challenge to your motivation as an employee at
Kenya Airways.
a. _________________________________________________________________
b. __________________________________________________________________
c. _________________________________________________________________
d. _________________________________________________________________
e. __________________________________________________________________

69
Appendix III: Summary Data on Motivational factors
Section B: ECONOMIC FACTORS
Questions Very
High
High Neutral Low Very
Low
1 The salary/wage is equitable to my work out
put
5.26 12.63 6.32 51.58 24.21
2 I receive fair allowances 7.37 17.89 9.47 40.00 25.26
3 The pay policies are satisfactory 8.42 13.68 21.05 46.32 10.53
4 The vacation policy is fabulous 21.05 20.00 44.21 4.21 10.53
5 Benefits are given to best employees 2.11 5.26 8.42 63.16 21.05
6 I am very motivated as an employee 3.16 4.21 8.42 10.53 73.68
Section C: SOCIAL FACTORS
1 I am allowed to join unions 31.58 0.00 0.00 0.00 68.42
2 Kenya airways provide good support services
such as counseling
10.53 26.32 15.79 34.74 12.63
3 Promotion is on competitive basis 3.16 5.26 7.37 36.84 47.37
4 Company appreciates our services 21.05 20.00 24.21 13.68 21.05
5 I am in good terms with my colleagues at Kenya
airways
63.16 12.63 4.21 15.79 4.21
Section D: ENVIRONMENTAL FACTORS
1 There is team work spirit at Kenya airways 2.11 17.89 42.11 5.26 42.11
2 Work life is of high quality 5.26 27.37 20.00 12.63 34.74
3 There is commitment and engagement by
management
0.00 2.11 5.26 42.11 50.53
4 Facilities are adequate for all staff. 3.16 7.37 30.53 22.11 36.84
5 Organizational structure is clear and specified. 10.53 20.00 27.37 40.00 2.11

70
6 Supervisor offer support needed to employees 31.58 30.53 31.58 0.00 6.32
Section E: LEVEL OF MOTIVATION
1 What is the level of productivity 2.11 16.84 46.32 34.74 10.53
2 What is the level of performance 8.42 16.84 23.16 42.11 9.47
3 What is the level of punctuality 37.89 18.95 25.26 7.37 10.53
4 What is the level of discipline 21.05 28.42 4.21 4.21 42.11
5 What is the level of team work 4.21 22.11 20.00 29.47 24.21
6 What is the level of absenteeism 26.32 27.37 15.79 20.00 10.53