Influence of Edentulous Conditions on Intraoral Scanning ...
16
applied sciences Article Influence of Edentulous Conditions on Intraoral Scanning Accuracy of Virtual Interocclusal Record in Quadrant Scan Ye-Chan Lee 1,† , Jong-Eun Kim 1,† , Na-Eun Nam 2 , Seung-Ho Shin 2 , Jung-Hwa Lim 2 , Keun-Woo Lee 3 and June-Sung Shim 1, * Citation: Lee, Y.-C.; Kim, J.-E.; Nam, N.-E.; Shin, S.-H.; Lim, J.-H.; Lee, K.-W.; Shim, J.-S. Influence of Edentulous Conditions on Intraoral Scanning Accuracy of Virtual Interocclusal Record in Quadrant Scan. Appl. Sci. 2021, 11, 1489. https://doi.org/10.3390/app11041489 Academic Editor: Yong-Deok Kim Received: 27 January 2021 Accepted: 4 February 2021 Published: 6 February 2021 Publisher’s Note: MDPI stays neutral with regard to jurisdictional claims in published maps and institutional affil- iations. Copyright: © 2021 by the authors. Licensee MDPI, Basel, Switzerland. This article is an open access article distributed under the terms and conditions of the Creative Commons Attribution (CC BY) license (https:// creativecommons.org/licenses/by/ 4.0/). 1 Department of Prosthodontics, College of Dentistry, Yonsei University, Yonsei-ro 50-1, Seodaemun-gu, Seoul 03722, Korea; [email protected] (Y.-C.L.); [email protected] (J.-E.K.) 2 Department of Prosthodontics, Oral Research Science Center, BK21 PLUS Project, College of Dentistry, Yonsei University, Yonsei-ro 50-1, Seodaemun-gu, Seoul 03722, Korea; [email protected] (N.-E.N.); [email protected] (S.-H.S.); [email protected] (J.-H.L.) 3 Veterans Health Service Medical Center, Department of Prosthodontics, 53 Jinhwangdo-ro 61-gil, Gangdong-gu, Seoul 05368, Korea; [email protected] * Correspondence: [email protected]; Tel.: +82-2-2228-3157 † These authors contributed equally to this work as first authors. Abstract: Reproduction of the exact interocclusal relationship using digital workflow is crucial for precise fabrication of accurate prostheses. Intraoral scanner is known to be valid for the measurement of quadrants, however, the role of missing area in the quadrant scan on the virtual interocclusal record (VIR) is uncertain. This study aimed to evaluate the accuracy of VIR in quadrant scans using an intraoral scanner (IOS) under four different edentulous conditions. Eight scans per group were obtained using a laboratory scanner and three IOSs (Trios3, CS3600, i500). Based on trueness and precision, Trios3 had the best results, followed by CS3600 and i500. The trueness and precision were affected by edentulous conditions. The three IOSs showed deviation in the posterior region during assessment of VIR for the missing area with posterior support. CS3600 and i500 showed deviation in the short-span edentulous area without support. In extended edentulous condition without support, Trios3 showed overclosure, while i500 showed an angular deviation. In some groups scanned with Trios3 and i500, the tilting effect was observed. Based on the edentulous condition and type of IOS used, local or general deviations in occlusion were seen. The accuracy of VIR was dependent on accurate scan data. Thus, registration of the occlusal relationship in an edentulous area with more than two missing teeth using IOSs may be clinically more inaccurate than that with a laboratory scanner. Keywords: intraoral scanners; virtual interocclusal record; digital dentistry; quadrant scan; CAD/CAM 1. Introduction Advances in computer-aided design/computer-aided manufacturing (CAD/CAM) technology have replaced many conventional techniques for dental prostheses fabrica- tion [1,2]. The intraoral scanner (IOS) system has particularly enhanced the impression procedure. Using IOSs, a digital image of the dental arch can be obtained by acquiring a digital impression directly in the mouth, without a tray or impression material, which are needed in conventional techniques [3,4]. The IOS is an important system in the digital workflow using CAD/CAM technology and has undergone continuous advancement in recent years. The current IOS system is used for the fabrication of most prosthetic restorations, such as inlays/onlays, copings and frameworks, single crowns, and fixed partial dentures [5]. However, for the fabrication of a long-span prosthesis, the impression obtained by the IOS system is not as accurate as that by the conventional technique [6]. In other words, when scanning a long-span arch using an IOS, errors in stitching images could occur; thus, conventional impression methods are still required [7]. Appl. Sci. 2021, 11, 1489. https://doi.org/10.3390/app11041489 https://www.mdpi.com/journal/applsci
Transcript of Influence of Edentulous Conditions on Intraoral Scanning ...

applied sciences
Article
Influence of Edentulous Conditions on Intraoral ScanningAccuracy of Virtual Interocclusal Record in Quadrant Scan
Ye-Chan Lee 1,† , Jong-Eun Kim 1,† , Na-Eun Nam 2, Seung-Ho Shin 2 , Jung-Hwa Lim 2, Keun-Woo Lee 3 andJune-Sung Shim 1,*
�����������������
Citation: Lee, Y.-C.; Kim, J.-E.; Nam,
N.-E.; Shin, S.-H.; Lim, J.-H.; Lee,
K.-W.; Shim, J.-S. Influence of
Edentulous Conditions on Intraoral
Scanning Accuracy of Virtual
Interocclusal Record in Quadrant
Scan. Appl. Sci. 2021, 11, 1489.
https://doi.org/10.3390/app11041489
Academic Editor: Yong-Deok Kim
Received: 27 January 2021
Accepted: 4 February 2021
Published: 6 February 2021
Publisher’s Note: MDPI stays neutral
with regard to jurisdictional claims in
published maps and institutional affil-
iations.
Copyright: © 2021 by the authors.
Licensee MDPI, Basel, Switzerland.
This article is an open access article
distributed under the terms and
conditions of the Creative Commons
Attribution (CC BY) license (https://
creativecommons.org/licenses/by/
4.0/).
1 Department of Prosthodontics, College of Dentistry, Yonsei University, Yonsei-ro 50-1, Seodaemun-gu,Seoul 03722, Korea; [email protected] (Y.-C.L.); [email protected] (J.-E.K.)
2 Department of Prosthodontics, Oral Research Science Center, BK21 PLUS Project, College of Dentistry, YonseiUniversity, Yonsei-ro 50-1, Seodaemun-gu, Seoul 03722, Korea; [email protected] (N.-E.N.);[email protected] (S.-H.S.); [email protected] (J.-H.L.)
3 Veterans Health Service Medical Center, Department of Prosthodontics, 53 Jinhwangdo-ro 61-gil,Gangdong-gu, Seoul 05368, Korea; [email protected]
* Correspondence: [email protected]; Tel.: +82-2-2228-3157† These authors contributed equally to this work as first authors.
Abstract: Reproduction of the exact interocclusal relationship using digital workflow is crucial forprecise fabrication of accurate prostheses. Intraoral scanner is known to be valid for the measurementof quadrants, however, the role of missing area in the quadrant scan on the virtual interocclusalrecord (VIR) is uncertain. This study aimed to evaluate the accuracy of VIR in quadrant scans usingan intraoral scanner (IOS) under four different edentulous conditions. Eight scans per group wereobtained using a laboratory scanner and three IOSs (Trios3, CS3600, i500). Based on trueness andprecision, Trios3 had the best results, followed by CS3600 and i500. The trueness and precision wereaffected by edentulous conditions. The three IOSs showed deviation in the posterior region duringassessment of VIR for the missing area with posterior support. CS3600 and i500 showed deviation inthe short-span edentulous area without support. In extended edentulous condition without support,Trios3 showed overclosure, while i500 showed an angular deviation. In some groups scanned withTrios3 and i500, the tilting effect was observed. Based on the edentulous condition and type of IOSused, local or general deviations in occlusion were seen. The accuracy of VIR was dependent onaccurate scan data. Thus, registration of the occlusal relationship in an edentulous area with morethan two missing teeth using IOSs may be clinically more inaccurate than that with a laboratoryscanner.
Keywords: intraoral scanners; virtual interocclusal record; digital dentistry; quadrant scan; CAD/CAM
1. Introduction
Advances in computer-aided design/computer-aided manufacturing (CAD/CAM)technology have replaced many conventional techniques for dental prostheses fabrica-tion [1,2]. The intraoral scanner (IOS) system has particularly enhanced the impressionprocedure. Using IOSs, a digital image of the dental arch can be obtained by acquiring adigital impression directly in the mouth, without a tray or impression material, which areneeded in conventional techniques [3,4].
The IOS is an important system in the digital workflow using CAD/CAM technologyand has undergone continuous advancement in recent years. The current IOS system isused for the fabrication of most prosthetic restorations, such as inlays/onlays, copings andframeworks, single crowns, and fixed partial dentures [5]. However, for the fabrication of along-span prosthesis, the impression obtained by the IOS system is not as accurate as thatby the conventional technique [6]. In other words, when scanning a long-span arch usingan IOS, errors in stitching images could occur; thus, conventional impression methods arestill required [7].
Appl. Sci. 2021, 11, 1489. https://doi.org/10.3390/app11041489 https://www.mdpi.com/journal/applsci

Appl. Sci. 2021, 11, 1489 2 of 16
As in the conventional technique, in addition to obtaining an accurate impression, thereproduction of an accurate interocclusal relationship is important for the fabrication ofan accurate prostheses through digital workflow using IOSs [8]. Buccal bite registration isused in most IOS systems to obtain the virtual interocclusal record (VIR) of the maxillaryand mandibular arches. This method is defined as intraoral digital scans capturing thebuccal surface of approximately three teeth of both arches in maximum intercuspation [9].Using the software matching process of each IOS system, both buccal scan images andintraoral scans of the maxillary and mandibular arch are automatically aligned [10]. Severalstudies have been conducted to evaluate the accuracy of IOSs in VIRs. When the buccalbite registration method is used to align the full-arch scans, there could be interarch andinterocclusal distortion [1]. Alteration of occlusal contact points could occur more in thecomplete arch scan than in the quadrant arch scan [11]. In addition, the deviations ofocclusal contact points are higher in the posterior teeth than in the other regions of thearch [12]. The span and location of the edentulous area in the full arch model could alsoaffect the dimensional accuracy of a VIR [13]. In several studies, a high level of accuracywas found only in the VIR of a single missing posterior tooth group [13,14]. To obtain amore accurate occlusal record in the full-arch scan, a combination of the recording areas,such as the combination of the right and the left lateral sections, is suggested [15].
The majority of previous studies regarding the accuracy of VIR were conducted underthe full-arch scan models [5,7,16]. It is relatively hard to assess the influence of edentulousconditions on VIR due to the distortions in full-arch scan data itself. Therefore, clinically,current research recommended that most restorations such as single crown and short-spanfixed partial denture (FPD) are fabricated on the digital working model generated fromquadrant scan [5]. Moreover, to date, it is not recommended to use full-arch impressionsobtained by IOS in fabrications of FPD [5,14]. However, there is rare information aboutthe accuracy of VIR from quadrant scans under various edentulous conditions. AlthoughZimmermann et al. studied the accuracy of VIRs in quadrant scans by various IOSs [9]and Ren et al. studied the accuracy of VIRs in full-arch scans of different edentulousconditions [13], to the best of our knowledge, no study has evaluated the accuracy of VIRsin quadrant scans under varying partial edentulous conditions. Moreover, it is uncertainhow the span and location of the edentulous area in the quadrant scan affect the accuracyof VIRs.
The purpose of this in vitro study was to evaluate the accuracy of VIRs of quadrantscans with different spans and locations of edentulous areas using three IOS systems.The first null hypothesis was that there is no difference between the laboratory scannerand IOSs in the accuracy of a VIR in the quadrant scan. The second null hypothesis wasthat there is no difference in the accuracy of a VIR in the quadrant scan according to theedentulous condition.
2. Materials and Methods2.1. Design of the Study
The workflow of this in vitro study was described in Figure 1. To prepare the experi-mental model, a laboratory scanner (T500; MEDIT Corp, Seoul, Korea) was used to scanthe maxillary and mandibular arches of a completely dentate typodont (D85DP-500B.1;Nissin Dental, Kyoto, Japan). Thereafter, Standard tessellation language (STL) files of thescan were exported.

Appl. Sci. 2021, 11, 1489 3 of 16Appl. Sci. 2021, 11, x FOR PEER REVIEW 3 of 15
Figure 1. Workflow of the study. FPS: Full Posterior Support; PPS: Partial Posterior Support;
SSDEB: Short Span Distal Extension Base; LSDEB: Long Span Distal Extension Base; VIR: Virtual
Interocclusal Record.
To mark the interarch reference points on the experimental model, the STL file was
loaded on the computer-aided design (CAD) software (Meshmixer 3.3, Autodesk Inc., San
Rafael, CA, USA), and a 1.5 mm diameter hemisphere mesh was added below the mid-
cervical area of each tooth from the maxillary right central incisor to the maxillary right
second molar. From the mandibular right central incisor to the right second molar, the
reference point was similarly added at a position corresponding to the maxillary reference
point.
Thereafter, the STL files of the maxillary and mandibular casts to which reference
points were added were duplicated in four sets. To prepare different spans and locations
of the partially edentulous conditions for the experimental models, each duplicated ex-
perimental model was modified on the CAD program as shown in Figure 2: group FPS
(Full Posterior Support): complete dentate arch; group PPS (Partial Posterior Support):
right first premolar, second premolar, and first molar missing; group SSDEB (Short Span
Distal Extension Base): right first molar and second molar missing; group LSDEB (Long
Span Distal Extension Base): right first premolar, second premolar, first molar, and second
molar missing.
Figure 1. Workflow of the study. FPS: Full Posterior Support; PPS: Partial Posterior Support; SSDEB:Short Span Distal Extension Base; LSDEB: Long Span Distal Extension Base; VIR: Virtual InterocclusalRecord.
To mark the interarch reference points on the experimental model, the STL file wasloaded on the computer-aided design (CAD) software (Meshmixer 3.3, Autodesk Inc.,San Rafael, CA, USA), and a 1.5 mm diameter hemisphere mesh was added below themid-cervical area of each tooth from the maxillary right central incisor to the maxillaryright second molar. From the mandibular right central incisor to the right second molar, thereference point was similarly added at a position corresponding to the maxillary referencepoint.
Thereafter, the STL files of the maxillary and mandibular casts to which referencepoints were added were duplicated in four sets. To prepare different spans and locations ofthe partially edentulous conditions for the experimental models, each duplicated experi-mental model was modified on the CAD program as shown in Figure 2: group FPS (FullPosterior Support): complete dentate arch; group PPS (Partial Posterior Support): rightfirst premolar, second premolar, and first molar missing; group SSDEB (Short Span DistalExtension Base): right first molar and second molar missing; group LSDEB (Long SpanDistal Extension Base): right first premolar, second premolar, first molar, and second molarmissing.
After the modification was completed, four different experimental models were im-ported to the stereolithography (SLA) type 3D printer (Form2; Formlabs Co., Somerville,MA, USA). Using photopolymerized resin (Standard resin grey color; Formlabs Co.,Somerville, MA, USA), the model was printed with 100 µm thickness. The post-processand curing processes followed the manufacturer’s application guide. Four groups of 3Dprinted models were mounted on a non-adjustable articulator. Each printed experimentalmodel was digitized eight times using a laboratory scanner (T500) and three types of IOSs(Trios 3 wireless; 3shape A/S, Copenhagen, Denmark, CS3600; Carestream Dental LLC,Atlanta, GA, USA, i500; Medit Corp, Seoul, Korea) (Table 1). The sample size (n = 8) wascalculated based on the results of Ren et al. [13] using G*Power 3.1. In case of IOSs, themaxillary and mandibular right quadrant arches of each experimental model were scannedand the VIR was obtained. Scan and VIR procedures were performed according to the

Appl. Sci. 2021, 11, 1489 4 of 16
manufacturer’s instructions. The intraoral scanning order for each experimental group wasdone in randomization. As each model had a different partially edentulous condition, atleast more than three maxillary and mandibular teeth close to the edentulous area wereused to make the VIR. The maxillary and mandibular scans were aligned using the VIRwith the IOS scan software. All datasets of the scan data were exported as STL files.
Appl. Sci. 2021, 11, x FOR PEER REVIEW 4 of 15
Figure 2. Experimental model. (A) FPS: Full Posterior Support, (B) PPS: Partial Posterior Support,
(C) SSDEB: Short Span Distal Extension Base, (D) LSDEB: Long Span Distal Extension Base.
After the modification was completed, four different experimental models were im-
ported to the stereolithography (SLA) type 3D printer (Form2; Formlabs Co., Somerville,
MA, USA). Using photopolymerized resin (Standard resin grey color; Formlabs Co., Som-
erville, MA, USA), the model was printed with 100 µm thickness. The post-process and
curing processes followed the manufacturer’s application guide. Four groups of 3D
printed models were mounted on a non-adjustable articulator. Each printed experimental
model was digitized eight times using a laboratory scanner (T500) and three types of IOSs
(Trios 3 wireless; 3shape A/S, Copenhagen, Denmark, CS3600; Carestream Dental LLC,
Atlanta, GA, USA, i500; Medit Corp, Seoul, Korea) (Table 1). The sample size (n = 8) was
calculated based on the results of Ren et al. [13] using G*Power 3.1. In case of IOSs, the
maxillary and mandibular right quadrant arches of each experimental model were
scanned and the VIR was obtained. Scan and VIR procedures were performed according
to the manufacturer’s instructions. The intraoral scanning order for each experimental
group was done in randomization. As each model had a different partially edentulous
condition, at least more than three maxillary and mandibular teeth close to the edentulous
area were used to make the VIR. The maxillary and mandibular scans were aligned using
the VIR with the IOS scan software. All datasets of the scan data were exported as STL
files.
Table 1. Various scanners used in this study.
Type Producer Acquisition Method Powder Color
T500® Laboratory
scanner Medit Corp, Seoul, Korea
Phase-shifting optical triangulation with Blue
light scanning technology™ No Yes
Trios3 wire-
less®
Intraoral scan-
ner
3shape A/S, Copenhagen, Den-
mark
Structured light-Confocal microscopy and Ul-
trafast optical scanning™ No Yes
CS3600® Intraoral scan-
ner
Carestream Dental LLC, At-
lanta, GA, USA Structured light-Active speed 3d video™ No Yes
I500® Intraoral scan-
ner Medit Corp, Seoul, Korea
3D-in-motion video technology™ and rapid
video-based scan No Yes
2.2. Trueness and Precision
To assess the distortion of the scan dataset, a three-dimensional analysis software
(Geomagic Control X 64; 3D systems, Rock Hill, SC, USA) was used. All STL datasets from
the four experimental models were analyzed using a three-dimensional (3D) and two-
dimensional (2D) analysis tool. To assess trueness, one scan data was randomly selected
Figure 2. Experimental model. (A) FPS: Full Posterior Support, (B) PPS: Partial Posterior Support, (C) SSDEB: Short SpanDistal Extension Base, (D) LSDEB: Long Span Distal Extension Base.
Table 1. Various scanners used in this study.
Type Producer Acquisition Method Powder Color
T500® Laboratoryscanner
Medit Corp,Seoul, Korea
Phase-shifting opticaltriangulation with Blue light
scanning technology™No Yes
Trios3wireless®
Intraoralscanner
3shape A/S,Copenhagen,
Denmark
Structured light-Confocalmicroscopy and Ultrafast
optical scanning™No Yes
CS3600® Intraoralscanner
CarestreamDental LLC,Atlanta, GA,
USA
Structured light-Activespeed 3d video™ No Yes
I500® Intraoralscanner
Medit Corp,Seoul, Korea
3D-in-motion videotechnology™ and rapid
video-based scanNo Yes
2.2. Trueness and Precision
To assess the distortion of the scan dataset, a three-dimensional analysis software(Geomagic Control X 64; 3D systems, Rock Hill, SC, USA) was used. All STL datasetsfrom the four experimental models were analyzed using a three-dimensional (3D) and two-dimensional (2D) analysis tool. To assess trueness, one scan data was randomly selected asreference data among the datasets of the laboratory scanner. By using the best-fit algorithm,the other datasets of each group from each intraoral scanner were superimposed on thereference data. Using 3D analysis, the root mean square (RMS) value between the referencedata and the datasets from three IOSs was calculated for trueness. To analyze precision, apairwise comparison was conducted between the datasets from the same scanner and the

Appl. Sci. 2021, 11, 1489 5 of 16
same experimental model. The RMS value between datasets belonging to the same groupof each scanner was calculated for precision.
2.3. Linear Measurement
To evaluate the accuracy of the VIR, the distance of the interarch markers in fivepositions on all datasets of the four experimental models was measured using 2D analysistool (Figure 3). In measured-distance data from the datasets of the laboratory scanner, onedataset from each experimental model was randomly selected as reference data for theinterarch marker distance. In this study, the difference of interarch marker was definedas subtracting the reference data from the measured data. Both signed and unsigneddifferences of the interarch marker were calculated.
Appl. Sci. 2021, 11, x FOR PEER REVIEW 5 of 15
as reference data among the datasets of the laboratory scanner. By using the best-fit algo-
rithm, the other datasets of each group from each intraoral scanner were superimposed
on the reference data. Using 3D analysis, the root mean square (RMS) value between the
reference data and the datasets from three IOSs was calculated for trueness. To analyze
precision, a pairwise comparison was conducted between the datasets from the same
scanner and the same experimental model. The RMS value between datasets belonging to
the same group of each scanner was calculated for precision.
2.3. Linear Measurement
To evaluate the accuracy of the VIR, the distance of the interarch markers in five po-
sitions on all datasets of the four experimental models was measured using 2D analysis
tool (Figure 3). In measured-distance data from the datasets of the laboratory scanner, one
dataset from each experimental model was randomly selected as reference data for the
interarch marker distance. In this study, the difference of interarch marker was defined as
subtracting the reference data from the measured data. Both signed and unsigned differ-
ences of the interarch marker were calculated.
Figure 3. Measuring the linear distance of the interarch marker using the surface matching soft-
ware.
2.4. Statistical Analysis
Statistical analysis was performed using Statistical software (SPSS 23.0; IBM, Ar-
monk, NY, USA). In the Kolmogorov-Smirnov test, trueness, precision, signed, and un-
signed differences were not normally distributed (p < 0.05). Levene’s test was used to as-
sess the homogeneity of the variances (α = 0.05). A non-parametric test was used for anal-
ysis. The Kruskal-Wallis test was used to compare the trueness and precision by type of
scanner and edentulous conditions. Pairwise comparisons were used for post-hoc analy-
sis. Signed and unsigned differences in the interarch markers of the three IOSs were com-
pared with those of the laboratory scanner for intergroup comparison using a Mann-Whit-
ney U test. Intragroup comparison of the signed and unsigned differences of the interarch
markers on five positions was conducted using the Kruskal-Wallis test. Pairwise compar-
isons were used for post-hoc analysis. Significant levels of all analyses were set at 0.05. In
the Kruskal-Wallis test, Bonferroni adjustments were made for the comparison of trueness
and precision, and for the intragroup comparison of signed and unsigned differences.
Figure 3. Measuring the linear distance of the interarch marker using the surface matching software.
2.4. Statistical Analysis
Statistical analysis was performed using Statistical software (SPSS 23.0; IBM, Armonk,NY, USA). In the Kolmogorov-Smirnov test, trueness, precision, signed, and unsigneddifferences were not normally distributed (p < 0.05). Levene’s test was used to assess thehomogeneity of the variances (α = 0.05). A non-parametric test was used for analysis. TheKruskal-Wallis test was used to compare the trueness and precision by type of scannerand edentulous conditions. Pairwise comparisons were used for post-hoc analysis. Signedand unsigned differences in the interarch markers of the three IOSs were compared withthose of the laboratory scanner for intergroup comparison using a Mann-Whitney U test.Intragroup comparison of the signed and unsigned differences of the interarch markerson five positions was conducted using the Kruskal-Wallis test. Pairwise comparisonswere used for post-hoc analysis. Significant levels of all analyses were set at 0.05. In theKruskal-Wallis test, Bonferroni adjustments were made for the comparison of trueness andprecision, and for the intragroup comparison of signed and unsigned differences.
3. Results3.1. Trueness and Pricison
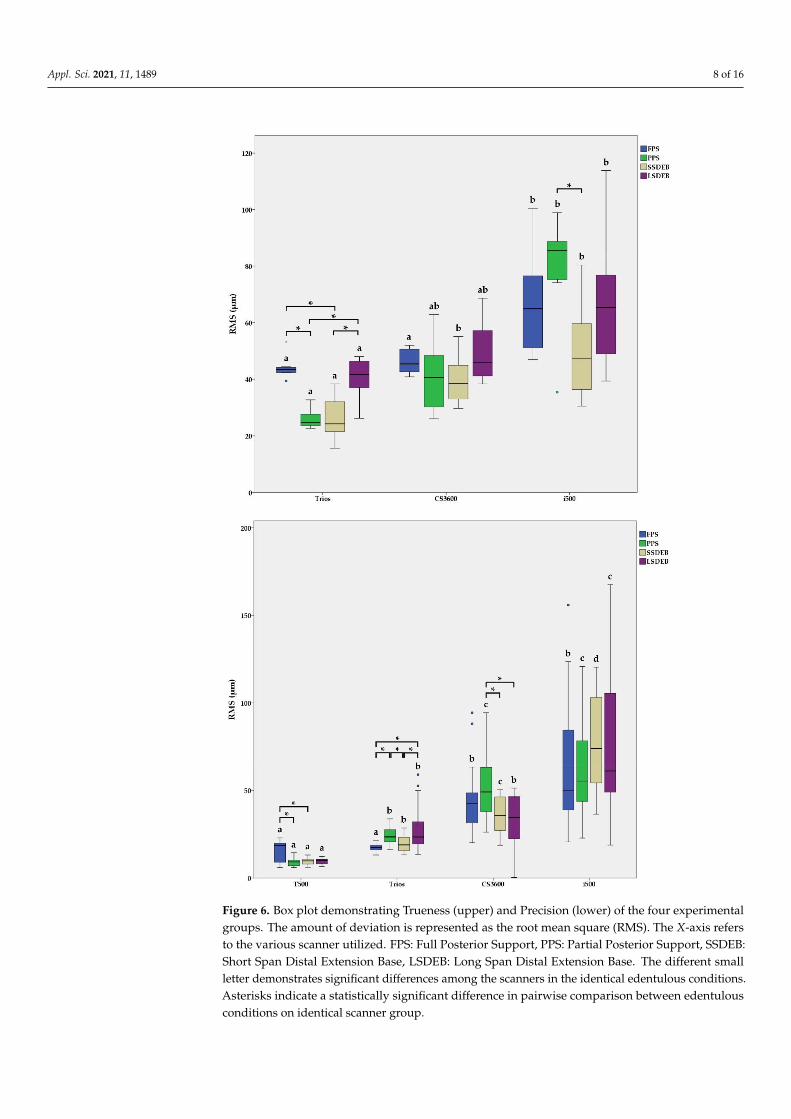
To evaluate the distortion of the quadrant scan images of the experimental model, thetrueness and precision of the four experimental groups were compared. The trueness shows

Appl. Sci. 2021, 11, 1489 6 of 16
different deviation according to edentulous conditions. In Trios, significant difference wasfounded by pairwise comparison in following groups: FPS vs. PPS, FPS vs. SSDEB, PPS vs.LSDEB, SSDEB vs. LSDEB. In case of CS 3600, there was no significant difference among theedentulous conditions. In i500, there was significant difference between PPS and SSDEB.
The result of trueness was different according to the scanner utilized. Trios had thebest trueness, followed by CS 3600 and i500. In the FPS group, Trios (median 43.4 µm) andCS 3600 (median 45.4 µm) were statistically truer than i500 (median 65.0 µm) (Figure 4). Inthe PPS group, Trios was statistically (median 24.6 µm) truer than i500 (median 85.5 µm).In the SSDEB and LSDEB groups, Trios (median 24.3 and 41.7 µm) was statistically truerthan CS3600 (median 38.4 and 45.8 µm) and i500 (median 47.5 and 65.4 µm).
Appl. Sci. 2021, 11, x FOR PEER REVIEW 6 of 15
3. Results
3.1. Trueness and Pricison
To evaluate the distortion of the quadrant scan images of the experimental model,
the trueness and precision of the four experimental groups were compared. The trueness
shows different deviation according to edentulous conditions. In Trios, significant differ-
ence was founded by pairwise comparison in following groups: FPS vs. PPS, FPS vs.
SSDEB, PPS vs. LSDEB, SSDEB vs. LSDEB. In case of CS 3600, there was no significant
difference among the edentulous conditions. In i500, there was significant difference be-
tween PPS and SSDEB.
The result of trueness was different according to the scanner utilized. Trios had the
best trueness, followed by CS 3600 and i500. In the FPS group, Trios (median 43.4 μm) and
CS 3600 (median 45.4 μm) were statistically truer than i500 (median 65.0 μm) (Figure 4).
In the PPS group, Trios was statistically (median 24.6 μm) truer than i500 (median 85.5
μm). In the SSDEB and LSDEB groups, Trios (median 24.3 and 41.7 μm) was statistically
truer than CS3600 (median 38.4 and 45.8 μm) and i500 (median 47.5 and 65.4 μm).
Figure 4. Representative images of a color map for assessing the trueness of the IOS. (A) Trios 3, (B) CS3600, (C) i500. Trios
shows a slight deviation on the occlusal surface. In CS3600, the minus deviation is observed in the central groove area. In
i500, the minus deviation is mainly located on the inclined plane of the cusp. In color map analysis, maximum range was
1.0 mm, minimum range was 1.0 mm and tolerance level was ±0.05 mm.
In case of the precision, a similar result was observed according to edentulous con-
ditions. In T500, FPS showed a significant difference in comparison with PPS and SSDEB.
In case of Trios, there was a significant difference in the following groups: FPS vs. PPS,
FPS vs. LSDEB, PPS vs. SSDEB, SSDEB vs. LSDEB. In CS3600, a significant difference was
shown in PPS vs. SSDEB and PPS vs. LSDEB. No significant difference was shown in i500.
Depending on the scanner utilized, T500 had the best precision, followed by Trios,
CS3600, and i500. In the FPS group, T500 (median 18.6 μm) and Trios (median 17.4 μm)
were statistically more precise than CS3600 (median 42.4 μm) and i500 (median 50.1 μm).
In the PPS group, T500 (median 9.2 μm) was statistically more precise than Trios (median
23.5 μm), CS3600 (median 49.2 μm), and i500 (median 55.3 μm) (Figure 5). Trios was sta-
tistically more precise than CS3600, i500. In the SSDEB group, T500 (median 9.8 μm) was
the most precise, followed by Trios (median 18.9 μm), CS3600 (median 35.6 μm), and i500
(median 73.9 μm). In the LSDEB group, T500 (median 1.7 μm) was statistically more pre-
cise than Trios (median 23.4 μm), CS3600 (median 34.6 μm), and i500 (median 61.1 μm).
Trios, CS3600, was statistically more precise than i500. The trueness and precision results
are summarized in Figure 6.
Figure 4. Representative images of a color map for assessing the trueness of the IOS. (A) Trios 3, (B) CS3600, (C) i500. Triosshows a slight deviation on the occlusal surface. In CS3600, the minus deviation is observed in the central groove area. Ini500, the minus deviation is mainly located on the inclined plane of the cusp. In color map analysis, maximum range was1.0 mm, minimum range was 1.0 mm and tolerance level was ±0.05 mm.
In case of the precision, a similar result was observed according to edentulous condi-tions. In T500, FPS showed a significant difference in comparison with PPS and SSDEB.In case of Trios, there was a significant difference in the following groups: FPS vs. PPS,FPS vs. LSDEB, PPS vs. SSDEB, SSDEB vs. LSDEB. In CS3600, a significant difference wasshown in PPS vs. SSDEB and PPS vs. LSDEB. No significant difference was shown in i500.
Depending on the scanner utilized, T500 had the best precision, followed by Trios,CS3600, and i500. In the FPS group, T500 (median 18.6 µm) and Trios (median 17.4 µm)were statistically more precise than CS3600 (median 42.4 µm) and i500 (median 50.1 µm).In the PPS group, T500 (median 9.2 µm) was statistically more precise than Trios (median23.5 µm), CS3600 (median 49.2 µm), and i500 (median 55.3 µm) (Figure 5). Trios wasstatistically more precise than CS3600, i500. In the SSDEB group, T500 (median 9.8 µm)was the most precise, followed by Trios (median 18.9 µm), CS3600 (median 35.6 µm), andi500 (median 73.9 µm). In the LSDEB group, T500 (median 1.7 µm) was statistically moreprecise than Trios (median 23.4 µm), CS3600 (median 34.6 µm), and i500 (median 61.1 µm).Trios, CS3600, was statistically more precise than i500. The trueness and precision resultsare summarized in Figure 6.
Appl. Sci. 2021, 11, 1489 7 of 16Appl. Sci. 2021, 11, x FOR PEER REVIEW 7 of 15
Figure 5. Representative images of a color map for assessing the precision of the laboratory scanner and IOS. (A) T500, (B)
Trios 3, (C) CS3600, (D) i500. In T500, there is almost no deviation. Trios shows a slight deviation on the occlusal surface.
In CS3600, the positive deviation is observed on the occlusal surface of the second molar. In i500, the positive deviation is
observed on the cingulum surface of the canine and the occlusal surface of the second molar. In color map analysis, max-
imum range was 1.0 mm, minimum range was 1.0 mm and tolerance level was ±0.05 mm.
3.2. Linear Measurement
To evaluate the accuracy of the VIR, both signed and unsigned differences between
the reference data and measured data in each pair of interarch marker positions were
compared. Signed differences are summarized in Table 2 and Figure 7. T500 showed al-
most no deviation or significant difference in any experimental group. For intergroup
comparison between same position interarch markers, Trios showed a relatively slight
deviation among the experimental groups. In the LSDEB groups of Trios, the (−) signed
difference of all positions was statistically lower compared to that of T500. Positions 6 and
7 of the PPS and position 3 of the SSDEB showed a statistically higher (+) signed difference
compared to T500. In the case of CS3600, only position 6 of SSDEB showed a statistically
higher (+) signed difference compared to T500. However, the interquartile range (IQR) of
the four groups was wider than that of the T500, especially in the PPS and SSDEB groups.
In addition, the IQR of PPS and SSDEB had an increased range toward the posterior posi-
tion. i500 showed global deviation in the four experimental groups. The signed differences
in all the positions of the experimental groups were significantly different. In SSDEB and
LSDEB, the signed difference tended to show an increased (-) signed difference in the pos-
terior positions.
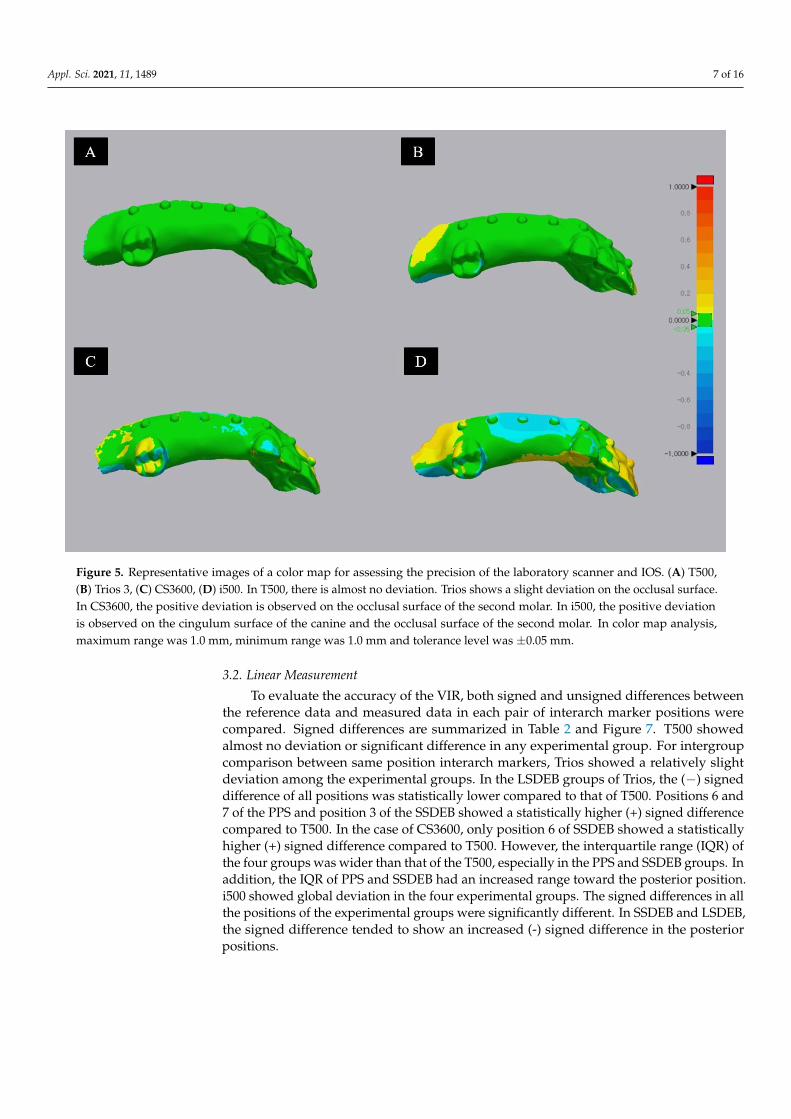
Figure 5. Representative images of a color map for assessing the precision of the laboratory scanner and IOS. (A) T500,(B) Trios 3, (C) CS3600, (D) i500. In T500, there is almost no deviation. Trios shows a slight deviation on the occlusal surface.In CS3600, the positive deviation is observed on the occlusal surface of the second molar. In i500, the positive deviationis observed on the cingulum surface of the canine and the occlusal surface of the second molar. In color map analysis,maximum range was 1.0 mm, minimum range was 1.0 mm and tolerance level was ±0.05 mm.
3.2. Linear Measurement
To evaluate the accuracy of the VIR, both signed and unsigned differences betweenthe reference data and measured data in each pair of interarch marker positions werecompared. Signed differences are summarized in Table 2 and Figure 7. T500 showedalmost no deviation or significant difference in any experimental group. For intergroupcomparison between same position interarch markers, Trios showed a relatively slightdeviation among the experimental groups. In the LSDEB groups of Trios, the (−) signeddifference of all positions was statistically lower compared to that of T500. Positions 6 and7 of the PPS and position 3 of the SSDEB showed a statistically higher (+) signed differencecompared to T500. In the case of CS3600, only position 6 of SSDEB showed a statisticallyhigher (+) signed difference compared to T500. However, the interquartile range (IQR) ofthe four groups was wider than that of the T500, especially in the PPS and SSDEB groups. Inaddition, the IQR of PPS and SSDEB had an increased range toward the posterior position.i500 showed global deviation in the four experimental groups. The signed differences in allthe positions of the experimental groups were significantly different. In SSDEB and LSDEB,the signed difference tended to show an increased (-) signed difference in the posteriorpositions.
Appl. Sci. 2021, 11, 1489 8 of 16Appl. Sci. 2021, 11, x FOR PEER REVIEW 8 of 15
Figure 6. Box plot demonstrating Trueness (upper) and Precision (lower) of the four experimental
groups. The amount of deviation is represented as the root mean square (RMS). The X-axis refers
to the various scanner utilized. FPS: Full Posterior Support, PPS: Partial Posterior Support, SSDEB:
Short Span Distal Extension Base, LSDEB: Long Span Distal Extension Base. The different small
letter demonstrates significant differences among the scanners in the identical edentulous condi-
tions. Asterisks indicate a statistically significant difference in pairwise comparison between eden-
tulous conditions on identical scanner group.
Figure 6. Box plot demonstrating Trueness (upper) and Precision (lower) of the four experimentalgroups. The amount of deviation is represented as the root mean square (RMS). The X-axis refersto the various scanner utilized. FPS: Full Posterior Support, PPS: Partial Posterior Support, SSDEB:Short Span Distal Extension Base, LSDEB: Long Span Distal Extension Base. The different smallletter demonstrates significant differences among the scanners in the identical edentulous conditions.Asterisks indicate a statistically significant difference in pairwise comparison between edentulousconditions on identical scanner group.
Appl. Sci. 2021, 11, 1489 9 of 16
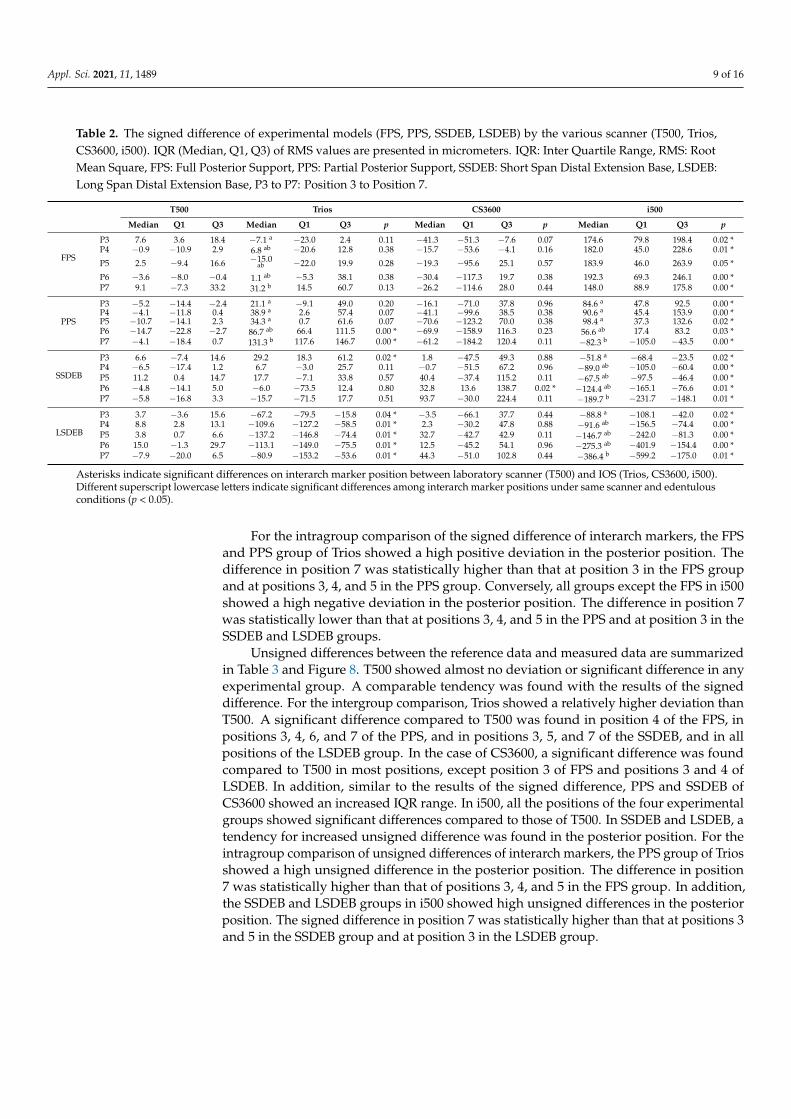
Table 2. The signed difference of experimental models (FPS, PPS, SSDEB, LSDEB) by the various scanner (T500, Trios,CS3600, i500). IQR (Median, Q1, Q3) of RMS values are presented in micrometers. IQR: Inter Quartile Range, RMS: RootMean Square, FPS: Full Posterior Support, PPS: Partial Posterior Support, SSDEB: Short Span Distal Extension Base, LSDEB:Long Span Distal Extension Base, P3 to P7: Position 3 to Position 7.
T500 Trios CS3600 i500
Median Q1 Q3 Median Q1 Q3 p Median Q1 Q3 p Median Q1 Q3 p
FPS
P3 7.6 3.6 18.4 −7.1 a −23.0 2.4 0.11 −41.3 −51.3 −7.6 0.07 174.6 79.8 198.4 0.02 *P4 −0.9 −10.9 2.9 6.8 ab −20.6 12.8 0.38 −15.7 −53.6 −4.1 0.16 182.0 45.0 228.6 0.01 *
P5 2.5 −9.4 16.6 −15.0ab −22.0 19.9 0.28 −19.3 −95.6 25.1 0.57 183.9 46.0 263.9 0.05 *
P6 −3.6 −8.0 −0.4 1.1 ab −5.3 38.1 0.38 −30.4 −117.3 19.7 0.38 192.3 69.3 246.1 0.00 *P7 9.1 −7.3 33.2 31.2 b 14.5 60.7 0.13 −26.2 −114.6 28.0 0.44 148.0 88.9 175.8 0.00 *
PPS
P3 −5.2 −14.4 −2.4 21.1 a −9.1 49.0 0.20 −16.1 −71.0 37.8 0.96 84.6 a 47.8 92.5 0.00 *P4 −4.1 −11.8 0.4 38.9 a 2.6 57.4 0.07 −41.1 −99.6 38.5 0.38 90.6 a 45.4 153.9 0.00 *P5 −10.7 −14.1 2.3 34.3 a 0.7 61.6 0.07 −70.6 −123.2 70.0 0.38 98.4 a 37.3 132.6 0.02 *P6 −14.7 −22.8 −2.7 86.7 ab 66.4 111.5 0.00 * −69.9 −158.9 116.3 0.23 56.6 ab 17.4 83.2 0.03 *P7 −4.1 −18.4 0.7 131.3 b 117.6 146.7 0.00 * −61.2 −184.2 120.4 0.11 −82.3 b −105.0 −43.5 0.00 *
SSDEB
P3 6.6 −7.4 14.6 29.2 18.3 61.2 0.02 * 1.8 −47.5 49.3 0.88 −51.8 a −68.4 −23.5 0.02 *P4 −6.5 −17.4 1.2 6.7 −3.0 25.7 0.11 −0.7 −51.5 67.2 0.96 −89.0 ab −105.0 −60.4 0.00 *P5 11.2 0.4 14.7 17.7 −7.1 33.8 0.57 40.4 −37.4 115.2 0.11 −67.5 ab −97.5 −46.4 0.00 *P6 −4.8 −14.1 5.0 −6.0 −73.5 12.4 0.80 32.8 13.6 138.7 0.02 * −124.4 ab −165.1 −76.6 0.01 *P7 −5.8 −16.8 3.3 −15.7 −71.5 17.7 0.51 93.7 −30.0 224.4 0.11 −189.7 b −231.7 −148.1 0.01 *
LSDEB
P3 3.7 −3.6 15.6 −67.2 −79.5 −15.8 0.04 * −3.5 −66.1 37.7 0.44 −88.8 a −108.1 −42.0 0.02 *P4 8.8 2.8 13.1 −109.6 −127.2 −58.5 0.01 * 2.3 −30.2 47.8 0.88 −91.6 ab −156.5 −74.4 0.00 *P5 3.8 0.7 6.6 −137.2 −146.8 −74.4 0.01 * 32.7 −42.7 42.9 0.11 −146.7 ab −242.0 −81.3 0.00 *P6 15.0 −1.3 29.7 −113.1 −149.0 −75.5 0.01 * 12.5 −45.2 54.1 0.96 −275.3 ab −401.9 −154.4 0.00 *P7 −7.9 −20.0 6.5 −80.9 −153.2 −53.6 0.01 * 44.3 −51.0 102.8 0.44 −386.4 b −599.2 −175.0 0.01 *
Asterisks indicate significant differences on interarch marker position between laboratory scanner (T500) and IOS (Trios, CS3600, i500).Different superscript lowercase letters indicate significant differences among interarch marker positions under same scanner and edentulousconditions (p < 0.05).
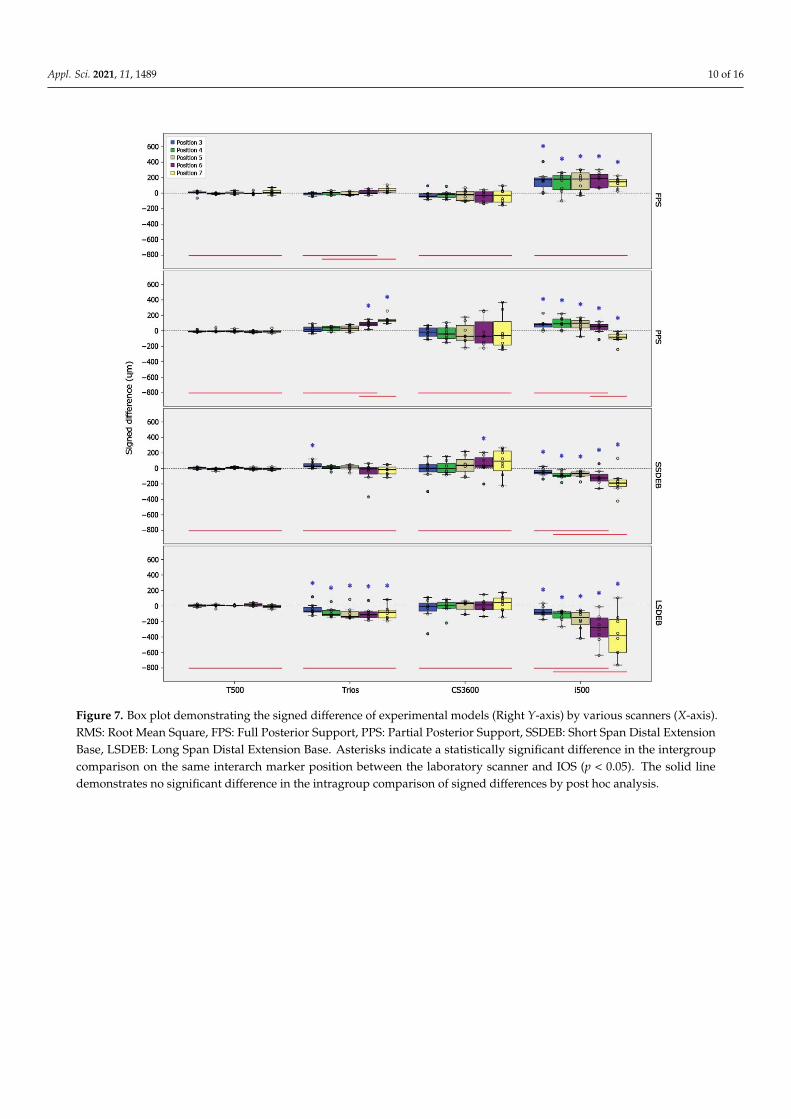
For the intragroup comparison of the signed difference of interarch markers, the FPSand PPS group of Trios showed a high positive deviation in the posterior position. Thedifference in position 7 was statistically higher than that at position 3 in the FPS groupand at positions 3, 4, and 5 in the PPS group. Conversely, all groups except the FPS in i500showed a high negative deviation in the posterior position. The difference in position 7was statistically lower than that at positions 3, 4, and 5 in the PPS and at position 3 in theSSDEB and LSDEB groups.
Unsigned differences between the reference data and measured data are summarizedin Table 3 and Figure 8. T500 showed almost no deviation or significant difference in anyexperimental group. A comparable tendency was found with the results of the signeddifference. For the intergroup comparison, Trios showed a relatively higher deviation thanT500. A significant difference compared to T500 was found in position 4 of the FPS, inpositions 3, 4, 6, and 7 of the PPS, and in positions 3, 5, and 7 of the SSDEB, and in allpositions of the LSDEB group. In the case of CS3600, a significant difference was foundcompared to T500 in most positions, except position 3 of FPS and positions 3 and 4 ofLSDEB. In addition, similar to the results of the signed difference, PPS and SSDEB ofCS3600 showed an increased IQR range. In i500, all the positions of the four experimentalgroups showed significant differences compared to those of T500. In SSDEB and LSDEB, atendency for increased unsigned difference was found in the posterior position. For theintragroup comparison of unsigned differences of interarch markers, the PPS group of Triosshowed a high unsigned difference in the posterior position. The difference in position7 was statistically higher than that of positions 3, 4, and 5 in the FPS group. In addition,the SSDEB and LSDEB groups in i500 showed high unsigned differences in the posteriorposition. The signed difference in position 7 was statistically higher than that at positions 3and 5 in the SSDEB group and at position 3 in the LSDEB group.
Appl. Sci. 2021, 11, 1489 10 of 16
Appl. Sci. 2021, 11, x FOR PEER REVIEW 10 of 15
tion, the SSDEB and LSDEB groups in i500 showed high unsigned differences in the pos-
terior position. The signed difference in position 7 was statistically higher than that at
positions 3 and 5 in the SSDEB group and at position 3 in the LSDEB group.
Figure 7. Box plot demonstrating the signed difference of experimental models (Right Y-axis) by various scanners (X-axis).
RMS: Root Mean Square, FPS: Full Posterior Support, PPS: Partial Posterior Support, SSDEB: Short Span Distal Extension
Base, LSDEB: Long Span Distal Extension Base. Asterisks indicate a statistically significant difference in the intergroup
comparison on the same interarch marker position between the laboratory scanner and IOS (p < 0.05). The solid line
demonstrates no significant difference in the intragroup comparison of signed differences by post hoc analysis.
Table 3. The unsigned difference of experimental models (FPS, PPS, SSDEB, LSDEB) by the various scanner (T500, Trios,
CS3600, i500). IQR (Median, Q1, Q3) of RMS values are presented in micrometers. IQR: Inter Quartile Range, RMS: Root
Mean Square, FPS: Full Posterior Support, PPS: Partial Posterior Support, SSDEB: Short Span Distal Extension Base,
LSDEB: Long Span Distal Extension Base, P3 to P7: Position 3 to Position 7.
T500 Trios CS3600 i500
Median Q1 Q3 Median Q1 Q3 p Median Q1 Q3 p Median Q1 Q3 p
FPS
P3 11.6 7.3 25.2 10.5 7.1 24.1 0.80 47.5 23.7 68.7 0.08 * 174.6 79.8 198.4 0.03 *
P4 4.4 2.3 10.9 15.5 8.2 27.1 0.02 * 31.1 14.8 72.1 0.01 * 182.0 82.0 228.6 0.00 *
P5 12.9 5.7 19.1 22.0 15.0 26.9 0.08 * 57.4 25.1 95.6 0.01 * 183.9 60.6 263.9 0.01 *
P6 4.9 2.1 15.1 15.7 4.8 38.1 0.23 42.5 22.3 117.3 0.00 * 192.3 69.3 246.1 0.00 *
Figure 7. Box plot demonstrating the signed difference of experimental models (Right Y-axis) by various scanners (X-axis).RMS: Root Mean Square, FPS: Full Posterior Support, PPS: Partial Posterior Support, SSDEB: Short Span Distal ExtensionBase, LSDEB: Long Span Distal Extension Base. Asterisks indicate a statistically significant difference in the intergroupcomparison on the same interarch marker position between the laboratory scanner and IOS (p < 0.05). The solid linedemonstrates no significant difference in the intragroup comparison of signed differences by post hoc analysis.

Appl. Sci. 2021, 11, 1489 11 of 16
Appl. Sci. 2021, 11, x FOR PEER REVIEW 11 of 15
P7 19.9 9.1 33.2 31.2 14.5 60.7 0.38 84.2 28.0 114.6 0.02 * 148.0 88.9 175.8 0.00 *
PPS
P3 8.1 4.9 18.2 37.0 a 9.1 49.0 0.04 * 47.1 35.7 81.1 0.00 * 84.6 47.8 92.5 0.02 *
P4 9.2 0.4 13.8 38.9 a 13.8 57.4 0.02 * 77.0 38.5 106.1 0.00 * 90.6 45.4 153.9 0.02 *
P5 13.4 6.6 16.6 35.8 a 10.6 61.6 0.11 123.2 70.6 154.1 0.00 * 98.8 63.4 132.6 0.00 *
P6 14.7 4.9 22.8 86.7 ab 66.4 111.5 0.00 * 158.9 69.9 236.6 0.00 * 59.2 48.8 109.3 0.00 *
P7 6.9 2.2 29.3 131.3 b 117.6 146.7 0.00 * 184.2 61.2 259.4 0.00 * 82.3 43.5 105.0 0.00 *
SSDEB
P3 13.1 7.4 14.6 29.2 18.3 61.2 0.04 * 49.3 15.5 116.2 0.04 * 51.8 a 33.4 68.4 0.04 *
P4 6.5 3.4 17.4 15.1 3.9 34.0 0.44 51.5 32.8 93.1 0.00 * 89.0 ab 60.4 105.0 0.00 *
P5 11.2 2.0 14.7 25.0 13.7 42.3 0.04 * 78.5 40.4 144.5 0.00 * 67.5 a 46.4 97.5 0.00 *
P6 9.9 5.0 18.6 24.0 12.4 88.6 0.11 73.6 19.5 188.0 0.01 * 124.4 ab 88.8 165.1 0.01 *
P7 13.2 3.3 19.4 48.8 15.7 71.5 0.04 * 163.8 72.9 235.9 0.00 * 189.7 b 148.1 231.7 0.00 *
LSDEB
P3 8.6 3.6 19.5 74.6 50.4 99.9 0.00 * 52.1 3.5 105.9 0.20 88.8 a 55.5 108.1 0.00 *
P4 11.0 6.6 19.8 109.6 61.6 127.2 0.00 * 33.3 13.2 75.8 0.16 91.6 ab 74.4 156.5 0.00 *
P5 3.8 1.0 6.6 137.2 91.3 146.8 0.00 * 42.9 32.7 87.1 0.00 * 146.7 ab 81.3 242.0 0.00 *
P6 15.0 4.0 29.7 113.1 78.3 149.0 0.00 * 49.9 41.9 96.2 0.01 * 275.3 ab 154.4 401.9 0.00 *
P7 12.0 7.9 22.4 88.6 65.4 153.2 0.00 * 80.6 51.0 128.2 0.00 * 386.4 b 175.0 599.2 0.00 *
Asterisks indicate significant differences on interarch marker position between laboratory scanner (T500) and IOS (Trios,
CS3600, i500). Different superscript lowercase letters indicate significant differences among interarch marker positions
under same scanner and edentulous conditions (p < 0.05).
Figure 8. Box plot demonstrating the unsigned difference of experimental models (Right Y-axis) by various scanners(X-axis). FPS: Full Posterior Support, PPS: Partial Posterior Support, SSDEB: Short Span Distal Extension Base, LSDEB: LongSpan Distal Extension Base. Asterisks indicate a statistically significant difference in the intergroup comparison on the sameinterarch marker position between the laboratory scanner and IOS (p < 0.05). The solid line demonstrates no significantdifference in the intragroup comparison of unsigned differences by post hoc analysis.

Appl. Sci. 2021, 11, 1489 12 of 16
Table 3. The unsigned difference of experimental models (FPS, PPS, SSDEB, LSDEB) by the various scanner (T500, Trios,CS3600, i500). IQR (Median, Q1, Q3) of RMS values are presented in micrometers. IQR: Inter Quartile Range, RMS: RootMean Square, FPS: Full Posterior Support, PPS: Partial Posterior Support, SSDEB: Short Span Distal Extension Base, LSDEB:Long Span Distal Extension Base, P3 to P7: Position 3 to Position 7.
T500 Trios CS3600 i500
Median Q1 Q3 Median Q1 Q3 p Median Q1 Q3 p Median Q1 Q3 p
FPS
P3 11.6 7.3 25.2 10.5 7.1 24.1 0.80 47.5 23.7 68.7 0.08 * 174.6 79.8 198.4 0.03 *P4 4.4 2.3 10.9 15.5 8.2 27.1 0.02 * 31.1 14.8 72.1 0.01 * 182.0 82.0 228.6 0.00 *P5 12.9 5.7 19.1 22.0 15.0 26.9 0.08 * 57.4 25.1 95.6 0.01 * 183.9 60.6 263.9 0.01 *P6 4.9 2.1 15.1 15.7 4.8 38.1 0.23 42.5 22.3 117.3 0.00 * 192.3 69.3 246.1 0.00 *P7 19.9 9.1 33.2 31.2 14.5 60.7 0.38 84.2 28.0 114.6 0.02 * 148.0 88.9 175.8 0.00 *
PPS
P3 8.1 4.9 18.2 37.0 a 9.1 49.0 0.04 * 47.1 35.7 81.1 0.00 * 84.6 47.8 92.5 0.02 *P4 9.2 0.4 13.8 38.9 a 13.8 57.4 0.02 * 77.0 38.5 106.1 0.00 * 90.6 45.4 153.9 0.02 *P5 13.4 6.6 16.6 35.8 a 10.6 61.6 0.11 123.2 70.6 154.1 0.00 * 98.8 63.4 132.6 0.00 *P6 14.7 4.9 22.8 86.7 ab 66.4 111.5 0.00 * 158.9 69.9 236.6 0.00 * 59.2 48.8 109.3 0.00 *P7 6.9 2.2 29.3 131.3 b 117.6 146.7 0.00 * 184.2 61.2 259.4 0.00 * 82.3 43.5 105.0 0.00 *
SSDEB
P3 13.1 7.4 14.6 29.2 18.3 61.2 0.04 * 49.3 15.5 116.2 0.04 * 51.8 a 33.4 68.4 0.04 *P4 6.5 3.4 17.4 15.1 3.9 34.0 0.44 51.5 32.8 93.1 0.00 * 89.0 ab 60.4 105.0 0.00 *P5 11.2 2.0 14.7 25.0 13.7 42.3 0.04 * 78.5 40.4 144.5 0.00 * 67.5 a 46.4 97.5 0.00 *P6 9.9 5.0 18.6 24.0 12.4 88.6 0.11 73.6 19.5 188.0 0.01 * 124.4 ab 88.8 165.1 0.01 *P7 13.2 3.3 19.4 48.8 15.7 71.5 0.04 * 163.8 72.9 235.9 0.00 * 189.7 b 148.1 231.7 0.00 *
LSDEB
P3 8.6 3.6 19.5 74.6 50.4 99.9 0.00 * 52.1 3.5 105.9 0.20 88.8 a 55.5 108.1 0.00 *P4 11.0 6.6 19.8 109.6 61.6 127.2 0.00 * 33.3 13.2 75.8 0.16 91.6 ab 74.4 156.5 0.00 *P5 3.8 1.0 6.6 137.2 91.3 146.8 0.00 * 42.9 32.7 87.1 0.00 * 146.7 ab 81.3 242.0 0.00 *P6 15.0 4.0 29.7 113.1 78.3 149.0 0.00 * 49.9 41.9 96.2 0.01 * 275.3 ab 154.4 401.9 0.00 *P7 12.0 7.9 22.4 88.6 65.4 153.2 0.00 * 80.6 51.0 128.2 0.00 * 386.4 b 175.0 599.2 0.00 *
Asterisks indicate significant differences on interarch marker position between laboratory scanner (T500) and IOS (Trios, CS3600, i500).Different superscript lowercase letters indicate significant differences among interarch marker positions under same scanner and edentulousconditions (p < 0.05).
4. Discussion
The purpose of this study was to evaluate the maxillo-mandibular interocclusalregistration accuracy on quadrant scans obtained by IOSs. Though most restorationswere designed in quadrant scans in current digital workflow, there were few studies aboutthe accuracy of VIRs in quadrant scans. In this study, the accuracy of VIRs was assessed bycomparing the signed and unsigned differences of the linear distance measuring five pairsof interarch markers corresponding to the canine, premolar, and molar. In addition, thetrueness and precision of scan data by various IOSs were assessed together.
The unsigned difference of the three IOSs showed statistical differences with themodel scanner (T500) at most positions. Only Trios showed no significant differencewhen compared to the T500 in the FPS group except one position. The signed differencealso showed a statistical difference when compared to T500 in multiple positions. Bothfindings revealed that the VIR using IOSs had a more deviation than that obtained withthe laboratory scanner. The first hypothesis stated that there is no difference in terms ofaccuracy when comparing the VIR of the IOS with that of the laboratory scanner. It waspartially rejected. While T500 showed uniformly low unsigned and signed differences,regardless of the edentulous conditions, the unsigned differences in the PPS, SSDEB, andLSDEB groups of Trios increased compared to those in the FPS group. In the case of theLSDEB group in Trios, (-) signed differences of all positions suggested that the maxillaryand mandibular arches were in overclosure state. In the case of CS3600, when comparedwith the FPS group, the signed and unsigned differences in the PPS and SSDEB groupsincreased, and there might be more deviation in the posterior position. For i500, the signedand unsigned difference increased in the SSDEB and LSDEB groups without posteriorteeth support, and the deviation in the posterior position increased. The second hypothesisstated that there is no difference in the accuracy of the VIR according to the edentulouscondition. It was also partially rejected.
In our study, the (+) signed difference at any position indicated that the VIR wasrecorded with an overestimated interocclusal distance; the (-) signed difference meant theopposite. In addition, if the (+) Signed difference increased toward the posterior, a tiltingeffect away from the maxilla may occur in the mandibular quadrant arch relative to themaxillary quadrant arch, and if the (-) signed difference increases, vice versa may occur.

Appl. Sci. 2021, 11, 1489 13 of 16
For example, in Trios, the (+) signed and unsigned differences in the posterior area, such asin position 7 of the PPS group, was statistically greater than those in the other positions.This reveals differences increased significantly more than that in the anterior position,indicating that there may be a tilting effect away from the maxilla in the posterior in theabsence of posterior support. In contrast, in i500, the (-) signed differences in position 7of the SSDEB and LSDEB group was statistically lower than those in the other positions.Therefore, a prosthesis fabricated in a position with a (+) Signed difference may showhigh occlusion and the reverse may show infra occlusion [1]. Zimmermann et al. reportedthat there was no significant difference between the conventional methods and variousIOSs when compared rotation of VIR in a complete dentate quadrant arch scan [9]. In ourstudy, a tilting effect was observed in the quadrant arch scan with the absence of posteriorsupport or with more than two missing teeth. A possible explanation for this finding isthe lack of landmarks in the edentulous area and the limitation of the scanner tip size,both of which could have contributed to the compromised estimation [17]. In addition,Edher et al. reported that the tilting effect could occur in the area away from the sectionrecorded by VIR in the full-arch scan [11]. In other studies, a similar effect was observedmainly in the posterior area [12,18,19]. Schmidt et al. explained that the cumulative errorsin superimposition and stitching processes contributed to the angular deviation in theposterior region [18]. They also stated that even a small angular deviation could lead toa large vertical deviation, which is crucial in the fabrication of FPDs. In our study, it isnoteworthy that the tilting effect was observed in the estimation of quadrant scan with theabsence of posterior support or the presence of more than two missing teeth.
The results of our study suggested that the accuracy of arch scan data obtained bythe IOS could affect the accuracy of VIR [7,12]. In this study, we calculated the truenessand precision of the maxillary quadrant arch scan data to assess the effect of the distortionof the scan data on the VIR. Based on our study, trueness and precision were affectedby edentulous conditions and scanners. Depending on the edentulous conditions, thedeviation showed statistically difference. In addition, according to the scanner used,significant difference was shown. In Trios, signed and unsigned differences were lower thanthose of the other IOSs due to lower distortion relative to other intraoral scanners despitethe significant deviation by the edentulous conditions. In the case of i500, the deviationof trueness and precision was higher compared to the other IOSs, also the rotation of themandibular quadrant arch occurred with deviation. In other words, obtaining accurate scandata of both arches might be one of the key factors for increasing the accuracy of the VIR.The median trueness and precision of the four experimental groups were 24.3–85.5 µm and17.4–73.9 µm, respectively. Mangano et al. reported the mean trueness and mean precisionof the quadrant scan as 23.0–49.8 µm and 17.0–43.2 µm, respectively [3]. Considering thepossibility of the scan body to function as an artificial landmark in the edentulous area [20],the presence of the scan body in previous study could explain the better results of Manganoet al. as compared to our study. Lee et al. assessed the precision of full-arch scan undervarying edentulous conditions [16]. There was a discrepancy in the precision between thepartial edentulous conditions. The resulting discrepancy in precision was 44.4–115.7 µm.Considering that the full-arch scan was performed in this study, our study result seemscomparatively more precise compared to the previous study. This indicated that a quadrantarch scan data might be more useful than a full arch scan data in terms of a more accurateVIR.
Previous studies about the accuracy of the VIR had a limitation in that there was noevaluation for the distortion of the arch scan data itself, even though the full arch modelwas used to assess the VIR [9,12,13,15]. Gintaute et al. evaluated the accuracy of VIRusing the total occlusal surface area [12]. However, the author considered the precisionof the scan data by comparing only the distance of the key points and not the scan dataitself. Solarberrieta et al. [15] also used the number of occlusal contacts to investigate theVIR. Hence, it was hard to determine the effect of the accuracy of the scan data from IOSon the VIR. Ren et al. assessed the VIR in the full arch scan of the varying edentulous

Appl. Sci. 2021, 11, 1489 14 of 16
conditions [13]. Although the full arch scan data were obtained from the IOS, there wasa lack of information about the distortion in scan data. In the study of Ren et al., themean difference of interarch marker distance was 60 µm in the complete dentate full archand 870 µm in the full arch with extended edentulous span. In our study, the medianunsigned difference of interarch marker distance was 10.5 µm in the FPS group of Triosand 386.3 µm in the LSDEB group of i500. Comparing the results of our study, the errorsin VIR were reduced in the quadrant arch scan. However, a previous study, which wasdone in the quadrant arch, showed comparable results. In the study of Zimmermann et al.,the total translation of the VIR in a complete dentate quadrant arch was at 66.6 µm inTrios 3 [9]. In our study, the median unsigned difference of the FPS group in the Trios3ranged from 10.5 µm in position 3 to 31.2 µm in position 7. Considering the differencesbetween measuring methods in studies, the results of our study were comparable to thoseof Zimmermann et al.
The results of this study showed that the registration of the occlusal relationshipusing IOSs in the edentulous area with more than two missing teeth might be clinicallymore inaccurate than that obtained with a laboratory scanner [12,13]. In this situation, itis recommended to apply a digital workflow including a laboratory scanner. If clinicianswant to use IOSs, it is recommended to use an additional scanning strategy such as markerson the missing area for improved clinical results [13]. In addition, it might be necessaryto compensate for the distortion of the occlusal relationship during the CAD or millingprocess [1,12]. Clinicians should be aware that there are differences in the characteristicsbetween IOSs in the registration of interocclusal relationships, especially when edentulousareas exist. There are differences in the accuracy of scans for each IOS [3,16] and inthe algorithm for post-processing scan data [6]. Additionally, the accuracy of the scandiffers according to the edentulous condition [16,21], and the discrepancy may vary withVIRs [11,12,14]. In our study, depending on the edentulous condition and the type ofIOS, there were local or general deviations in the occlusion of the experimental groupscompared to laboratory scanner. In some groups, a tilting effect occurred in the posteriorregions. If excessive occlusal adjustment or additional repair is expected during the try-inprocedure of the prosthesis due to unacceptable occlusal registration, the digital workflowusing an IOS may not be predictable [8].
This study had limitations because it was not able to reproduce all clinical scenarios.In addition, being an in vitro study, it was not possible to reflect various clinical envi-ronments that could affect the accuracy of the scan images and the VIR, such as saliva,soft tissue, patient movement during scanning, and restriction of the scanner tip in theoral cavity [13,22,23]. This study evaluated the VIR in the edentulous region without struc-tures that the IOS can recognize. Clinically, the presence of an implant scan body, healingabutment, or abutment tooth may affect the scan image and VIR. In future studies, therelationship between the presence of recognizable the structure and the accuracy of theVIR needs to be conducted. Furthermore, additional research with a larger number ofspecimens is necessary to establish a fully digital workflow using an IOS that minimizesthe possibility of occlusal adjustment.
5. Conclusions
Within the limitations of this in vitro study for quadrant arch scan with varyingedentulous conditions, the following conclusions can be drawn:
1. The registration of the VIR using IOSs in quadrant scans with two or more missingteeth is less predictable than laboratory scanners.
2. In identical edentulous conditions, there are differences in the occlusal relationshiprecords between different IOSs.
3. In the same scanner, there are differences in the accuracy of the VIR according to theedentulous condition.

Appl. Sci. 2021, 11, 1489 15 of 16
Author Contributions: Conceptualization, J.-E.K. and J.-S.S.; methodology, J.-E.K.; software, N.-E.N.;validation, Y.-C.L., J.-E.K. and J.-H.L.; formal analysis, Y.-C.L.; investigation, J.-E.K.; resources, N.-E.N.and S.-H.S.; data curation, Y.-C.L. and J.-H.L.; writing—original draft preparation, Y.-C.L. and J.-E.K.;writing—review and editing, Y.-C.L. and J.-E.K. and J.-S.S.; visualization, S.-H.S.; supervision, K.-W.L.;project administration, K.-W.L. and J.-S.S.; funding acquisition, J.-S.S. All authors have read andagreed to the published version of the manuscript.
Funding: This study was supported by the Advanced Technology Center (ATC) Program funded bythe Ministry of Trade, Industry and Energy (MOTIE, Korea) (10077361, Integrated System for DentalDiagnosis, Treatment Simulation & PSI (Patient Specific Instrument) Design).
Institutional Review Board Statement: Not applicable.
Informed Consent Statement: Not applicable.
Data Availability Statement: Data sharing is not applicable to this article.
Conflicts of Interest: The authors declare no conflict of interest.
References1. Wong, K.Y.; Esguerra, R.J.; Chia, V.A.P.; Tan, Y.H.; Tan, K.B.C. Three-Dimensional Accuracy of Digital Static Interocclusal
Registration by Three Intraoral Scanner Systems. J. Prosthodont. 2018, 27, 120–128. [CrossRef]2. Logozzo, S.; Zanetti, E.M.; Franceschini, G.; Kilpelä, A.; Mäkynen, A. Recent advances in dental optics—Part I: 3D intraoral
scanners for restorative dentistry. Opt. Lasers Eng. 2014, 54, 203–221. [CrossRef]3. Mangano, F.G.; Hauschild, U.; Veronesi, G.; Imburgia, M.; Mangano, C.; Admakin, O. Trueness and precision of 5 intraoral
scanners in the impressions of single and multiple implants: A comparative in vitro study. BMC Oral Health 2019, 19, 101.[CrossRef]
4. Patzelt, S.B.M.; Emmanouilidi, A.; Stampf, S.; Strub, J.R.; Att, W. Accuracy of full-arch scans using intraoral scanners. Clin. OralInvestig. 2014, 18, 1687–1694. [CrossRef] [PubMed]
5. Mangano, F.; Gandolfi, A.; Luongo, G.; Logozzo, S. Intraoral scanners in dentistry: A review of the current literature. BMC OralHealth 2017, 17, 149. [CrossRef]
6. Ender, A.; Zimmermann, M.; Attin, T.; Mehl, A. In vivo precision of conventional and digital methods for obtaining quadrantdental impressions. Clin. Oral Investig. 2016, 20, 1495–1504. [CrossRef]
7. Ahlholm, P.; Sipilä, K.; Vallittu, P.; Jakonen, M.; Kotiranta, U. Digital Versus Conventional Impressions in Fixed Prosthodontics: AReview. J. Prosthodont. 2018, 27, 35–41. [CrossRef] [PubMed]
8. Freilich, M.A.; Altieri, J.V.; Wahle, J.J. Principles for selecting interocclusal records for articulation of dentate and partially dentatecasts. J. Prosthet. Dent. 1992, 68, 361–367. [CrossRef]
9. Zimmermann, M.; Ender, A.; Attin, T.; Mehl, A. Accuracy of Buccal Scan Procedures for the Registration of Habitual Intercuspation.Oper. Dent. 2018, 43, 573–580. [CrossRef] [PubMed]
10. Müller, H.C. Registration of occlusion by buccal scan in Cerec software version 3.80. Int. J. Comput. Dent. 2010, 13, 265–273.[PubMed]
11. Edher, F.; Hannam, A.G.; Tobias, D.L.; Wyatt, C.C.L. The accuracy of virtual interocclusal registration during intraoral scanning. J.Prosthet. Dent. 2018, 120, 904–912. [CrossRef] [PubMed]
12. Gintaute, A.; Keeling, A.J.; Osnes, C.A.; Zitzmann, N.U.; Ferrari, M.; Joda, T. Precision of maxillo-mandibular registration withintraoral scanners in vitro. J. Prosthodont. Res. 2020, 64, 114–119. [CrossRef] [PubMed]
13. Ren, S.; Morton, D.; Lin, W.S. Accuracy of virtual interocclusal records for partially edentulous patients. J. Prosthet. Dent. 2020,123, 860–865. [CrossRef] [PubMed]
14. Iwaki, Y.; Wakabayashi, N.; Igarashi, Y. Dimensional Accuracy of Optical Bite Registration in Single and Multiple Unit Restorations.Oper. Dent. 2013, 38, 309–315. [CrossRef] [PubMed]
15. Solaberrieta, E.; Arias, A.; Brizuela, A.; Garikano, X.; Pradies, G. Determining the requirements, section quantity, and dimensionof the virtual occlusal record. J. Prosthet. Dent. 2016, 115, 52–56. [CrossRef] [PubMed]
16. Lee, J.; Yun, J.; Han, J.; Yeo, I.L.; Yoon, H. Repeatability of Intraoral Scanners for Complete Arch Scan of Partially EdentulousDentitions: An In Vitro Study. J. Clin. Med. 2019, 8, 1187. [CrossRef]
17. Andriessen, F.S.; Rijkens, D.R.; Van der Meer, W.J.; Wismeijer, D.W. Applicability and accuracy of an intraoral scanner for scanningmultiple implants in edentulous mandibles: A pilot study. J. Prosthet. Dent. 2014, 111, 186–194. [CrossRef] [PubMed]
18. Schmidt, A.; Benedickt, C.R.; Schlenz, M.A.; Rehmann, P.; Wöstmann, B. Torsion and linear accuracy in intraoral scans obtainedwith different scanning principles. J. Prosthodont. Res. 2020, 64, 167–174. [CrossRef] [PubMed]
19. Chiu, A.; Chen, Y.W.; Hayashi, J.; Sadr, A. Accuracy of CAD/CAM Digital Impressions with Different Intraoral ScannerParameters. Sensors 2020, 20, 1157. [CrossRef] [PubMed]
20. Kim, J.E.; Amelya, A.; Shin, Y.; Shim, J.S. Accuracy of intraoral digital impressions using an artificial landmark. J. Prosthet. Dent.2017, 117, 755–761. [CrossRef]

Appl. Sci. 2021, 11, 1489 16 of 16
21. Vecsei, B.; Joós-Kovács, G.; Borbély, J.; Hermann, P. Comparison of the accuracy of direct and indirect three-dimensional digitizingprocesses for CAD/CAM systems—An in vitro study. J. Prosthodont. Res. 2017, 61, 177–184. [CrossRef] [PubMed]
22. Flügge, T.V.; Schlager, S.; Nelson, K.; Nahles, S.; Metzger, M.C. Precision of intraoral digital dental impressions with iTero andextraoral digitization with the iTero and a model scanner. Am. J. Orthod. Dentofac. Orthop. 2013, 144, 471–478. [CrossRef][PubMed]
23. Keeling, A.; Wu, J.; Ferrari, M. Confounding factors affecting the marginal quality of an intra-oral scan. J. Dent. 2017, 59, 33–40.[CrossRef] [PubMed]