
Influence of different parameters on wet synthesis of ...
43
Influence of different parameters on wet synthesis of silver nanoparticles Membrane Science & Technology Group Miran Pris Daily supervisor: Ph.D. Krzysztof Trzaskuś Supervisor: Dr. Ir. A.J.B. Kemperman Head of research group: Prof. Dr. Ir. D.C. Nijmeijer
Transcript of Influence of different parameters on wet synthesis of ...

Influence of different parameters on wet synthesis of silver nanoparticles
Membrane Science & Technology Group
Miran Pris Daily supervisor: Ph.D. Krzysztof Trzaskuś Supervisor: Dr. Ir. A.J.B. Kemperman Head of research group: Prof. Dr. Ir. D.C. Nijmeijer
Table of Contents
Abstract 3
1. Introduction 4 1.1 Metallic nanoparticles 4 1.2 Manufacturing of metallic nanoparticles 5 1.2.1 Solid phase: Milling 5 1.2.2 Gas phase: Spray Pyrolysis 6 1.2.3 Liquid phase: Reduction 6
1.3 Silver Nanoparticles 9 1.3.1 Plasmonic properties 9 1.3.2 UV-‐Vis spectroscopy 10 1.3.3 DLS 10 1.3.4 Zeta-‐potential and DLVO-‐theory 11 1.3.5 Parameters influencing AgNP properties 13 1.3.6 Synthesis of silver nanoparticles 13
2. Experimental 15 2.1 Materials 15 2.2 Synthesis of silver nanoparticles 15 3. Results and discussion 19 3.1 Trisodium citrate 19 3.1.1 Effect of temperature and reducing agent concentration 19 3.1.2 Effect of stirring time 21 3.1.3 Effect of pH 22
3.2 Ascorbic acid 24 3.2.1 Effect of temperature and reducing agent concentration 24 3.2.2 Effect of stirring time 25 3.2.3 Effect of pH 25 3.2.4 Effect of stabilizer 27
3.3 Sodium borohydride 29 3.3.1 Effect of temperature and reducing agent concentration 29 3.3.2 Effect of stirring time 30 3.3.3 Effect of pH 31 3.3.4 Effect of stabilizer 31
4. Conclusions 34
5. Future research 36
References 37
Appendix 41
3
Abstract Due to the increased production of silver nanoparticles in the last decade, the aqueous environment is
getting increasingly polluted with these small contaminants. Membranes are seen as a promising technique
to remove the silver nanoparticles from water. This research focuses on optimal reaction conditions and
reaction mixture composition for manufacturing of silver nanoparticles, leading to monodisperse colloidal
suspensions with high stability. During this research, silver nanoparticles were synthesized by applying the
wet synthesis technique and more specifically, the reduction method. By using three different reducing
agents, the influence of 6 parameters (reducing agent used, reaction mixture composition, reaction
temperature, stirring period, addition of stabilizing agent and the variation of the pH-value) on the mean
particle size, sample stability and the degree of dispersion were investigated. The quality of the synthesized
samples was characterized by UV-Vis, DLS and zeta-potential measurements.
4
1. Introduction
1.1 Metall ic nanoparticles There is increased scientific interest in metallic nanoparticles. This is caused by the fact that metallic
nanoparticles are of wide potential use. These particles are seen more and more in the electronic, optical
and biomedical industry [1-4].
The US Environmental Protection Agency has categorized particles regarding to their diameter size [5].
Nanoparticles are categorized as ultrafine particles and have a diameter between 1-100 nanometer. It was
not until the first profound fundamental studies that the term “nanoparticles” was used. Molecules are
also in the size range mentioned above, but they are not referred to as nanoparticles.
Metallic nanoparticles are very interesting, because of the fact that these particles show size-dependent
characteristics of the material. Especially in the nanometer scale, these size-dependent properties are
observable. A bulk material that contains many molecules will have constant optical, thermal, chemical
and physical properties, regardless of its size. This is not the case for very small particles [6]. Because of
their small size, the ratio of surface-to-bulk is high. In other words, nanoparticles have relatively much
more surface than larger particles. Besides the larger surface-to-bulk ratio, the surface-to-mean free path
ratio of an electron in metal is also significantly larger than in bulk material [7]. These two characteristics
make nanoparticles much more reactive. The reason that surface adds to reactivity can be explained by
looking at the surface atoms. The surface atoms have less surrounding neighbouring atoms and are
therefore highly energetic. Other atoms outside of the material are able to bind to these surface atoms
very easily.
In the last decade, the amount of produced nanoparticles has expanded immensely, especially the amount
of silver nanoparticles. There is a discussion going on about the impact of nanoparticles on living
organisms and their possible toxicity. This toxicity can become hazardous for living organisms, as the
produced nanoparticles will accumulate in the aqueous environment after usage. This creates an urgency
to obtain deeper knowledge and fundamental understanding of the behaviour of nanoparticles in water.
Membranes are seen as a potential solution to remove the contaminating nano-sized particles from the
aqueous environment. Therefore, nanoparticle suspensions are needed for filtration purposes. From these
suspensions, defined size of nanoparticles is needed. The goal of this work is to research the influence of
main parameters found in literature on the size and surface properties of manufactured silver
nanoparticles, as silver nanoparticles are the most commonly produced of all the nanoparticles. This
research will thus focus on development of a method to manufacture a monodisperse, stable solution of
silver nanoparticles. The manufacturing method used will be the reduction of silver salt in the liquid
phase. Three different reducing agents will be used. The manufactured silver nanoparticles will be
characterized by measurements of Dynamic Light Scattering (DLS), UV-Vis spectroscopy, and zeta
potential measurements.
5
This paper is structured as follows: The remainder of this chapter will proceed with the manufacturing
methods of metallic nanoparticles and the underlying mechanisms. The chapter will conclude with silver
nanoparticles. Chapter 2 outlines the experimental part, followed by results and discussion of three
different reducing agents in chapter 3. In chapter 4, the conclusions will be presented. Finally, chapter 5
will provide recommendations on future research.
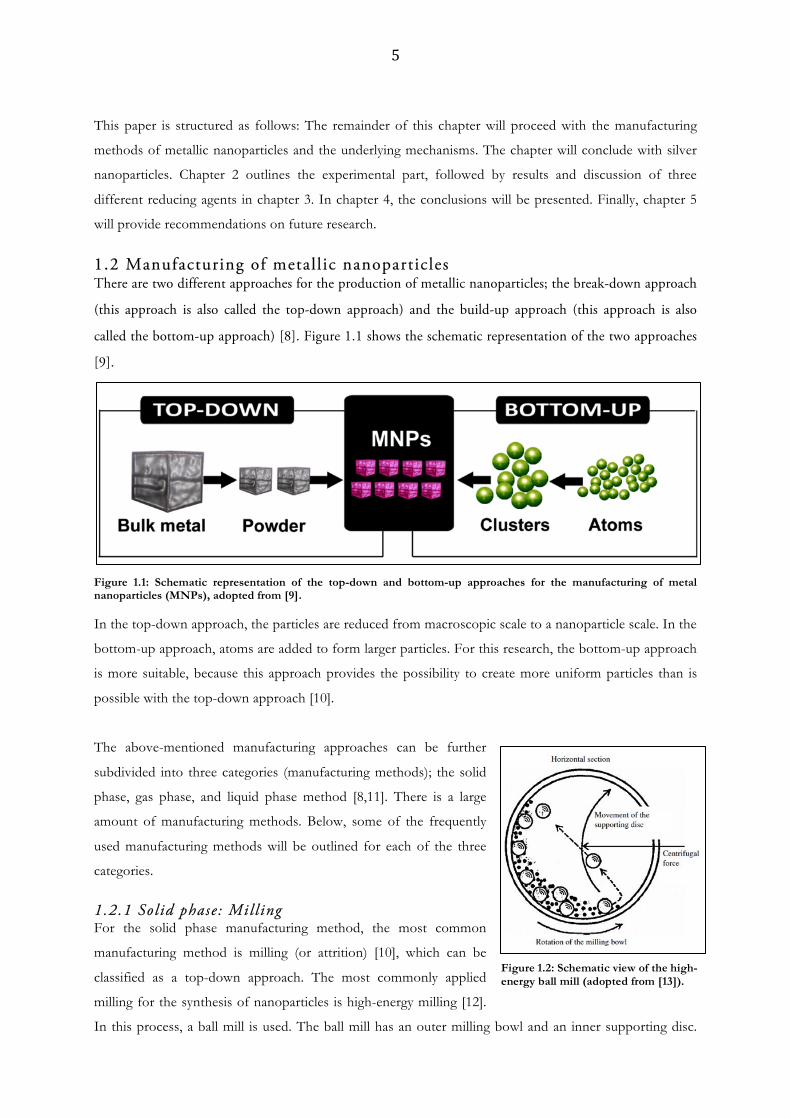
1.2 Manufacturing of metall ic nanoparticles There are two different approaches for the production of metallic nanoparticles; the break-down approach
(this approach is also called the top-down approach) and the build-up approach (this approach is also
called the bottom-up approach) [8]. Figure 1.1 shows the schematic representation of the two approaches
[9].
Figure 1.1: Schematic representation of the top-down and bottom-up approaches for the manufacturing of metal nanoparticles (MNPs), adopted from [9].
In the top-down approach, the particles are reduced from macroscopic scale to a nanoparticle scale. In the
bottom-up approach, atoms are added to form larger particles. For this research, the bottom-up approach
is more suitable, because this approach provides the possibility to create more uniform particles than is
possible with the top-down approach [10].
The above-mentioned manufacturing approaches can be further
subdivided into three categories (manufacturing methods); the solid
phase, gas phase, and liquid phase method [8,11]. There is a large
amount of manufacturing methods. Below, some of the frequently
used manufacturing methods will be outlined for each of the three
categories.
1.2.1 Solid phase: Milling For the solid phase manufacturing method, the most common
manufacturing method is milling (or attrition) [10], which can be
classified as a top-down approach. The most commonly applied
milling for the synthesis of nanoparticles is high-energy milling [12].
In this process, a ball mill is used. The ball mill has an outer milling bowl and an inner supporting disc.
Figure 1.2: Schematic view of the high-energy ball mill (adopted from [13]).
6
Inside the ball mill, a powder mixture is placed. This is depicted in Figure 1.2. During the milling process,
the powder inside the ball mill is subjected to high-energetic impact of the milling balls. The movement of
the outer bowl is opposite to the movement of the inner supporting disc. This leads to the alternate
synchronization of the centrifugal forces. The milling balls and the powder then alternately roll on one
side of the inner wall and impact the opposite side, thereby achieving a high-energetic impact, which is up
to 40 times higher than that of gravitational acceleration [13].
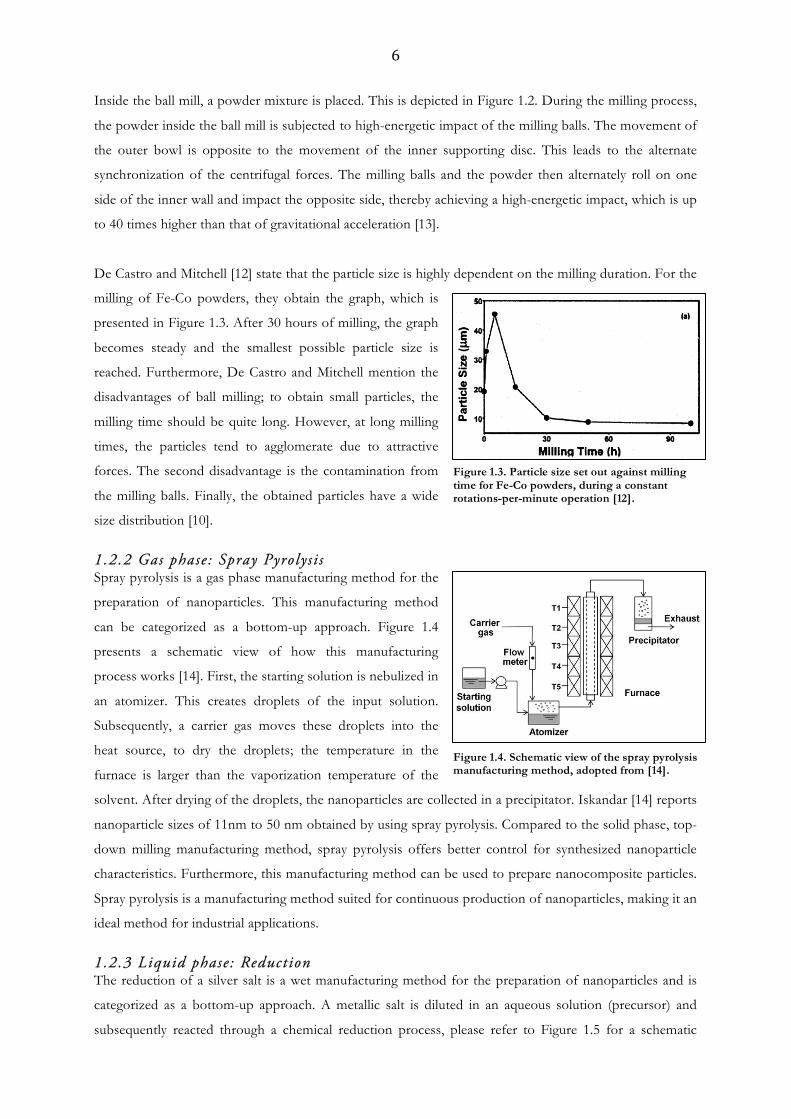
De Castro and Mitchell [12] state that the particle size is highly dependent on the milling duration. For the
milling of Fe-Co powders, they obtain the graph, which is
presented in Figure 1.3. After 30 hours of milling, the graph
becomes steady and the smallest possible particle size is
reached. Furthermore, De Castro and Mitchell mention the
disadvantages of ball milling; to obtain small particles, the
milling time should be quite long. However, at long milling
times, the particles tend to agglomerate due to attractive
forces. The second disadvantage is the contamination from
the milling balls. Finally, the obtained particles have a wide
size distribution [10].
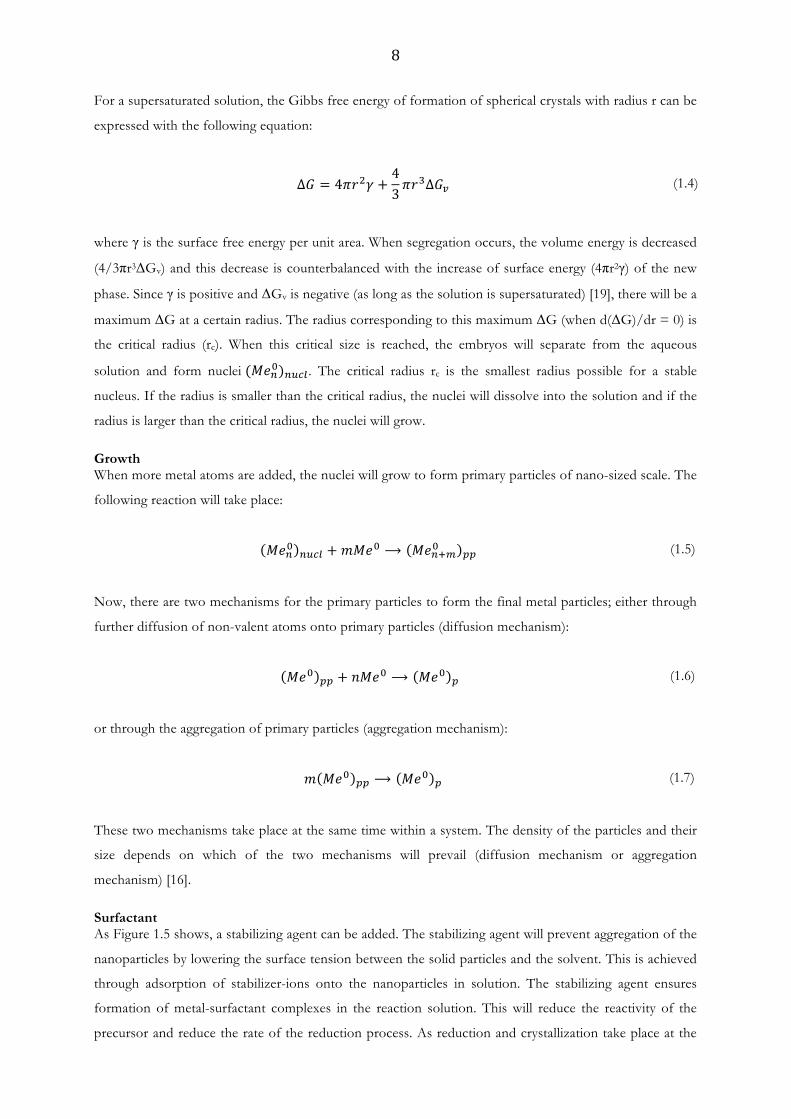
1.2.2 Gas phase: Spray Pyrolysi s Spray pyrolysis is a gas phase manufacturing method for the
preparation of nanoparticles. This manufacturing method
can be categorized as a bottom-up approach. Figure 1.4
presents a schematic view of how this manufacturing
process works [14]. First, the starting solution is nebulized in
an atomizer. This creates droplets of the input solution.
Subsequently, a carrier gas moves these droplets into the
heat source, to dry the droplets; the temperature in the
furnace is larger than the vaporization temperature of the
solvent. After drying of the droplets, the nanoparticles are collected in a precipitator. Iskandar [14] reports
nanoparticle sizes of 11nm to 50 nm obtained by using spray pyrolysis. Compared to the solid phase, top-
down milling manufacturing method, spray pyrolysis offers better control for synthesized nanoparticle
characteristics. Furthermore, this manufacturing method can be used to prepare nanocomposite particles.
Spray pyrolysis is a manufacturing method suited for continuous production of nanoparticles, making it an
ideal method for industrial applications.
1.2.3 Liquid phase: Reduction The reduction of a silver salt is a wet manufacturing method for the preparation of nanoparticles and is
categorized as a bottom-up approach. A metallic salt is diluted in an aqueous solution (precursor) and
subsequently reacted through a chemical reduction process, please refer to Figure 1.5 for a schematic
Figure 1.3. Particle size set out against milling time for Fe-Co powders, during a constant rotations-per-minute operation [12].
Figure 1.4. Schematic view of the spray pyrolysis manufacturing method, adopted from [14].

7
representation of the reduction manufacturing method [15]. For this process various reducing agents can
be used. In general, the following chemical reaction takes place [16]:
𝑚𝑀𝑒!! + 𝑛𝑅𝑒𝑑 ⟶ 𝑚𝑀𝑒! + 𝑛𝑂𝑥 (1.1)
During the reaction, the metal ions (Men+) are
chemically reduced to a non-valent form of the
metal (Me0). The crystallization process and the
reduction process take place at the same time. The
crystallization process exists out of two events;
nucleation and growth.
Homogeneous nucleation The above-mentioned non-valent form of the
metal will be insoluble and will aggregate slowly
into embryos through the reaction process [16]:
𝑥𝑀𝑒! ⟷ 𝑀𝑒!! !" (1.2)
The embryos will either dissociate or grow until the embryos contain the amount of atoms equal the
“magic numbers” (2, 10, 18, 36, 54, 86) [17]. This will ensure stability of the embryos. The driving force
for nucleation (and growth, discussed in Growth-section below) is the reduction of the overall Gibbs free
energy. The chemical reduction process of the metal ions in solution will create a solution with an amount
of non-valent metal atoms, which exceeds the solubility. This is called supersaturation. When a solution is
supersaturated, it will have high Gibbs free energy. Segregation of the metal atoms in solution will reduce
the overall Gibbs free energy. This driving force can be expressed as ΔGv, which is the difference in
Gibbs free energy per unit volume. The concentration of the metal atoms in solution dictates the driving
force, as can be seen from equation (1.3) below [18]:
Δ𝐺! =−𝑘𝑇
Ω 𝑙𝑛 𝐶𝐶!
=−𝑘𝑇
Ω 𝑙𝑛 1 + 𝜎 (1.3)
where C represents the concentration of the metal atoms in solution, C0 represents the equilibrium
concentration or the solubility, Ω represents the atomic volume and σ represents the supersaturation,
which can be expressed as (C – C0)/C0. From equation (1.3) it can be seen that if there is no
supersaturation, the nucleation process will not occur (if σ equals zero, ΔGv will be zero). Thus
supersaturation is a precondition for spontaneous nucleation.
Figure 1.5. Schematic view of a proposed reduction process. The numbers on the arrows represent the chronological order of the process steps, adopted from [15].
8
For a supersaturated solution, the Gibbs free energy of formation of spherical crystals with radius r can be
expressed with the following equation:
Δ𝐺 = 4𝜋𝑟!𝛾 +43𝜋𝑟!Δ𝐺! (1.4)
where γ is the surface free energy per unit area. When segregation occurs, the volume energy is decreased
(4/3πr3ΔGv) and this decrease is counterbalanced with the increase of surface energy (4πr2γ) of the new
phase. Since γ is positive and ΔGv is negative (as long as the solution is supersaturated) [19], there will be a
maximum ΔG at a certain radius. The radius corresponding to this maximum ΔG (when d(ΔG)/dr = 0) is
the critical radius (rc). When this critical size is reached, the embryos will separate from the aqueous
solution and form nuclei (𝑀𝑒!!)!"#$ . The critical radius rc is the smallest radius possible for a stable
nucleus. If the radius is smaller than the critical radius, the nuclei will dissolve into the solution and if the
radius is larger than the critical radius, the nuclei will grow.
Growth When more metal atoms are added, the nuclei will grow to form primary particles of nano-sized scale. The
following reaction will take place:
𝑀𝑒!! !"#$ +𝑚𝑀𝑒! ⟶ 𝑀𝑒!!!!!! (1.5)
Now, there are two mechanisms for the primary particles to form the final metal particles; either through
further diffusion of non-valent atoms onto primary particles (diffusion mechanism):
𝑀𝑒! !! + 𝑛𝑀𝑒! ⟶ 𝑀𝑒! ! (1.6)
or through the aggregation of primary particles (aggregation mechanism):
𝑚 𝑀𝑒! !! ⟶ 𝑀𝑒! ! (1.7)
These two mechanisms take place at the same time within a system. The density of the particles and their
size depends on which of the two mechanisms will prevail (diffusion mechanism or aggregation
mechanism) [16].
Surfactant As Figure 1.5 shows, a stabilizing agent can be added. The stabilizing agent will prevent aggregation of the
nanoparticles by lowering the surface tension between the solid particles and the solvent. This is achieved
through adsorption of stabilizer-ions onto the nanoparticles in solution. The stabilizing agent ensures
formation of metal-surfactant complexes in the reaction solution. This will reduce the reactivity of the
precursor and reduce the rate of the reduction process. As reduction and crystallization take place at the

9
same time, the nucleation process will be favoured because of enough accumulation of reactants in
solution to preserve supersaturation. Furthermore, the adsorbed stabilizer-ions will create electrostatic
repulsion between the coated nanoparticles, thereby increasing stability. This is essential for a narrow size
distribution of the particles [19].
It is also possible to use surfactant to manipulate the shape during the reduction process. This is also
known as capping [20]. The surfactant has a preference for binding to certain planes of the crystal system,
allowing the ‘unprotected’ planes to be reduced.
1.3 Silver Nanoparticles In the last decade, the usage of silver nanoparticles has expanded significantly. Silver nanoparticles
(AgNPs) are commercially used, among others, for electronics, textiles, cosmetics, spray cleaning agents,
fever reducing substances, plastics and paints [21,22]. Due to their increased commercial use, AgNPs have
become the most commonly utilized nanoparticles. It is believed that AgNPs are toxic [23]. This toxicity
poses a threat for the environment, as the manufactured AgNPs will accumulate in the aqueous
environment after their usage. It is essential to understand the behaviour of silver nanoparticles in water.
To be able to study silver nanoparticles and get deeper knowledge about their behaviour, silver
nanoparticles will be produced for this research.
1.3.1 Plasmonic properties An interesting thing about some metallic nanoparticles and especially silver and gold nanoparticles, is that
these particles show strong plasmonic properties. When light photons interact with the surface of AgNPs,
the outer free electrons of the particles form localized plasmons [24]. Plasmons are density waves of the
free outer electrons. Specific
wavelengths of light cause the outer
electrons to oscillate. This
phenomenon is called the surface
plasmon resonance (SPR). When
these resonances occur, the
intensities of absorption and
scattering are much higher than
those of the same particles without
plasmonic properties. SPRs are
highly dependent on particle characteristics [25]. Figure 1.6 shows localized surface plasmon resonance for
a particle smaller than the wavelength of the incident light.
Figure 1.6. Schematic view of localized surface plasmon resonance for particles smaller than the wavelength of the incident light; the lightvector k creates an electric field E0. Due to E0, the free electrons in the AgNPs get displaced and start to oscillate collectively in resonance with the incident light, adopted from [25].
10
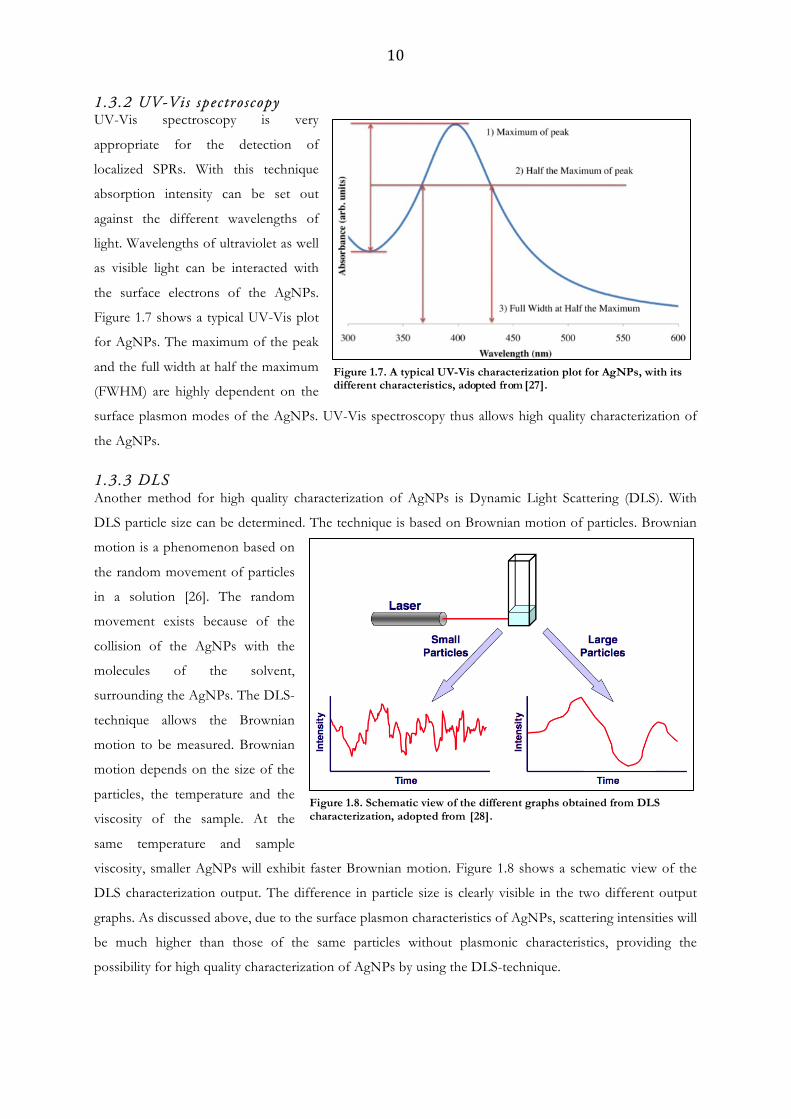
1.3.2 UV-Vis spectroscopy UV-Vis spectroscopy is very
appropriate for the detection of
localized SPRs. With this technique
absorption intensity can be set out
against the different wavelengths of
light. Wavelengths of ultraviolet as well
as visible light can be interacted with
the surface electrons of the AgNPs.
Figure 1.7 shows a typical UV-Vis plot
for AgNPs. The maximum of the peak
and the full width at half the maximum
(FWHM) are highly dependent on the
surface plasmon modes of the AgNPs. UV-Vis spectroscopy thus allows high quality characterization of
the AgNPs.
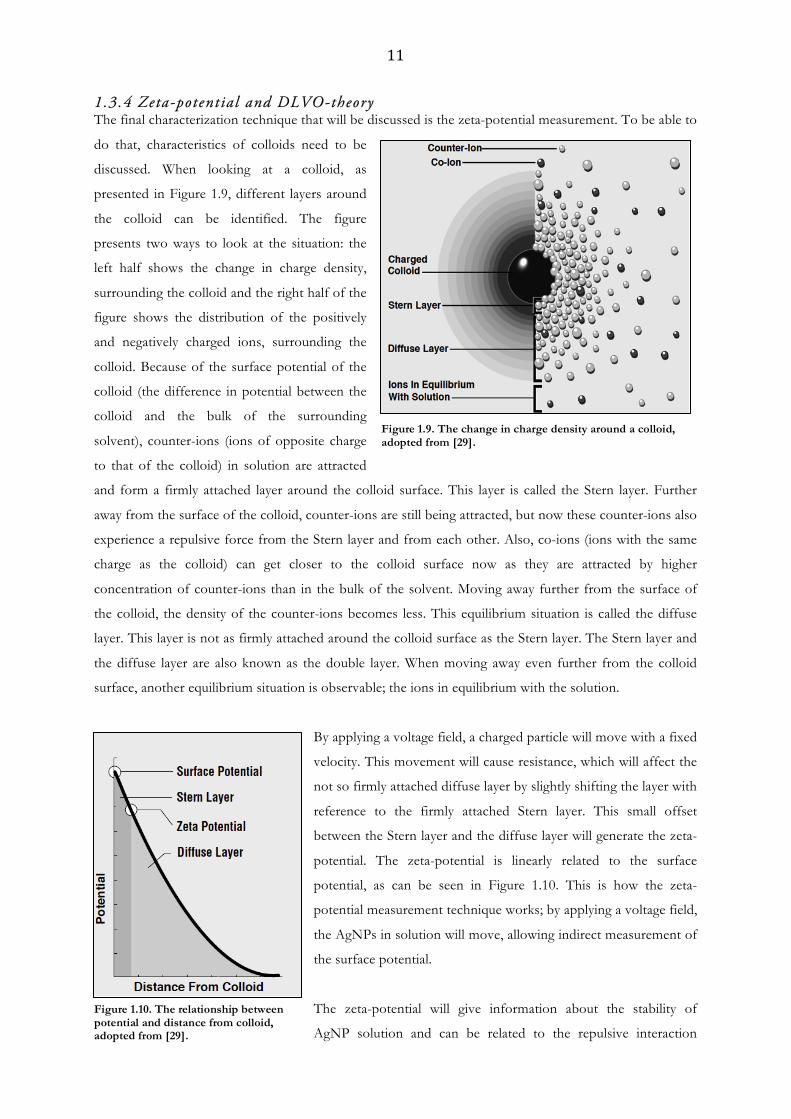
1.3.3 DLS Another method for high quality characterization of AgNPs is Dynamic Light Scattering (DLS). With
DLS particle size can be determined. The technique is based on Brownian motion of particles. Brownian
motion is a phenomenon based on
the random movement of particles
in a solution [26]. The random
movement exists because of the
collision of the AgNPs with the
molecules of the solvent,
surrounding the AgNPs. The DLS-
technique allows the Brownian
motion to be measured. Brownian
motion depends on the size of the
particles, the temperature and the
viscosity of the sample. At the
same temperature and sample
viscosity, smaller AgNPs will exhibit faster Brownian motion. Figure 1.8 shows a schematic view of the
DLS characterization output. The difference in particle size is clearly visible in the two different output
graphs. As discussed above, due to the surface plasmon characteristics of AgNPs, scattering intensities will
be much higher than those of the same particles without plasmonic characteristics, providing the
possibility for high quality characterization of AgNPs by using the DLS-technique.
Figure 1.7. A typical UV-Vis characterization plot for AgNPs, with its different characteristics, adopted from [27].
Figure 1.8. Schematic view of the different graphs obtained from DLS characterization, adopted from [28].
11
1.3.4 Zeta-potential and DLVO-theory The final characterization technique that will be discussed is the zeta-potential measurement. To be able to
do that, characteristics of colloids need to be
discussed. When looking at a colloid, as
presented in Figure 1.9, different layers around
the colloid can be identified. The figure
presents two ways to look at the situation: the
left half shows the change in charge density,
surrounding the colloid and the right half of the
figure shows the distribution of the positively
and negatively charged ions, surrounding the
colloid. Because of the surface potential of the
colloid (the difference in potential between the
colloid and the bulk of the surrounding
solvent), counter-ions (ions of opposite charge
to that of the colloid) in solution are attracted
and form a firmly attached layer around the colloid surface. This layer is called the Stern layer. Further
away from the surface of the colloid, counter-ions are still being attracted, but now these counter-ions also
experience a repulsive force from the Stern layer and from each other. Also, co-ions (ions with the same
charge as the colloid) can get closer to the colloid surface now as they are attracted by higher
concentration of counter-ions than in the bulk of the solvent. Moving away further from the surface of
the colloid, the density of the counter-ions becomes less. This equilibrium situation is called the diffuse
layer. This layer is not as firmly attached around the colloid surface as the Stern layer. The Stern layer and
the diffuse layer are also known as the double layer. When moving away even further from the colloid
surface, another equilibrium situation is observable; the ions in equilibrium with the solution.
By applying a voltage field, a charged particle will move with a fixed
velocity. This movement will cause resistance, which will affect the
not so firmly attached diffuse layer by slightly shifting the layer with
reference to the firmly attached Stern layer. This small offset
between the Stern layer and the diffuse layer will generate the zeta-
potential. The zeta-potential is linearly related to the surface
potential, as can be seen in Figure 1.10. This is how the zeta-
potential measurement technique works; by applying a voltage field,
the AgNPs in solution will move, allowing indirect measurement of
the surface potential.
The zeta-potential will give information about the stability of
AgNP solution and can be related to the repulsive interaction
Figure 1.9. The change in charge density around a colloid, adopted from [29].
Figure 1.10. The relationship between potential and distance from colloid, adopted from [29].

12
between particle double layers through the Derjaguin-Landau-Verwey-Overbeek-theory (DLVO-theory).
The DLVO-theory describes the balance between repulsive interactions (arising from the double layers)
on surrounding neighbour particles and the attractive van-der-Waals interactions present between the
molecules in those particles [30,31]. The potential energy arising from the repulsive interactions between
the particle double layers, can be expressed as [32]:
𝑉!"#$%&'() =𝐴𝑎!𝜁!
𝑅𝑒!!/!
(1.8)
where A is a constant, a is the particle radius, ζ is the zeta-potential, R is the distance between the particle
centres, h is the distance between the surfaces of the two particles and κ is the thickness of the double
layer (Debye length). Equation (1.8) is valid for particles, which have a thick double layer (a<<κ) [32]. For
the research described in this paper, it will be assumed that this is the case. The thickness of the double
layer can be expressed as [32]:
𝜅 =𝜀𝑅𝑇
2𝜌𝐹!𝐼𝑏!!/!
(1.9)
where ε is the permittivity, T is the temperature, ρ is the mass density of the solution, F is Faraday’s
constant, I is the ionic strength of the solution and bo = 1 mol kg-1 [32].
The potential energy corresponding to the attractive van-der-Waals interactions can be expressed as [32]:
𝑉!""#!$"%&' = −𝐵ℎ!
(1.10)
where B is the Born constant and n is the Born exponent. The value of n depends on the electronic
configuration of the closed shell ions. Figure 1.11 shows the graphs of the potential energy for the
Figure 1.11. The graphs for the potential energy of repulsion interactions between particles (V-repulsion), the attraction interactions (V-attraction) and the total potential energy (V-total). Adopted from [33].
13
repulsive interactions (V-repulsion), the attractive interactions (V-attraction) and the total potential energy
(V-total). When the distance h between the particles is very small, the van-der-Waals forces will dominate
and aggregation between the particles will occur (during the interval between the primary minimum and
the primary maximum of the VT-graph). This aggregation will be irreversible and is known as coagulation
[32]. At large distance s between the particles and at high ionic strength, a secondary minimum exists in
the VT-graph, forming a shallow well. This well corresponds to reversible aggregation of the particles and
is known as flocculation. Because the well is shallow, the flocculated particles can be redispersed again by
agitation [32].
1.3.5 Parameters influencing AgNP properties In literature, parameters were found, which will influence the characteristics of the manufactured AgNPs.
These are the commonly acknowledged parameters of influence:
- type of reducing agent used during synthesis,
- reaction mixture composition,
- temperature of the reaction,
- stirring time,
- stabilization with a stabilizing agent,
- pH-value.
During this research the above-mentioned parameters will be controlled to find a reliable way for
manufacturing AgNPs with certain characteristics.
1.3.6 Synthesis of s i lver nanoparticles There are several manufacturing methods for AgNPs, but the mostly used method is the wet synthesis
method [34]. This method was outlined under section 1.2.3. When looking at Figure 1.5, it can be noted
that some substances are needed to be able to produce silver nanoparticles. First, a silver precursor is
needed. The precursor material is silver salt (AgNO3) [35]. Further, a reducing agent and a stabilizing
agent are needed. The reducing agent will reduce the silver ions to their non-valent form as described
under 1.2.3. The stabilizing agent functions as a surfactant, which will allow control of surface properties
of the nanoparticles (described under the Surfactant-section in 1.2.3). From literature, many possible
combinations of reducing agents and stabilizing agents can be found for this manufacturing method. For
this Bachelor research, three reducing agents were chosen: Trisodium Citrate (Na3C6H5O7), Ascorbic Acid
(C6H8O6), and Sodium Borohydride (NaBH4).
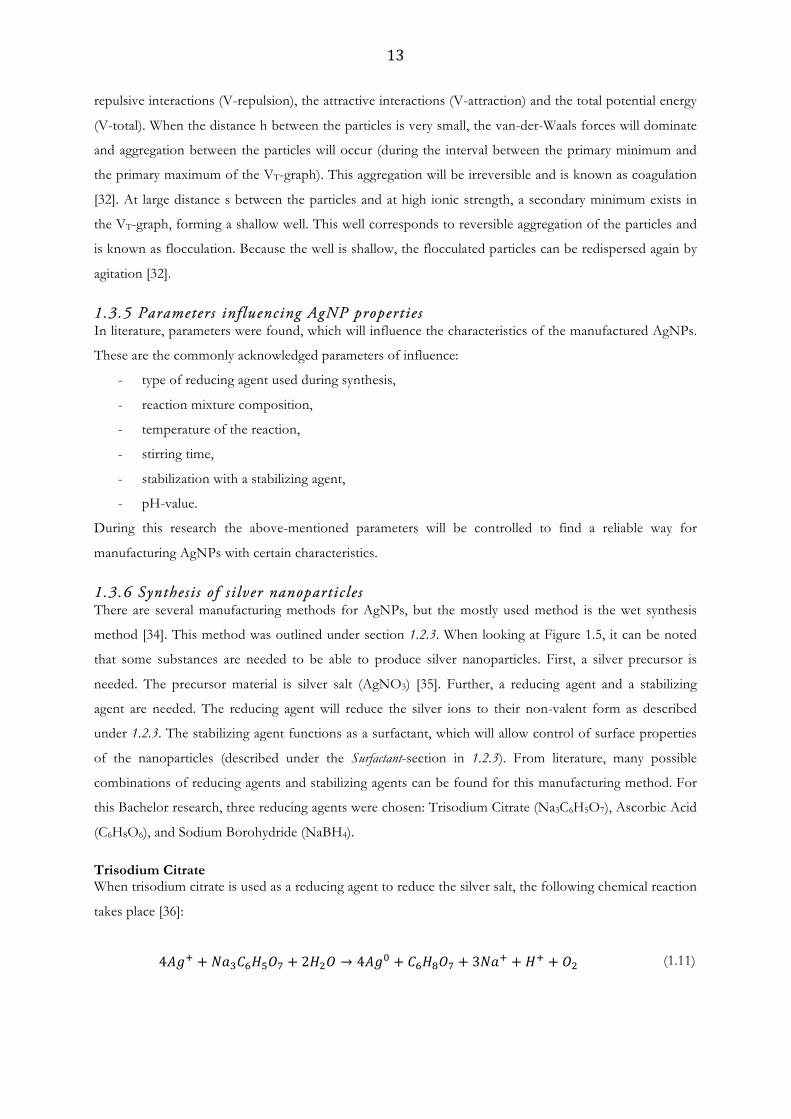
Trisodium Citrate When trisodium citrate is used as a reducing agent to reduce the silver salt, the following chemical reaction
takes place [36]:
4𝐴𝑔! + 𝑁𝑎!𝐶!𝐻!𝑂! + 2𝐻!𝑂 → 4𝐴𝑔! + 𝐶!𝐻!𝑂! + 3𝑁𝑎! + 𝐻! + 𝑂! (1.11)

14
The use of trisodium citrate for the manufacturing of silver colloids was already used back in 1951 [37]. In
the Turkevich method, trisodium citrate serves as a reducing agent as well as a stabilizing agent. It is quick
method for manufacturing silver nanoparticles and it does not require excessive laboratory skills.
Ascorbic Acid Chemically reducing the silver salt with ascorbic acid will yield the following chemical reaction [38]:
2𝐴𝑔! + 𝐶!𝐻!𝑂! ↔ 2𝐴𝑔! + 𝐶!𝐻!𝑂! + 2𝐻! (1.12)
From literature, some stabilizing agents were suggested in combination with ascorbic acid as reducing
agent and silver nitrate as silver salt [39,40,41]. For this research, trisodium citrate is chosen as the
stabilizing agent. From the Turkevich method, trisodium citrate was seen to function as a reducing agent
as well as a stabilizing agent. Thus the reaction conditions have to be such, that trisodium citrate is only
functioning as a stabilizer. From the Turkevich method, this is the case when the reaction temperature is
not elevated. At room temperature, for example, trisodium citrate will not reduce the silver salt.
Sodium Borohydride The chemical reduction of silver nitrate with sodium borohydride proceeds according to the following
chemical reaction [42]:
𝐴𝑔𝑁𝑂! + 𝑁𝑎𝐵𝐻! → 𝐴𝑔! +12𝐻! +
12𝐵!𝐻! + 𝑁𝑎𝑁𝑂! (1.13)
Stabilizing agents in combination with sodium borohydride as a reductant were found in literature [43-45].
For this research, trisodium citrate will be used as the stabilizing agent with sodium borohydride as a
reductant.
15
2. Experimental
2.1 Materials Three different reducing agents were used for the experiments. Sodium Citrate Tribasic Dihydrate, L-
Ascorbic Acid and Sodium Borohydride were all obtained from Sigma-Aldrich™. AgNO3, also obtained
from Sigma-Aldrich™, was used as the silver salt. Solutions were prepared by using deionized water
(Milli-Q, Millipore™). The solutions were stirred with a magnetic stir bar. The heaters and magnetic
stirrers, as well as the thermometers were from IKA™. 250 mL Erlenmeyer flasks from Schott Duran™
were used for the experimental solutions. For the reducing agent stock solutions, 2.0 L were. All labware
and glassware were thoroughly cleaned before use with Aqua Regia, followed by a thorough rinse with
deionized water. For characterization, an UV-Vis spectrophotometer from Varian Inc. and the Zetasizer
from Malvern Instruments™ were used. Measurements of the pH-value of the solutions were conducted
by using the 713 pH Meter from Metrohm AG™. Additionally, ice was used to chill the sodium
borohydride during experiments.
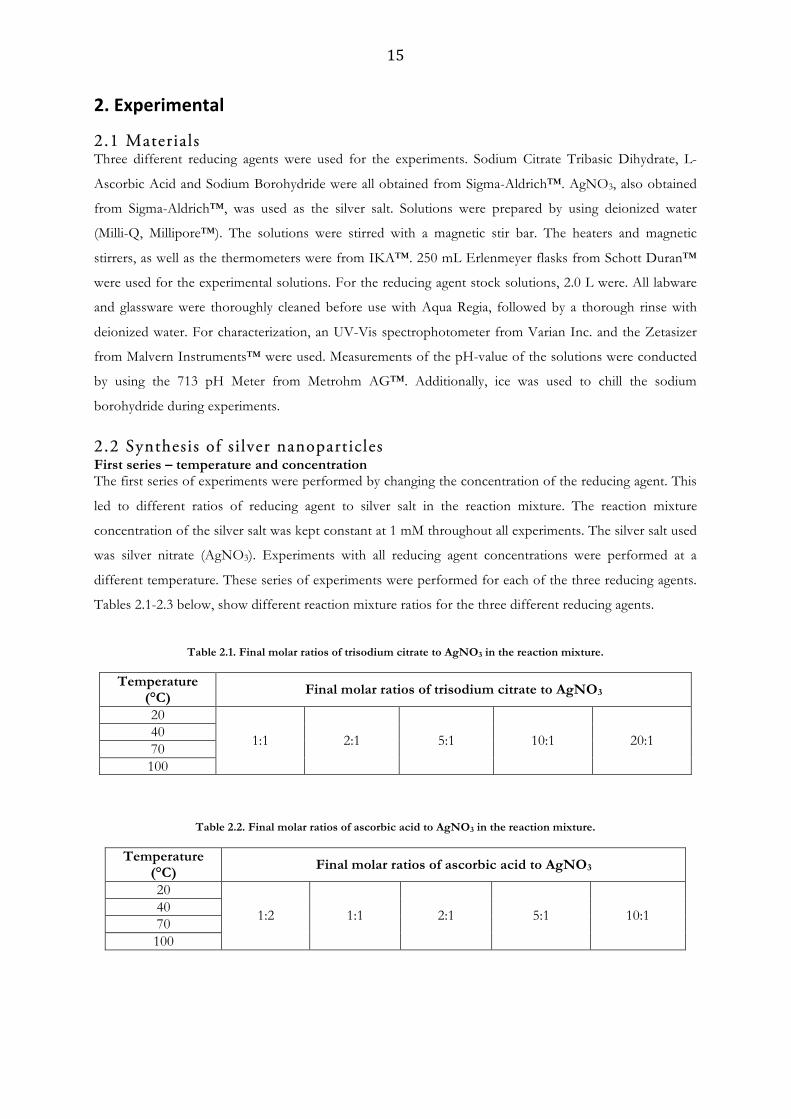
2.2 Synthesis of si lver nanoparticles First series – temperature and concentration The first series of experiments were performed by changing the concentration of the reducing agent. This
led to different ratios of reducing agent to silver salt in the reaction mixture. The reaction mixture
concentration of the silver salt was kept constant at 1 mM throughout all experiments. The silver salt used
was silver nitrate (AgNO3). Experiments with all reducing agent concentrations were performed at a
different temperature. These series of experiments were performed for each of the three reducing agents.
Tables 2.1-2.3 below, show different reaction mixture ratios for the three different reducing agents.
Table 2.1. Final molar ratios of trisodium citrate to AgNO3 in the reaction mixture.
Temperature (°C) Final molar ratios of trisodium citrate to AgNO3
20
1:1 2:1 5:1 10:1 20:1 40 70 100
Table 2.2. Final molar ratios of ascorbic acid to AgNO3 in the reaction mixture.
Temperature (°C) Final molar ratios of ascorbic acid to AgNO3
20
1:2 1:1 2:1 5:1 10:1 40 70 100
16
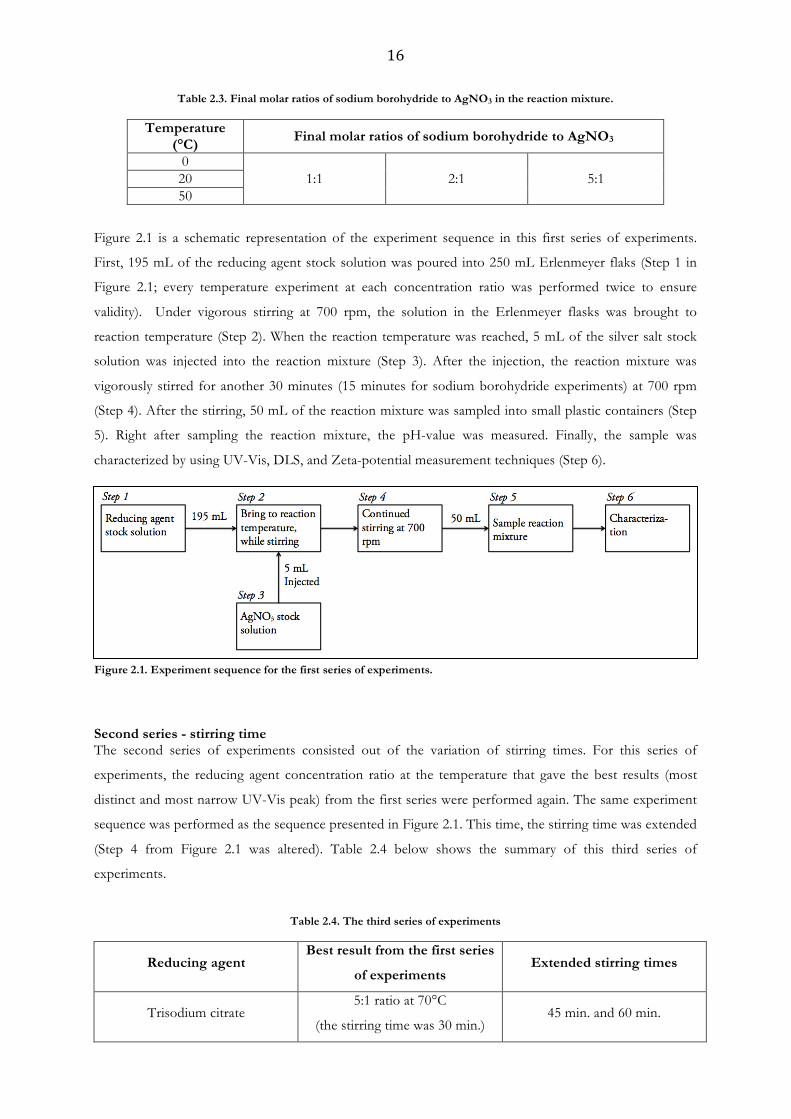
Table 2.3. Final molar ratios of sodium borohydride to AgNO3 in the reaction mixture.
Temperature (°C) Final molar ratios of sodium borohydride to AgNO3
0 1:1 2:1 5:1 20
50
Figure 2.1 is a schematic representation of the experiment sequence in this first series of experiments.
First, 195 mL of the reducing agent stock solution was poured into 250 mL Erlenmeyer flaks (Step 1 in
Figure 2.1; every temperature experiment at each concentration ratio was performed twice to ensure
validity). Under vigorous stirring at 700 rpm, the solution in the Erlenmeyer flasks was brought to
reaction temperature (Step 2). When the reaction temperature was reached, 5 mL of the silver salt stock
solution was injected into the reaction mixture (Step 3). After the injection, the reaction mixture was
vigorously stirred for another 30 minutes (15 minutes for sodium borohydride experiments) at 700 rpm
(Step 4). After the stirring, 50 mL of the reaction mixture was sampled into small plastic containers (Step
5). Right after sampling the reaction mixture, the pH-value was measured. Finally, the sample was
characterized by using UV-Vis, DLS, and Zeta-potential measurement techniques (Step 6).
Second series - stirring time The second series of experiments consisted out of the variation of stirring times. For this series of
experiments, the reducing agent concentration ratio at the temperature that gave the best results (most
distinct and most narrow UV-Vis peak) from the first series were performed again. The same experiment
sequence was performed as the sequence presented in Figure 2.1. This time, the stirring time was extended
(Step 4 from Figure 2.1 was altered). Table 2.4 below shows the summary of this third series of
experiments.
Table 2.4. The third series of experiments
Reducing agent Best result from the first series
of experiments Extended stirring times
Trisodium citrate 5:1 ratio at 70°C
(the stirring time was 30 min.) 45 min. and 60 min.
Figure 2.1. Experiment sequence for the first series of experiments.
17
Ascorbic acid 1:2 ratio at 20°C
(the stirring time was 30 min.) 45 min. and 60 min.
Sodium borohydride 2:1 ratio at 0°C
(the stirring time was 15 min.) 30 min. and 45 min.
Third series - pH Again, the experiments with the best reducing agent concentration ratio and temperature obtained from
the first series of experiments were performed. The same experiment steps were performed as the steps
shown in Figure 2.1. The only difference was Step 2 in Figure 2.1; the pH-value was altered by adding
highly concentrated HNO3 or NaOH solution before the 195 mL of reducing agent stock solution was
brought to reaction temperature. Table 2.5 below shows the different pH-values that were experimented.
Table 2.5. The second series of experiments
Reducing agent Best result from the first series
of experiments Experimented pH-values
Trisodium citrate 5:1 ratio at 70°C
(the pH-value was 9) pH = 5,6,7,8,10
Ascorbic acid 1:2 ratio at 20°C
(the pH-value was 3.5) pH = 5,6,7,8,9,10
Sodium borohydride 2:1 ratio at 0°C
(the pH-value was 8) pH = 5,6,7,9,10
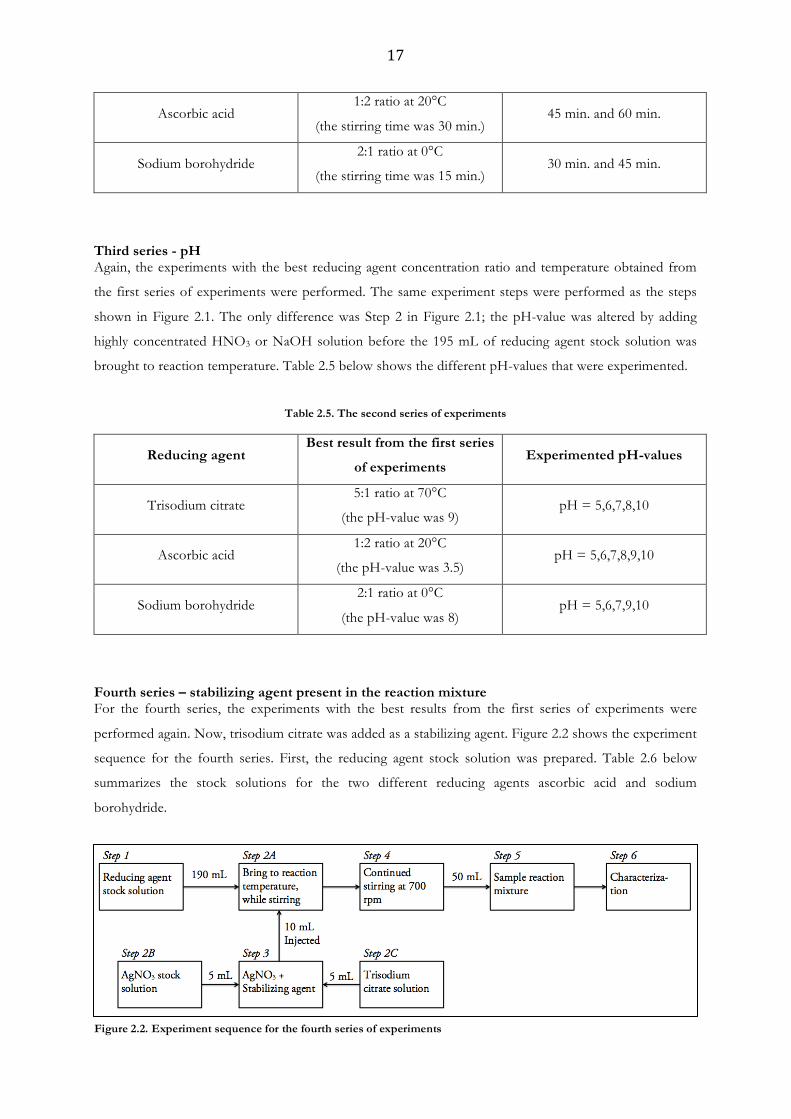
Fourth series – stabilizing agent present in the reaction mixture For the fourth series, the experiments with the best results from the first series of experiments were
performed again. Now, trisodium citrate was added as a stabilizing agent. Figure 2.2 shows the experiment
sequence for the fourth series. First, the reducing agent stock solution was prepared. Table 2.6 below
summarizes the stock solutions for the two different reducing agents ascorbic acid and sodium
borohydride.
Figure 2.2. Experiment sequence for the fourth series of experiments

18
For Step 1 in Figure 2.2, 190 mL of reducing agent stock solution was poured into 250 mL Erlenmeyer
flasks. This solution was brought to reaction temperature (20°C for the ascorbic acid experiments and 0°C
for the sodium borohydride experiments, Step 2A in Figure 2.2).
Table 2.6. Reducing agent stock solutions for the fourth series of experiments
Reducing agent Final molar ratios of reducing agent to AgNO3 Ascorbic acid 1:2
Sodium borohydride 2:1
Simultaneously with Step 2A, 5 mL of trisodium citrate solution and 5mL of silver salt stock solution were
put in a 50 mL beaker (Step 2B and 2C). Table 2.7 below shows the composition of the trisodium citrate
solution. The silver salt stock solution was prepared as in the previous experiment series. The silver salt
solution, containing the stabilizing agent was then injected into the reaction mixture, which has reached
the reaction temperature (Step 3). The experiment sequence was completed as in the first experiment
series.
Table 2.7. Stabilizing agent solutions for the fourth series of experiments
Reducing agent Stabilizing agent (concentration in the final
reaction mixture)
Ascorbic acid 0.25 mM, 0.5 mM, 0.75 mM, 1.0 mM trisodium
citrate
Sodium borohydride 0.5 mM, 0.75 mM, 1.0 mM trisodium
Fifth series – stabilizing agent added after particle formation The fifth series of experiments was performed like the fourth series, except for the order of addition for
the stabilizing agent. In this experiment series, the stabilizing agent was added after particle formation
(Step 5 in Figure 2.3). Figure 2.3 is a schematic representation of the fifth series of experiments.
Figure 2.3. Experiment sequence for the fifth series of experiments
19
3. Results and discussion
3.1 Trisodium citrate
3.1.1 Effect of temperature and reducing agent concentration During the experiments, colour changes in the solutions were noticeable. At lower concentrations of the
reductant (1:1 and 2:1 ratio) and low reaction temperatures (20°C and 40°C), the solutions were
colourless. However, after a week the solutions turned very dark with a reddish glow, indicating an
extremely slow formation of nanoparticles. Right after the experiment, there was mainly unreacted
AgNO3 in solution. As was mentioned before, trisodium citrate has a dual role here; it functions as a
reducing agent as well as a stabilizing agent. Aggregation (very dark colour after a week) is occurring,
because the amount of trisodium citrate is too low to effectively function as a stabilizer. Furthermore, at
low concentrations of trisodium citrate, Ag+-ions tend to form complexes with trisodium citrate, (Ag2+-
citrate), which leads to formation of larger clusters of silver [46]. When the same ratios (1:1 and 2:1 ratio)
were experimented, but at higher temperatures (70°C and 100°C), the samples showed the same
behaviour as described above, only the colour change was seen after a shorter amount of time (after less
than three days), indicating faster particle formation due to faster reaction kinetics.
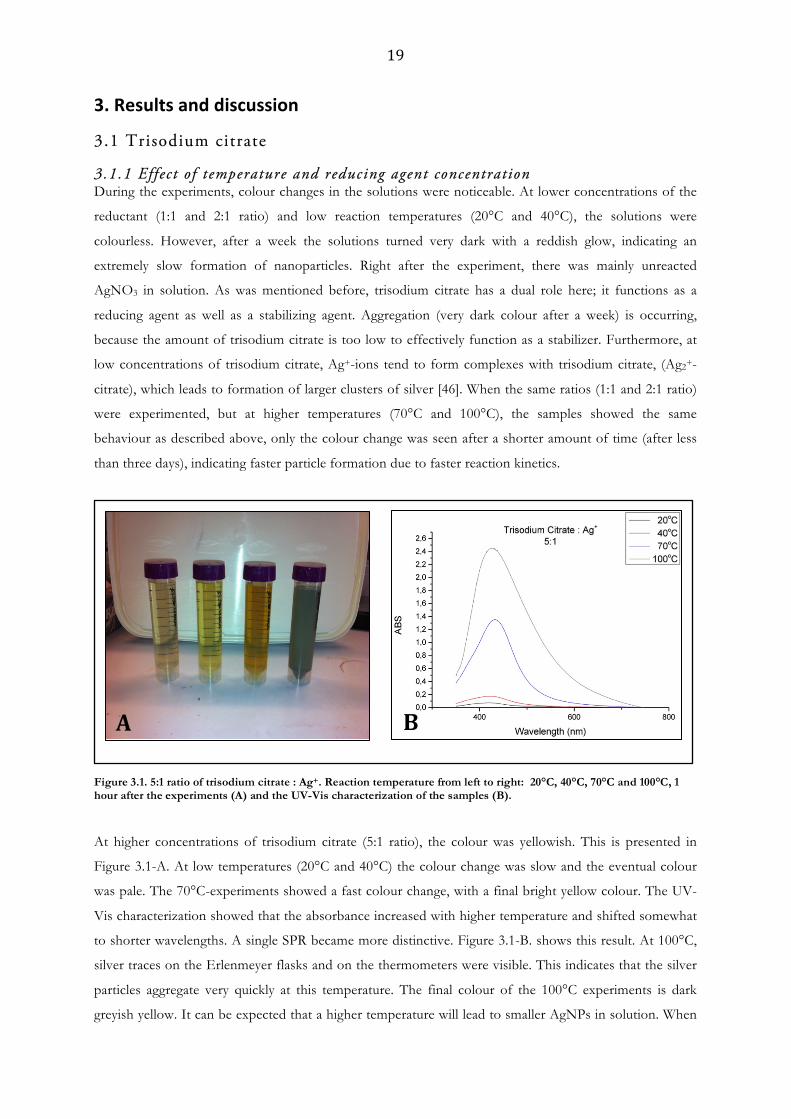
At higher concentrations of trisodium citrate (5:1 ratio), the colour was yellowish. This is presented in
Figure 3.1-A. At low temperatures (20°C and 40°C) the colour change was slow and the eventual colour
was pale. The 70°C-experiments showed a fast colour change, with a final bright yellow colour. The UV-
Vis characterization showed that the absorbance increased with higher temperature and shifted somewhat
to shorter wavelengths. A single SPR became more distinctive. Figure 3.1-B. shows this result. At 100°C,
silver traces on the Erlenmeyer flasks and on the thermometers were visible. This indicates that the silver
particles aggregate very quickly at this temperature. The final colour of the 100°C experiments is dark
greyish yellow. It can be expected that a higher temperature will lead to smaller AgNPs in solution. When
Figure 3.1. 5:1 ratio of trisodium citrate : Ag+. Reaction temperature from left to right: 20°C, 40°C, 70°C and 100°C, 1 hour after the experiments (A) and the UV-Vis characterization of the samples (B).
A B

20
equation (1.4) is differentiated with respect to r and then set equal to zero, the critical radius (mentioned in
the Homogeneous nucleation-section, under 1.2.3) can be obtained:
𝑟! =−2𝛾∆𝐺!
(3.1)
From equation (1.3) it can be seen that a higher temperature will lead to a more negative ΔGv. When
looking at equation (3.1) it can be expected that this will lead to a smaller rc, which is the smallest possible
size of the AgNPs in solution. Paradoxically, very high temperatures will not lead to very small particles as
the temperature may become too high, leading to extremely fast aggregation. The reason for this is that
high temperature will lead to too high reaction kinetics. The fast reaction kinetics make it impossible to
control the growth stage of the crystallization process, leading to uncontrolled and fast aggregation. Even
though there are small AgNPs present, this is for an extremely short period of time. The final solution will
be dominated by large particles. Also, the high reaction kinetics will lead to a larger diversity of particle
sizes than is the case with the samples from the 70°C-experiments. This leads to a broader SPR peak and
the darker colour of the sample.
When the ratio was higher than 5:1, the particles aggregated quickly. The explanation for this occurrence
is the fact that a high concentration of reducing agent will lead to a large amount of primary particles (see
Growth-section under 1.2.3). The very high amount of primary particles will show a tendency to aggregate
with each other to form large secondary particles as outlined in equation (1.7). This result is in line with
research from Zhang et al. [47]. The best result was thus obtained at the 5:1 ratio and at 70°C. Figure 3.2
shows the UV-Vis and the DLS characterization of the 5:1 ratio sample, at 70°C for two different points
in time. It can be seen from Figure 3.2-A that the graph of the sample has a wider SPR peak after 5 days.
Also, another small SPR peak shows at 720 nm indicating that some of the particles have aggregated. This
is supported by Figure 3.2-B, which indicates a somewhat wider particle size distribution for the 70°C
sample after 5 days (red graph). Also, the mean particle size of the solution has increased slightly; the 70°C
Figure 3.2. UV-Vis graphs of the 70°C sample, characterized at different points in time (A) and the DLS graphs of the same sample. The black graph shows the characterization after 1 hour. The red graph shows the characterization after 5 days (B).
A B
21
sample contains AgNPs with mean size of 36 nm, within 1 hour after the completion of the experiment
(black graph). The red graph indicates that the mean particle size has increased after 5 days; the mean
particle size is 41 nm now. Furthermore, Figure 3.2-B shows that after 5 days the aggregate has increased
(the second, small bump in the graph around 100 nm).
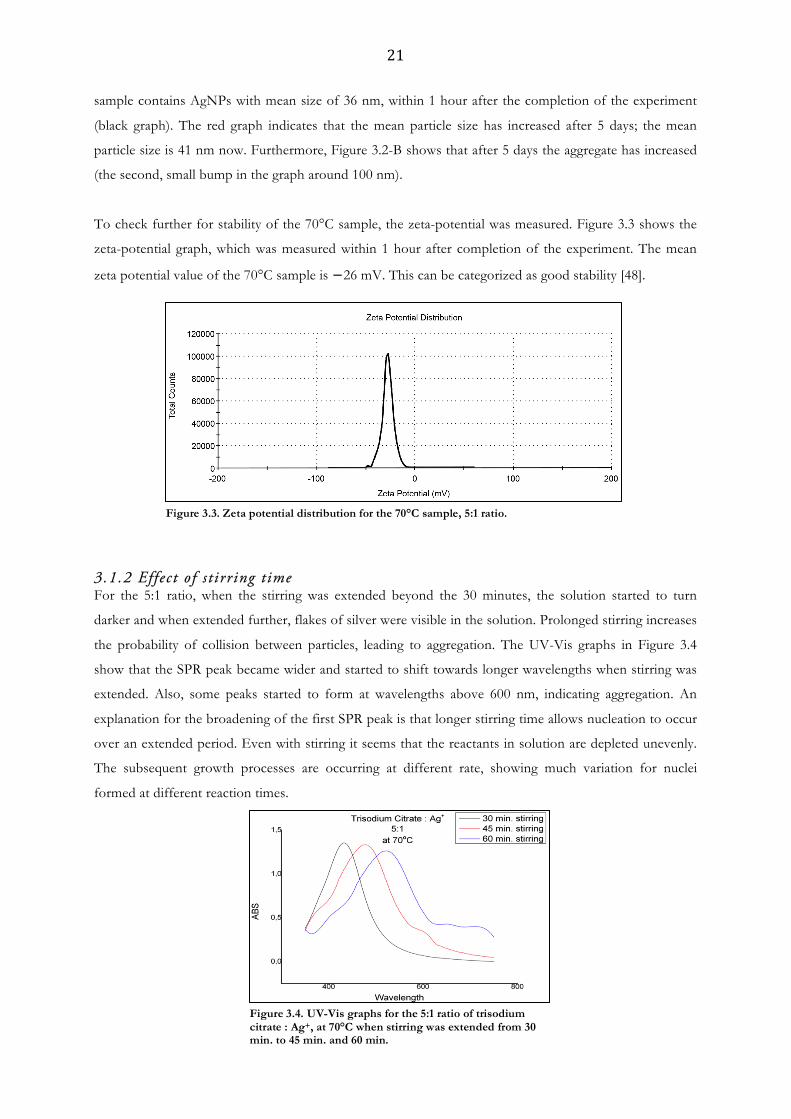
To check further for stability of the 70°C sample, the zeta-potential was measured. Figure 3.3 shows the
zeta-potential graph, which was measured within 1 hour after completion of the experiment. The mean
zeta potential value of the 70°C sample is −26 mV. This can be categorized as good stability [48].
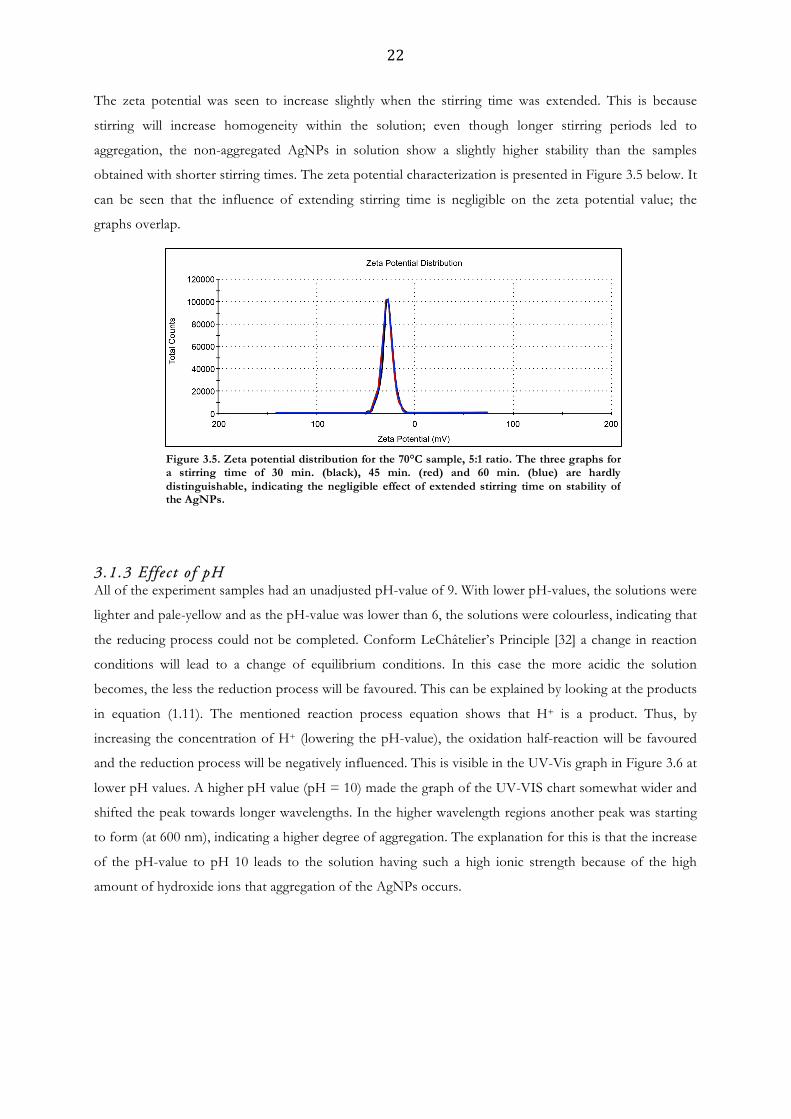
3.1.2 Effect of s tirring time For the 5:1 ratio, when the stirring was extended beyond the 30 minutes, the solution started to turn
darker and when extended further, flakes of silver were visible in the solution. Prolonged stirring increases
the probability of collision between particles, leading to aggregation. The UV-Vis graphs in Figure 3.4
show that the SPR peak became wider and started to shift towards longer wavelengths when stirring was
extended. Also, some peaks started to form at wavelengths above 600 nm, indicating aggregation. An
explanation for the broadening of the first SPR peak is that longer stirring time allows nucleation to occur
over an extended period. Even with stirring it seems that the reactants in solution are depleted unevenly.
The subsequent growth processes are occurring at different rate, showing much variation for nuclei
formed at different reaction times.
Figure 3.4. UV-Vis graphs for the 5:1 ratio of trisodium citrate : Ag+, at 70°C when stirring was extended from 30 min. to 45 min. and 60 min.
Figure 3.3. Zeta potential distribution for the 70°C sample, 5:1 ratio.
22
The zeta potential was seen to increase slightly when the stirring time was extended. This is because
stirring will increase homogeneity within the solution; even though longer stirring periods led to
aggregation, the non-aggregated AgNPs in solution show a slightly higher stability than the samples
obtained with shorter stirring times. The zeta potential characterization is presented in Figure 3.5 below. It
can be seen that the influence of extending stirring time is negligible on the zeta potential value; the
graphs overlap.
3.1.3 Effect of pH All of the experiment samples had an unadjusted pH-value of 9. With lower pH-values, the solutions were
lighter and pale-yellow and as the pH-value was lower than 6, the solutions were colourless, indicating that
the reducing process could not be completed. Conform LeChâtelier’s Principle [32] a change in reaction
conditions will lead to a change of equilibrium conditions. In this case the more acidic the solution
becomes, the less the reduction process will be favoured. This can be explained by looking at the products
in equation (1.11). The mentioned reaction process equation shows that H+ is a product. Thus, by
increasing the concentration of H+ (lowering the pH-value), the oxidation half-reaction will be favoured
and the reduction process will be negatively influenced. This is visible in the UV-Vis graph in Figure 3.6 at
lower pH values. A higher pH value (pH = 10) made the graph of the UV-VIS chart somewhat wider and
shifted the peak towards longer wavelengths. In the higher wavelength regions another peak was starting
to form (at 600 nm), indicating a higher degree of aggregation. The explanation for this is that the increase
of the pH-value to pH 10 leads to the solution having such a high ionic strength because of the high
amount of hydroxide ions that aggregation of the AgNPs occurs.
Figure 3.5. Zeta potential distribution for the 70°C sample, 5:1 ratio. The three graphs for a stirring time of 30 min. (black), 45 min. (red) and 60 min. (blue) are hardly distinguishable, indicating the negligible effect of extended stirring time on stability of the AgNPs.

23
When the zeta potential was measured (Figure 3.7), it showed that the stability of the AgNPs in solution
decreased with more acidic pH-values. The stability increases with higher pH, because a higher pH-value
leads to a higher concentration of OH--ions in solution. This leads to a higher electrostatic repulsion
between particles through the increased thickness of the double layers (section 1.3.4) and thus to higher
stability of the solution. However, the stability of the sample with pH 10 was lower than the stability of
the pH 9 sample. These results were expected from the solution colours and the UV-Vis characterization.
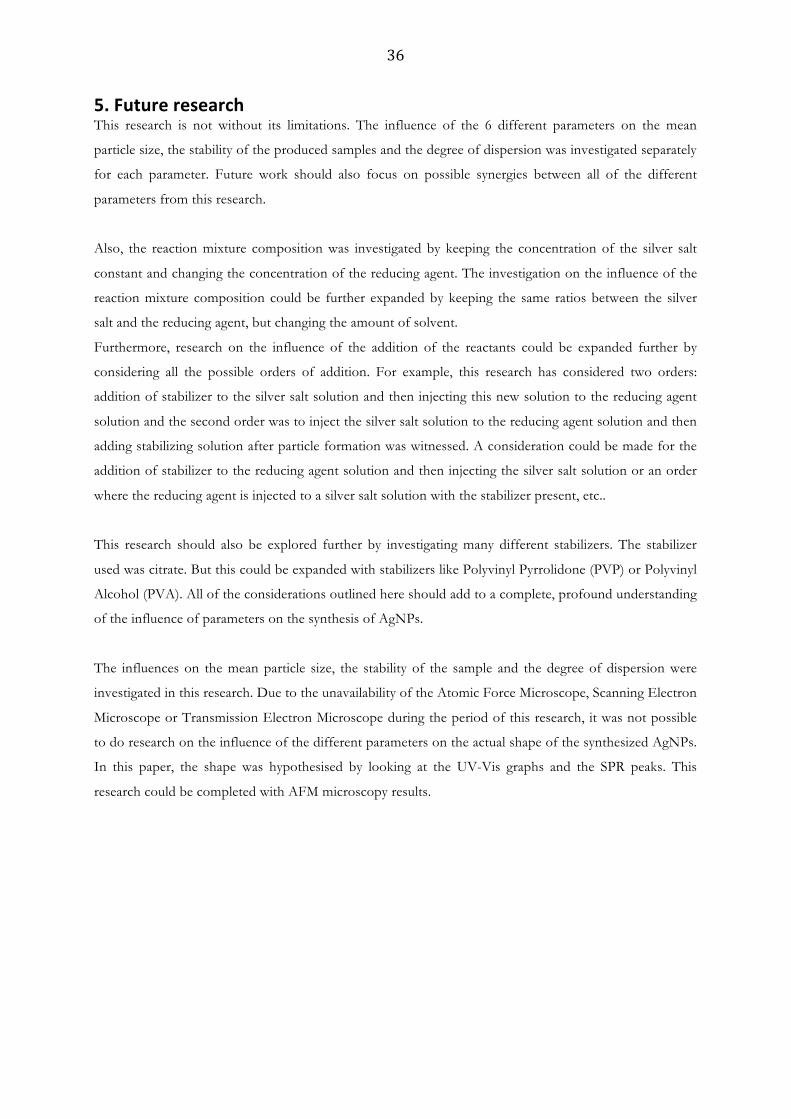
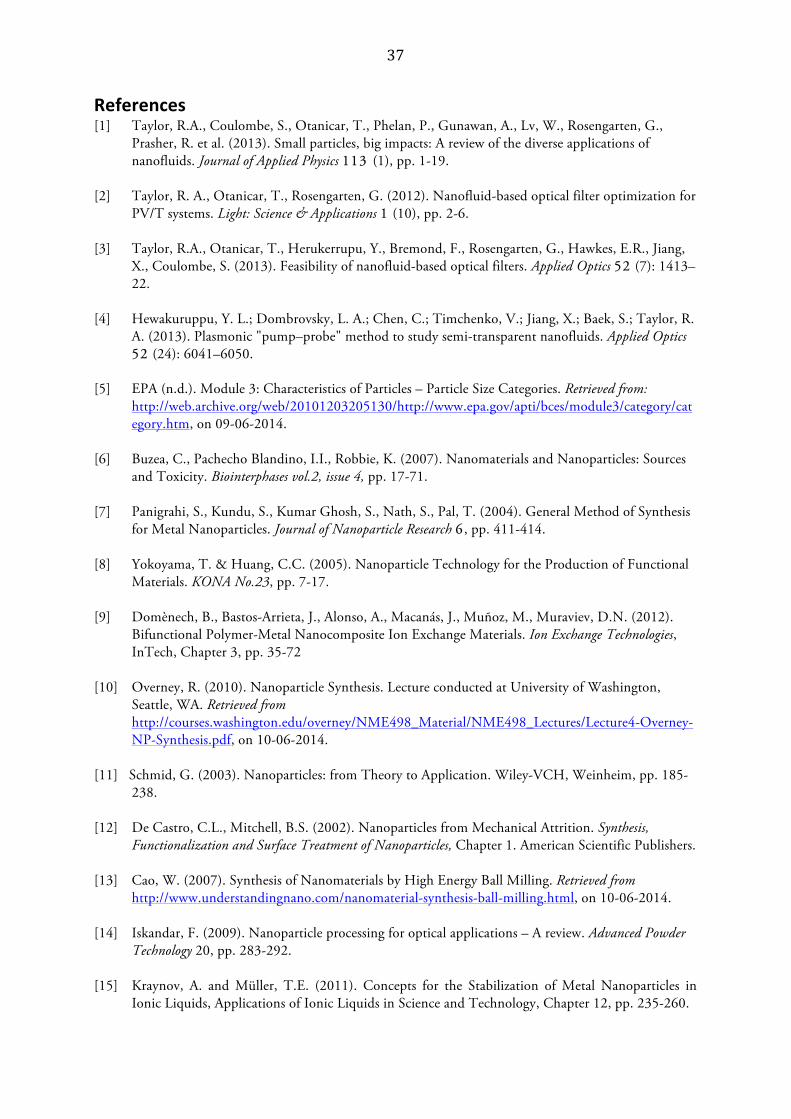
Figure Appendix 1, Appendix 2 and Appendix 3 show an overview of the influence of different
parameters on the mean particle diameter, zeta potential (indicating stability) and FWHM (mentioned
under 1.3.2) of the UV-Vis characterization (indicating the degree of dispersion) for the 5:1 ratio. The
stirring time and the pH influences presented, are for the 5:1 ratio at 70°C.
Figure 3.6. UV-Vis graphs for the 5:1 ratio of trisodium citrate : Ag+, at 70°C and different pH values
Figure 3.7. Zeta potential distribution for the 70°C sample, 5:1 ratio at different pH values.
24
3.2 Ascorbic acid
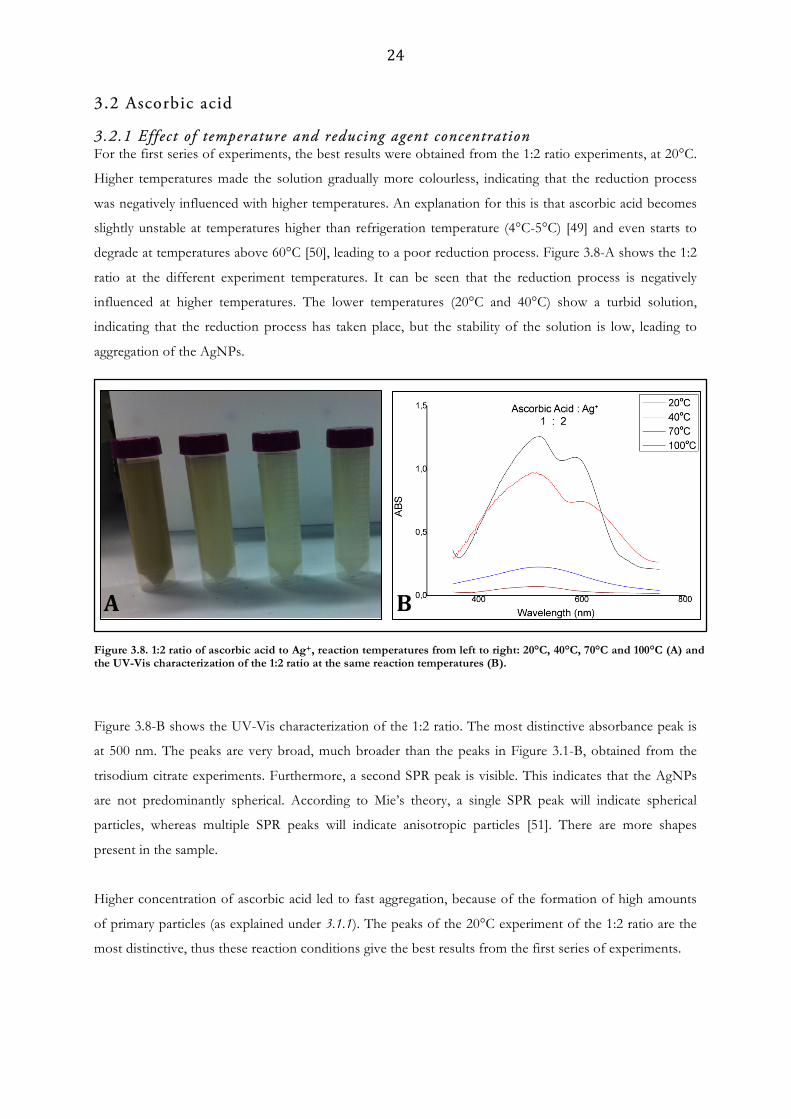
3.2.1 Effect of temperature and reducing agent concentration For the first series of experiments, the best results were obtained from the 1:2 ratio experiments, at 20°C.
Higher temperatures made the solution gradually more colourless, indicating that the reduction process
was negatively influenced with higher temperatures. An explanation for this is that ascorbic acid becomes
slightly unstable at temperatures higher than refrigeration temperature (4°C-5°C) [49] and even starts to
degrade at temperatures above 60°C [50], leading to a poor reduction process. Figure 3.8-A shows the 1:2
ratio at the different experiment temperatures. It can be seen that the reduction process is negatively
influenced at higher temperatures. The lower temperatures (20°C and 40°C) show a turbid solution,
indicating that the reduction process has taken place, but the stability of the solution is low, leading to
aggregation of the AgNPs.
Figure 3.8-B shows the UV-Vis characterization of the 1:2 ratio. The most distinctive absorbance peak is
at 500 nm. The peaks are very broad, much broader than the peaks in Figure 3.1-B, obtained from the
trisodium citrate experiments. Furthermore, a second SPR peak is visible. This indicates that the AgNPs
are not predominantly spherical. According to Mie’s theory, a single SPR peak will indicate spherical
particles, whereas multiple SPR peaks will indicate anisotropic particles [51]. There are more shapes
present in the sample.
Higher concentration of ascorbic acid led to fast aggregation, because of the formation of high amounts
of primary particles (as explained under 3.1.1). The peaks of the 20°C experiment of the 1:2 ratio are the
most distinctive, thus these reaction conditions give the best results from the first series of experiments.
Figure 3.8. 1:2 ratio of ascorbic acid to Ag+, reaction temperatures from left to right: 20°C, 40°C, 70°C and 100°C (A) and the UV-Vis characterization of the 1:2 ratio at the same reaction temperatures (B).
A B
25
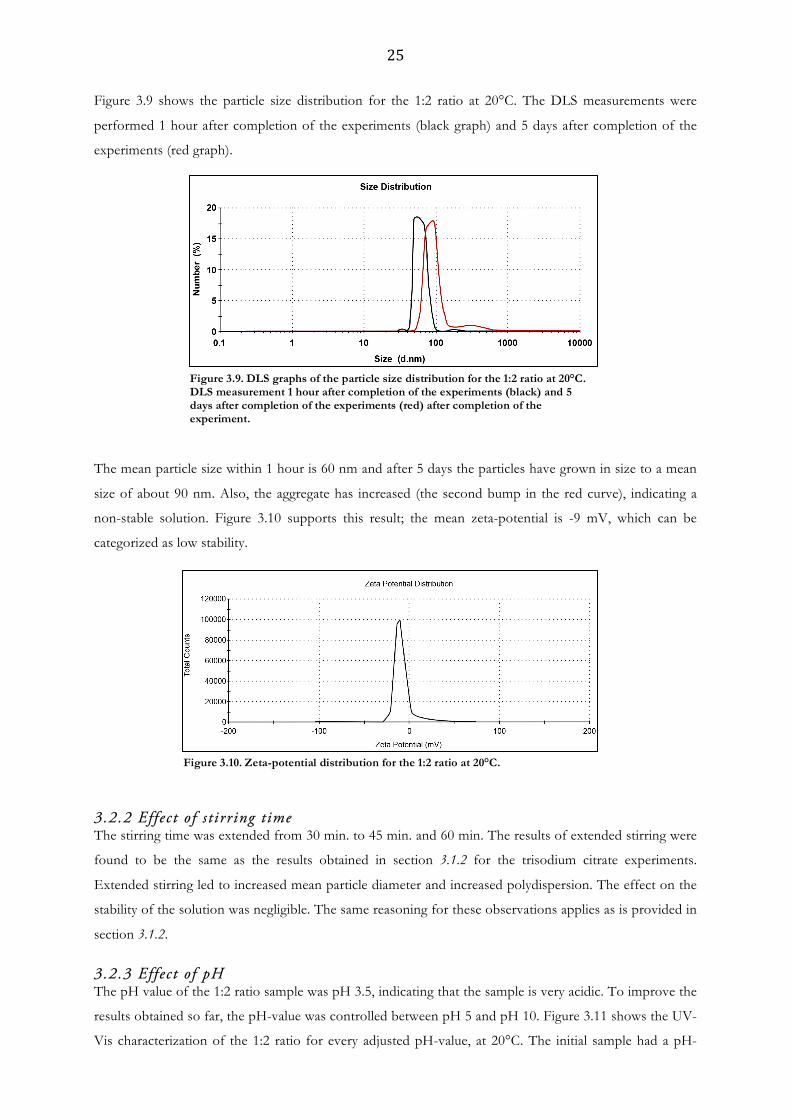
Figure 3.9 shows the particle size distribution for the 1:2 ratio at 20°C. The DLS measurements were
performed 1 hour after completion of the experiments (black graph) and 5 days after completion of the
experiments (red graph).
The mean particle size within 1 hour is 60 nm and after 5 days the particles have grown in size to a mean
size of about 90 nm. Also, the aggregate has increased (the second bump in the red curve), indicating a
non-stable solution. Figure 3.10 supports this result; the mean zeta-potential is -9 mV, which can be
categorized as low stability.
3.2.2 Effect of s tirring time The stirring time was extended from 30 min. to 45 min. and 60 min. The results of extended stirring were
found to be the same as the results obtained in section 3.1.2 for the trisodium citrate experiments.
Extended stirring led to increased mean particle diameter and increased polydispersion. The effect on the
stability of the solution was negligible. The same reasoning for these observations applies as is provided in
section 3.1.2.
3.2.3 Effect of pH The pH value of the 1:2 ratio sample was pH 3.5, indicating that the sample is very acidic. To improve the
results obtained so far, the pH-value was controlled between pH 5 and pH 10. Figure 3.11 shows the UV-
Vis characterization of the 1:2 ratio for every adjusted pH-value, at 20°C. The initial sample had a pH-
Figure 3.9. DLS graphs of the particle size distribution for the 1:2 ratio at 20°C. DLS measurement 1 hour after completion of the experiments (black) and 5 days after completion of the experiments (red) after completion of the experiment.
Figure 3.10. Zeta-potential distribution for the 1:2 ratio at 20°C.

26
value of 3.5. It can be seen from the figure that the increase in pH-value leads to a shift in the surface
plasmon towards shorter wavelengths of the first SPR peak. The decrease in full width at half maximum
(FWHM) indicates a smaller particle size distribution. The reason for better results with increased pH can
be seen from equation (1.12). H+ is a product, thus increasing the pH will positively influence the
reduction process (also see section 3.1.3). The second peak in Figure 3.11 is slowly disappearing with
increased pH, indicating that pH is also influencing the shape of the AgNPs present in the solution; at
high pH-values, the AgNPs have the tendency to become spherical. This observation is very much in line
with the results obtained by Qin et al. [39]. The reason for the influence of pH on shape can be found in
the improved functioning of the reducing agent at higher pH values. The most distinct peak is seen with
pH 10. When looking at the influence of pH on the AgNP solution in section 3.1.3, it was seen that pH
10 led to aggregation of the AgNPs, because of a high ionic strength of the solution. In this case, the pH
10 value does not lead to aggregation of the particles; it shows to be beneficial. An explanation for this
could be that the improved reducing process leads to a higher amount of Ag+-ions being reduced, than
was the case with trisodium citrate as reducing agent at the pH 10 value. This leads to an overall smaller
amount of ions in solution. So, the ionic strength at which aggregation would occur is not yet reached
with a value of pH 10.
Figure 3.12 shows the size distribution graph for the 1:2 ratio at 20°C with pH 10. Comparing Figure 3.12
with Figure 3.10, it can be seen that the size distribution shows a much sharper peak. Also, the mean
particle diameter is 30 nm with the increased pH-value, instead of 60 nm when the pH is not adjusted.
The average size of the particles has decreased with higher pH, because the reduction process is favoured,
leading to smaller nuclei. Also, the overall speed of the crystallization process is increased with higher pH
[52]. This leads to a more monodisperse solution, thereby explaining the decreased width of the size
distribution graph with higher pH. A slow crystallization process will lead to uneven depletion of reactants
and will ensure polydispersion.
Figure 3.11. UV-Vis characterization for different pH-values.

27
3.2.4 Effect of s tabilizer The UV-Vis characterization of the third series of experiments with trisodium citrate as stabilizer is shown
in Figure 3.13-A. The stabilizer was added to the AgNO3 solution, before this solution was injected to the
ascorbic acid (please refer to section 2.2 for a more detailed description of these experiment series). Figure
3.13-A shows that the addition of stabilizer shifts the plasmon resonance towards shorter wavelengths.
Furthermore, the trisodium citrate seems to influence the composition of the sample; the AgNPs are
becoming more spherical. The explanation for this occurrence is the fact that the trisodium citrate is
capping the particles during formation (more information on capping in the Surfactant-section under 1.2.3).
Also, the peak becomes narrower, indicating a more monodisperse solution. This is due to capping, which
allows for more controlled growth. Figure 3.13-B shows the UV-Vis characterization of the 1:2 ratio at
20°C with the stabilizer added after formation of particles in the reaction mixture. It can be seen from the
figure that the effect of the stabilizer addition is slightly less than is the case when the stabilizer is already
present in the reaction mixture before the reaction takes place (Figure 3.13-A). This is due to the fact that
in this case, the trisodium citrate is not capping the particles; growth has already (partly) taken place.
Figure 3.12. DLS graph of the particle size distribution for the 1:2 ratio at 20°C, pH10.
Figure 3.13. UV-Vis characterization of the 1:2 ratio of ascorbic acid to Ag+, at 20°C for different stabilizer concentrations – stabilizer was present in the reaction mixture (A) and the UV-Vis characterization for the situation when the stabilizer was added after particle formation (B).
A B

28
Figure 3.14 shows the particle size distribution of the 1:2 ratio at 20°C for the sample with 1.0 mM of
stabilizer present in the reaction mixture (green curve) and the sample with 1.0 mM of stabilizer when
added after particle formation (red curve). The mean particle sizes are 51nm and 52 nm, respectively.
For the first series of experiments of 1:2 at 20°C, without the controlled pH and added stabilizer, the
plastic sample container was covered with a mirror layer at the interior after one day, indicating fast
aggregation and low stability. When the pH was adjusted to pH 10, the silver mirror layer did not show,
even after a week. This increased stability is supported by the zeta-potential characterization and displayed
in Figure 3.15. The black curve shows the zeta-potential distribution for the sample without the controlled
pH and added stabilizer, the mean zeta-potential is -9mV. This is categorized as a low stability. The red
curve corresponds to the sample with 1.0 mM of stabilizer, when added after particle formation; the mean
zeta-potential is −20 mV, which is categorized as moderate stability. The orange curve represents the
zeta-potential for the sample with 1.0mM stabilizer, already present in the reaction mixture. The stability
has slightly increased; the mean zeta-potential is -22 mV. This can be seen as good stability. The largest
stability improvement is seen when the pH-value was adjusted to pH 10 (blue curve); the mean zeta-
potential is -24mV and this sample is in the category of good stability.
Figure 3.14. DLS graph of the particle size distribution of the 1:2 ratio at 20°C, for 1.0 mM of stabilizer present in the reaction mixture (black curve) and 1.0 mM of stabilizer when added after particle formation (red curve).
Figure 3.15. Zeta-potential distribution of the 1:2 ratio at 20°C for the sample without controlled pH and without added stabilizer (black curve), the sample with added stabilizer after particle formation (red curve), the sample with stabilizer present in the reaction mixture (orange curve) and the sample without stabilizer and pH10 (blue curve).

29
From the results presented in Figure 3.14 it shows that the order stabilizer addition very slightly influences
the final size of the AgNPs and from Figure 3.15 the same can be concluded for the stability of the
solution. As the reaction rate of the crystallization process is larger than the rate of the reduction process
(ascorbic acid is considered a weak reducing agent), the stabilizer should be present in the reaction mixture
for better results. As the stabilizer is added after particle formation, much of the particles have already
grown in size, leading to a slightly less effect of the stabilizer. Furthermore, trisodium citrate is a reducing
agent as well as a stabilizing agent, but as was seen from the results in the previous section, trisodium
citrate will not be able to reduce Ag+-ions at this temperature (20°C). This leaves trisodium citrate to
function solely as a stabilizer.
Figure Appendix 4, Appendix 5 and Appendix 6 show an overview of the influence of different
parameters on the mean particle diameter, zeta potential (indicating stability) and FWHM of the UV-Vis
characterization (indicating particle dispersion), respectively for the 1:2 ratio. The stirring time, pH and
stabilizer influences presented, are for the 1:2 ratio at 20°C.
3.3 Sodium borohydride
3.3.1 Effect of temperature and reducing agent concentration When the first series of experiments was performed, colour changes were noticeable right after injection
of the AgNO3 solutions. At 0°C, the 1:1 ratio did not show a colour change at first, but slowly after the
experiment was completed, the solution changed to a very light pale yellow, indicating that the reduction
process with this ratio is slow. The 2:1 ratio showed a quick colour change to yellow after the AgNO3
solution was injected at 0°C. The 5:1 ratio became very quickly dark and turbid after injection of AgNO3
at 0°C, indicating a violent reaction from the sodium borohydride. The explanation for this occurrence is
the fact that sodium borohydride is a very strong reducing agent [53].
At higher temperatures for every ratio the solution became almost instantaneously very dark coloured and
turbid, indicating aggregation. The combination of reducing strength of sodium borohydride and high
reaction temperatures leads to a very violent reaction, causing the reducing agent to be less selective and
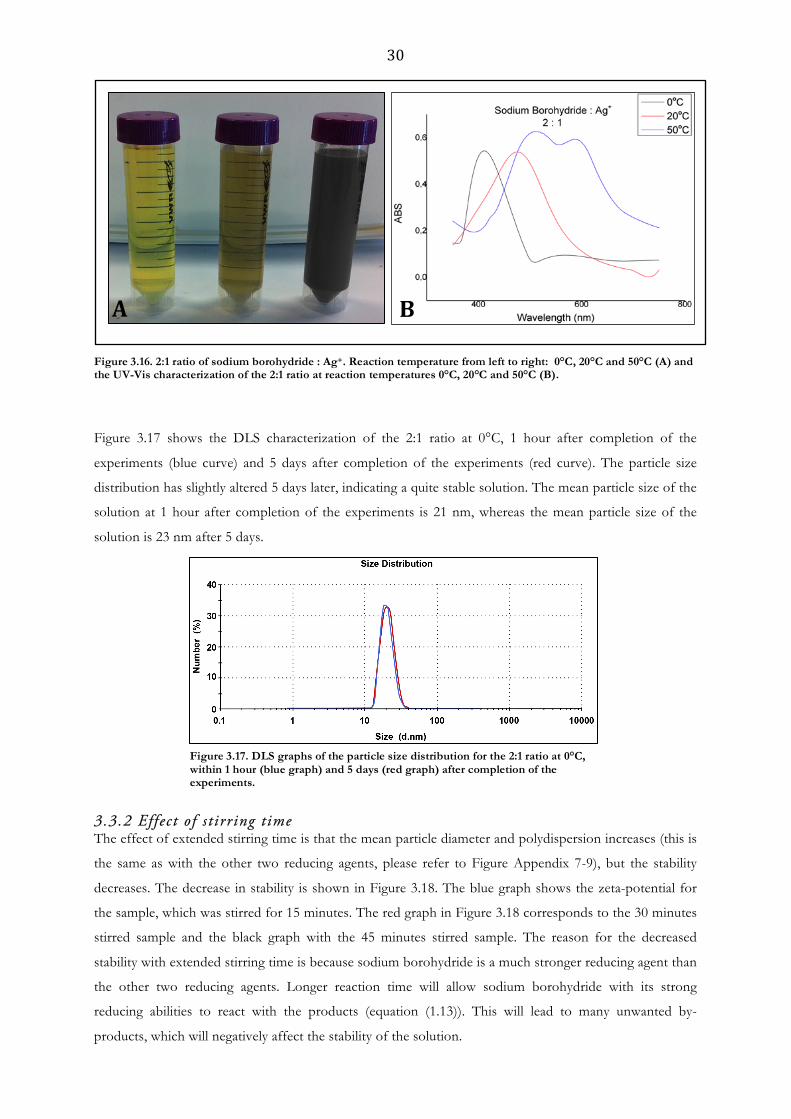
possibly reacting with the nitrate as well (please refer to equation (1.13)). The ratio 2:1 at 0°C gave the best
results. The colour of the solution was bright yellow. Figure 3.16-A shows the 2:1 ratio at the 0°C, 20°C
and 50°C reaction temperatures, 1 hour after completion of the experiments. Figure 3.16-B shows the
corresponding UV-Vis characterization. It can be seen that the 0°C experiments give the most distinct
peak with the smallest FWHM. The plasmon resonance peak is around 420 nm. Higher reaction
temperatures lead to higher FWHM, which indicates higher particle size distributions and thus high
degrees of polydispersion. The 50°C sample shows high aggregation.
30
Figure 3.17 shows the DLS characterization of the 2:1 ratio at 0°C, 1 hour after completion of the
experiments (blue curve) and 5 days after completion of the experiments (red curve). The particle size
distribution has slightly altered 5 days later, indicating a quite stable solution. The mean particle size of the
solution at 1 hour after completion of the experiments is 21 nm, whereas the mean particle size of the
solution is 23 nm after 5 days.
3.3.2 Effect of s tirring time The effect of extended stirring time is that the mean particle diameter and polydispersion increases (this is
the same as with the other two reducing agents, please refer to Figure Appendix 7-9), but the stability
decreases. The decrease in stability is shown in Figure 3.18. The blue graph shows the zeta-potential for
the sample, which was stirred for 15 minutes. The red graph in Figure 3.18 corresponds to the 30 minutes
stirred sample and the black graph with the 45 minutes stirred sample. The reason for the decreased
stability with extended stirring time is because sodium borohydride is a much stronger reducing agent than
the other two reducing agents. Longer reaction time will allow sodium borohydride with its strong
reducing abilities to react with the products (equation (1.13)). This will lead to many unwanted by-
products, which will negatively affect the stability of the solution.
Figure 3.16. 2:1 ratio of sodium borohydride : Ag+. Reaction temperature from left to right: 0°C, 20°C and 50°C (A) and the UV-Vis characterization of the 2:1 ratio at reaction temperatures 0°C, 20°C and 50°C (B).
A
B
Figure 3.17. DLS graphs of the particle size distribution for the 2:1 ratio at 0°C, within 1 hour (blue graph) and 5 days (red graph) after completion of the experiments.

31
3.3.3 Effect of pH Figure 3.19 shows the UV-Vis characterization plot for the 2:1 ratio at 0°C for the different adjusted pH-
values. The pH-value of the unadjusted sample was pH 8. From the plot it can be seen that the plasmon
resonance shifts to the longer wavelengths when the pH is decreased. When the pH-value is increased,
initially the plasmon resonance shifts very slightly to the shorter wavelengths and has higher absorbance
(pH 9) and then moves back to the longer wavelengths (pH 10). Generally, sodium borohydride functions
better as a reducing agent at higher pH values. At neutral or acidic pH values, sodium borohydride will
decompose [54]. However, it seems that the increase to pH 10 leads to such a high ionic strength that the
particles start to aggregate and this leads to the pH 10 curve moving back to the longer wavelengths.
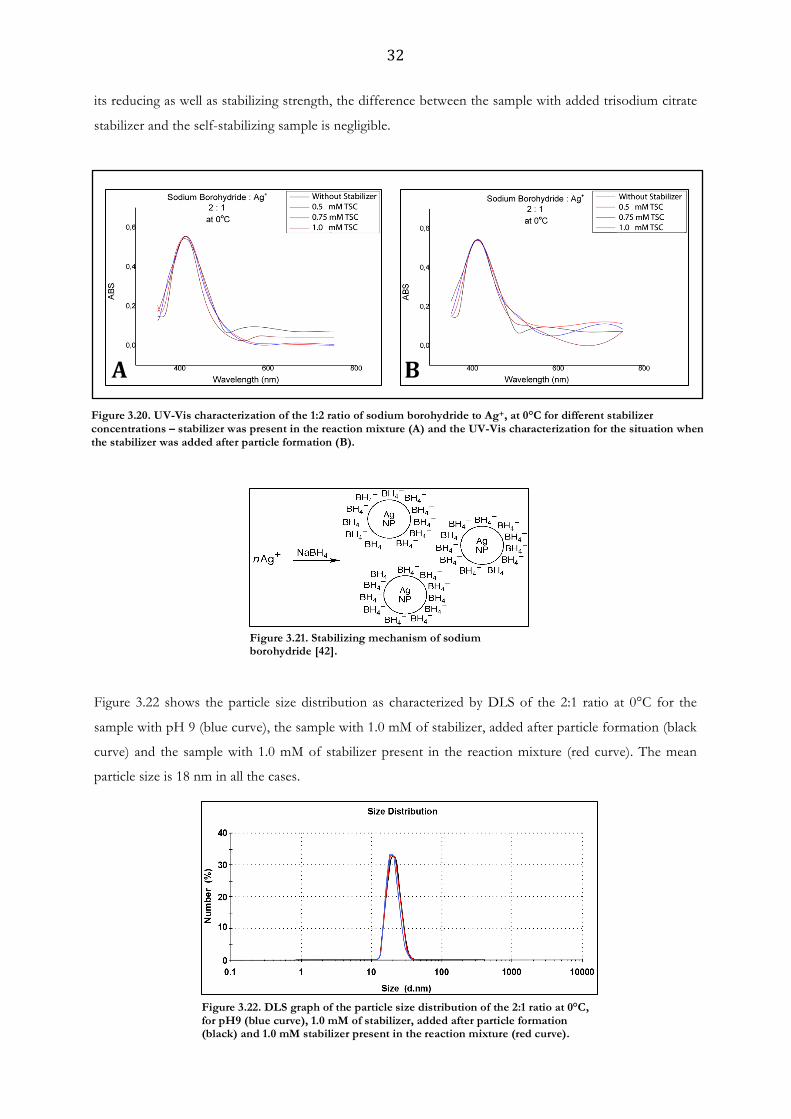
3.3.4 Effect of s tabilizer The third series of experiments involved adding stabilizer. The stabilizer was present in the reaction
mixture. Figure 3.20 shows the UV-Vis characterization plot for the 2:1 ratio at 0°C when stabilizer was
present in the reaction mixture (Figure 3.20-A) and when stabilizer was added after particle formation
(Figure 3.20-B). Sodium borohydride is a reductant as well as a stabilizer [42]. The stabilizing mechanism
is schematically depicted in Figure 3.21. Besides the reduction of Ag+-ions, the borohydride-ions will
adsorb to the surface of the AgNPs, causing the solution to stabilize through repulsive forces. Because of
Figure 3.19. UV-Vis characterization for different pH-values.
Figure 3.18. Zeta-potential distribution for the 2:1 ratio at 0°C, 15 min. of stirring time (blue graph), 30 minutes of stirring time (red graph) and 45 minutes of stirring time (black graph).
32
its reducing as well as stabilizing strength, the difference between the sample with added trisodium citrate
stabilizer and the self-stabilizing sample is negligible.
Figure 3.22 shows the particle size distribution as characterized by DLS of the 2:1 ratio at 0°C for the
sample with pH 9 (blue curve), the sample with 1.0 mM of stabilizer, added after particle formation (black
curve) and the sample with 1.0 mM of stabilizer present in the reaction mixture (red curve). The mean
particle size is 18 nm in all the cases.
Figure 3.21. Stabilizing mechanism of sodium borohydride [42].
Figure 3.22. DLS graph of the particle size distribution of the 2:1 ratio at 0°C, for pH9 (blue curve), 1.0 mM of stabilizer, added after particle formation (black) and 1.0 mM stabilizer present in the reaction mixture (red curve).
Figure 3.20. UV-Vis characterization of the 1:2 ratio of sodium borohydride to Ag+, at 0°C for different stabilizer concentrations – stabilizer was present in the reaction mixture (A) and the UV-Vis characterization for the situation when the stabilizer was added after particle formation (B).
A B

33
The zeta-potential of the samples was also characterized and Figure 3.23 shows the case when the pH was
adjusted to pH 9 (black curve); -26 mV. The red curve shows the case when 1.0 mM stabilizer present in
the reaction mixture. The zeta potential of this sample is −25 mV. The blue curve shows the sample with
1.0 mM of stabilizer, added after particle formation; -23 mV. When stabilizer was present in the reaction
mixture, a slightly more stable solution was obtained. The most stable sample was with the adjusted pH-
value.
Figure Appendix 7, Appendix 8 and Appendix 9 show an overview of the influence of different
parameters on the mean particle size, zeta potential (indicating stability) and FWHM of the UV-Vis
characterization (indicating particle dispersion), respectively for the 2:1 ratio. The stirring time, pH and
stabilizer influences presented, are for the 2:1 ratio at 0°C.
Figure 3.23. Zeta-potential distribution of the 2:1 ratio at 0°C for the sample without controlled pH and without added stabilizer (blue curve), the sample without stabilizer and pH9 (black curve) and the sample with 5mg stabilizer added after particle formation (red curve).

34
4. Conclusions In this research, the influence of 6 parameters on the size, stability and dispersion of AgNPs was
investigated. During the synthesis of AgNPs, it was seen that the type of reducing agent strongly dictates
the duration of the reduction process. Weak reducing agents, like trisodium citrate and ascorbic acid
required longer periods of stirring, as the reducing process was slower. For sodium borohydride (a strong
reducing agent), the reduction process was shorter. Also, without any adjustment, sodium borohydride
produced samples with smaller particles (mean size of 21 nm), a higher stability and the samples were
more monodisperse than the samples created with the other reducing agents. Without any adjustments,
ascorbic acid reduced samples had the highest mean particle sizes of all the three reducing agents. This
was due to the nature of trisodium citrate and sodium borohydride (being a reducing agent as well as a
stabilizing agent). Also, the initial stability of the ascorbic acid reduced samples was much less, when
compared to the samples reduced with the other two reducing agents, due to their dual role.
The influence of the concentration of reducing agent was also very influential. When the concentration
was too low, the reduction process would not proceed or very slowly, negatively influencing the mean
particle size, stability of the sample and the degree of dispersion. When the concentration was too high,
the solutions were seen to aggregate quickly. The samples reduced with sodium borohydride were seen to
show the quickest aggregation rate at too high concentrations of reducing agent, because of the high
amount of formed primary particles, which will have a tendency to aggregate to form large secondary
particles.
The required reaction temperature was seen to be highly dependent on the reducing agent. Trisodium
citrate required a higher reaction temperature to effectively reduce the silver salt, whereas ascorbic acid
and sodium borohydride required lower reaction temperatures. Deviation from the required reaction
temperature directly resulted in higher mean particle size, less stable samples and higher polydispersion.
The temperature has a very steep slope in nearly all of the graphs shown in the Appendix, indicating its
large influence.
The influence of the stirring time was seen to be largest on the mean particle size and the degree of
dispersion. Overall, the influence of the stirring time on the stability was not so large.
A very influential parameter is the pH-value, allowing for control over particle size, particle shape, stability
and degree of dispersion. When looking at the graphs in the Figures Appendix 1-9, the pH-value curves
show very steep slopes in almost all of the graphs. For example, by adjusting the pH-value to pH 10, the
mean particle size of the AgNPs produced with ascorbic acid dropped from 60 nm to 30 nm. Higher pH-
values led to less aggregation than was the case at acidic pH-values. This, in turn led to a higher stability
and more monodisperse solutions. However, too high pH-values can lead to a very high overall ionic
strength of the sample leading to aggregation, as is the case with sodium borohydride, at pH 10. Overall,
when the pH was adjusted, the most stable and monodisperse solutions were obtained. This is essential
35
for membrane testing and development, as the most stable AgNPs in solution will be the hardest to
extract from the aqueous environment. When the pH was not adjusted, the sodium borohydride-reduced
samples showed the highest stability and monodispersion.
Consistently, the best results were obtained when the stabilizing agent was present in the reaction mixture,
instead of added after particle formation. It was seen that the added stabilizer, as well as the pH-value can
change the shape of the AgNPs present in the solutions. The influence of the pH-value in this was larger
than the influence of the stabilizer. The best example was the ascorbic acid-reduced sample; it showed
clearly how the AgNPs in solution started to become more spherical. This was also (but less profoundly)
seen with added stabilizer.
36
5. Future research This research is not without its limitations. The influence of the 6 different parameters on the mean
particle size, the stability of the produced samples and the degree of dispersion was investigated separately
for each parameter. Future work should also focus on possible synergies between all of the different
parameters from this research.
Also, the reaction mixture composition was investigated by keeping the concentration of the silver salt
constant and changing the concentration of the reducing agent. The investigation on the influence of the
reaction mixture composition could be further expanded by keeping the same ratios between the silver
salt and the reducing agent, but changing the amount of solvent.
Furthermore, research on the influence of the addition of the reactants could be expanded further by
considering all the possible orders of addition. For example, this research has considered two orders:
addition of stabilizer to the silver salt solution and then injecting this new solution to the reducing agent
solution and the second order was to inject the silver salt solution to the reducing agent solution and then
adding stabilizing solution after particle formation was witnessed. A consideration could be made for the
addition of stabilizer to the reducing agent solution and then injecting the silver salt solution or an order
where the reducing agent is injected to a silver salt solution with the stabilizer present, etc..
This research should also be explored further by investigating many different stabilizers. The stabilizer
used was citrate. But this could be expanded with stabilizers like Polyvinyl Pyrrolidone (PVP) or Polyvinyl
Alcohol (PVA). All of the considerations outlined here should add to a complete, profound understanding
of the influence of parameters on the synthesis of AgNPs.
The influences on the mean particle size, the stability of the sample and the degree of dispersion were
investigated in this research. Due to the unavailability of the Atomic Force Microscope, Scanning Electron
Microscope or Transmission Electron Microscope during the period of this research, it was not possible
to do research on the influence of the different parameters on the actual shape of the synthesized AgNPs.
In this paper, the shape was hypothesised by looking at the UV-Vis graphs and the SPR peaks. This
research could be completed with AFM microscopy results.
37
References [1] Taylor, R.A., Coulombe, S., Otanicar, T., Phelan, P., Gunawan, A., Lv, W., Rosengarten, G.,
Prasher, R. et al. (2013). Small particles, big impacts: A review of the diverse applications of nanofluids. Journal of Applied Physics 113 (1), pp. 1-19.
[2] Taylor, R. A., Otanicar, T., Rosengarten, G. (2012). Nanofluid-based optical filter optimization for
PV/T systems. Light: Science & Applications 1 (10), pp. 2-6. [3] Taylor, R.A., Otanicar, T., Herukerrupu, Y., Bremond, F., Rosengarten, G., Hawkes, E.R., Jiang,
X., Coulombe, S. (2013). Feasibility of nanofluid-based optical filters. Applied Optics 52 (7): 1413–22.
[4] Hewakuruppu, Y. L.; Dombrovsky, L. A.; Chen, C.; Timchenko, V.; Jiang, X.; Baek, S.; Taylor, R.
A. (2013). Plasmonic "pump–probe" method to study semi-transparent nanofluids. Applied Optics 52 (24): 6041–6050.
[5] EPA (n.d.). Module 3: Characteristics of Particles – Particle Size Categories. Retrieved from:
http://web.archive.org/web/20101203205130/http://www.epa.gov/apti/bces/module3/category/category.htm, on 09-06-2014.
[6] Buzea, C., Pachecho Blandino, I.I., Robbie, K. (2007). Nanomaterials and Nanoparticles: Sources
and Toxicity. Biointerphases vol.2, issue 4, pp. 17-71. [7] Panigrahi, S., Kundu, S., Kumar Ghosh, S., Nath, S., Pal, T. (2004). General Method of Synthesis
for Metal Nanoparticles. Journal of Nanoparticle Research 6, pp. 411-414. [8] Yokoyama, T. & Huang, C.C. (2005). Nanoparticle Technology for the Production of Functional
Materials. KONA No.23, pp. 7-17. [9] Domènech, B., Bastos-Arrieta, J., Alonso, A., Macanás, J., Muñoz, M., Muraviev, D.N. (2012).
Bifunctional Polymer-Metal Nanocomposite Ion Exchange Materials. Ion Exchange Technologies, InTech, Chapter 3, pp. 35-72
[10] Overney, R. (2010). Nanoparticle Synthesis. Lecture conducted at University of Washington,
Seattle, WA. Retrieved from http://courses.washington.edu/overney/NME498_Material/NME498_Lectures/Lecture4-Overney-NP-Synthesis.pdf, on 10-06-2014.
[11] Schmid, G. (2003). Nanoparticles: from Theory to Application. Wiley-VCH, Weinheim, pp. 185-
238. [12] De Castro, C.L., Mitchell, B.S. (2002). Nanoparticles from Mechanical Attrition. Synthesis,
Functionalization and Surface Treatment of Nanoparticles, Chapter 1. American Scientific Publishers. [13] Cao, W. (2007). Synthesis of Nanomaterials by High Energy Ball Milling. Retrieved from
http://www.understandingnano.com/nanomaterial-synthesis-ball-milling.html, on 10-06-2014. [14] Iskandar, F. (2009). Nanoparticle processing for optical applications – A review. Advanced Powder
Technology 20, pp. 283-292. [15] Kraynov, A. and Müller, T.E. (2011). Concepts for the Stabilization of Metal Nanoparticles in
Ionic Liquids, Applications of Ionic Liquids in Science and Technology, Chapter 12, pp. 235-260.

38
[16] Bahadory, M. (2008). Synthesis of Noble Metal Nanoparticles. Thesis for Doctor of Philosophy. Drexel University, PA.
[17] Brittanica Encyclopaedia (n.d.). Magic Number. Retrieved from
http://www.britannica.com/EBchecked/topic/356723/magic-number, on 10-06-2014. [18] Cao, G. and Wang, Y. (2011). Nanostructures and Nanomaterials: Synthesis, Properties and
Applications, Chapter 3, 2nd Edition, World Scientific, Singapore. [19] Park, J., Soon Gu Kwon, J.J., Jang, Y., Hyeon, T. (2007). Synthesis of Monodisperse Sperical
Nanocrystals. Angewandte Chemie Int.Ed. 46, pp. 4630-4660. [20] Tao, A.R., Habas, S., Yang, P. (2008). Shape Control of Colloidal Metal Nanocrystals. Wiley
InterScience, small 2008, 4 , No.3, pp. 310-325. [21] Bae, E., Park, H., Park, J., Yoon, J, Kim, Y., Choi, K., Yi, J. (2010). Effect of Chemical Stabilizers
in Silver Nanoparticle Suspension on Nanotoxicity. Bull. Korean Chem. Soc. 2011, 32, No. 2, pp. 613-619.
[22] Korbekandi, A. and Iravani, S. (2012). Silver Nanoparticles, The Delivery of Nanoparticles.
Retrieved from http://www.intechopen.com/books/the-delivery-of-nanoparticles/silver-nanoparticles, on 15-06-2014.
[23] Reidy, B., Haase, A., Luch, A., Dawson K.A., Lynch, I. (2013). Mechanisms of Silver Nanoparticle
Release, Transformation and Toxicity: A Critical Review of Current Knowledge and Recommendations for Future Studies and Applications. Materials 6 (6), pp. 2295-2350.
[24] Zeng, S., Yong, K.T., Roy, I., Dinh, X.Q., Yu, X., Luan, F. (2011). A review on functionalized
gold nanoparticles for biosensing applications. Plasmonics 6 (3), pp.491-506. [25] Rycenga, M., Cobley, C.M., Zeng, J., Li, W., Moran, C.H., Zhang, Q, Qin, D., Xia, Y. (2011).
Controlling the Synthesis and Assembly of Silver Nanostructures for Plasmonic Applications. Chemical Reviews, 111, pp. 3669-3712.
[26] Brittanica Encyclopaedia (n.d.). Brownian Motion. Retrieved from
http://www.britannica.com/EBchecked/topic/81815/Brownian-motion, on 10-06-2014. [27] Orbaek, A., Phillips, M., Mchale, M., Barron, A. (2013). Silver Nanoparticles: A Case Study in
Cutting Edge Research. Nanomaterials and Nanotechnology. Retrieved from http://cnx.org/contents/[email protected]:11, on 12-06-2014.
[28] Caves, M. (2014). Seminar “Static Light Scattering Technologies Explained for Multidetection
SEC/GPC”, ATA Scientific, 13th-18th February 2014, Sydney. Retrieved from http://www.atascientific.com.au/eventsandtraining/eventsandtraining/wp-content/uploads/2014/02/ATA-seminar-polymer-and-proteinlr-3.pdf, on 15-06-2014.
[29] Zeta-Meter, Inc. (n.d.). Zeta Potential: A Complete Course in 5 Minutes. Retrieved from
http://www.zeta-meter.com/5min.pdf, on 12-06-2014. [30] Derjaguin, B. and Landau, L. (1941). Theory of the stability of strongly charged lyophobic sols and
of the adhesion of strongly charged particles in solutions of electrolytes. Acta Physico Chemica URSS, 14, pp. 633.

39
[31] Verwey, E.J.W. and Overbeek, J.T.G. (1948). Theory of the stability of lyophobic colloids, Amsterdam: Elsevier.
[32] Atkins, P.W. and De Paula, J. (2006). Atkins’ Physical Chemistry. Oxford, Oxford University Press. [33] Campbell, L. (n.d.). DLVO Theory: The theory of colloidal dispersion stability. University of
Brighton. Retrieved from https://folio.brighton.ac.uk/view/view.php?id=20313, on 22-06-2014. [34] Tran, Q.H., Nguyen, V.Q., Le, A. (2013). Silver nanoparticles: synthesis, properties, toxicology,
applications and perspectives. Advances in Natural Sciences: Nanoscience and Nanotechnology, 4 , pp. 1-20.
[35] Krutyakov, Y.A., Kudrinskiy, A.A., Olenin, Y.A., Lisichkin, G.V. (2008). Synthesis and properties
of silver nanoparticles: advances and prospects. Russian Chemical Reviews 77 (3), pp. 233-257. [36] Šileikaite, A., Prosyčevas, I., Puišo, J., Juraitis, A., Guobiene, A. (2006). Analysis of Silver
Nanoparticles Produced by Chemical Reduction of Silver Salt Solution. Materials Science (Medžiagotyra), Vol. 12, No. 4, pp. 287-291.
[37] Turkevich, J., Stevenson, P.C., Hillier, J. (1951). A Study of the Nucleation and Growth Processes
in the Synthesis of Colloidal Gold. Discussions of the Faraday Society 11, pp. 55-75. [38] Sondi, I., Goia, D.V., Matijević, E. (2003). Preparation of highly concentrated stable dispersions of
uniform silver nanoparticles. Journal of Colloid and Interface Science 260, pp. 75-81. [39] Qin, Y., Ji, X., Jing, J., Liu, H., Wu, H., Yang, W. (2010). Size Control over Spherical Silver
Nanoparticles by Ascorbi Acid Reduction. Colloids and Surfaces A: Physicochemical and Engineering Aspects, Vol. 372, pp. 172-176.
[40] El-Kheshen, A.A. and El-Rab, S.F.G. (2012). Effect of reducing and protecting agents on size of
silver nanoparticles and their bacterial activity. Der Pharma Chemica 4(1), pp. 53-65. [41] Steinigeweg, D. and Schlücker, S. (2012). Monodispersion and size control in the synthesis of 20-
100 nm quasi-spherical silver nanoparticles by citrate and ascorbic acid reduction in glycerol-water mixtures. The Royal Society of Chemistry, 48, pp. 8682-8684.
[42] Solomon, S.D., Bahadory, M., Jeyarajasingam, A.V., Rutkowsky, S.A., Boritz, C. (2007). Synthesis
and Study of Silver Nanoparticles. Journal of Chemical Education, Vol. 84, No. 2, pp. 322-325. [43] Sobczak-Kupiec, A., Malina, D., Wzorek, Z., Zimowska, M. (2011). Influence of silver nitrate
concentration on the properties of silver nanoparticles. Micro & Nano Letters, Vol. 6, No. 8, pp. 656-660.
[44] Das, M.R., Sarma, R.K., Borah, S.C, Kumari, R., Saikia, R., Deshmukh, A.B., Shelke, M.V.,
Sengupa, P., Szunerits, S., Boukherroub, R. (2013). The synthesis of citrate-modified silver nanoparticles in an aqueous suspension of grapheme oxide nanosheets and their antibacterial activity. Colloids and Surfaces B: Biointerfaces, 105, pp. 128-136.
[45] Kudrinskiy, A.A., Ivanov, A.Y., Kulakovskaya, E.V., Klimov, A.I., Zherebin, P.M., Khodarev,
D.V., Le, A.T., Tam, L.T., Lisichkin, G.V. and Krutyakov, Y.A. (2014). The Mode of Action of Silver and Silver Halides Nanoparticles against Saccharomyces cerevisiae Cells. Journal of Nanoparticles, Volume 2014, Article ID 568635, pp. 1-7.

40
[46] Pillai, Z.S. and Kamat, P.V. (2004). What Factors Control the Size and Shape of Silver Nanoparticles in the Citrate Ion Reduction Method? Journal of Physical Chemistry B, 108, pp. 945-951.
[47] Zhang, W.P., Zou, C.D., Zhao, B., Zhai, Q., Gao, Y (2013). Size control and its mechanism of
SnAg nanoparticles. Transactions of Nonferrous Metals Society of China, 64, pp. 750-757. [48] nanoComposix (2012). Zeta Potential Analysis of Nanoparticles. Retrieved from
http://cdn.shopify.com/s/files/1/0257/8237/files/nanoComposix_Guidelines_for_Zeta_Potential_Analysis_of_Nanoparticles.pdf, on 21-06-2014
[49] Oyetade, O.A., Oyeleke, G.O., Adegoke, B.M., Akintunde, A.O. (2012). Stability Studies on
Ascorbic Acid (Vitamin C) From Different Sources. IOSR Journal of Applied Chemistry. Vol 2,(4), pp. 20-24.
[50] Laing, B.M., Schlueter, D.L., Labuza, T.P. (2006). Degradation Kinetics of Ascorbic Acid at High
Temperature and Water Activity. Journal of Food Science, Vol. 43, (5), pp. 1440-1443. [51] Singh, R., Wagh, P., Wadhwani, S., Gaidhani, S., Kumbhar, A., Bellare, J., Chopade, B.A. (2013).
Synthesis, optimization and characterization of silver nanoparticles form Acinetobacter calcoaceticus and their enhanced antibacterial activity when combined with antibiotics. International Journal of Nanomedicine, 8, pp. 4277-4290.
[52] Stiufiuc, R., Iacovita, C., Lucaciu, C.M., Stiufiuc, G., Dutu, A.G., Braescu, C., Leopold, N.
(2013). SERS-active silver colloids prepared by reduction of silver nitrate with short-chain polyethylene glycol. Nanoscale Research Letters, Vol.8 (47), pp. 1-5.
[53] Lu, Y.C. and Chou, K.S. (2008). A simple and effective route for the synthesis of nano-silver
colloidal dispersions. Journal of the Chinese Institute of Chemical Engineers, 39, pp. 673-678. [54] Benfi, L., Narisano, E., Riva, R., Stiasni, N., Hiersemann, M. (2004). Sodium Borohydride.
Encyclopedia of Reagents for Organic Synthesis 2004. J. Wiley & Sons, New York.
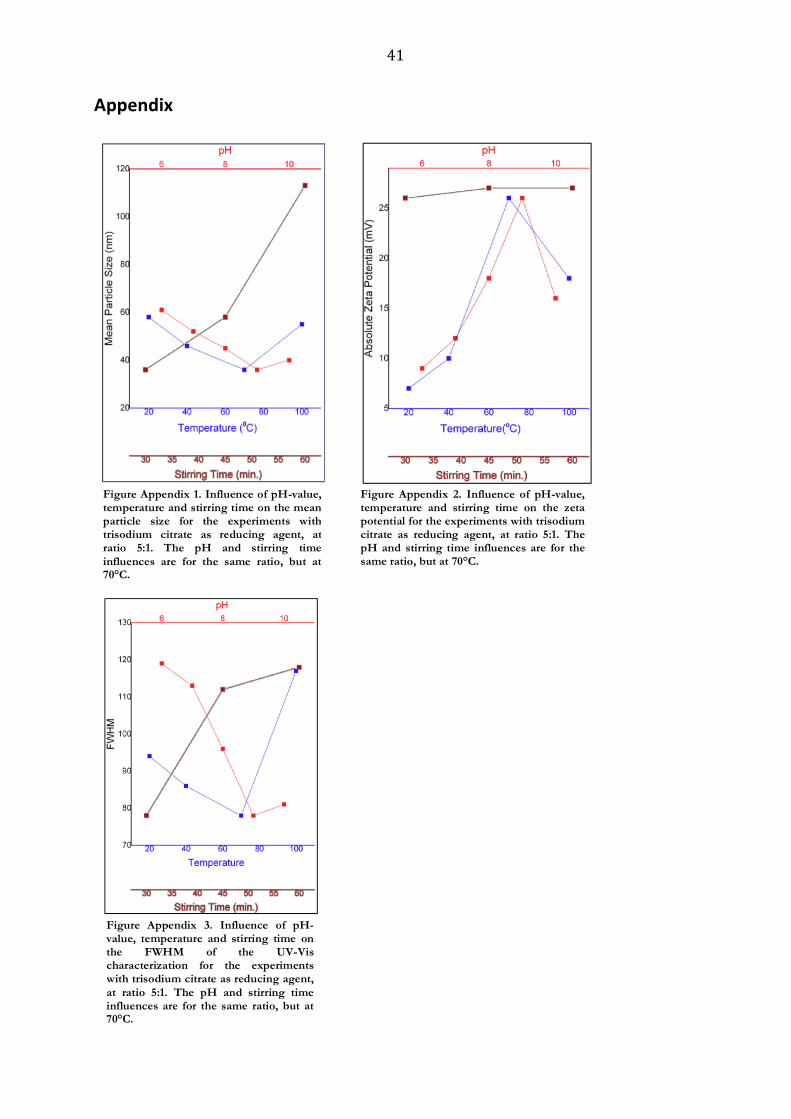
41
Appendix
Figure Appendix 1. Influence of pH-value, temperature and stirring time on the mean particle size for the experiments with trisodium citrate as reducing agent, at ratio 5:1. The pH and stirring time influences are for the same ratio, but at 70°C.
Figure Appendix 2. Influence of pH-value, temperature and stirring time on the zeta potential for the experiments with trisodium citrate as reducing agent, at ratio 5:1. The pH and stirring time influences are for the same ratio, but at 70°C.
Figure Appendix 3. Influence of pH-value, temperature and stirring time on the FWHM of the UV-Vis characterization for the experiments with trisodium citrate as reducing agent, at ratio 5:1. The pH and stirring time influences are for the same ratio, but at 70°C.

42
Figure Appendix 4. Influence of pH-value, temperature, stirring time and addition of stabilizer on the mean particle size for the experiments with ascorbic acid as reducing agent, at ratio 1:2. The pH, stirring time and stabilizer influences are for the same ratio, but at 20°C.
Figure Appendix 5. Influence of pH-value, temperature, stirring time and addition of stabilizer on the zeta potential for the experiments with ascorbic as reducing agent, at ratio 1:2. The pH, stirring time and stabilizer influences are for the same ratio, but at 20°C.
Figure Appendix 6. Influence of pH-value, temperature, stirring time and addition of stabilizer on the FWHM of the UV-Vis characterization for the experiments with ascorbic acid as reducing agent, at ratio 1:2. The pH, stirring time and stabilizer influences are for the same ratio, but at 20°C.

43
Figure Appendix 7. Influence of pH-value, temperature, stirring time and addition of stabilizer on the mean particle size for the experiments with sodium borohydride as reducing agent, at ratio 2:1. The pH, stirring time and stabilizer influences are for the same ratio, but at 0°C.
Figure Appendix 8. Influence of pH-value, temperature, stirring time and addition of stabilizer on the zeta potential for the experiments with sodium borohydride as reducing agent, at ratio 2:1. The pH, stirring time and stabilizer influences are for the same ratio, but at 0°C.
Figure Appendix 9. Influence of pH-value, temperature, stirring time and addition of stabilizer on the FWHM of the UV-Vis characterization for the experiments with sodium borohydride as reducing agent, at ratio 2:1. The pH, stirring time and stabilizer influences are for the same ratio, but at 0°C.
![Synthesis of gold nanoparticles under highly oxidizing ... · During synthesis, many parameters influence the physico-chemical properties of the obtained gold nanoparticles [18].](https://static.fdocuments.net/doc/165x107/5fc5874047abb138300be849/synthesis-of-gold-nanoparticles-under-highly-oxidizing-during-synthesis-many.jpg)


![Effects of Process Parameters on the Size of Nanostructure ...file.scirp.org/pdf/CSTA_2015060217524783.pdf · rofluoro carbons [10]. Wet chemical is a method for the synthesis of](https://static.fdocuments.net/doc/165x107/5aae2eec7f8b9a25088be89a/effects-of-process-parameters-on-the-size-of-nanostructure-filescirporgpdfcsta.jpg)

