Influence of compaction on Material Behavior Index from ...
9
Influence of compaction on Material Behavior Index from CPT for carbonate sands Mathijs Maes DEME, Antwerp, Belgium, [email protected] Patrick Mengé DEME, Antwerp, Belgium, [email protected] ABSTRACT: When performing land reclamation works by dredging and hydraulic fill placement, compaction of the granular fill is required. This can be necessary for different reasons such as bearing capacity improvement, settlement reduction, increase of (relative) density, increase of friction angle and/or liquefaction mitigation. When performing the liquefaction assessment based on the CPT according to the ‘simplified’ methods, often the Material Behavior Index I C is used to estimate the fines content and apply a correction for the fines. In this paper two case studies are discussed related to projects in the Middle East where the sand has a high carbonates content and compaction was performed by means of two commonly used techniques: Vibroflotation and Dynamic Compaction. Based on pre- and post-compaction CPT results performed for the quality control, the change in I C is stud- ied. This change becomes more clear as the compaction level becomes higher. Also, I C derived from pre- and post- compaction CPT's is compared to the fines content derived from laboratory test results on in situ samples. The results are discussed, and reliability, consequences and possible influence parameters are highlighted. Special atten- tion is paid to the use of a ‘Shell Correction Factor’ to take into account the effect of crushing of the carbonate material in CPT cone resistance. Keywords: compaction; material behavior index; CPT, liquefaction assessment; calcareous sand 1. Introduction When performing large land reclamation works by means of dredging, the fill material is placed hydrau- lically and the relative density of the installed fill mate- rial will depend on several factors such as the equip- ment used, the material characteristics and placement above or below the water table [1]. Depending on the technical requirements that apply to the fill material, compaction of the granular fill often is required. This can be necessary for different reasons such as bearing capacity improvement, settlement reduction, increase of (relative) density, increase of friction angle and/or lique- faction mitigation. In this paper we will mainly focus on the liquefaction assessment. When performing the liquefaction assessment based on the CPT according to the NCEER method [2] or ac- cording to Boulanger et al [3], the Material Behavior Index I C is one of the approaches to estimate the fines content. A correction for the fines as developed by Rob- ertson and Wride [4] is suggested in [2]; in [3] the cal- culation of the fines content based on I C is discussed as the correction is applied in terms of a correction to the normalized q c -value. Goal is in both cases to find a ‘clean sand’-cone resistance. As this can be automated based on the CPT result, this approach is very popular. In this paper two case studies are discussed related to projects in the Middle East where the sand has a high carbonates content (up to 100%) and compaction was performed by means of two commonly used techniques: Vibroflotation and Dynamic Compaction. One of the issues with calcareous sand is that the ma- terial exhibits local crushing during compaction and during penetration with the CPT cone [5][6][7]. The measured CPT value is often corrected with a ‘Shell Correction Factor’ (SCF) [7][8][9] in order to obtain an equivalent ‘silica sand’-cone resistance. In these pro- jects, the calculation of the I C and the liquefaction as- sessment is based on this corrected q c -value. While the correctness of such approach might be a topic of discus- sion, it is standard practice and further analysis will fo- cus on I C calculated this way, however, using different values for the SCF. Based on pre- and post-compaction CPT results per- formed for the quality control, the change in I C is stud- ied. Also, I C derived from pre- and post-compaction CPT's is compared to the real fines content derived from sieving analysis performed on borehole samples. 2. Material Behavior Index The soil classification system based on Soil Behavior Type (SBT) and the Material Behavior Index I C being used for liquefaction analysis has been suggested by Robertson [10]. In the past years, further refining has been done and updates on the SBT-classification have been published [11] and [12]. I C is calculated from the CPT according to following formula’s [10]: I ୡ ൌ ሾሺ3.47 െ log Qሻ ଶ ሺ1.22 log Fሻ ଶ ሿ .ହ (1) Where the dimensionless normalized CPT cone re- sistance Q and normalized friction ratio F are calculated by following relations: Qൌቀ ୯ ౙ౨౨ ୮ ቁ∙ቀ ୮ ᇱ ቁ ୬ (2)
Transcript of Influence of compaction on Material Behavior Index from ...

Influence of compaction on Material Behavior Index from CPT for carbonate sands
Mathijs Maes DEME, Antwerp, Belgium, [email protected]
Patrick Mengé DEME, Antwerp, Belgium, [email protected]
ABSTRACT: When performing land reclamation works by dredging and hydraulic fill placement, compaction of the granular fill is required. This can be necessary for different reasons such as bearing capacity improvement, settlement reduction, increase of (relative) density, increase of friction angle and/or liquefaction mitigation. When performing the liquefaction assessment based on the CPT according to the ‘simplified’ methods, often the Material Behavior Index IC is used to estimate the fines content and apply a correction for the fines. In this paper two case studies are discussed related to projects in the Middle East where the sand has a high carbonates content and compaction was performed by means of two commonly used techniques: Vibroflotation and Dynamic Compaction. Based on pre- and post-compaction CPT results performed for the quality control, the change in IC is stud-ied. This change becomes more clear as the compaction level becomes higher. Also, IC derived from pre- and post-compaction CPT's is compared to the fines content derived from laboratory test results on in situ samples. The results are discussed, and reliability, consequences and possible influence parameters are highlighted. Special atten-tion is paid to the use of a ‘Shell Correction Factor’ to take into account the effect of crushing of the carbonate material in CPT cone resistance.
Keywords: compaction; material behavior index; CPT, liquefaction assessment; calcareous sand
1. Introduction
When performing large land reclamation works by means of dredging, the fill material is placed hydrau-lically and the relative density of the installed fill mate-rial will depend on several factors such as the equip-ment used, the material characteristics and placement above or below the water table [1]. Depending on the technical requirements that apply to the fill material, compaction of the granular fill often is required. This can be necessary for different reasons such as bearing capacity improvement, settlement reduction, increase of (relative) density, increase of friction angle and/or lique-faction mitigation. In this paper we will mainly focus on the liquefaction assessment.
When performing the liquefaction assessment based on the CPT according to the NCEER method [2] or ac-cording to Boulanger et al [3], the Material Behavior Index IC is one of the approaches to estimate the fines content. A correction for the fines as developed by Rob-ertson and Wride [4] is suggested in [2]; in [3] the cal-culation of the fines content based on IC is discussed as the correction is applied in terms of a correction to the normalized qc-value. Goal is in both cases to find a ‘clean sand’-cone resistance. As this can be automated based on the CPT result, this approach is very popular.
In this paper two case studies are discussed related to projects in the Middle East where the sand has a high carbonates content (up to 100%) and compaction was performed by means of two commonly used techniques: Vibroflotation and Dynamic Compaction.
One of the issues with calcareous sand is that the ma-terial exhibits local crushing during compaction and during penetration with the CPT cone [5][6][7]. The
measured CPT value is often corrected with a ‘Shell Correction Factor’ (SCF) [7][8][9] in order to obtain an equivalent ‘silica sand’-cone resistance. In these pro-jects, the calculation of the IC and the liquefaction as-sessment is based on this corrected qc-value. While the correctness of such approach might be a topic of discus-sion, it is standard practice and further analysis will fo-cus on IC calculated this way, however, using different values for the SCF.
Based on pre- and post-compaction CPT results per-formed for the quality control, the change in IC is stud-ied. Also, IC derived from pre- and post-compaction CPT's is compared to the real fines content derived from sieving analysis performed on borehole samples.
2. Material Behavior Index
The soil classification system based on Soil Behavior Type (SBT) and the Material Behavior Index IC being used for liquefaction analysis has been suggested by Robertson [10]. In the past years, further refining has been done and updates on the SBT-classification have been published [11] and [12].
IC is calculated from the CPT according to following formula’s [10]:
I 3.47 log Q 1.22 log F . (1)
Where the dimensionless normalized CPT cone re-sistance Q and normalized friction ratio F are calculated by following relations:
Q ∙ (2)
F
Whereby:
1. 𝜎te
2. 𝜎te
3. 𝑞4. 𝑞
p5. f6. 𝑝7. 𝑛
a
𝑛 0.381
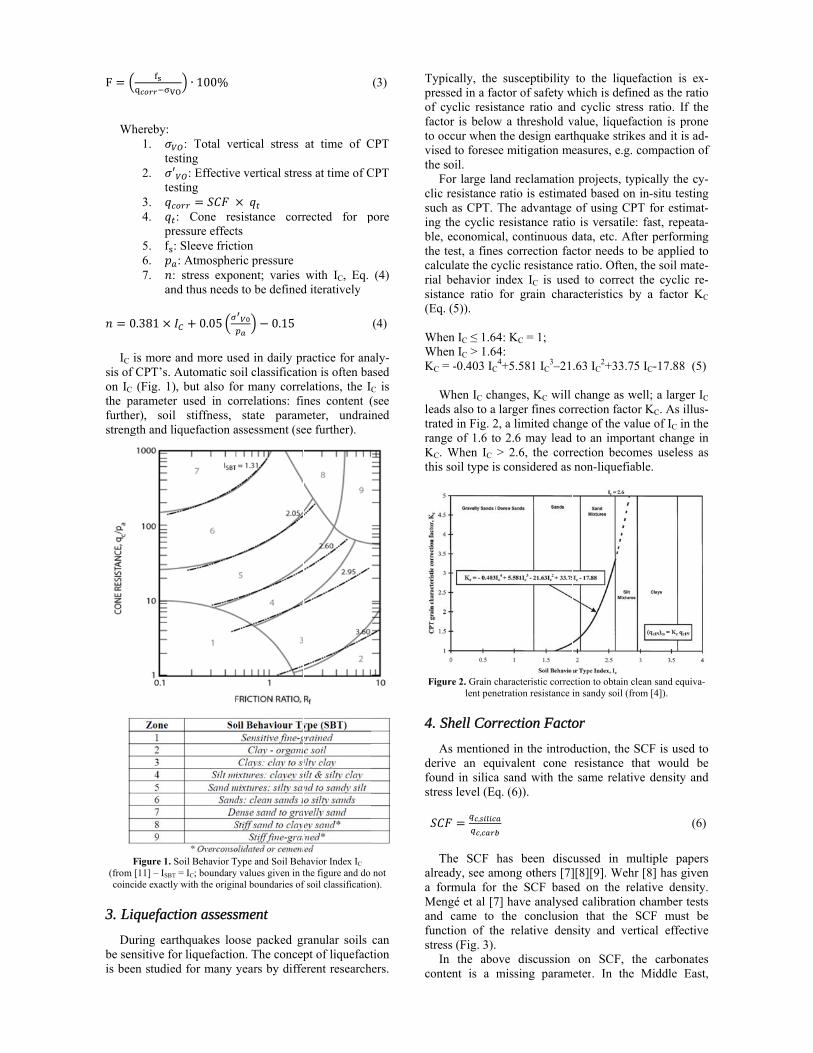
IC is more
sis of CPT’s.on IC (Fig. 1the parametefurther), soistrength and
Figure 1.(from [11] – ISB
coincide exact
3. Liquefac
During eabe sensitive fis been studi
∙ 100%
𝜎 : Total veesting
𝜎′ : Effectiveesting
𝑞 𝑆𝐶𝐹 𝑞 : Cone repressure effectf : Sleeve frict𝑝 : Atmospher𝑛: stress expoand thus needs
𝐼 0.05
e and more us. Automatic so1), but also foer used in coil stiffness, liquefaction a
. Soil Behavior TBT = IC; boundarytly with the origin
ction assess
arthquakes loofor liquefactioied for many y
ertical stress
e vertical stres
𝑞 sistance corrts tion ric pressure onent; varies s to be defined
0.15
sed in daily proil classificatior many correorrelations: fi
state paramassessment (se
Type and Soil Behy values given in tnal boundaries of
sment
ose packed gron. The concepyears by diffe
at time of C
ss at time of C
rected for p
with IC, Eq. d iteratively
ractice for anaion is often baelations, the Ines content (
meter, undraiee further).
havior Index IC the figure and do f soil classificatio
ranular soils pt of liquefacterent research
(3)
CPT
CPT
pore
(4)
(4)
aly-ased C is (see ined
not n).
can tion
hers.
Typreof facto visthe
clicsucingblethecalriasist(Eq WhWhKC
leatratranKC
thi
Fig
4.
derfoustre
𝑆𝐶
alra fMeandfunstre
con
ypically, the sessed in a factcyclic resista
ctor is below occur when th
sed to foresee e soil. For large landc resistance rach as CPT. Thg the cyclic ree, economicale test, a fines lculate the cycl behavior intance ratio foq. (5)).
hen IC ≤ 1.64:hen IC > 1.64:
C = -0.403 IC4+
When IC chan
ads also to a lated in Fig. 2,
nge of 1.6 to C. When IC > s soil type is c
gure 2. Grain chalent penetr
Shell Corre
As mentionedrive an equivund in silica sess level (Eq. 𝐶𝐹 ,
,
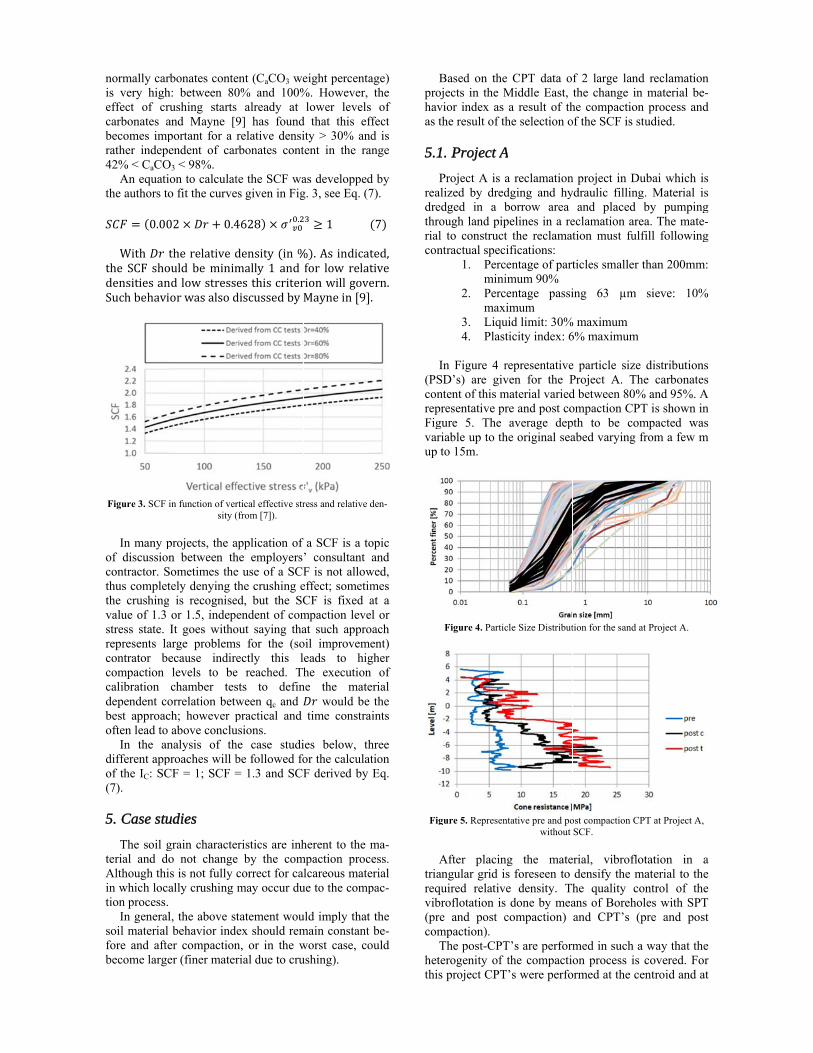
The SCF haeady, see amoformula for tengé et al [7] d came to thnction of the ess (Fig. 3). In the aboventent is a m
susceptibility tor of safety wance ratio anda threshold v
he design eartmitigation me
d reclamationatio is estimathe advantage esistance ratio, continuous dcorrection fac
clic resistancedex IC is useor grain char
KC = 1;
+5.581 IC3–21
nges, KC will arger fines cora limited chan2.6 may lead 2.6, the corr
considered as
aracteristic correcration resistance i
ection Facto
d in the introdvalent cone sand with the(6)).
as been discong others [7]the SCF basehave analysedhe conclusionrelative den
e discussion missing param
to the liquefwhich is defined cyclic stressvalue, liquefacthquake strikeeasures, e.g. c
n projects, typted based on iof using CPT
o is versatile: data, etc. Aftector needs to
e ratio. Often, ed to correct tracteristics by
.63 IC2+33.75
change as werrection factornge of the valuto an import
rection becomnon-liquefiab
ction to obtain clein sandy soil (fro
or
duction, the Sresistance th
e same relativ
ussed in mu][8][9]. Wehr ed on the relad calibration cn that the Ssity and vert
on SCF, thmeter. In the
faction is ex-ed as the ratios ratio. If thection is pronees and it is ad-compaction of
pically the cy-in-situ testingT for estimat-fast, repeata-
er performingbe applied tothe soil mate-the cyclic re-
y a factor KC
IC-17.88 (5)
ell; a larger IC
r KC. As illus-ue of IC in theant change in
mes useless asble.
ean sand equiva-m [4]).
CF is used tohat would bee density and
(6)
ultiple papers[8] has givenative density.chamber tests
SCF must betical effective
he carbonatesMiddle East,
-o e e -f
-g --g o --C
C -e n s
o e d
s n . s e e
s ,
normally caris very higheffect of crcarbonates abecomes imprather indepe42% < CaCO
An equatithe authors to
𝑆𝐶𝐹 0.00
With 𝐷𝑟 t
the SCF shodensities anSuch behavi
Figure 3. SCF i
In many p
of discussioncontractor. Sthus completthe crushingvalue of 1.3 stress state. represents lacontrator becompaction calibration dependent cobest approacoften lead to
In the andifferent appof the IC: SC(7).
5. Case stu
The soil gterial and doAlthough thiin which location process.
In generalsoil material fore and aftebecome large
rbonates conteh: between 80rushing startsand Mayne [9portant for a endent of car
O3 < 98%. on to calculato fit the curve
02 𝐷𝑟 0.4
the relative dould be minimnd low stressior was also d
in function of versity (
projects, the an between th
Sometimes thetely denying t
g is recogniseor 1.5, indepIt goes witho
arge problemecause indirelevels to bechamber tes
orrelation betwch; however pabove conclu
nalysis of thproaches will bCF = 1; SCF =
udies
grain characteo not changeis is not fully ally crushing
l, the above stbehavior ind
er compactioner (finer mater
ent (CaCO3 we0% and 100%s already at 9] has foundrelative densirbonates cont
te the SCF waes given in Fig
4628 𝜎 .
density in %mally 1 and es this criter
discussed by
rtical effective str(from [7]).
application of he employerse use of a SCFthe crushing eed, but the SCendent of com
out saying thas for the (soectly this l
e reached. Thsts to definween qc and 𝐷practical and
usions. he case studibe followed fo= 1.3 and SCF
eristics are inhe by the comcorrect for calmay occur du
tatement wouex should remn, or in the wrial due to cru
eight percenta%. However,
lower levelsd that this efity > 30% andtent in the ra
as developpedg. 3, see Eq. (7
1
% . As indicatfor low relat
rion will goveMayne in 9
ress and relative d
a SCF is a to’ consultant F is not alloweffect; sometimCF is fixed ampaction leveat such approoil improvemeeads to highe execution
ne the mate𝐷𝑟 would be time constra
ies below, thor the calculatF derived by
herent to the mmpaction proc
lcareous mateue to the comp
uld imply that main constant worst case, coushing).
age) the of
ffect d is
ange
d by 7).
7
ted, tive ern. .
den-
opic and
wed, mes at a el or oach ent) gher n of erial
the aints
hree tion Eq.
ma-ess.
erial pac-
the be-
ould
prohavas
5.1
readrethrriacon
(PSconrepFigvarup
Fi
triareqvib(prcom
hetthi
Based on theojects in the Mvior index as the result of th
1. Project A
Project A is aalized by drededged in a brough land pipl to constructntractual spec
1. Percmini
2. Percmax
3. Liqu4. Plast
In Figure 4 rSD’s) are givntent of this mpresentative prgure 5. The riable up to thto 15m.
Figure 4. Partic
gure 5. Represen
After placinangular grid iquired relativbroflotation isre and post cmpaction). The post-CPTterogenity of s project CPT
e CPT data oMiddle East, a result of th
he selection o
A
a reclamationdging and hyborrow area pelines in a ret the reclamatifications:
centage of partimum 90% centage passiimum
uid limit: 30%ticity index: 6
representativeven for the Pmaterial variedre and post coaverage dep
he original sea
cle Size Distribut
ntative pre and powithout
ng the mates foreseen to
ve density. Ths done by meacompaction)
T’s are performthe compacti
T’s were perfo
f 2 large landthe change in
he compactionof the SCF is s
n project in Duydraulic filling
and placed eclamation aretion must ful
ticles smaller
ing 63 µm
% maximum 6% maximum
e particle sizeProject A. Thd between 80%ompaction CPpth to be comabed varying f
tion for the sand a
ost compaction CPSCF.
erial, vibroflodensify the mhe quality coans of Borehoand CPT’s (
med in such aon process is
ormed at the ce
d reclamationn material be-n process andstudied.
ubai which isg. Material isby pumping
ea. The mate-fill following
than 200mm:
sieve: 10%
e distributionshe carbonates% and 95%. AT is shown inmpacted wasfrom a few m
at Project A.
PT at Project A,
otation in amaterial to theontrol of theoles with SPT(pre and post
a way that thecovered. For
entroid and at
n -d
s s g -g
:
%
s s
A n s
m
a e e T t
e r t

the one thirdindicated in between the trial area. Dspacing can bsoil conditioprojects was
Fig
5.2. Projec
Project B also a hydramade in the rreclamation win place by dloose soil staFigure 7. Frotent of this sfor project Aly between 1
Figu
Because o
be compacteface), dynampropriate techmaterial intotrol is basedtesting is takpact points a
As the cawas applied,for some loca
d distance betFigure 6. Thecompaction p
During executbe adjusted inons. In genervarying betw
gure 6. Quality p
ct B
is a land reclaulic fill projereclamation arworks and padry earth mov
ate. The particom this figuresand is in genA. The carbona
5% and 60%.
ure 7. Particle size
of the higher d (maximally
mic compactionhnique. Work
o the requiredd on CPT’s (pken approximfter backfillin
arbonates cont, although thiations and dep
tween 2 compe optimal startpoint is determtion of the p
n line with the ral the grid
ween 3.8m and
process by means
amation projeect, however rea some yearart of the matvement, leadile size distribue it is clear theral higher thates content i
e distribution for
fines content down to 10m
n was consideks are performd stress state. pre and post).mate between ng with surfacetent is varyins would havepth intervals.
paction pointsting grid spac
mined based oproject, the gvariability ofspacing for 4.4m.
of CPT.
ect in Oman. Ia stockpile w
rs before the fierial was pusng to even mution is shown
hat the fines chan the sand us varying stro
Project B.
and the depthm below final sered the most
med to densify The quality c. The location
compaction e compaction.
ng a lot, no Se been applica
s, as cing on a grid f the this
It is was
final hed
more n in con-used ong-
h to sur-ap-the
con-n of im-. SCF able
6.
6.1
IC iCPis posandpos
the
posis uand
6.2
percom37(de
folshiovethahigthefrozonSCbe
Figgenfor
IC figoneSCcorIC pro
Results
1. Working
After calculatis calculated o
PT. After calcmade betweest compactiond post compssible. Several calcu
e available CP1. Usin
SCF2. Aver
dept3. Aver
fromdept
In order to pst compactionused: IC. A pd thus represe
2. Project A
The dataset urformed beformpaction in th1 CPT’s penominated t).The results o
llowing figureift in SBT ther the full comat the averaggher than the ae shift in the Iom zone 6 (sane 7 (gravelly
CF used, the smost with theThe differenc
gure 11 to Fignerally situater one third CPFinally, in Fivalue is show
gure for the cee-third locatio
CF according trrect approachvalue betwe
onounced than
method
ting the soil bover the relevculating the aven the averagen CPT’s. Theaction CPT’s
ulations have PT’s: ng the three mF: 1, 1.3 and acrage IC overth; rage IC over
m the top: 0-2mth. present the din CPT’s, the dpositive valueents a ‘coarser
A
used in the anre compactionhe center poinperformed a. of the calcules. Figure 8 that occurs (bampacted fill dge IC value iaverage IC valC value, the m
ands – clean sy sand to densshift is more pe SCF accordice in smaller Igure 13. The ed in the rangT is situated igure 14 and F
wn for differenenter locationon. These figuto Eq. (7) as thh. At the centeen 2 and 8mn for the one-t
behavior indeant compactedverage value e IC coming e distance bets is choosen
been perform
mentioned apccording to Eqr the full co
following dem; 0-4m, 0-6
ifference betwdifference pre e means the por’ soil.
nalyses containn, 371 CPT pent (denominateat the one
ations are suto Figure 10 ased on the adepth). A first n the pre-CPlue in the postmaterial classisand to silty sse sand). Depepronounced. Ting to Eq. (7). IC intervals isIC for the cenge 0.2 to 0.4, in the higher rFigure 15, thent depth inter
n; the second ures only are his is theoreticter location, thm depth is third location.
x, an averaged depth of thea comparisonfrom pre andtween the pre
as small as
med based on
pproaches forq. (7); ompacted fill
epth intervalsm, 0-8m, full
ween pre andminus post IC
ost IC is lower
ns 371 CPT’serformed aftered with c) ande-third point
ummarized inillustrate the
average valueconclusion is
PT always ist-CPT. Due tofication shiftssand) towardsending on theThis seems to
s illustrated inntroid CPT iswhile the IC
ranges. e difference inrvals; the firstfigure for thegiven for the
cally the mosthe increase inclearly more
e e n d e s
n
r
l
s l
d C r
s r d t
n e e s s o s s e o
n s C
n t e e t n e

F
Fi
Figure 8. Shif
Figure 9. Shift
Figure 10. Shift
Figure 11. Differ
igure 12. Differe
ft in SBT (SCF=1
t in SBT (SCF=1
in SBT (SCF=Eq
ence in IC with S
ence in IC with SC
1).
.3).
q.(7))
CF=1.
CF=1.3.
Fig
Fi
occoneandbecwh
fro
Figure 13. Dif
gure 14. Change
gure 15. Change
Analysing thecurs in IC vale can expect td the relative come smallerhere the test isAs illustrated
om the com
fference in IC wit
in IC with depth
e in IC with depth
e above figurue due to vibthat, dependindensity achie
r. There is an performed (c
d in Figure 16mpaction poin
th SCF according
interval for loc. c
interval for loc. t
res learns thatbratory compang on the comeved, the IC van influence ofc or t). 6 (after [13]), nt the achie
g to Eq. (7).
c (SCF=Eq. (7)).
t (SCF=Eq. (7)).
t a clear shiftaction. In fact
mpaction effortalue seems tof the location
further awayeved density
t t t o n
y y

decreases, soshift is less pinfluencing tspread with the compacti
Rather unSCF has an ipure mathemcalibration ccause the larfines content(5) which lealower factor
Figure 16. Id
Apart from
performed atfore and aftpaign samplispoon samplsampler is suthe soil idensmaller thansituated in thmined in theple. The datakept separatesible crushin
1. P2. P
dThe resul
Figure 17, wand (7). On tis added. Froscatter occursite, the givevertical shift
o the effect of pronounced. Hthe results, sucdepth of the ion point. nfortunate butinfluence whicmatical. Thechamber testsrgest shift whit. This bringsads to a lower of safety agai
dealised response
m CPT’s alsot Project A. Ber compactioing is performler. The soil ubjected to sontification tes
n 63µm) is dehe same area e same depth a gained fromed in order to
ng during compPre BH data isPost BH data data lts of the co
with IC and SCthe figure theom the figure rs in the relatioen correlationwould be nee
f the compactioHowever, alsoch as the seleccompaction e
t unavoidablech is not relate
e use of a s ([7] and Eqich leads to as to discussiocorrection fac
inst liquefactio
of granular soils
o borehole witBorehole’s arn. During the
med by meansretrieved by
oil classificatisting the fineetermined. This studied andinterval of th
m pre- and po avoid differepaction:
s compared wiis compared
omparison is CF calculated e correlation s
it can be conon IC-fines con is not applieded.
on is less and o other effects cted SCF and
effort, away fr
e, the use of ed to the soil, SCF based
q. (7)) seemsn apparent lown the use of ctor and thus on.
to vibration ([13]
th SPT testingre performed e borehole ca
s of the SPT sy the split spion testing. Fres content (mhe CPT whichd the IC is dehe borehole saost-compactionences due to p
ith pre CPT dad with post C
summarizedbased on Eq. uggested by [
ncluded that lantent and for icable; at leas
the are the
rom
the but on
s to wer Eq. to a
]).
g is be-
am-split oon rom
mass h is eter-am-n is pos-
ata CPT
d in (1)
[14] arge this st a
andscaandshostrfit fin‘aprou
6.3
CPtheCPBamato CP– cmo
Figure 17. Com
Similar comd are summaatter is also d local calibow that raightforward
curve need nes contents pparent’ fineughly be esti
Figure 18. Co
3. Project B
At the projecPT’s were pere soil behavioPT’s is given ased on the aterial is situatsandy silt), h
PT’s most of tclean sand toore pronounce
mparison between
mparisons havarized and cfound in th
bration is suglocal calibd and large
to be allowdefined thou
es content byimated from
orrelations betwee
B
ct site, 34 preformed. The s
or type for thein Figure 19,pre-compact
ted in Zone 5 however basethe material iso silty sand). ed with increas
n fines content an
ve been madcommented ihese studies ggested. Abobration maydiviations fr
wed. For thisugh IC is als
y Robertson aIC.
en fines content a
e and 34 possoil classificae pre and pos, Figure 20 antion CPT’s (sand mixture
ed on the poss situated in ZThis becomi
sing SCF.
nd BH data.
de by othersin [3]. Large
(Figure 18)ove findingsy not berom the bests reason, theso called theand can only
and IC ([3]).
st compactionation based onst compactionnd Figure 21.most of thees – silty sandst-compactionZone 6 (sandsing more and
s e ) s e t e e y
n n n . e d n s d

Figure 19. Cla
Figure 20. Cla
Figure 21. Cla
The follo
shift in IC vthe full comFigure 24) (Figure 25,comparisonwas workedlarger the sh
From thelargest shiftshift becomthe compacshift in IC va
assification of thewith
assification of thewith
assification of thewith SC
owing figurevalue betwe
mpacted depthand for th
, Figure 26 n, the three ad out. Againhift in IC. e figures it cft is found inmes less withction energy alue is obtain
e material based oh SCF = 1.
e material based oSCF = 1.3.
e material based oCF = Eq. (7).
es give the cen pre and h (Figure 22
he defined dand Figure
approached inn, the larger
can clearly bn the top mh larger dept
is the largened.
on soil behavior ty
on soil behavior ty
on soil behavior ty
comparisonspost CPT’s
2, Figure 23 adepth interv27). For ea
n terms of Sr the SCF,
be seen that meters while
ths; thus whest, the high
ype
ype
ype
s of for
and vals ach
SCF the
the the
here hest
Figur
Figure
Figure 2
Figure
re 22. Difference
e 23. Difference i
24. Difference in
25. Change in IC
in IC with SCF =
n IC with SCF =
IC with SCF = Eq
with depth (SCF
= 1.
1.3.
q. (7).
F=1).

Figu
Figur
7. Discussi
Research done by othementioned theffective streK0 will havesult that the Iand post com0.3 as reportdata retrievewas used as g
Based on that a clear sands here, sto the pre comwould at leasing) fines coerally larger
ure 26. Change in
e 27. Change in I
ion
on change iners already, fohat after comess increases, an influence IC is reduced. mpaction CPTted in [15]. Ted from a prground improvthe data of Pshift IC is pr
suggesting a mpaction CPTst expect a sim
ontent in calcathan 0.3 and
n IC with depth (S
IC with depth (SC
n IC due to or silica sand.
mpaction the imeaning highon the qc witIn general, th
T’s changed bThese findingroject were vvement.
Project A, it cresent in the lower fines cT’s. This cannmilar to a highareous sands. depends on th
SCF=1.3).
CF=Eq. (7)).
compaction w. In ref. [15] iin-situ horizonher K0. A higth as a furtherhe IC between by about a facs were based
vibro-replacem
can be conclutested carbonontent compa
not be true as her (due to cruThe shift is ghe SCF used
was it is ntal
gher r re-pre
ctor d on ment
uded nate ared one
ush-gen-and
on gri
detthetheQCmo
deccononecaloccdepthaherlareff
fectena massparvalfin
theaftlemdatconcalficuusepacat tdefCPof therecpos
facIC by is sseathepro
8.
prothehowB hboner on
the location tid. When analyztail in this rese center seem e depth intervaC points at thore evenly sprThe data of Pcrease in the antrol CPT‘s. e could conclculated over curs. When lopth, the top dean the deeperre – although ge scatter in c
fect. These consid
ct on the liquent means a smmore conservasess the liquefrent fines conlues with a v
ned between prWhile a diffe
e IC, taking inter compactio
ms with corrected soils), thentent defined lculation of a ult dependinged and the locction grid. A cthis point. A cfined per soil
PT in the compairs of pre a
e best approaccted cone resist compactionWith regard t
ctor also may value. When means of cali
suggested as iarches that thee measured coonounced at h
Conclusion
Data obtainedocessed and ae reclamationswever the mathas a higher nates content fines contentvibroflotation
the CPT is pe
zing Figure 1spect, the CPTto give a mu
als between 2he one-third lead with deptProject B alsoaverage IC beBased on dif
clude that an the full comp
ooking into theepth intervalsr intervals. Thmaybe not al
carbonates con
derations needefaction asses
maller correctioative analysisfaction based ntent. This is alue of 0.3, bre and post co
ferent formulato account then (this phenoct IC definitioe use of pre c
via IC is recunique differ
g on the grouncation of the Ccorrect practiccorrection of Ilayer, depth i
mpaction grid,and post compch. This IC shistance (by m
n CPT’s. to the SCF, ithave an impono site specifibration chamit has been deere is an impoone resistance.igher relative
ns
d from 2 largeanalyzed. The s can be clasterial used at fines content compared to P
t at project Bn was only po
erformed in th
4 and FigureT quality conuch larger shi and 8m whillocation the sth. o shows a genetween pre andfferent scenar
average shifpacted heighte effect of coms clearly showhe use of diflways applicabntent – seems
d to be seen inssment. A lowon factor for f. In [15] it ison the pre-codone by cor
being the averompaction CPTa should be de higher horizomenon also
on in naturallycompaction acommended. Hrence in IC seend improvemCPT QC poincal approach dIC, based on aninterval and lo, derived frompaction CPT’should be used
means of a SC
t has been shortant effect ofic calibration
mber tests, the umonstrated by
ortant effect o. This effect bdensities and
e hydraulic rematerial used
ssified as calcconstruction sand somewh
Project A. Du, compaction
ossible at Proje
he compaction
e 15 more inntrol points inift than 0.3 ine for the CPTshift is much
neral trend ofd post qualityrios analysed,ft in IC-valuet of about 0.3mpaction with
w higher shiftsfferent SCF‘sble due to thes to aplify this
n terms of ef-wer fines con-fines and thuss suggested toompaction ap-rrecting al IC-rage shift de-T’s. developed forzontal stresses
causes prob-y overconsoli-apparent finesHowever, theems to be dif-
ment techniquent in the com-does not existn average IC
ocation of them comparisons seems to be
d with the cor-CF) form the
hown that thison the shift inn can be doneuse of Eq. (7)y different re-
of crushing onbecomes more
stress states.
eclamations isd to constructcareous sand,site of Projecthat lower car-ue to the high-
works basedect A. At Pro-
n
n n n T h
f y , e 3 h s s e s
--s o ---
r s --s e -e -t C e n e -e
s n e ) -n e
s t , t --d -

ject B it was decided to compact the reclamation mate-rial by dynamic compaction method.
Based on the average soil behavior index calculated on the data for both projects, it can be concluded that there is a shift between pre and post compaction data. There is also a difference between the average soil be-havior index calculated for the post CPT’s. Comparing centroid and one third CPT, shows that the soil behavior for the one third post CPT in general is lower than the soil behavior index for the post centroid CPT. Further, a difference depending on depth intervals has also been demonstrated. It seems that the difference in soil behav-ior type is the largest, where the largest compaction en-ergy is applied.
This finding is further amplified when a SCF is used to take into account the crushing effects in calcareous sands. In this paper, it is suggested to use a SCF derived from calibration chamber testing as the use of a fixed SCF is not in accordance of the findings from earlier re-search and this might influence the IC-value found. Thus, not only making the assessment of relative densi-ty erroneous, but also the estimation of apparent fines content.
The effect on the calculation of IC and possible mag-nitude of the shift is discussed. While this shift would suggest ‘coarser’ material, this is not physically possible and the influence of this on further use of IC needs to get the right attention. Especially when IC is used to calcu-late a fines content correction in the liquefaction as-sessment according to the commonly used ‘simplified’ methods. Although the error made seems to be at the ‘conservative’, safe side, this does not lead to an eco-nomical design and should be clearly recognized by all parties involved.
The use of a correction based on comparison of the pre and post compaction IC’s is recommended.
Comparing borehole data and soil behavior index, it can be concluded that deriving the (apparent) fines con-tent from the soil behavior index indicates large scatter. Quality control to define the ‘fines content’ (percent passing the 63 micron sieve) based on the IC is not re-commended.
References
[1] van ‘t Hoff, J. & Nooy van der Kolff, A. 2012. Hydraulic Fill Manual. For dredging and reclamation works. CUR/CIRIA Pub-lication. CRC Press/Balkema.
[2] Youd, T.L., Idriss, I.M., Andrus, D.D., Arango, I., Castro, G., Christian, J.T., Dobry, R., Finn, W.D.L., Harder, L.F., Hynes, M.E., Ishihara, K., Koester, J.P., Liao, S.S.C., Marcuson III, W.F., Martin, G.R., Mitchell, J.K., Moriwaki, Y., Power M.S., Robertson, P.K., Seed, R.B., Stokoe, K.H., 2001, Liquefaction Resistance of Soils: Summary Report from the 1996 NCEER and 1998 NCEER/NSF Workshops on Evaluation of Liquefaction Resistance of Soils, J. Geotechnical and Geoenvironmental En-gineering, ASCE, October, pp. 817-833.
[3] Boulanger, R. W, Idriss, I.M., 2014, CPT and SPT liquefaction triggering procedures, Report No. UCD/CGM-14/01, University of California Davis, California, April, pp. 138.
[4] Robertson, P.K. & Wride, C.E. 1998. Evaluating cyclic liquefac-tion potential using the cone penetration test. Canadian Geotech-nical J., 35: 442-459.
[5] Almeida, M.S.S., Jamiolkowski, M., Peterson, R.W., 1991, Pre-liminary results of CPT tests in Calcareous Quiou Sand, Proceed-ings of the First International Symposium on Calibration Cham-ber Testing, Edt. Huang A-B., Potsdam, New York, 28-29 June: 41-53.
[6] Lunne, T., Robertson, P.K. and Powell, J.J.M., 1997, Cone Pene-tration Testing in Geotechnical Practice, Blackie Academic & Professional Publication.
[7] Mengé, P., Vinck, K., van den Broeck, M., Van Impe, P.O., Van Impe, W., 2016, Evaluation of relative density and liquefaction potential with CPT in reclaimed calcareous sand, ISC’5, Gold Coast, Australia, 1235-1240.
[8] Wehr, W.J. 2005. Influence of the carbonate content of sand on vibrocompaction. Proc. 6th Int. conf. on Ground Improvement techniques, Coimbra, Portugal: 525-632.
[9] Mayne, P.W. 2014. Interpretation of geotechnical parameters from seismic piezocone tests. 3rd Int. Symp. on Cone Penetration Testing, Las Vegas, Nevada, USA: 47-73.
[10] Robertson, P.K., 1990, Interpretation of cone penetration tests, Canadian Geotechnical J., 46: 1337-1355.
[11] Robertson, P.K., 2010, Soil behavior type from the CPT: an up-date, 2nd International Symposium on Cone Penetration Testing, CPT’10, Huntington Beach, CA, USA.
[12] Robertson, P.K. (2016) Cone Penetration Test (CPT)-Based Soil Behaviour Type (SBT) Classification System—An Update. Ca-nadian Geotechnical J., 53: 1910-1927.
[13] Kirsch, K., Kirsch, F., 2010, Ground improvement by deep vi-bratory method, First ed., Spon Press, New York, USA.
[14] Yi, F., 2014, Estimating soil fines contents from CPT data, In: 3rd International Symposium on Cone Penetration Testing, Las Vegas, Nevada, USA.
[15] T.V. Nguyen, L. Shao, J. Gingery, P. Robertson "Proposed modi-fication to CPT-based liquefaction method for post-vibratory ground improvement", In: Geo-Congress, Atlanta, Georgia, USA, 2014