Influence of Biochar Additions on Net Greenhouse Gas Production
22
Influence of Biochar Additions on Net Greenhouse Gas Production Kurt Spokas 1 and Don Reicosky 2 1 – USDA-ARS, Soil and Water Management Unit, St. Paul, MN 2 – USDA-ARS, North Central Soil Conservation Laboratory, Morris, MN
Transcript of Influence of Biochar Additions on Net Greenhouse Gas Production

Influence of Biochar Additions on Net Greenhouse Gas Production
Kurt Spokas 1 and Don Reicosky 2
1 – USDA-ARS, Soil and Water Management Unit, St. Paul, MN2 – USDA-ARS, North Central Soil Conservation Laboratory, Morris, MN

Biochar Research
➲ Benefits of biochar additions to oxisol soils are known
➲ What happens for other soils with the addition of biochars?
• Part of new ARS multi-location
Biochar and Pyrolysis Initiative
•6 ARS locations :
Ames, IA; Kimberly, ID; St. Paul, MN;
Big Spring, TX; Florence, SC; Prosser, WA.
• Continuous corn (same crop for comparison)
•In addition to following crop yield and
soil carbon:
Soil gas concentrations and trace gas fluxes
Continual subsurface CO2 measurements (25 cm)
Biochar Research

Rosemount Biochar Field Trials
•Small scale triplicate plots (16’ x 16’) largely due to the limited availability of biochar.
(Application rate : 20,000 lbs/acre)
•Fast pyrolysis biochar (sawdust, CQuestTM Dynamotive1)
•With and without manure addition (5,000 lb/acre)
•Slow pyrolysis biochar (woodchip, Best Energies1)
•Slow pyrolysis biochar (macadamia nut, Biochar Brokers1)
1-Names are necessary to report factually on available data; however, the USDA neither guarantees nor warrants the
standard of the product, and the use of the name by USDA implies no approval of the product to the exclusion of others
that may also be suitable.
•Larger strip plots (16’ x 93’)
•Hardwood charcoal (ground lump charcoal, Kingsford1)
•Slow pyrolysis biochar (macadamia nut, Biochar Brokers1) (3 rates: 5,000, 10,000 and 20,000 lb/acre)

Laboratory Studies
16 different biochars evaluated
7 different biomass parent materials

BC # Parent Material Source Pyrolysis
Temp (oC)
C N O Ash Surface Area
(m2 g-1)
1 Corn stover Best Energies 815 45 0.5 1 55 4.4
2 Pine wood chip EPRIDA 465 75 0.3 9 6 0.1
3 Peanut hulls EPRIDA 481 59 2.7 12 15 1.0
4 Corn stover R. Brown – Iowa State 500 25 0.6 5 69 4.2
5 Corn stover EPRIDA 410 42 1.0 11 54 2.2
6 N/A Char C Group
(BiosourceTM)
465 43 2.2 N/A N/A 63.5
7 Turkey manure
Woodchip
SWROC-Univ. of MN 850 1 0.1 3 89 4.8
8 Hardwood D. Laird (USDA-ARS) N/A 69 0.7 9 14 19.2
9 Pine woodchip EPRIDA 465 71 0.2 11 9 0.2
10 Peanut hulls EPRIDA 481 60 0.9 10 15 286
11 Corn stover EPRIDA 505 66 1.2 4 54 17.3
12 Corn stover EPRIDA 515 51 1.0 0 74 9.9
13 Coconut shells
(Activated)
Willinger Bros. 450 83 0.4 0 12 960
14 Woodchip (pellet) Chip Energy N/A 69 0.1 20 5 24
15 Hardwood lump
charcoal
Kingsford 538 53 0.4 10 27 7.2
16 Macadamia shells Biochar Brokers
(EternaGreen™)
N/A 84 0.6 2 2 0.4

Weathered impact
Weathered char (1 yr on outdoor storage pile):
Minor changes in composition data (loss of N)
Major change in surface area (286x)
BC # Parent Material Pyrolysis
Temp (oC)
C N O Ash Surface Area
(m2 g-1)
3 Peanut hulls
(fresh)
481 59 2.7 12 15 1.0
10 Peanut hulls
(weathered)
481 66 0.9 10 15 286
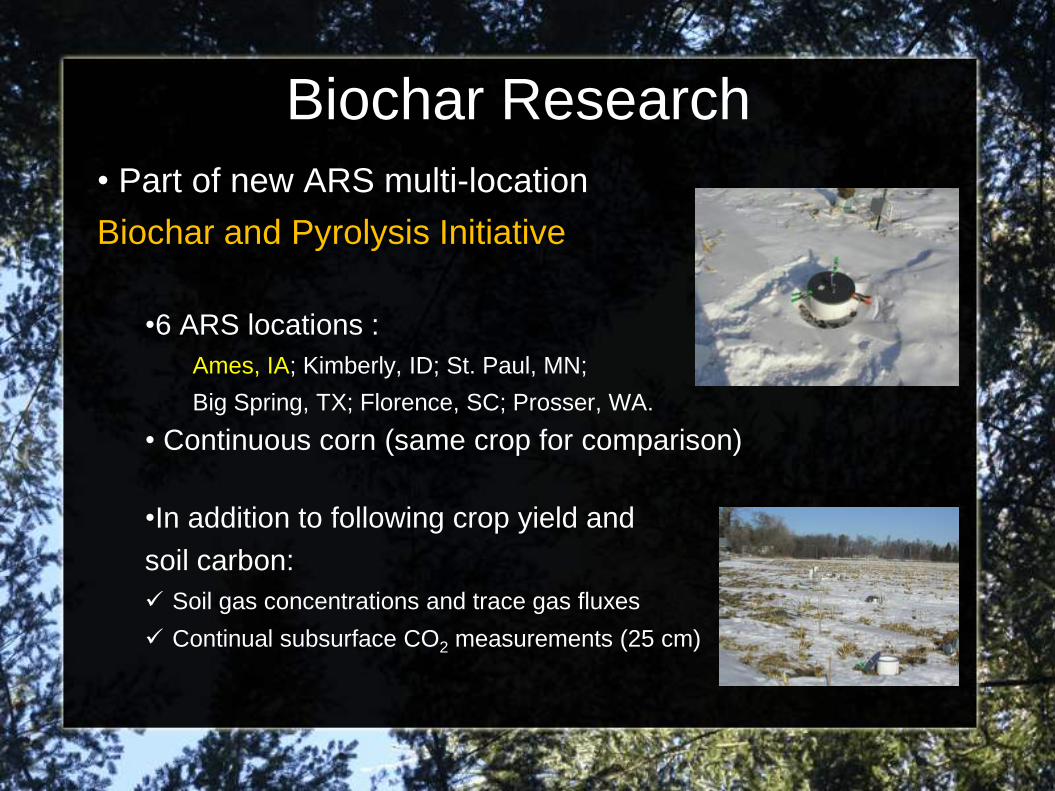
Impact of degassing treatment on surface area
Samples were degassed for 3 hrs at a temperature of 300 and 400 oC
Parent Material Surface Area
( m2 g-1: 300 oC)
Surface Area
(m2 g-1: 400 oC)
Coconut shells
(activated charcoal)
960 976
Wood pellets 62 177
Hardwood lump charcoal 7 34
Macadamia shells 0.4 7
Hardwood chips 24 66
Sawdust (pine) 0.8 46
Increase in surface area: 2.5 to 57 times

Laboratory Incubations
• Minnesota agricultural soil
• Waukegan silt loam
• Wisconsin forest nursery soil
• Vilas loamy sand
• California landfill cover soil
• Marina loamy sand
Soil incubations used to assess the impacts of these 16 different biochars with soils from 3 different ecosystems:
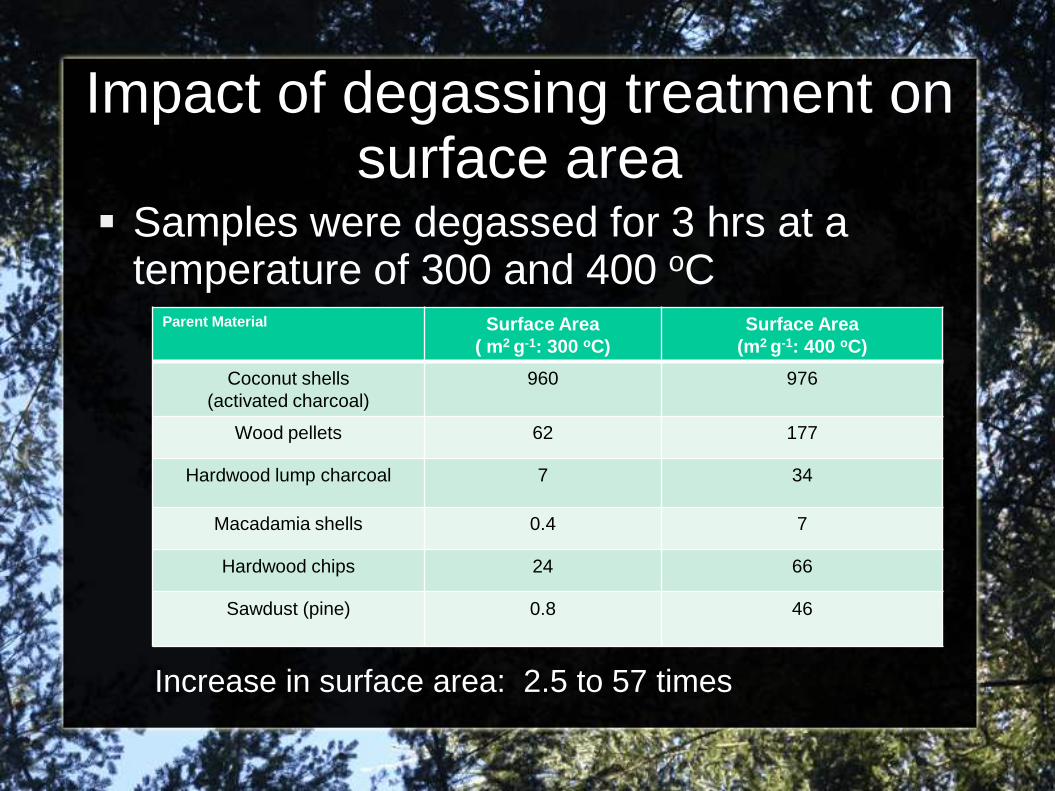
Assessment of Gas Production
• 5 g of soil mixed with 0.5 g biochar (10% w/w)
• Headspace periodically monitored with GC/MS.
• Production rates estimated from the change in concentration with time.
• Length of incubations
25 – 100 days
• Requirement:
O2 concentrations >15%
y = 6.8067x + 572.84R² = 0.9838
0
200
400
600
800
1000
0 20 40 60
pp
m C
O2
Days

Biochar CO2 Production
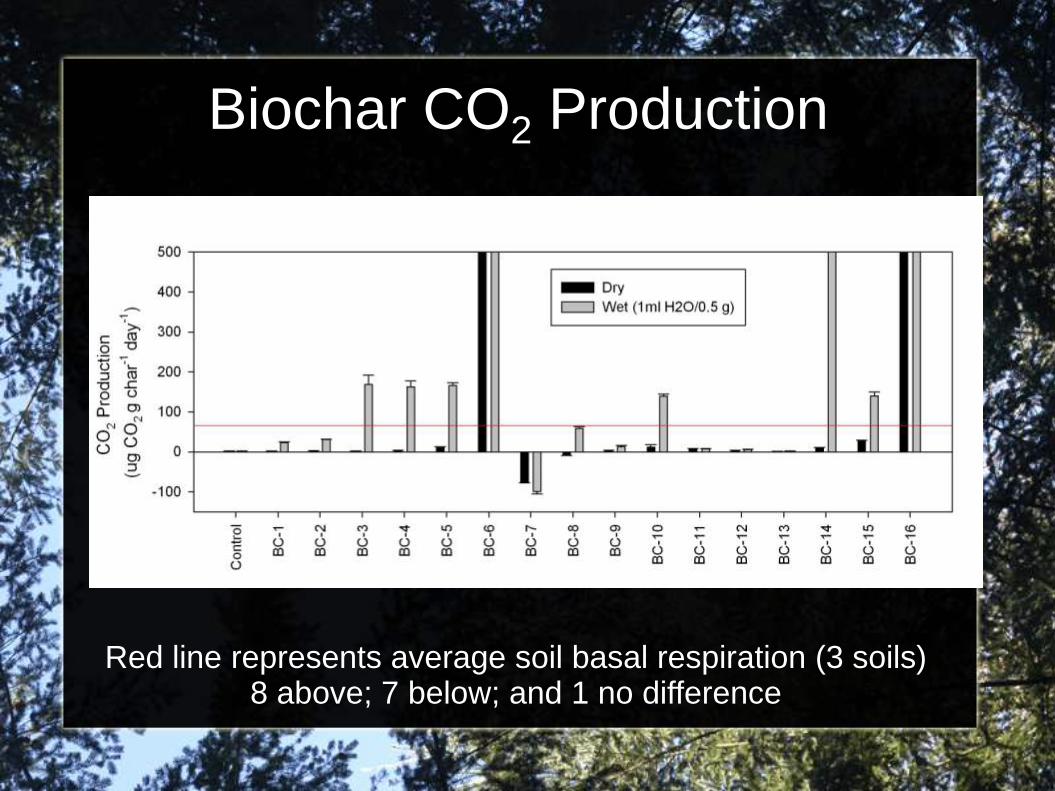
Biochar CO2 Production
Red line represents average soil basal respiration (3 soils)8 above; 7 below; and 1 no difference

Methane : Biochar alone
Dry
Wet (1ml H2O/0.5 g)

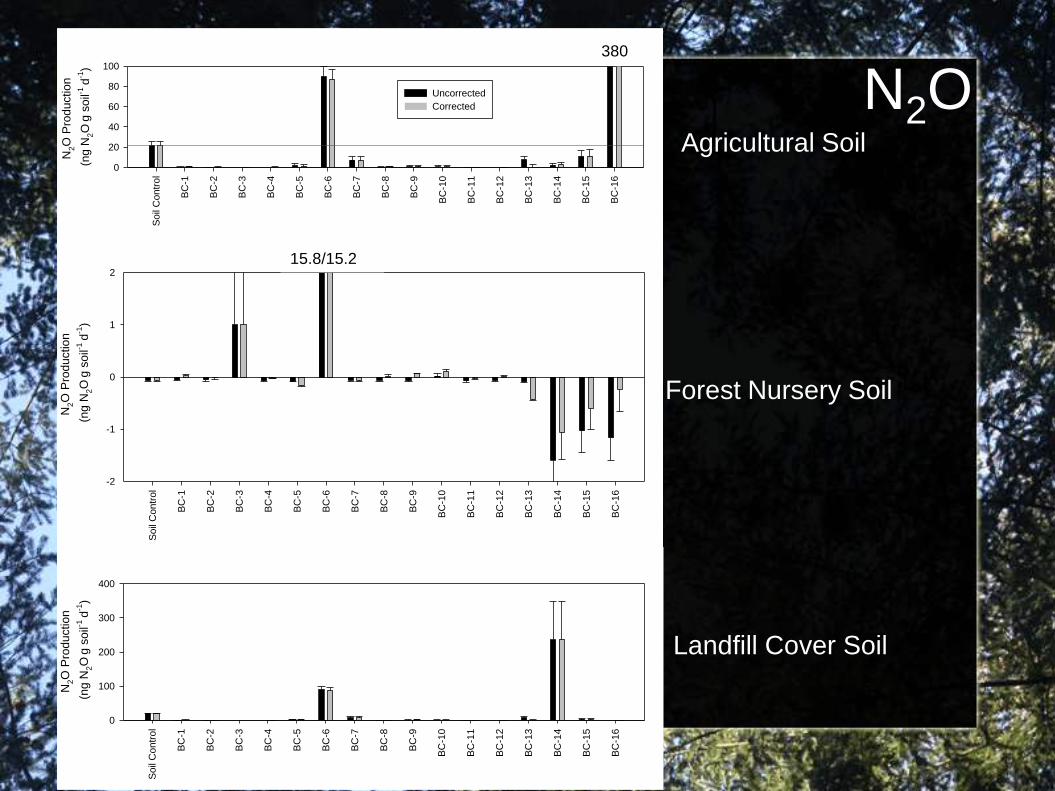
N2O : Biochar alone
Dry
Wet (1ml H2O/0.5 g)
Only 3 biochars were significantly different than
control (no char) – 1 produced N2O and 2
consumed N2O (sorption or denitrification?)
*
**

Ethane and Ethylene ProductionBC-16 macadamia shell biochar
Observable production of ethane and ethylene…as well as other hydrocarbons (not currently identified)
Production rates:
Ethane: 200 ± 4.7 ng C2H6 gchar-1 d-1
Ethylene: 82 ± 9.7 ng C2H4 gchar-1 d-1
In soils – reduced by 40 - 73%, potentially
due to microbial oxidation
CO2S
oil
Co
ntr
ol
BC
-1
BC
-2
BC
-3
BC
-4
BC
-5
BC
-6
BC
-7
BC
-8
BC
-9
BC
-10
BC
-11
BC
-12
BC
-13
BC
-14
BC
-15
BC
-16
CO
2 P
rod
uctio
n
(ug C
O2
g s
oil-1
d-1
)
0
20
40
60
80
100
Uncorrected
Corrected
Soil
Contr
ol
BC
-1
BC
-2
BC
-3
BC
-4
BC
-5
BC
-6
BC
-7
BC
-8
BC
-9
BC
-10
BC
-11
BC
-12
BC
-13
BC
-14
BC
-15
BC
-16
CO
2 P
roduction
(ug C
O2
g s
oil-1
day
-1)
-200
0
200
400
600
800
1000
1200
1400
1600
1800
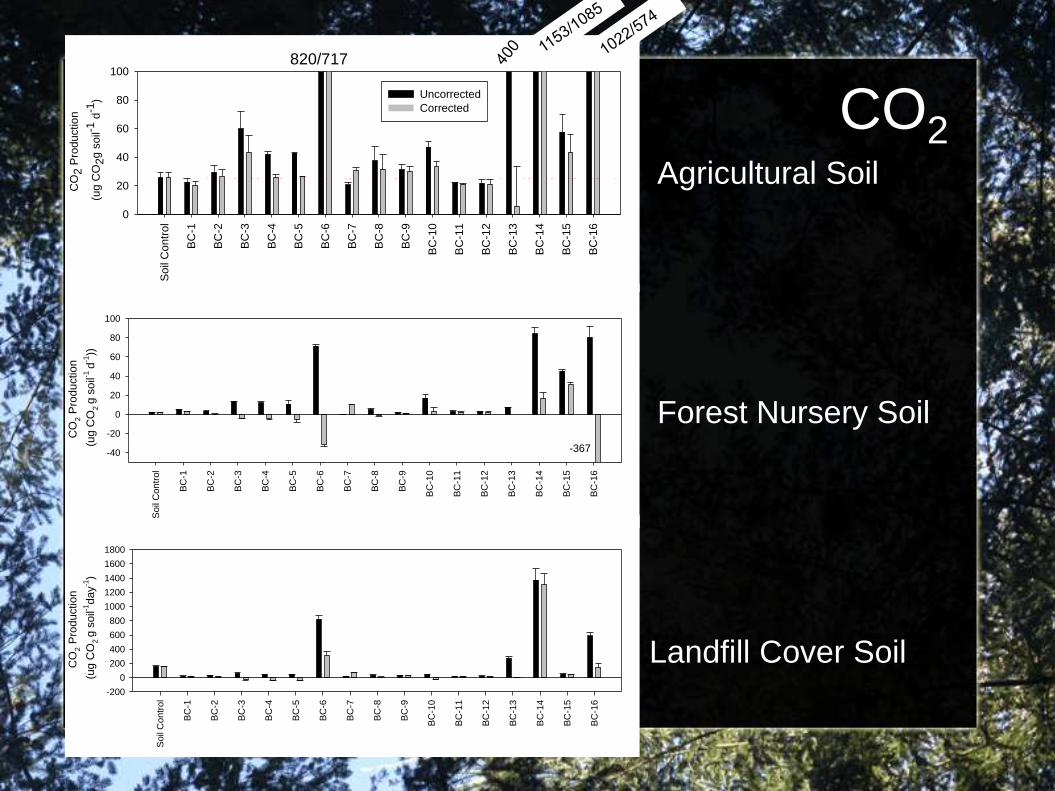
Agricultural Soil
Forest Nursery Soil
Landfill Cover Soil
820/717
Soil
Contr
ol
BC
-1
BC
-2
BC
-3
BC
-4
BC
-5
BC
-6
BC
-7
BC
-8
BC
-9
BC
-10
BC
-11
BC
-12
BC
-13
BC
-14
BC
-15
BC
-16
CO
2 P
rod
uctio
n
(ug C
O2
g s
oil-1
d-1
))
-40
-20
0
20
40
60
80
100
-367
CH4S
oil
Con
tro
l
BC
-1
BC
-2
BC
-3
BC
-4
BC
-5
BC
-6
BC
-7
BC
-8
BC
-9
BC
-10
BC
-11
BC
-12
BC
-13
BC
-14
BC
-15
BC
-16
CH
4 P
roduction
(ng C
H4
g s
oil-1
d-1
)
-25
-20
-15
-10
-5
0
5
10
15
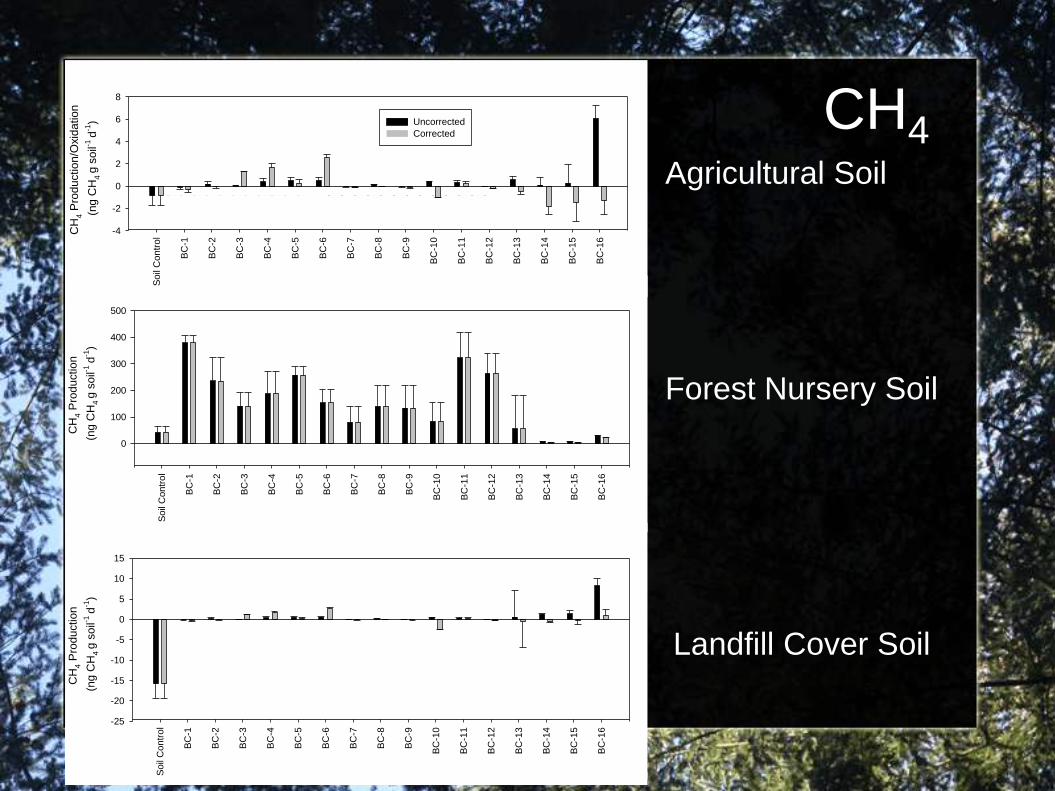
Agricultural Soil
Forest Nursery Soil
Landfill Cover Soil
So
il C
on
tro
l
BC
-1
BC
-2
BC
-3
BC
-4
BC
-5
BC
-6
BC
-7
BC
-8
BC
-9
BC
-10
BC
-11
BC
-12
BC
-13
BC
-14
BC
-15
BC
-16
CH
4 P
roduction
(ng C
H4
g s
oil-1
d-1
)
0
100
200
300
400
500
Soil
Contr
ol
BC
-1
BC
-2
BC
-3
BC
-4
BC
-5
BC
-6
BC
-7
BC
-8
BC
-9
BC
-10
BC
-11
BC
-12
BC
-13
BC
-14
BC
-15
BC
-16
CH
4 P
rod
uction/O
xid
ation
(ng C
H4
g s
oil-1
d-1
)
-4
-2
0
2
4
6
8
Uncorrected
Corrected

Macadam
ia s
hell
NS
15 biochars significantly reduced CH4 oxidation; 1 non-significant decrease.
Closer look at CH4 oxidationLandfill cover soil elevated CH4 levels
(2000 ppm)
N2OS
oil
Contr
ol
BC
-1
BC
-2
BC
-3
BC
-4
BC
-5
BC
-6
BC
-7
BC
-8
BC
-9
BC
-10
BC
-11
BC
-12
BC
-13
BC
-14
BC
-15
BC
-16
N2O
Pro
duction
(ng N
2O
g s
oil-1
d-1
)
0
20
40
60
80
100
Uncorrected
Corrected
Soil
Contr
ol
BC
-1
BC
-2
BC
-3
BC
-4
BC
-5
BC
-6
BC
-7
BC
-8
BC
-9
BC
-10
BC
-11
BC
-12
BC
-13
BC
-14
BC
-15
BC
-16
N2O
Pro
du
ctio
n
(ng N
2O
g s
oil-1
d-1
)
-2
-1
0
1
2
Agricultural Soil
Forest Nursery Soil
Landfill Cover Soil
Soil
Contr
ol
BC
-1
BC
-2
BC
-3
BC
-4
BC
-5
BC
-6
BC
-7
BC
-8
BC
-9
BC
-10
BC
-11
BC
-12
BC
-13
BC
-14
BC
-15
BC
-16
N2O
Pro
du
ctio
n
(ng N
2O
g s
oil-1
d-1
)
0
100
200
300
400
15.8/15.2
380

Conclusions Positive effect observed so far in laboratory
Reduction in N2O production potential
No consistent trends in CO2
Majority reduced basal CO2 respiration
Majority of biochars reduce CH4 oxidation activity
Soil methanotrophs are the only known biological sink for atmospheric methane
Preliminary lab results – field plot research is ongoing…

Conclusions
Not all biochars are the same:
Creation process, original feedstock,
temperatures, etc..
Greenhouse gas production:
Complicated by biochar production,
release, or sorption – this is
particularly important for CO2
Overall, greenhouse gas impacts function
of both char and the soil

Acknowledgements
We would like to acknowledge the cooperation:
Dynamotive Energy Systems – Fast pyrloysis char through non-funded CRADA agreement
Best Energies – Slow pyrolysis char through a MTA agreement
Biochar Brokers , Chip Energy and David Laird for their assistance in acquiring various biochars.
Martin duSaire, Tia Phan, Lindsey Watson, and Lianne Endo for technical assistance.


![Original Research Biochar Mitigates Greenhouse Gas ... Mitigates.pdf · reducing soil GHG emissions [15-21]. Biochar plays an important role in accommodating soil processes (e.g.,](https://static.fdocuments.net/doc/165x107/600c9157db8bff0a361b7edf/original-research-biochar-mitigates-greenhouse-gas-reducing-soil-ghg-emissions.jpg)