Influence of bacterial uptake on deep-ocean dissolved organic carbon
13
Influence of bacterial uptake on deep-ocean dissolved organic carbon Jørgen Bendtsen and Claus Lundsgaard National Environmental Research Institute, Roskilde, Denmark Mathias Middelboe Marine Biological Laboratory, University of Copenhagen, Helsingør, Denmark David Archer Department of Geophysical Sciences, University of Chicago, Chicago, Illinois, USA Received 13 June 2002; revised 4 September 2002; accepted 17 September 2002; published 13 December 2002. [1] Particulate organic carbon (POC) sinking out of the sunlit euphotic zone at the surface of the ocean feeds the deep sea and alters the CO 2 concentration of the atmosphere. Most of the sinking POC is reoxidized to dissolved inorganic carbon (DIC) before it hits the sea floor, but the mechanism for this is poorly understood. Here we develop a global model of the microbial loop in the aphotic zone based on new measurements of deep ocean bacterial metabolism. These together imply that a significant fraction of the decreasing POC flux with depth is converted to dissolved organic carbon (DOC) rather than directly to DIC as is commonly assumed, thereby providing the substrate for free-living bacteria in the deep ocean. The model suggests the existence of a substantial DOC-pool with a relatively fast turnover time in the deep sea. By implementing the microbial loop in a model of the global ocean circulation, we show that the observed gradient of DOC in the deep North Atlantic can be explained by the temperature dependence of bacterial metabolic activity in conjunction with the formation of deep-water at high latitudes. INDEX TERMS: 4806 Oceanography: Biological and Chemical: Carbon cycling; 4815 Oceanography: Biological and Chemical: Ecosystems, structure and dynamics; 4840 Oceanography: Biological and Chemical: Microbiology; 4842 Oceanography: Biological and Chemical: Modeling; KEYWORDS: dissolved organic carbon, carbon cycle, remineralization, bacteria, microbial loop, Greenland Sea Citation: Bendtsen, J., C. Lundsgaard, M. Middelboe, and D. Archer, Influence of bacterial uptake on deep-ocean dissolved organic carbon, Global Biogeochem. Cycles, 16(4), 1127, doi:10.1029/2002GB001947, 2002. 1. Introduction [2] DOC in the ocean is mainly of marine origin despite the relatively large fluxes of terrigenous derived organic carbon into the ocean from runoff (0.4 Pg/yr) and aeolian sources [Opsahl and Benner, 1997]. This also holds for the deep-sea DOC in the Greenland Sea where low concen- tration of lignin oxidation products and high d 13 C-values of the DOC and the optical properties of the chromophoric dissolved organic matter all indicate a marine biogenic origin of the DOC [Opsahl et al., 1999; Stedmon and Markager, 2001]. The observed concentration of DOC below 1000 m depth is significantly higher in the northern North Atlantic (48 – 50 mM) than in the rest of the deep ocean (43 mM, except for the northern North Pacific where DOC<40 mM) [Hansell and Carlson, 1998a]. The deep-sea DOC distribution is also characterized by an old 14 C-age of about 4000–6000 year, which indicates a very low turnover rate of the deep DOC pool [Bauer et al., 1992]. Increased primary production during the spring and summer season causes an accumulation of DOC in the euphotic zone where the surface concentration has been observed to increase by up to 10 mM in the subtropical Atlantic [Carlson et al., 1994] and by 20–30 mM in the Norwegian Sea [Børsheim and Myklestad, 1997]. Subse- quently the accumulated DOC is remineralized or trans- ported into the aphotic zone during the autumn and the winter seasons. [3] These observations justify a separation of the marine DOC-pool into a ‘‘semilabile’’ and a ‘‘refractory’’ pool with a typical turnover timescale of months and millennia, respectively. This separation of the complex DOC pool into distinct fractions has been used to model the distribu- tion of DOC in the water column. Yamanaka and Tajika [1997] consider a semilabile and a refractory pool of DOC in a global ocean circulation model and they find that the DOC distribution in the upper part of the main thermocline GLOBAL BIOGEOCHEMICAL CYCLES, VOL. 16, NO. 4, 1127, doi:10.1029/2002GB001947, 2002. Copyright 2002 by the American Geophysical Union. 0886-6236/02/2002GB001947$12.00 74 - 1
Transcript of Influence of bacterial uptake on deep-ocean dissolved organic carbon
Influence of bacterial uptake on deep-ocean dissolved organic
carbon
Jørgen Bendtsen and Claus LundsgaardNational Environmental Research Institute, Roskilde, Denmark
Mathias MiddelboeMarine Biological Laboratory, University of Copenhagen, Helsingør, Denmark
David ArcherDepartment of Geophysical Sciences, University of Chicago, Chicago, Illinois, USA
Received 13 June 2002; revised 4 September 2002; accepted 17 September 2002; published 13 December 2002.
[1] Particulate organic carbon (POC) sinking out of the sunlit euphotic zone at thesurface of the ocean feeds the deep sea and alters the CO2 concentration of theatmosphere. Most of the sinking POC is reoxidized to dissolved inorganic carbon (DIC)before it hits the sea floor, but the mechanism for this is poorly understood. Here wedevelop a global model of the microbial loop in the aphotic zone based on newmeasurements of deep ocean bacterial metabolism. These together imply that a significantfraction of the decreasing POC flux with depth is converted to dissolved organic carbon(DOC) rather than directly to DIC as is commonly assumed, thereby providing thesubstrate for free-living bacteria in the deep ocean. The model suggests the existence of asubstantial DOC-pool with a relatively fast turnover time in the deep sea. Byimplementing the microbial loop in a model of the global ocean circulation, we show thatthe observed gradient of DOC in the deep North Atlantic can be explained by thetemperature dependence of bacterial metabolic activity in conjunction with the formationof deep-water at high latitudes. INDEX TERMS: 4806 Oceanography: Biological and Chemical:
Carbon cycling; 4815 Oceanography: Biological and Chemical: Ecosystems, structure and dynamics; 4840
Oceanography: Biological and Chemical: Microbiology; 4842 Oceanography: Biological and Chemical:
Modeling; KEYWORDS: dissolved organic carbon, carbon cycle, remineralization, bacteria, microbial loop,
Greenland Sea
Citation: Bendtsen, J., C. Lundsgaard, M. Middelboe, and D. Archer, Influence of bacterial uptake on deep-ocean dissolved organic
carbon, Global Biogeochem. Cycles, 16(4), 1127, doi:10.1029/2002GB001947, 2002.
1. Introduction
[2] DOC in the ocean is mainly of marine origin despitethe relatively large fluxes of terrigenous derived organiccarbon into the ocean from runoff (0.4 Pg/yr) and aeoliansources [Opsahl and Benner, 1997]. This also holds for thedeep-sea DOC in the Greenland Sea where low concen-tration of lignin oxidation products and high d13C-values ofthe DOC and the optical properties of the chromophoricdissolved organic matter all indicate a marine biogenicorigin of the DOC [Opsahl et al., 1999; Stedmon andMarkager, 2001]. The observed concentration of DOCbelow 1000 m depth is significantly higher in the northernNorth Atlantic (48–50 mM) than in the rest of the deepocean (�43 mM, except for the northern North Pacificwhere DOC<40 mM) [Hansell and Carlson, 1998a]. Thedeep-sea DOC distribution is also characterized by an old
14C-age of about 4000–6000 year, which indicates a verylow turnover rate of the deep DOC pool [Bauer et al.,1992]. Increased primary production during the spring andsummer season causes an accumulation of DOC in theeuphotic zone where the surface concentration has beenobserved to increase by up to 10 mM in the subtropicalAtlantic [Carlson et al., 1994] and by 20–30 mM in theNorwegian Sea [Børsheim and Myklestad, 1997]. Subse-quently the accumulated DOC is remineralized or trans-ported into the aphotic zone during the autumn and thewinter seasons.[3] These observations justify a separation of the marine
DOC-pool into a ‘‘semilabile’’ and a ‘‘refractory’’ pool witha typical turnover timescale of months and millennia,respectively. This separation of the complex DOC poolinto distinct fractions has been used to model the distribu-tion of DOC in the water column. Yamanaka and Tajika[1997] consider a semilabile and a refractory pool of DOCin a global ocean circulation model and they find that theDOC distribution in the upper part of the main thermocline
GLOBAL BIOGEOCHEMICAL CYCLES, VOL. 16, NO. 4, 1127, doi:10.1029/2002GB001947, 2002.
Copyright 2002 by the American Geophysical Union.0886-6236/02/2002GB001947$12.00
74 - 1

(0–400 m depth) is well described by an e-folding time forthe decay of the semilabile DOC of about 0.5 yr. Due to theshort timescale for the decomposition of semilabile DOCinto DIC they find that the deep-sea semilabile DOCconcentration is only about 1 mM in the deep ocean witha maximum of about 3 mM in the deep northern Pacific. Asimilar timescale of less than 1 yr for the semilabile DOC isdetermined in a study of the global carbon cycle where therole of the plankton dynamics in the euphotic zone isexplicitly resolved [Six and Maier-Reimer, 1996]. Archeret al. [1997] estimate a timescale of about 6 months for thedecay of newly produced DOC in the equatorial Pacificwhich is transported into the seasonal thermocline. In aone-dimensional study of the cycling of labile, semilabileand refractory DOC, the transport by vertical advection anddiffusion of DOC was shown to be important in the upperpart of the main thermocline whereas the DOC releasedfrom the sinking flux of POC was shown to be importantfor providing the substrate for the bacteria in the deeperpart of the water column [Anderson and Williams, 1999]. Inaccordance with the studies above, Anderson and Williams[1999] estimate a turnover timescale of 0.4 year for thesemilabile pool of DOC.[4] The deep-sea thermohaline circulation in the North
Atlantic is dominated by the southward transport of NorthAtlantic Deep Water (NADW) which originate in the Green-land Sea area [Reid and Lynn, 1971]. Interactions betweenthe thermohaline circulation and the DOC-pool could explainthe observed deep-sea gradient of DOC in the North Atlantic,but would imply a timescale for the degradation of DOC ofseveral decades, as this is the timescale for the deep circu-lation in the eastern North Atlantic [Smethie et al., 2000].This is much longer than the estimated short timescale ofabout 6–12 months for the decay of the semilabile fraction ofDOC in the tropical and subtropical seasonal thermocline,and significantly less than the timescale for the old ‘‘refrac-tory’’ deep-sea DOC pool. Therefore these models can notexplain the observed deep-sea DOC distribution in the NorthAtlantic reported by Hansell and Carlson [1998a].[5] Here we show that a simple microbial loop based on
the bacterial biomass and the temperature and substratedependent bacterial metabolic activity can account for thedifferent turnover timescales ranging from months tomillennia and that the influence of the bacterial activityis reflected in the deep-sea DOC distribution, in particularin areas close to deep-water formation regions. The micro-bial loop is based on new measurements from the Green-land Sea which provide evidence for the importance of theparticle-associated transport of DOC in the water column.Our results supports the view that a major part of theorganic carbon cycle in the ocean may be characterized as:POC ! DOC ! Bacteria ! DIC [Cho and Azam, 1988;Nagata et al., 2000].
2. Measurements of Labile DOC, BacterialBiomass and Production
[6] We measured the concentration of labile organiccarbon and the production and biomass of bacterioplanktonduring two cruises to the Greenland Sea in June and August
1999 (see Appendix A). Labile DOC (DOCl) is here definedas the amount of DOC which can be utilized by bacteriawithin 1 week of incubation at 20�C [Søndergaard andMiddelboe, 1995]. DOCl is not an estimate of the total poolof biodegradable DOC (DOCb), but provides an estimate ofthe fraction of DOCb that is readily utilized by bacteria.Labile DOC was found to be present at significant concen-trations of 0.04–0.76 mM below 1000 m depth. We cannotexclude that the measured concentration of labile DOC maybe slightly overestimated due to DOC contamination fromwater filtration and handling of incubation bottles (M.Middelboe and C. Lundsgaard, Microbial activity in theGreenland Sea: The role of DOC lability, mineral nutrientsand temperature, submitted to Aquatic Microbial Ecology,2002). However, the fact that we found indications for awell-functioning microbial loop in the deep sea (i.e., sig-nificant bacterial production, Table 1) and significant abun-dance of both viruses and heterotrophic protozoa, supportedthe observed presence of a pool of labile DOC in the deepwaters. The presence of a labile DOC-pool with a turnovertime of weeks to months can only be explained by transportvia fast sinking (of the order 100 m d�1) particulate organicmatter, as any advective or diffusive transport of surfacederived DOC to this depth would require several months(see section 5). The bacterial biomass decreases from 11–20 mg C m�3 in the upper 100 m to about 4 mg C m�3 at500 m depth and the Production/Biomass (P/B)-ratiodecreases correspondingly (Table 1).
3. Microbial Loop
[7] Together with earlier reported observations of thedeep-ocean DOC distribution [Hansell and Carlson,1998a] the observed labile deep-sea DOC-pool in theGreenland Sea motivated the formulation of a model for amicrobial loop working in the deep ocean based on thebacterial uptake of particle-transported DOC (Figure 1). Themodel assumes that all of the sinking POC is dissolved tobiodegradable DOCb through hydrolytic enzymatic activity[Smith et al., 1992; Middelboe et al., 1995], viral lysis ofparticle-associated bacteria [Proctor and Fuhrman, 1991] orby grazing zooplankton. The dissolution of POC providesthe substrate for the free-living bacteria in the deep ocean[Cho and Azam, 1988; Nagata et al., 2000]. Furthermorewe assume that the subsequent remineralization of DOCb
ultimately is controlled by the bacterial activity. The deepsea is resource-limited with respect to the supply of organiccarbon [Billen et al., 1990; Dufour and Torreton, 1996;Nagata et al., 2000]; therefore we neglect the effects ofviruses, bacterivores and other grazers in controlling theuptake of DOCb in our model of the mesopelagic zone.Bacterial carbon uptake is determined from our observationsof bacterial growth rates and bacterial growth efficiency,and bacterial mortality is constrained by previously reportedobservations of bacterial abundance and the dissolution ofPOC to DOCb in the deep-ocean (see below).
3.1. Model Description
[8] The microbial loop working in the water columnbelow the euphotic zone is driven by the dissolution (D)of the sinking POC to DOCb (Figure 1). The growth of the
74 - 2 BENDTSEN ET AL.: BACTERIA AND DEEP-OCEAN DISSOLVED ORGANIC CARBON
bacterial biomass (B) is regulated by the bacterial carbonuptake (U ) and the mortality (M ). The bacterial mortalitycontributes to the DOCb and the refractory DOC (DOCr)pools with the fractions �b and �r respectively. The remainingpart of the mortality loss and a fraction of the bacterialcarbon uptake determined by the yield (w) are remineralizedto DIC. DOCr is transformed to DOCb at the surface throughphoto-dissociation (L). The conservation equations for thedifferent carbon pools in the microbial loop are given by:
@ B
@ t¼ wU �M ð1Þ
@ DOCb
@ t¼ �U þ �b M þ Dþ L ð2Þ
@ DOCr
@ t¼ �r M � L ð3Þ
@DIC
@ t¼ ð1� �b � �rÞM þ ð1� wÞU ð4Þ
In addition to the sinks and sources formulated in equations(1)–(4) the contribution from advective and diffusivetransports also affect the distribution of the four statevariables. The influence from these transports on shapingthe global deep-sea DOC distribution is studied in section 4.
3.2. Bacterial Uptake
[9] The bacterial production (P), related to the bacterialuptake via the yield, can be described in terms of thespecific growth rate (m) and the bacterial biomass:
P ¼ wU ¼ mB ð5Þ
The temperature dependence of the bacterial metabolicactivity can be characterized as:
m ¼ m0 QT�T010
10 ð6Þ
where T0 = 0�C is a reference temperature and m0 is atemperature normalized specific growth rate which candepend on other limiting factors, as for example the substrateavailability. The temperature dependence of bacterialactivity is found to be characterized by a Q10-factor withinthe range of 2–3 in large areas of the ocean [Pomeroy andWiebe, 2001], and our growth experiments with mixedbacterial samples from the Greenland Sea gives a value ofQ10 = 3.0 (M. Middelboe and C. Lundsgaard, Microbialactivity in the Greenland Sea: The role of DOC lability,mineral nutrients and temperature, submitted to Aquatic
Microbial Ecology, 2002). We use this value as representa-tive for the temperature dependence of the bacterial uptake inthe microbial loop. The temperature dependence of thebacterial carbon uptake in the model is based on ourobservations in the Greenland Sea. This temperaturedependence has been found in previous studies of thebacterial activity in cold waters [Rivkin et al., 1996] and thebacterial production has also been shown to correlate withboth temperature and chlorophyll in the surface layers of theglobal ocean [Rivkin and Legendre, 2001]. From theseexperiments we also determine a yield factor of w = 0.33which lies within the range of earlier reported values for themarine environment [del Giorgio and Cole, 1998]. We applythis value in the microbial loop.[10] The specific growth rate decreases from 0.03 d�1 at
100 m depth to a low value of about 0.01 d�1 below 500 m(Table 1). The relative small vertical temperature gradient inthe Greenland Sea can not account for this decrease in m,and therefore we suggest that this change reflects a decreasein the substrate value of the released DOC. To account forthis increase of the specific growth rate in the upper oceanwe model m0 as:
m0 ¼ aDOCb ð7Þ
where a is a substrate affinity of the bacterial uptake ofDOCb. In general, the bacterial uptake can be modeled bya Monod expression involving a maximum uptake rate and
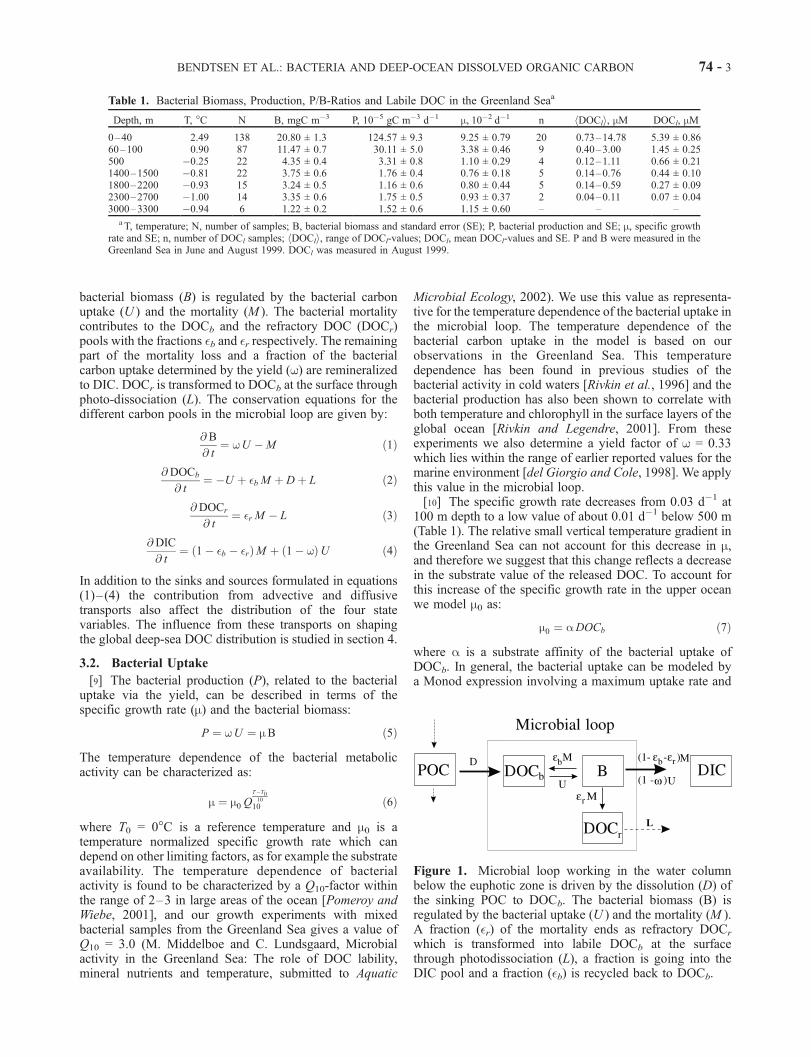
Table 1. Bacterial Biomass, Production, P/B-Ratios and Labile DOC in the Greenland Seaa
Depth, m T, �C N B, mgC m�3 P, 10�5 gC m�3 d�1 m, 10�2 d�1 n hDOCli, mM DOCl, mM
0–40 2.49 138 20.80 ± 1.3 124.57 ± 9.3 9.25 ± 0.79 20 0.73–14.78 5.39 ± 0.8660–100 0.90 87 11.47 ± 0.7 30.11 ± 5.0 3.38 ± 0.46 9 0.40–3.00 1.45 ± 0.25500 �0.25 22 4.35 ± 0.4 3.31 ± 0.8 1.10 ± 0.29 4 0.12–1.11 0.66 ± 0.211400–1500 �0.81 22 3.75 ± 0.6 1.76 ± 0.4 0.76 ± 0.18 5 0.14–0.76 0.44 ± 0.101800–2200 �0.93 15 3.24 ± 0.5 1.16 ± 0.6 0.80 ± 0.44 5 0.14–0.59 0.27 ± 0.092300–2700 �1.00 14 3.35 ± 0.6 1.75 ± 0.5 0.93 ± 0.37 2 0.04–0.11 0.07 ± 0.043000–3300 �0.94 6 1.22 ± 0.2 1.52 ± 0.6 1.15 ± 0.60 – – –
aT, temperature; N, number of samples; B, bacterial biomass and standard error (SE); P, bacterial production and SE; m, specific growthrate and SE; n, number of DOCl samples; hDOCli, range of DOCl-values; DOCl, mean DOCl-values and SE. P and B were measured in theGreenland Sea in June and August 1999. DOCl was measured in August 1999.
Figure 1. Microbial loop working in the water columnbelow the euphotic zone is driven by the dissolution (D) ofthe sinking POC to DOCb. The bacterial biomass (B) isregulated by the bacterial uptake (U ) and the mortality (M ).A fraction (�r) of the mortality ends as refractory DOCr
which is transformed into labile DOCb at the surfacethrough photodissociation (L), a fraction is going into theDIC pool and a fraction (�b) is recycled back to DOCb.
BENDTSEN ET AL.: BACTERIA AND DEEP-OCEAN DISSOLVED ORGANIC CARBON 74 - 3
a half saturation constant, but as bacterial uptake in theaphotic zone in the watercolumn is resource limited thisexpression can be linearized assuming a low concentrationof DOCb. The bacterial uptake can then finally bedescribed as:
U ¼ 1
waDOCb Q
T�T010
10 B ð8Þ
The yield and temperature dependence of the bacterial uptakeare well studied components of the bacterial metabolism,whereas the substrate affinity of deep-sea DOC is largelyunknown. Therefore we consider the sensitivity of themicrobial loop to this parameter below.
3.3. Bacterial Mortality
[11] The bacterial abundance (N ) below 1000 m depth inthe equatorial, subtropical and subarctic areas in the NorthPacific is well described as:
NðzÞ ¼ N1000
z
zd
� �a
ð9Þ
where N1000 is the abundance at zd = �1000 m depth andz is the vertical coordinate [Nagata et al., 2000]. Auniform value of a = �0.9 characterizes the abundancein all these different locations, and this finding hasimplications for modeling the bacterial mortality in equa-tions (1)–(4).[12] The parameterization of the bacterial mortality in the
deep ocean is not well constrained so we assume that thegeneral form of this term can be described by:
M ¼ mBn ð10Þ
where m is a mortality constant and n is the powerdependence of M on the bacterial biomass. The steady statesolution of equations (1) and (2), which can be solvedwithout considering the DIC and the DOCr pools when the
contribution from photodissociation (L) in the surface layeris neglected, is then given by:
B ¼ n
ffiffiffiffiffiffiffiffiffiffiffiffiffiffiffiffiffiffiffiffiffiffiffiffiDw
m ð1� �b wÞ
sð11Þ
As the source term for the microbial loop in the aphoticzone (D) we use the convergence of the vertical flux of POCfound from sediment trap studies:
D ¼ F0
b
z0
z
z0
� �b�1
ð12Þ
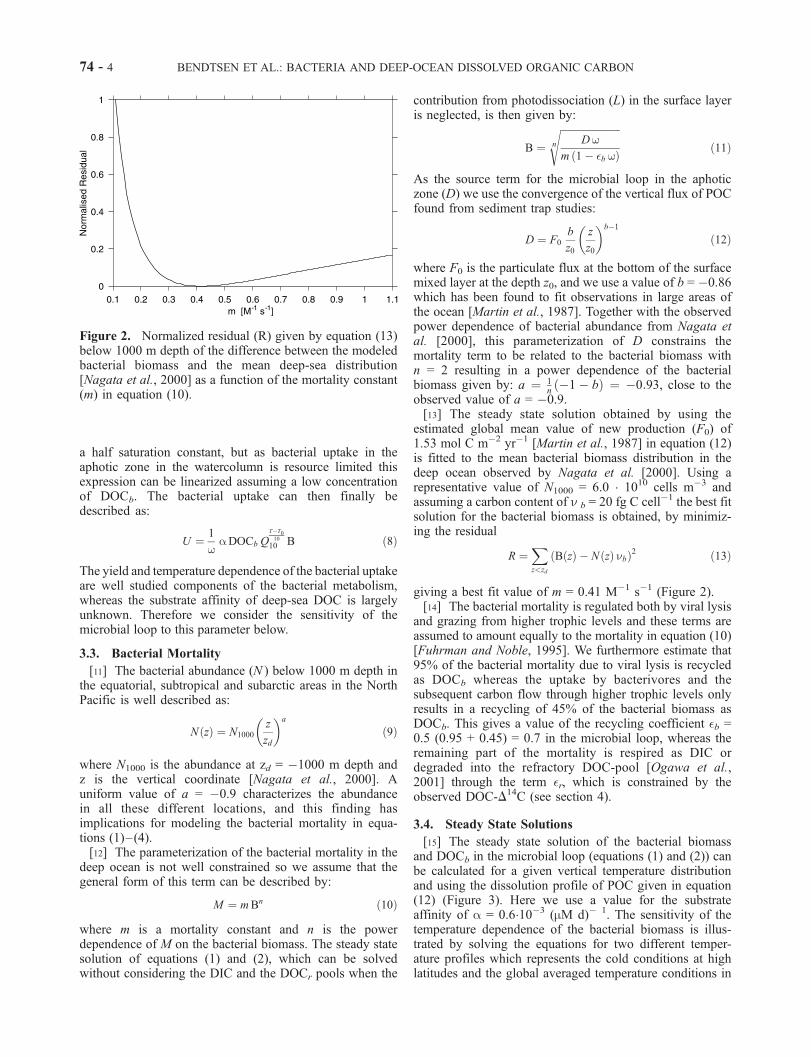
where F0 is the particulate flux at the bottom of the surfacemixed layer at the depth z0, and we use a value of b = �0.86which has been found to fit observations in large areas ofthe ocean [Martin et al., 1987]. Together with the observedpower dependence of bacterial abundance from Nagata etal. [2000], this parameterization of D constrains themortality term to be related to the bacterial biomass withn = 2 resulting in a power dependence of the bacterialbiomass given by: a ¼ 1
nð�1� bÞ ¼ �0:93, close to the
observed value of a = �0.9.[13] The steady state solution obtained by using the
estimated global mean value of new production (F0) of1.53 mol C m�2 yr�1 [Martin et al., 1987] in equation (12)is fitted to the mean bacterial biomass distribution in thedeep ocean observed by Nagata et al. [2000]. Using arepresentative value of N1000 = 6.0 1010 cells m�3 andassuming a carbon content of n b = 20 fg C cell�1 the best fitsolution for the bacterial biomass is obtained, by minimiz-ing the residual
R ¼Xz<zd
ðBðzÞ � NðzÞ nbÞ2 ð13Þ
giving a best fit value of m = 0.41 M�1 s�1 (Figure 2).[14] The bacterial mortality is regulated both by viral lysis
and grazing from higher trophic levels and these terms areassumed to amount equally to the mortality in equation (10)[Fuhrman and Noble, 1995]. We furthermore estimate that95% of the bacterial mortality due to viral lysis is recycledas DOCb whereas the uptake by bacterivores and thesubsequent carbon flow through higher trophic levels onlyresults in a recycling of 45% of the bacterial biomass asDOCb. This gives a value of the recycling coefficient �b =0.5 (0.95 + 0.45) = 0.7 in the microbial loop, whereas theremaining part of the mortality is respired as DIC ordegraded into the refractory DOC-pool [Ogawa et al.,2001] through the term �r, which is constrained by theobserved DOC-D14C (see section 4).
3.4. Steady State Solutions
[15] The steady state solution of the bacterial biomassand DOCb in the microbial loop (equations (1) and (2)) canbe calculated for a given vertical temperature distributionand using the dissolution profile of POC given in equation(12) (Figure 3). Here we use a value for the substrateaffinity of a = 0.610�3 (mM d)� 1. The sensitivity of thetemperature dependence of the bacterial biomass is illus-trated by solving the equations for two different temper-ature profiles which represents the cold conditions at highlatitudes and the global averaged temperature conditions in
Figure 2. Normalized residual (R) given by equation (13)below 1000 m depth of the difference between the modeledbacterial biomass and the mean deep-sea distribution[Nagata et al., 2000] as a function of the mortality constant(m) in equation (10).
74 - 4 BENDTSEN ET AL.: BACTERIA AND DEEP-OCEAN DISSOLVED ORGANIC CARBON
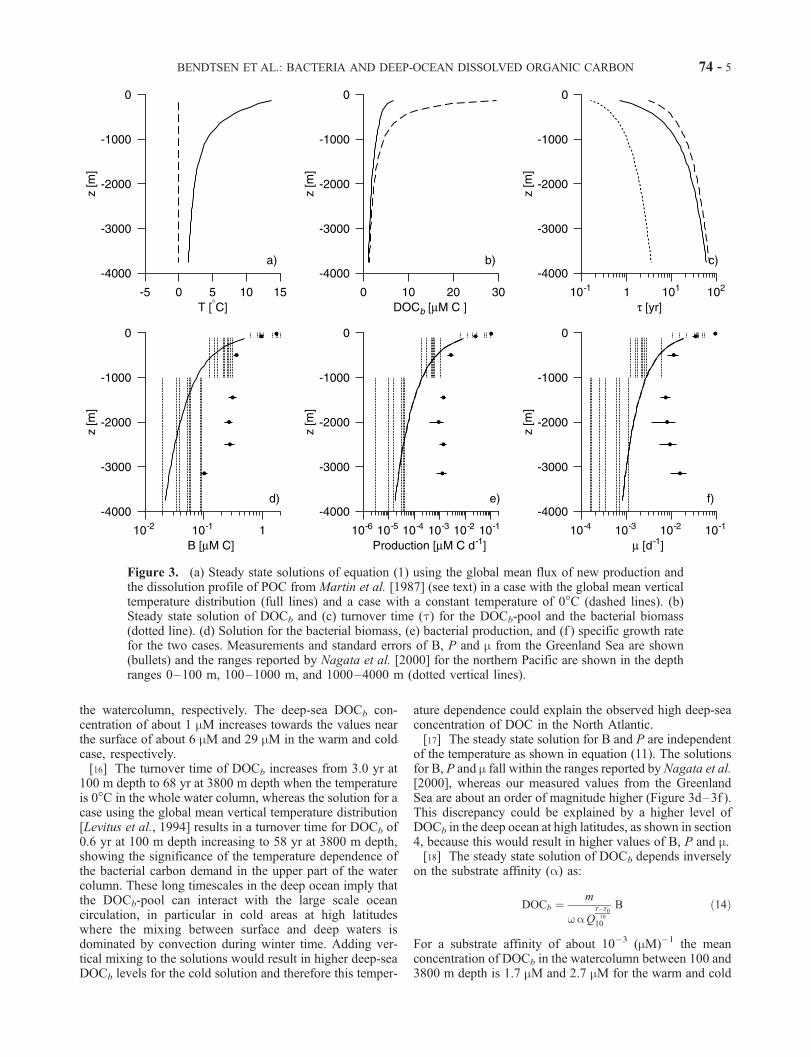
the watercolumn, respectively. The deep-sea DOCb con-centration of about 1 mM increases towards the values nearthe surface of about 6 mM and 29 mM in the warm and coldcase, respectively.[16] The turnover time of DOCb increases from 3.0 yr at
100 m depth to 68 yr at 3800 m depth when the temperatureis 0�C in the whole water column, whereas the solution for acase using the global mean vertical temperature distribution[Levitus et al., 1994] results in a turnover time for DOCb of0.6 yr at 100 m depth increasing to 58 yr at 3800 m depth,showing the significance of the temperature dependence ofthe bacterial carbon demand in the upper part of the watercolumn. These long timescales in the deep ocean imply thatthe DOCb-pool can interact with the large scale oceancirculation, in particular in cold areas at high latitudeswhere the mixing between surface and deep waters isdominated by convection during winter time. Adding ver-tical mixing to the solutions would result in higher deep-seaDOCb levels for the cold solution and therefore this temper-
ature dependence could explain the observed high deep-seaconcentration of DOC in the North Atlantic.[17] The steady state solution for B and P are independent
of the temperature as shown in equation (11). The solutionsfor B, P and m fall within the ranges reported by Nagata et al.[2000], whereas our measured values from the GreenlandSea are about an order of magnitude higher (Figure 3d–3f ).This discrepancy could be explained by a higher level ofDOCb in the deep ocean at high latitudes, as shown in section4, because this would result in higher values of B, P and m.[18] The steady state solution of DOCb depends inversely
on the substrate affinity (a) as:
DOCb ¼m
waQT�T010
10
B ð14Þ
For a substrate affinity of about 10�3 (mM)�1 the meanconcentration of DOCb in the watercolumn between 100 and3800 m depth is 1.7 mM and 2.7 mM for the warm and cold
Figure 3. (a) Steady state solutions of equation (1) using the global mean flux of new production andthe dissolution profile of POC from Martin et al. [1987] (see text) in a case with the global mean verticaltemperature distribution (full lines) and a case with a constant temperature of 0�C (dashed lines). (b)Steady state solution of DOCb and (c) turnover time (t) for the DOCb-pool and the bacterial biomass(dotted line). (d) Solution for the bacterial biomass, (e) bacterial production, and (f ) specific growth ratefor the two cases. Measurements and standard errors of B, P and m from the Greenland Sea are shown(bullets) and the ranges reported by Nagata et al. [2000] for the northern Pacific are shown in the depthranges 0–100 m, 100–1000 m, and 1000–4000 m (dotted vertical lines).
BENDTSEN ET AL.: BACTERIA AND DEEP-OCEAN DISSOLVED ORGANIC CARBON 74 - 5
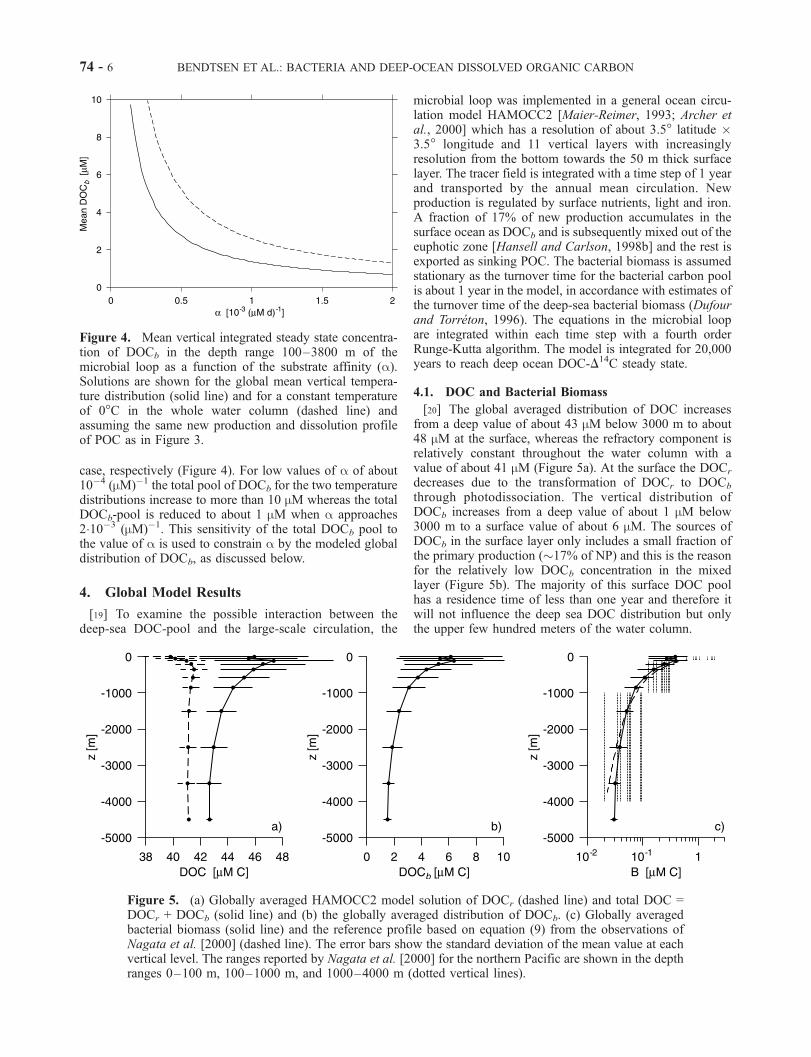
case, respectively (Figure 4). For low values of a of about10�4 (mM)�1 the total pool of DOCb for the two temperaturedistributions increase to more than 10 mM whereas the totalDOCb-pool is reduced to about 1 mM when a approaches210�3 (mM)�1. This sensitivity of the total DOCb pool tothe value of a is used to constrain a by the modeled globaldistribution of DOCb, as discussed below.
4. Global Model Results
[19] To examine the possible interaction between thedeep-sea DOC-pool and the large-scale circulation, the
microbial loop was implemented in a general ocean circu-lation model HAMOCC2 [Maier-Reimer, 1993; Archer etal., 2000] which has a resolution of about 3.5� latitude �3.5� longitude and 11 vertical layers with increasinglyresolution from the bottom towards the 50 m thick surfacelayer. The tracer field is integrated with a time step of 1 yearand transported by the annual mean circulation. Newproduction is regulated by surface nutrients, light and iron.A fraction of 17% of new production accumulates in thesurface ocean as DOCb and is subsequently mixed out of theeuphotic zone [Hansell and Carlson, 1998b] and the rest isexported as sinking POC. The bacterial biomass is assumedstationary as the turnover time for the bacterial carbon poolis about 1 year in the model, in accordance with estimates ofthe turnover time of the deep-sea bacterial biomass (Dufourand Torreton, 1996). The equations in the microbial loopare integrated within each time step with a fourth orderRunge-Kutta algorithm. The model is integrated for 20,000years to reach deep ocean DOC-D14C steady state.
4.1. DOC and Bacterial Biomass
[20] The global averaged distribution of DOC increasesfrom a deep value of about 43 mM below 3000 m to about48 mM at the surface, whereas the refractory component isrelatively constant throughout the water column with avalue of about 41 mM (Figure 5a). At the surface the DOCr
decreases due to the transformation of DOCr to DOCb
through photodissociation. The vertical distribution ofDOCb increases from a deep value of about 1 mM below3000 m to a surface value of about 6 mM. The sources ofDOCb in the surface layer only includes a small fraction ofthe primary production (�17% of NP) and this is the reasonfor the relatively low DOCb concentration in the mixedlayer (Figure 5b). The majority of this surface DOC poolhas a residence time of less than one year and therefore itwill not influence the deep sea DOC distribution but onlythe upper few hundred meters of the water column.
Figure 4. Mean vertical integrated steady state concentra-tion of DOCb in the depth range 100–3800 m of themicrobial loop as a function of the substrate affinity (a).Solutions are shown for the global mean vertical tempera-ture distribution (solid line) and for a constant temperatureof 0�C in the whole water column (dashed line) andassuming the same new production and dissolution profileof POC as in Figure 3.
Figure 5. (a) Globally averaged HAMOCC2 model solution of DOCr (dashed line) and total DOC =DOCr + DOCb (solid line) and (b) the globally averaged distribution of DOCb. (c) Globally averagedbacterial biomass (solid line) and the reference profile based on equation (9) from the observations ofNagata et al. [2000] (dashed line). The error bars show the standard deviation of the mean value at eachvertical level. The ranges reported by Nagata et al. [2000] for the northern Pacific are shown in the depthranges 0–100 m, 100–1000 m, and 1000–4000 m (dotted vertical lines).
74 - 6 BENDTSEN ET AL.: BACTERIA AND DEEP-OCEAN DISSOLVED ORGANIC CARBON
[21] The globally averaged bacterial carbon biomassincreases from a low concentration of about 310�2 mMbelow 4000 m depth to a surface value of about 0.4 mM at100 m depth (Figure 5c). This vertical distribution reflectsthe distribution of DOCb which is the substrate for thebacterial biomass. The global averaged value is in goodaccordance with the global mean vertical reference profile(Figure 5c, dashed line) based on the observations ofNagata et al. [2000] and described by equation (9). Theobserved range of the bacterial abundance in the NorthPacific ranges within a factor of ten, including the influencefrom seasonal changes, so the global averaged model resultsof the bacterial biomass are well within the observed valuesof Nagata et al. [2000].
4.2. DOC-D14C Distribution
[22] The observed deep ocean DOC concentration and theDOC-D14C place a strong constraint on the fraction of the
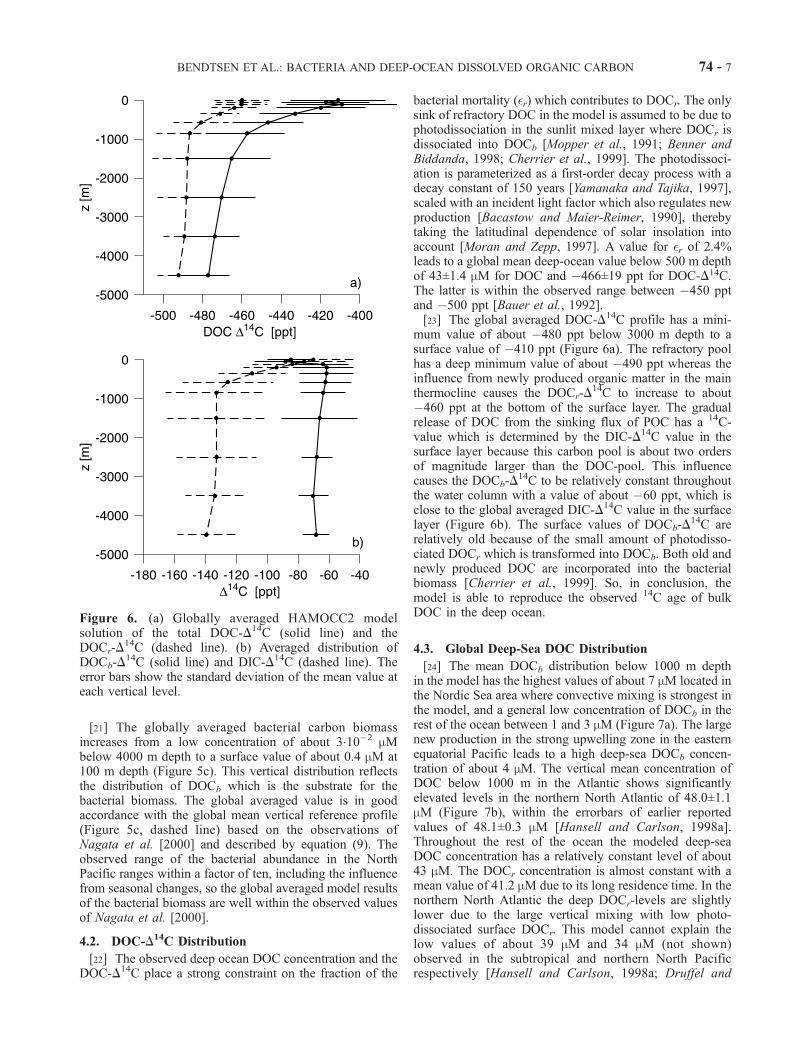
bacterial mortality (�r) which contributes to DOCr. The onlysink of refractory DOC in the model is assumed to be due tophotodissociation in the sunlit mixed layer where DOCr isdissociated into DOCb [Mopper et al., 1991; Benner andBiddanda, 1998; Cherrier et al., 1999]. The photodissoci-ation is parameterized as a first-order decay process with adecay constant of 150 years [Yamanaka and Tajika, 1997],scaled with an incident light factor which also regulates newproduction [Bacastow and Maier-Reimer, 1990], therebytaking the latitudinal dependence of solar insolation intoaccount [Moran and Zepp, 1997]. A value for �r of 2.4%leads to a global mean deep-ocean value below 500 m depthof 43±1.4 mM for DOC and �466±19 ppt for DOC-D14C.The latter is within the observed range between �450 pptand �500 ppt [Bauer et al., 1992].[23] The global averaged DOC-D14C profile has a mini-
mum value of about �480 ppt below 3000 m depth to asurface value of �410 ppt (Figure 6a). The refractory poolhas a deep minimum value of about �490 ppt whereas theinfluence from newly produced organic matter in the mainthermocline causes the DOCr-D
14C to increase to about�460 ppt at the bottom of the surface layer. The gradualrelease of DOC from the sinking flux of POC has a 14C-value which is determined by the DIC-D14C value in thesurface layer because this carbon pool is about two ordersof magnitude larger than the DOC-pool. This influencecauses the DOCb-D
14C to be relatively constant throughoutthe water column with a value of about �60 ppt, which isclose to the global averaged DIC-D14C value in the surfacelayer (Figure 6b). The surface values of DOCb-D
14C arerelatively old because of the small amount of photodisso-ciated DOCr which is transformed into DOCb. Both old andnewly produced DOC are incorporated into the bacterialbiomass [Cherrier et al., 1999]. So, in conclusion, themodel is able to reproduce the observed 14C age of bulkDOC in the deep ocean.
4.3. Global Deep-Sea DOC Distribution
[24] The mean DOCb distribution below 1000 m depthin the model has the highest values of about 7 mM located inthe Nordic Sea area where convective mixing is strongest inthe model, and a general low concentration of DOCb in therest of the ocean between 1 and 3 mM (Figure 7a). The largenew production in the strong upwelling zone in the easternequatorial Pacific leads to a high deep-sea DOCb concen-tration of about 4 mM. The vertical mean concentration ofDOC below 1000 m in the Atlantic shows significantlyelevated levels in the northern North Atlantic of 48.0±1.1mM (Figure 7b), within the errorbars of earlier reportedvalues of 48.1±0.3 mM [Hansell and Carlson, 1998a].Throughout the rest of the ocean the modeled deep-seaDOC concentration has a relatively constant level of about43 mM. The DOCr concentration is almost constant with amean value of 41.2 mM due to its long residence time. In thenorthern North Atlantic the deep DOCr-levels are slightlylower due to the large vertical mixing with low photo-dissociated surface DOCr. This model cannot explain thelow values of about 39 mM and 34 mM (not shown)observed in the subtropical and northern North Pacificrespectively [Hansell and Carlson, 1998a; Druffel and
Figure 6. (a) Globally averaged HAMOCC2 modelsolution of the total DOC-D14C (solid line) and theDOCr-D
14C (dashed line). (b) Averaged distribution ofDOCb-D
14C (solid line) and DIC-D14C (dashed line). Theerror bars show the standard deviation of the mean value ateach vertical level.
BENDTSEN ET AL.: BACTERIA AND DEEP-OCEAN DISSOLVED ORGANIC CARBON 74 - 7
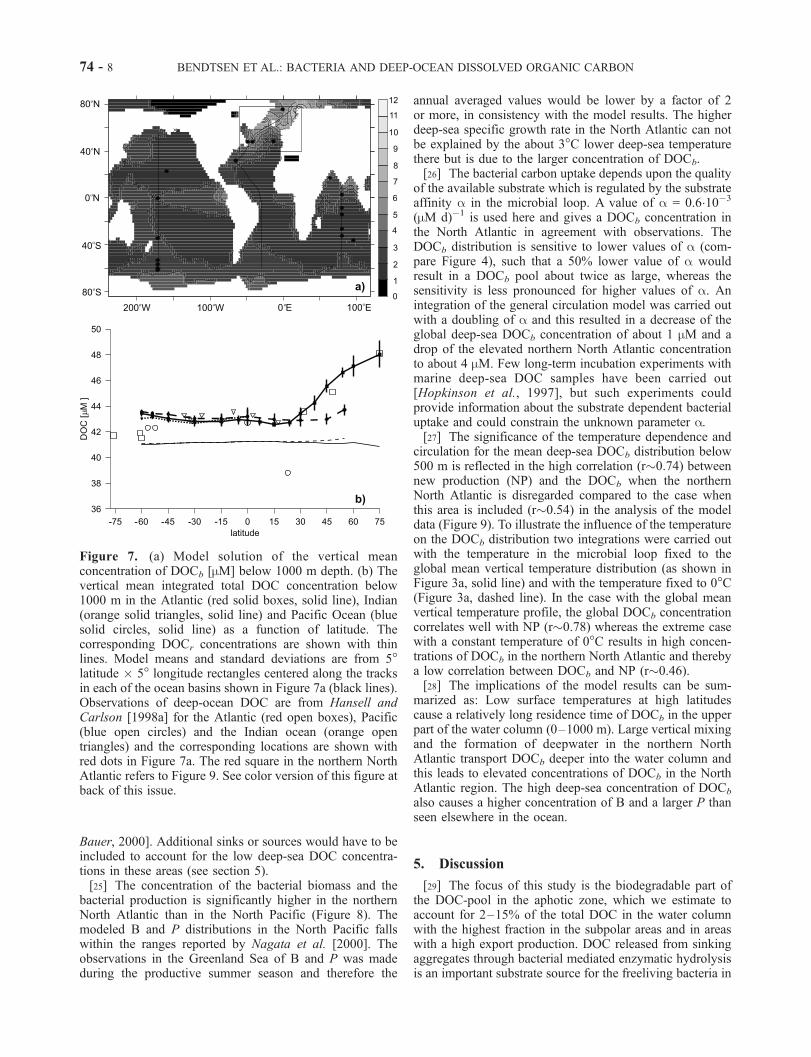
Bauer, 2000]. Additional sinks or sources would have to beincluded to account for the low deep-sea DOC concentra-tions in these areas (see section 5).[25] The concentration of the bacterial biomass and the
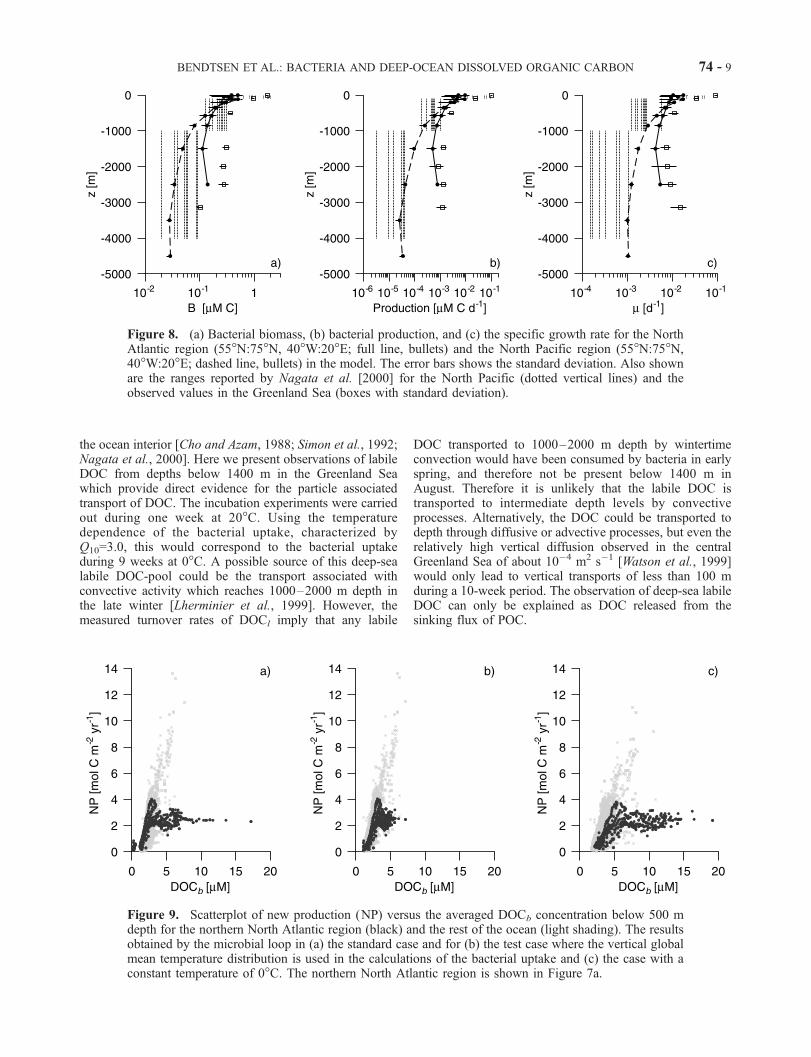
bacterial production is significantly higher in the northernNorth Atlantic than in the North Pacific (Figure 8). Themodeled B and P distributions in the North Pacific fallswithin the ranges reported by Nagata et al. [2000]. Theobservations in the Greenland Sea of B and P was madeduring the productive summer season and therefore the
annual averaged values would be lower by a factor of 2or more, in consistency with the model results. The higherdeep-sea specific growth rate in the North Atlantic can notbe explained by the about 3�C lower deep-sea temperaturethere but is due to the larger concentration of DOCb.[26] The bacterial carbon uptake depends upon the quality
of the available substrate which is regulated by the substrateaffinity a in the microbial loop. A value of a = 0.610�3
(mM d)�1 is used here and gives a DOCb concentration inthe North Atlantic in agreement with observations. TheDOCb distribution is sensitive to lower values of a (com-pare Figure 4), such that a 50% lower value of a wouldresult in a DOCb pool about twice as large, whereas thesensitivity is less pronounced for higher values of a. Anintegration of the general circulation model was carried outwith a doubling of a and this resulted in a decrease of theglobal deep-sea DOCb concentration of about 1 mM and adrop of the elevated northern North Atlantic concentrationto about 4 mM. Few long-term incubation experiments withmarine deep-sea DOC samples have been carried out[Hopkinson et al., 1997], but such experiments couldprovide information about the substrate dependent bacterialuptake and could constrain the unknown parameter a.[27] The significance of the temperature dependence and
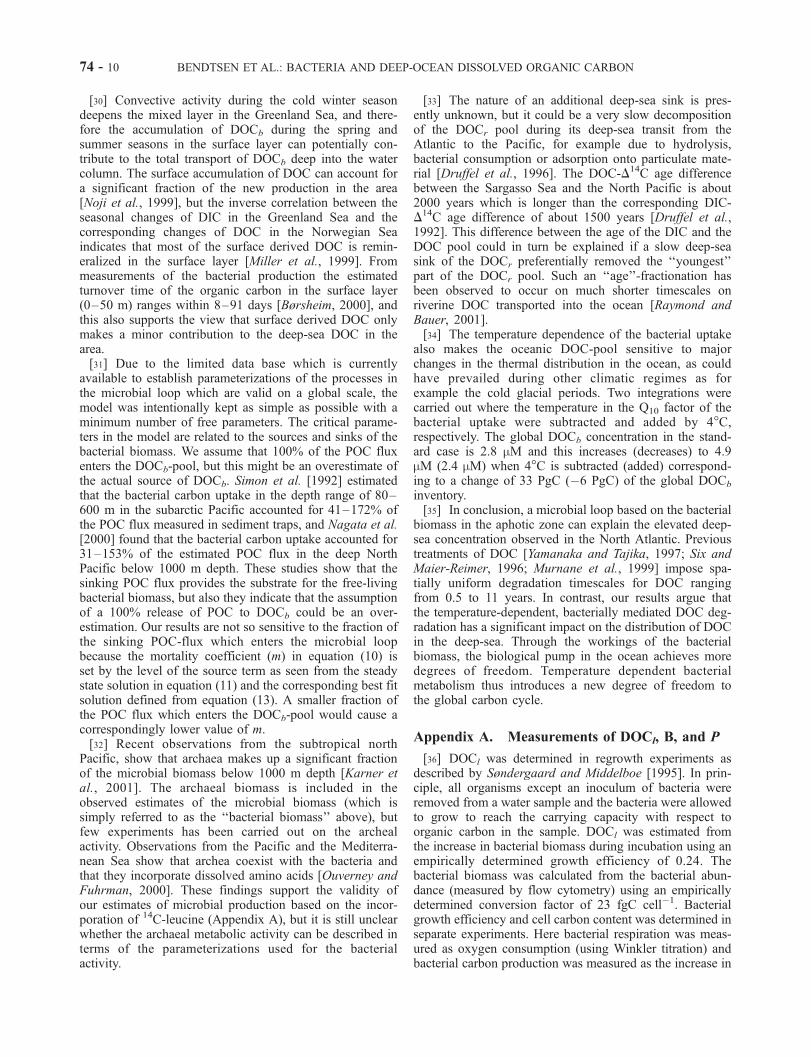
circulation for the mean deep-sea DOCb distribution below500 m is reflected in the high correlation (r�0.74) betweennew production (NP) and the DOCb when the northernNorth Atlantic is disregarded compared to the case whenthis area is included (r�0.54) in the analysis of the modeldata (Figure 9). To illustrate the influence of the temperatureon the DOCb distribution two integrations were carried outwith the temperature in the microbial loop fixed to theglobal mean vertical temperature distribution (as shown inFigure 3a, solid line) and with the temperature fixed to 0�C(Figure 3a, dashed line). In the case with the global meanvertical temperature profile, the global DOCb concentrationcorrelates well with NP (r�0.78) whereas the extreme casewith a constant temperature of 0�C results in high concen-trations of DOCb in the northern North Atlantic and therebya low correlation between DOCb and NP (r�0.46).[28] The implications of the model results can be sum-
marized as: Low surface temperatures at high latitudescause a relatively long residence time of DOCb in the upperpart of the water column (0–1000 m). Large vertical mixingand the formation of deepwater in the northern NorthAtlantic transport DOCb deeper into the water column andthis leads to elevated concentrations of DOCb in the NorthAtlantic region. The high deep-sea concentration of DOCb
also causes a higher concentration of B and a larger P thanseen elsewhere in the ocean.
5. Discussion
[29] The focus of this study is the biodegradable part ofthe DOC-pool in the aphotic zone, which we estimate toaccount for 2–15% of the total DOC in the water columnwith the highest fraction in the subpolar areas and in areaswith a high export production. DOC released from sinkingaggregates through bacterial mediated enzymatic hydrolysisis an important substrate source for the freeliving bacteria in
Figure 7. (a) Model solution of the vertical meanconcentration of DOCb [mM] below 1000 m depth. (b) Thevertical mean integrated total DOC concentration below1000 m in the Atlantic (red solid boxes, solid line), Indian(orange solid triangles, solid line) and Pacific Ocean (bluesolid circles, solid line) as a function of latitude. Thecorresponding DOCr concentrations are shown with thinlines. Model means and standard deviations are from 5�latitude � 5� longitude rectangles centered along the tracksin each of the ocean basins shown in Figure 7a (black lines).Observations of deep-ocean DOC are from Hansell andCarlson [1998a] for the Atlantic (red open boxes), Pacific(blue open circles) and the Indian ocean (orange opentriangles) and the corresponding locations are shown withred dots in Figure 7a. The red square in the northern NorthAtlantic refers to Figure 9. See color version of this figure atback of this issue.
74 - 8 BENDTSEN ET AL.: BACTERIA AND DEEP-OCEAN DISSOLVED ORGANIC CARBON
the ocean interior [Cho and Azam, 1988; Simon et al., 1992;Nagata et al., 2000]. Here we present observations of labileDOC from depths below 1400 m in the Greenland Seawhich provide direct evidence for the particle associatedtransport of DOC. The incubation experiments were carriedout during one week at 20�C. Using the temperaturedependence of the bacterial uptake, characterized byQ10=3.0, this would correspond to the bacterial uptakeduring 9 weeks at 0�C. A possible source of this deep-sealabile DOC-pool could be the transport associated withconvective activity which reaches 1000–2000 m depth inthe late winter [Lherminier et al., 1999]. However, themeasured turnover rates of DOCl imply that any labile
DOC transported to 1000–2000 m depth by wintertimeconvection would have been consumed by bacteria in earlyspring, and therefore not be present below 1400 m inAugust. Therefore it is unlikely that the labile DOC istransported to intermediate depth levels by convectiveprocesses. Alternatively, the DOC could be transported todepth through diffusive or advective processes, but even therelatively high vertical diffusion observed in the centralGreenland Sea of about 10�4 m2 s�1 [Watson et al., 1999]would only lead to vertical transports of less than 100 mduring a 10-week period. The observation of deep-sea labileDOC can only be explained as DOC released from thesinking flux of POC.
Figure 8. (a) Bacterial biomass, (b) bacterial production, and (c) the specific growth rate for the NorthAtlantic region (55�N:75�N, 40�W:20�E; full line, bullets) and the North Pacific region (55�N:75�N,40�W:20�E; dashed line, bullets) in the model. The error bars shows the standard deviation. Also shownare the ranges reported by Nagata et al. [2000] for the North Pacific (dotted vertical lines) and theobserved values in the Greenland Sea (boxes with standard deviation).
Figure 9. Scatterplot of new production (NP) versus the averaged DOCb concentration below 500 mdepth for the northern North Atlantic region (black) and the rest of the ocean (light shading). The resultsobtained by the microbial loop in (a) the standard case and for (b) the test case where the vertical globalmean temperature distribution is used in the calculations of the bacterial uptake and (c) the case with aconstant temperature of 0�C. The northern North Atlantic region is shown in Figure 7a.
BENDTSEN ET AL.: BACTERIA AND DEEP-OCEAN DISSOLVED ORGANIC CARBON 74 - 9
[30] Convective activity during the cold winter seasondeepens the mixed layer in the Greenland Sea, and there-fore the accumulation of DOCb during the spring andsummer seasons in the surface layer can potentially con-tribute to the total transport of DOCb deep into the watercolumn. The surface accumulation of DOC can account fora significant fraction of the new production in the area[Noji et al., 1999], but the inverse correlation between theseasonal changes of DIC in the Greenland Sea and thecorresponding changes of DOC in the Norwegian Seaindicates that most of the surface derived DOC is remin-eralized in the surface layer [Miller et al., 1999]. Frommeasurements of the bacterial production the estimatedturnover time of the organic carbon in the surface layer(0–50 m) ranges within 8–91 days [Børsheim, 2000], andthis also supports the view that surface derived DOC onlymakes a minor contribution to the deep-sea DOC in thearea.[31] Due to the limited data base which is currently
available to establish parameterizations of the processes inthe microbial loop which are valid on a global scale, themodel was intentionally kept as simple as possible with aminimum number of free parameters. The critical parame-ters in the model are related to the sources and sinks of thebacterial biomass. We assume that 100% of the POC fluxenters the DOCb-pool, but this might be an overestimate ofthe actual source of DOCb. Simon et al. [1992] estimatedthat the bacterial carbon uptake in the depth range of 80–600 m in the subarctic Pacific accounted for 41–172% ofthe POC flux measured in sediment traps, and Nagata et al.[2000] found that the bacterial carbon uptake accounted for31–153% of the estimated POC flux in the deep NorthPacific below 1000 m depth. These studies show that thesinking POC flux provides the substrate for the free-livingbacterial biomass, but also they indicate that the assumptionof a 100% release of POC to DOCb could be an over-estimation. Our results are not so sensitive to the fraction ofthe sinking POC-flux which enters the microbial loopbecause the mortality coefficient (m) in equation (10) isset by the level of the source term as seen from the steadystate solution in equation (11) and the corresponding best fitsolution defined from equation (13). A smaller fraction ofthe POC flux which enters the DOCb-pool would cause acorrespondingly lower value of m.[32] Recent observations from the subtropical north
Pacific, show that archaea makes up a significant fractionof the microbial biomass below 1000 m depth [Karner etal., 2001]. The archaeal biomass is included in theobserved estimates of the microbial biomass (which issimply referred to as the ‘‘bacterial biomass’’ above), butfew experiments has been carried out on the archealactivity. Observations from the Pacific and the Mediterra-nean Sea show that archea coexist with the bacteria andthat they incorporate dissolved amino acids [Ouverney andFuhrman, 2000]. These findings support the validity ofour estimates of microbial production based on the incor-poration of 14C-leucine (Appendix A), but it is still unclearwhether the archaeal metabolic activity can be described interms of the parameterizations used for the bacterialactivity.
[33] The nature of an additional deep-sea sink is pres-ently unknown, but it could be a very slow decompositionof the DOCr pool during its deep-sea transit from theAtlantic to the Pacific, for example due to hydrolysis,bacterial consumption or adsorption onto particulate mate-rial [Druffel et al., 1996]. The DOC-D14C age differencebetween the Sargasso Sea and the North Pacific is about2000 years which is longer than the corresponding DIC-D14C age difference of about 1500 years [Druffel et al.,
1992]. This difference between the age of the DIC and theDOC pool could in turn be explained if a slow deep-seasink of the DOCr preferentially removed the ‘‘youngest’’part of the DOCr pool. Such an ‘‘age’’-fractionation hasbeen observed to occur on much shorter timescales onriverine DOC transported into the ocean [Raymond andBauer, 2001].[34] The temperature dependence of the bacterial uptake
also makes the oceanic DOC-pool sensitive to majorchanges in the thermal distribution in the ocean, as couldhave prevailed during other climatic regimes as forexample the cold glacial periods. Two integrations werecarried out where the temperature in the Q10 factor of thebacterial uptake were subtracted and added by 4�C,respectively. The global DOCb concentration in the stand-ard case is 2.8 mM and this increases (decreases) to 4.9mM (2.4 mM) when 4�C is subtracted (added) correspond-ing to a change of 33 PgC (�6 PgC) of the global DOCb
inventory.[35] In conclusion, a microbial loop based on the bacterial
biomass in the aphotic zone can explain the elevated deep-sea concentration observed in the North Atlantic. Previoustreatments of DOC [Yamanaka and Tajika, 1997; Six andMaier-Reimer, 1996; Murnane et al., 1999] impose spa-tially uniform degradation timescales for DOC rangingfrom 0.5 to 11 years. In contrast, our results argue thatthe temperature-dependent, bacterially mediated DOC deg-radation has a significant impact on the distribution of DOCin the deep-sea. Through the workings of the bacterialbiomass, the biological pump in the ocean achieves moredegrees of freedom. Temperature dependent bacterialmetabolism thus introduces a new degree of freedom tothe global carbon cycle.
Appendix A. Measurements of DOCl, B, and P
[36] DOCl was determined in regrowth experiments asdescribed by Søndergaard and Middelboe [1995]. In prin-ciple, all organisms except an inoculum of bacteria wereremoved from a water sample and the bacteria were allowedto grow to reach the carrying capacity with respect toorganic carbon in the sample. DOCl was estimated fromthe increase in bacterial biomass during incubation using anempirically determined growth efficiency of 0.24. Thebacterial biomass was calculated from the bacterial abun-dance (measured by flow cytometry) using an empiricallydetermined conversion factor of 23 fgC cell�1. Bacterialgrowth efficiency and cell carbon content was determined inseparate experiments. Here bacterial respiration was meas-ured as oxygen consumption (using Winkler titration) andbacterial carbon production was measured as the increase in
74 - 10 BENDTSEN ET AL.: BACTERIA AND DEEP-OCEAN DISSOLVED ORGANIC CARBON
POC collected on glass-fiber filters and measured as CO2
after combustion at 650�C. Bacterial production was esti-mated from the incorporation of 14C-leucine [Chin-Leo andKirchmann, 1988] using empirical conversion factors of2060 gC mol�1 leucine in June and 1280 gC mol�1 leucinein August. Average values of leucine based data are pre-sented here. More details about methods are given by M.Middelboe and C. Lundsgaard (Microbial activity in theGreenland Sea: The role of DOC lability, mineral nutrientsand temperature, submitted to Aquatic Microbial Ecology,2002).
[37] Acknowledgments. This work was funded by the Danish NaturalScience Research Council, the Carlsberg Foundation and from the EU-project ORFOIS (contract EVK2-CT-2001-00100).
ReferencesAnderson, T. R., and P. J. B. Williams, A one-dimensional model of dis-solved organic carbon cycling in the water column incorporating com-bined biological-photochemical decomposition, Global Biogeochem.Cycles, 13, 337–349, 1999.
Archer, D. E., E. T. Peltzer, and D. L. Kirchmann, A timescale for dissolvedorganic carbon production in equatorial Pacific surface waters, GlobalBiogeochem. Cycles, 11, 435–452, 1997.
Archer, D., A. Winguth, D. Lea, and N. Mahowald, What caused theglacial/interglacial atmospheric pCO2 cycles?, Rev. Geophys., 38, 159–189, 2000.
Bacastow, R., and E. Maier-Reimer, Ocean-circulation model of the carboncycle, Clim. Dyn., 4, 95–125, 1990.
Bauer, J. E., P. M. Williams, and E. R. M. Druffel, 14C activity of dissolvedorganic carbon fractions in the north-central Pacific and Sargasso Sea,Nature, 357, 667–670, 1992.
Benner, R., and B. Biddanda, Photochemical transformations of surface anddeep marine dissolved organic matter: Effects on bacterial growth, Lim-nol. Oceanogr., 43, 1373–1378, 1998.
Billen, G., P. Servais, and S. Becquevort, Dynamics of bacterioplankton inoligotrophic and eutrophic environments: Bottom-up or top-down con-trol, Hydrobiologia, 207, 37–42, 1990.
Børsheim, K. Y., Bacterial production rates and concentrations of organiccarbon at the end of the growing season in the Greenland Sea, Aquatic.Microb. Ecol., 21, 115–123, 2000.
Børsheim, K. Y., and S. M. Myklestad, Dynamics of DOC in the Norwe-gian Sea inferred from monthly profiles collected during 3 years at 66�N,2�E, Deep Sea Res. Part I, 44, 593–601, 1997.
Carlson, C. A., H. W. Ducklow, and A. F. Michaels, Annual flux of dis-solved organic carbon from the euphotic zone in the northwestern Sar-gasso Sea, Nature, 371, 405–408, 1994.
Cherrier, J., J. E. Bauer, E. R. M. Druffel, R. B. Coffin, and J. P. Chanton,Radiocarbon in marine bacteria: Evidence for the ages of assimilatedcarbon, Limnol. Oceanogr., 44, 730–736, 1999.
Chin-Leo, G., and D. L. Kirchmann, Estimating bacterial production inmarine waters from simultaneous incorporation of thymidine and leucine,Appl. Environ. Microbiol., 54, 1934–1939, 1988.
Cho, B. C., and F. Azam, Major role of bacteria in biogeochemical fluxes inthe ocean’s interior, Nature, 332, 441–443, 1988.
del Giorgio, P. A., and J. J. Cole, Bacterial growth efficiency in naturalaquatic systems, Annu. Rev. Ecol. Syst., 29, 503–541, 1998.
Druffel, E. R., and J. E. Bauer, Radiocarbon distributions in SouthernOcean dissolved and particulate organic matter, Geophys. Res. Lett.,27, 1495–1498, 2000.
Druffel, E. R., P. M. Williams, J. E. Bauer, and J. R. Ertel, Cycling ofdissolved and particulate organic matter in the open ocean, J. Geophys.Res., 97, 15,639–15,659, 1992.
Druffel, E. R., J. E. Bauer, P. M. Williams, S. Griffin, and D. Wolgast,Seasonal variability of particulate organic radiocarbon in the northeastPacific Ocean, J. Geophys. Res., 101, 20,543–20,552, 1996.
Dufour, P., and J.-P. Torreton, Bottom-up and top-down control ofbacterioplankton from eutrophic to oligotrophic sites in the tropicalnortheastern Atlantic Ocean, Deep Sea Res., Part I, 43, 1305–1320,1996.
Fuhrman, J. A., and R. T. Noble, Viruses and protists cause similarbacterial mortality in coastal seawater, Limnol. Oceanogr., 40, 1236–1242, 1995.
Hansell, D. A., and C. A. Carlson, Deep-ocean gradients in the concentra-tion of dissolved organic carbon, Nature, 395, 263–266, 1998a.
Hansell, D. A., and C. A. Carlson, Net community production of dis-solved organic carbon, Global Biogeochem. Cycles, 12, 443 –453,1998b.
Hopkinson, C. S., Jr., B. Fry, and A. L. Nolin, Stoichiometry of dissolvedorganic matter dynamics on the continental shelf of the northeasternU.S.A., Cont. Shelf Res., 17, 473–489, 1997.
Karner, B. K., E. F. DeLong, and D. M. Karl, Arcaeal dominance inthe mesopelagic zone of the Pacific ocean, Nature, 409, 507–510,2001.
Levitus, S., R. Burgett, and T. P. Boyer, World Ocean Atlas, vol. 4, Tem-perature, Natl. Oceanic and Atmos. Admin., U. S. Gov. Printing Off.,Washington, D. C., 1994.
Lherminier, P., J.-C. Gascard, and D. Quadfasel, The Greenland Sea inWinter 1993 and 1994: Preconditioning for deep convection, Deep SeaRes., Part II, 46, 1199–1235, 1999.
Maier-Reimer, E. U., Geochemical cycles in an ocean general circulationmodel: Preindustrial tracer distribution, Global Biogeochem. Cycles, 7,645–677, 1993.
Martin, J. H., G. A. Knauer, D. M. Karl, and W. W. Broenkow, VERTEX:Carbon cycling in the northeast Pacific, Deep Sea Res., 34, 267–285,1987.
Middelboe, M., M. Søndergaard, Y. Letarte, and N. H. Borch, Attached andfree-living bacteria: Production and polymer hydrolysis during a diatombloom, Microb. Ecol., 29, 231–248, 1995.
Miller, L. A., M. Chierici, T. Johannessen, T. T. Noji, F. Rey, and I. Skjel-van, Seasonal dissolved inorganic carbon variations in the Greenland Seaand implications for atmospheric CO2 exchange, Deep Sea Res., Part II,46, 1473–1496, 1999.
Mopper, K., X. Zhou, R. J. Kieber, D. J. Kieber, R. J. Sikorski, and R. D.Jones, Photochemical degradation of dissolved organic carbon and itsimpact on the oceanic carbon cycle, Nature, 353, 60–62, 1991.
Moran, M. A., and R. G. Zepp, Role of photoreactions in the formation ofbiologically labile compounds from dissolved organic matter, Limnol.Oceanogr., 42, 1307–1316, 1997.
Murnane, R. J., J. L. Sarmiento, and C. L. Quere, Spatial distribution of air-sea CO2 fluxes and the interhemispheric transport of carbon by theoceans, Global Biogeochem. Cycles, 13, 287–305, 1999.
Nagata, T., H. Fukuda, R. Fukuda, and I. Koike, Bacterioplankton distribu-tion and production in deep Pacific waters: Large-scale geographic var-iations and possible coupling with sinking particle fluxes, Limnol.Oceanogr., 45, 426–435, 2000.
Noji, T. T., F. Rey, L. A. Miller, K. Y. Børsheim, and J. Urban-Rich, Fate ofbiogenic carbon in the upper 200 m of the central Greenland Sea, DeepSea Res., Part II, 46, 1497–1509, 1999.
Ogawa, H., Y. Amagai, I. Koike, K. Kaiser, and R. Benner, Production ofrefractory dissolved organic matter by bacteria, Science, 292, 917–920,2001.
Opsahl, S., and R. Benner, Distribution and cycling of terrigenous dissolvedorganic matter in the ocean, Nature, 386, 480–482, 1997.
Opsahl, S., R. Benner, and R. M. W. Amon, Major flux of terrigenousdissolved organic matter through the Arctic Ocean, Limnol. Oceanogr.,44, 2017–2023, 1999.
Ouverney, C. C., and J. A. Fuhrman, Marine planktonic archaea take upamino acids, Appl. Environ. Microbiol., 66, 4829–4833, 2000.
Pomeroy, L. R., and W. J. Wiebe, Temperature and substrates as interactivelimiting factors for marine heterotrophic bacteria, Aquat. Microb. Ecol.,23, 187–204, 2001.
Proctor, L. M., and J. A. Fuhrman, Roles of viral infection in organicparticle flux, Mar. Ecol., 69, 133–142, 1991.
Raymond, P. E., and J. E. Bauer, Riverine export of aged terrestrial organicmatter to the North Atlantic Ocean, Nature, 25, 497–500, 2001.
Reid, J., and R. Lynn, On the influence of the Norwegian-Greenland andWeddel Seas upon the bottom waters of the Indian and Pacific oceans,Deep Sea Res., 18, 1063–1088, 1971.
Rivkin, R. B., and L. Legendre, Biogenic carbon cycling in the upperocean: Effects of microbial respiration, Nature, 291, 2398–2400,2001.
Rivkin, R. B., M. R. Anderson, and C. Lajzerowicz, Microbial processes incold oceans, 1, Relationship between temperature and bacterial growthrate, Aquat. Microb. Ecol., 10, 243–254, 1996.
Simon, M., N. A. Welschmeyer, and D. L. Kirchman, Bacterial productionand the sinking flux of particulate organic matter in the subarctic Pacific,Deep Sea Res., Part I, 39, 1997–2008, 1992.
Six, K. D., and E. Maier-Reimer, Effects on plankton dynamics on seasonalcarbon fluxes in an ocean general circulation model, Global Biogeochem.Cycles, 10, 559–583, 1996.
BENDTSEN ET AL.: BACTERIA AND DEEP-OCEAN DISSOLVED ORGANIC CARBON 74 - 11
Smethie, W. M., A. Rana, A. Putzka, and E. P. Jones, Tracing the flow ofNorth Atlantic Deep Water using chlorofluorocarbons, J. Geophys. Res.,105, 14,297–14,323, 2000.
Smith, D. C., M. Simon, A. L. Alldredge, and F. Azam, Intense hydrolyticenzyme activity on marine aggregates and implications for rapid particledissolution, Nature, 359, 139–142, 1992.
Søndergaard, M., and M. Middelboe, A cross-system analysis of labiledissolved organic carbon, Mar. Ecol. Progr. Ser., 118, 283–294, 1995.
Stedmon, C. A., and S. Markager, The optics of chromophoric dissolvedorganic matter (CDOM) in the Greenland Sea: An algorithm for differ-entiation between marine and terrestrially derived organic matter, Limnol.Oceanogr., 46, 2087–2093, 2001.
Watson, A. J., et al., Mixing and convection in the Greenland Sea from atracer-release experiment, Nature, 401, 902–904, 1999.
Yamanaka, Y., and E. Tajika, Role of dissolved organic matter in themarine biogeochemical cycle: Studies using an ocean biogeochemicalgeneral circulation model, Global Biogeochem. Cycles, 11, 599–612,1997.
�������������������������D. Archer, Department of Geophysical Sciences, 5734 S. Ellis Avenue,
University of Chicago, Chicago, IL 60637, USA. ([email protected])J. Bendtsen and C. Lundsgaard, National Environmental Research
Institute, Frederiksborgvej 399, Postbox 358, DK-4000 Roskilde, Denmark.( [email protected]; [email protected])M. Middelboe, Marine Biological Laboratory, University of Copenhagen,
Strandpromenaden 5, DK-3000Helsingør, Denmark. ([email protected])
74 - 12 BENDTSEN ET AL.: BACTERIA AND DEEP-OCEAN DISSOLVED ORGANIC CARBON
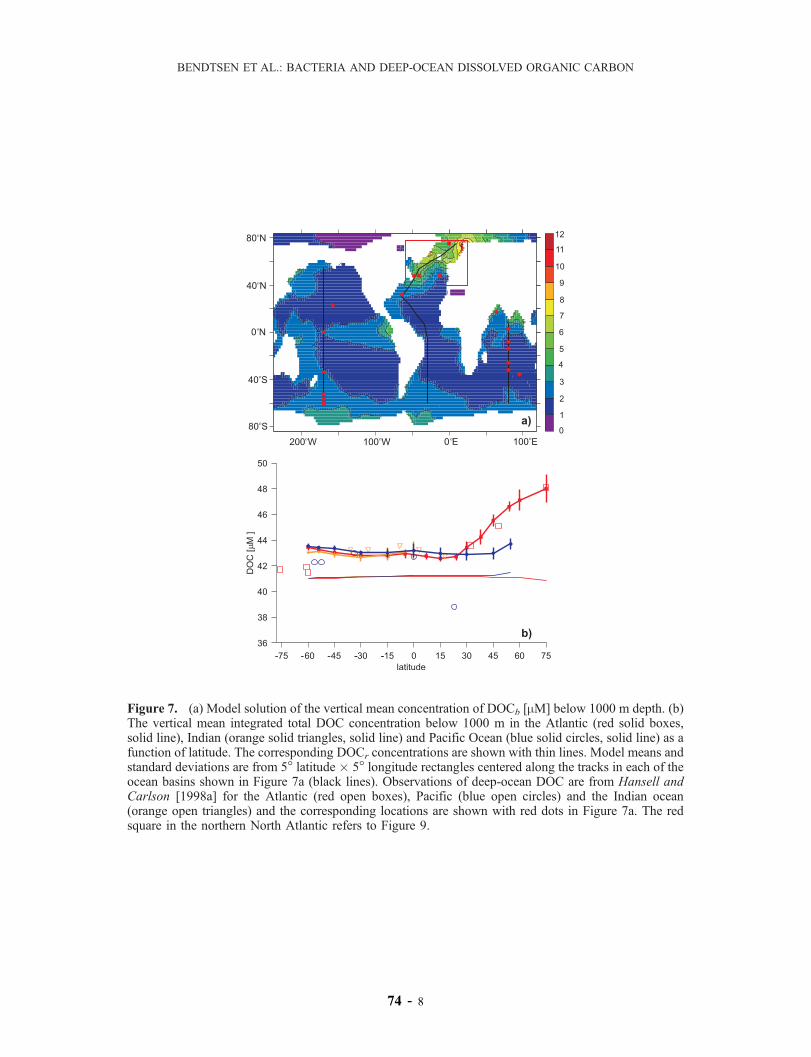
Figure 7. (a) Model solution of the vertical mean concentration of DOCb [mM] below 1000 m depth. (b)The vertical mean integrated total DOC concentration below 1000 m in the Atlantic (red solid boxes,solid line), Indian (orange solid triangles, solid line) and Pacific Ocean (blue solid circles, solid line) as afunction of latitude. The corresponding DOCr concentrations are shown with thin lines. Model means andstandard deviations are from 5� latitude � 5� longitude rectangles centered along the tracks in each of theocean basins shown in Figure 7a (black lines). Observations of deep-ocean DOC are from Hansell andCarlson [1998a] for the Atlantic (red open boxes), Pacific (blue open circles) and the Indian ocean(orange open triangles) and the corresponding locations are shown with red dots in Figure 7a. The redsquare in the northern North Atlantic refers to Figure 9.
BENDTSEN ET AL.: BACTERIA AND DEEP-OCEAN DISSOLVED ORGANIC CARBON
74 - 8