
Influence of Ammonia Borane on the Stability of a Liquid ... 30 2 2014.pdf · Influence of Ammonia...
9
Influence of Ammonia Borane on the Stability of a Liquid Rocket Combustor Mark A. Pfeil, ∗ Steven F. Son, † and William E. Anderson ‡ Purdue University, West Lafayette, Indiana 47907 DOI: 10.2514/1.B34950 Single drop studies have shown that there are significant differences in the way liquid hydrocarbons containing additives burn, compared with neat fuels. An experimental study was performed to evaluate how this change in burning behavior might affect the stability behavior of a model rocket combustor. Ammonia borane was investigated as a potential additive using a continuously variable resonance combustor, which has been shown to generate self- excited instabilities. The neat fuel was ethanol. High-speed imaging was used to obtain approximate heat release and boron oxidation profiles near the injector. Whereas neat ethanol exhibited only one mode of unsteady heat addition, it was found that the addition of the ammonia borane resulted in a bimodal temporal and spatial unsteady heat addition. This bimodal behavior produced combustion dynamics that allowed the system to be unstable over a wider range of geometric configurations. I. Introduction T HE use of additives to tailor the combustion behavior of a system is a potential method of suppressing combustion instabilities in liquid rocket combustors. Traditionally, modifications to geometric features and operating conditions of a system have been used to influence combustion behavior and suppress combustion instabilities [1,2]. Such modifications are unique for each specific engine and propellant combination and are often determined by trial and error. A fundamental understanding of how additives could be used to promote stable combustion could presumably result in a more robust and generalized approach for producing stable engines. Research has shown that additives can modify different aspects of the combustion behaviors of liquid fuels. Changes observed in experiments include lower ignition temperatures [3,4], reduced ignition delay [5], increased burning rate [6], and increased volumetric energy [7,8]. All these changes could possibly lead to a change in combustion dynamics and thus the stability of a system. Efforts were made by Kesselring and Oberg [9] to influence the stability of a combustor by adding aluminum and aluminum oxide to gelled fuels, and it was found that these additives produced more stable operation due to particle dampening. Pfeil et al. [10] added nanoaluminum to ethanol and JP-8 to determine the additives’ influence on stability and noted an increase in the combustion instability of the system when using ethanol but no change when JP-8 was the base fuel. Other efforts to use additives to influence the combustion stability of a liquid combustor are limited. One potential additive is ammonia borane (AB), NH 3 BH 3 . At temperatures above 343 K, which is below the normal boiling point of ethanol (351 K), AB can dissociate into NH 2 BH 2 and H 2 . More H 2 is released at higher temperatures [11]. Experiments by Pfeil et al. [12] showed that the burning behavior of ethanol drops with AB differs from neat ethanol in two major ways. First, the droplet burning rate increased notably with the addition of AB, presumably as a result of hydrogen being added to the combustion process. The addition of hydrogen could also potentially prove advantageous in suppressing combustion instabilities as it has been shown to increase the flammability limits of a fuel [13–15]. Also, it is generally accepted that hydrogen-fueled rocket combustors tend to be less prone to combustion instability than their kerosene-fueled counterparts. Second, droplet shattering was observed later in the life of the droplet, leading to rapid fuel consumption and energy release, a behavior also seen with multicomponent droplets [16,17]. These differences resulted in two notably separate rates of energy release. As the addition of AB had a notable impact on the combustion behavior of droplets, a change in stability behavior might also be anticipated. This paper describes an experiment that was conducted to compare the combustion dynamic behaviors between a neat liquid fuel and a fuel containing AB. A model rocket combustor with a well- documented behavior of self-excited instability using kerosene and gaseous methane fuels was used [18,19]. The main objective of this work was to determine if the changes in combustion behavior observed in droplet experiments would result in measurably different stability behavior in the model combustor. The different stability behavior could then possibly be related to the behaviors observed in the droplet combustion experiments. Experiments were performed in the model rocket combustor with neat ethanol and the ethanol–AB mixture. Stability characteristics in terms of pressure oscillation amplitudes as a function of combustor geometry and unsteady heat release profiles were determined for the two fuel types and compared. II. Experimental Setup A. Fuel Description and Preparation The neat ethanol used in these experiments was obtained from Koptec, and the AB was obtained from Sigma Aldrich. The fuel was prepared by adding 6 wt % AB, the same concentration previously used by Pfeil et al. [12], to the ethanol and allowing the AB to dissolve completely, resulting in a solution. Experiments were performed within 12 h of mixing the fuel and at the conditions denoted in Table 1. This experimental fuel is not stable in the long term. B. Experimental Configuration The oxidizer used in this experiment was 90 wt % hydrogen peroxide and 10 wt % water. First, the oxidizer was passed through a catalyst bed gas generator, shown in Fig. 1. The hydrogen peroxide is decomposed into warm oxygen and water and then fed from an oxidizer manifold into a choked inlet that forms the upstream boundary of the combustor. One unique aspect of this experiment is the ability to translate the choked inlet during an experiment to change the combustor system resonance. The inlet tube resonance can be changed between a quarter-wave and a half-wave resonator, Received 5 February 2013; revision received 26 August 2013; accepted for publication 25 September 2013; published online 10 February 2014. Copyright © 2013 by the authors. Published by the American Institute of Aeronautics and Astronautics, Inc., with permission. Copies of this paper may be made for personal or internal use, on condition that the copier pay the $10.00 per-copy fee to the Copyright Clearance Center, Inc., 222 Rosewood Drive, Danvers, MA 01923; include the code 1533-3876/14 and $10.00 in correspondence with the CCC. *Graduate Student, School of Aeronautics and Astronautics, 500 Allison Rd. Student Member AIAA. † Professor, School of Mechanical Engineering, 500 Allison Rd. Associate Member AIAA. ‡ Professor, School of Aeronautics and Astronautics, 701 W. Stadium Ave. Associate Fellow AIAA. 290 JOURNAL OF PROPULSION AND POWER Vol. 30, No. 2, March–April 2014 Downloaded by PENNSYLVANIA STATE UNIVERSITY on May 30, 2015 | http://arc.aiaa.org | DOI: 10.2514/1.B34950
Transcript of Influence of Ammonia Borane on the Stability of a Liquid ... 30 2 2014.pdf · Influence of Ammonia...
Influence of Ammonia Borane on the Stability of a LiquidRocket Combustor
Mark A. Pfeil,∗ Steven F. Son,† and William E. Anderson‡
Purdue University, West Lafayette, Indiana 47907
DOI: 10.2514/1.B34950
Single drop studies have shown that there are significant differences in the way liquid hydrocarbons containing
additives burn, compared with neat fuels. An experimental study was performed to evaluate how this change in
burning behaviormight affect the stability behavior of amodel rocket combustor. Ammonia boranewas investigated
as a potential additive using a continuously variable resonance combustor, which has been shown to generate self-
excited instabilities. The neat fuel was ethanol. High-speed imaging was used to obtain approximate heat release and
boron oxidation profiles near the injector.Whereas neat ethanol exhibited only onemode of unsteady heat addition, it
was found that the addition of the ammoniaborane resulted in abimodal temporal and spatial unsteadyheat addition.
This bimodal behavior produced combustion dynamics that allowed the system to be unstable over a wider range of
geometric configurations.
I. Introduction
T HE use of additives to tailor the combustion behavior of asystem is a potential method of suppressing combustion
instabilities in liquid rocket combustors. Traditionally, modificationsto geometric features and operating conditions of a system have beenused to influence combustion behavior and suppress combustioninstabilities [1,2]. Such modifications are unique for each specificengine and propellant combination and are often determined by trialand error. A fundamental understanding of how additives could beused to promote stable combustion could presumably result in amorerobust and generalized approach for producing stable engines.Research has shown that additives can modify different aspects
of the combustion behaviors of liquid fuels. Changes observedin experiments include lower ignition temperatures [3,4], reducedignition delay [5], increased burning rate [6], and increasedvolumetric energy [7,8]. All these changes could possibly lead to achange in combustion dynamics and thus the stability of a system.Efforts were made by Kesselring and Oberg [9] to influence thestability of a combustor by adding aluminum and aluminum oxide togelled fuels, and it was found that these additives produced morestable operation due to particle dampening. Pfeil et al. [10] addednanoaluminum to ethanol and JP-8 to determine the additives’influence on stability and noted an increase in the combustioninstability of the systemwhen using ethanol but no changewhen JP-8was the base fuel. Other efforts to use additives to influence thecombustion stability of a liquid combustor are limited.One potential additive is ammonia borane (AB), NH3BH3. At
temperatures above 343 K, which is below the normal boiling pointof ethanol (351K), AB can dissociate intoNH2BH2 andH2.MoreH2
is released at higher temperatures [11]. Experiments by Pfeil et al.[12] showed that the burning behavior of ethanol drops withAB differs from neat ethanol in two major ways. First, the dropletburning rate increased notably with the addition of AB, presumablyas a result of hydrogen being added to the combustion process. The
addition of hydrogen could also potentially prove advantageous insuppressing combustion instabilities as it has been shown to increasethe flammability limits of a fuel [13–15]. Also, it is generallyaccepted that hydrogen-fueled rocket combustors tend to beless prone to combustion instability than their kerosene-fueledcounterparts. Second, droplet shattering was observed later in the lifeof the droplet, leading to rapid fuel consumption and energy release, abehavior also seen with multicomponent droplets [16,17]. Thesedifferences resulted in two notably separate rates of energy release.As the addition of AB had a notable impact on the combustionbehavior of droplets, a change in stability behavior might also beanticipated.This paper describes an experiment that was conducted to compare
the combustion dynamic behaviors between a neat liquid fuel anda fuel containing AB. A model rocket combustor with a well-documented behavior of self-excited instability using kerosene andgaseous methane fuels was used [18,19]. The main objective of thiswork was to determine if the changes in combustion behaviorobserved in droplet experiments would result in measurably differentstability behavior in the model combustor. The different stabilitybehavior could then possibly be related to the behaviors observed inthe droplet combustion experiments. Experiments were performed inthe model rocket combustor with neat ethanol and the ethanol–ABmixture. Stability characteristics in terms of pressure oscillationamplitudes as a function of combustor geometry and unsteady heatrelease profileswere determined for the two fuel types and compared.
II. Experimental Setup
A. Fuel Description and Preparation
The neat ethanol used in these experiments was obtained fromKoptec, and the AB was obtained from Sigma Aldrich. The fuel wasprepared by adding 6 wt % AB, the same concentration previouslyused byPfeil et al. [12], to the ethanol and allowing theAB to dissolvecompletely, resulting in a solution. Experiments were performedwithin 12 h of mixing the fuel and at the conditions denoted inTable 1. This experimental fuel is not stable in the long term.
B. Experimental Configuration
The oxidizer used in this experiment was 90 wt % hydrogenperoxide and 10 wt % water. First, the oxidizer was passed through acatalyst bed gas generator, shown in Fig. 1. The hydrogen peroxide isdecomposed into warm oxygen and water and then fed from anoxidizer manifold into a choked inlet that forms the upstreamboundary of the combustor. One unique aspect of this experiment isthe ability to translate the choked inlet during an experiment tochange the combustor system resonance. The inlet tube resonancecan be changed between a quarter-wave and a half-wave resonator,
Received 5 February 2013; revision received 26August 2013; accepted forpublication 25 September 2013; published online 10 February 2014.Copyright © 2013 by the authors. Published by the American Institute ofAeronautics andAstronautics, Inc., with permission. Copies of this papermaybe made for personal or internal use, on condition that the copier pay the$10.00 per-copy fee to the Copyright Clearance Center, Inc., 222 RosewoodDrive, Danvers, MA 01923; include the code 1533-3876/14 and $10.00 incorrespondence with the CCC.
*Graduate Student, School of Aeronautics and Astronautics, 500 AllisonRd. Student Member AIAA.
†Professor, School of Mechanical Engineering, 500 Allison Rd. AssociateMember AIAA.
‡Professor, School of Aeronautics and Astronautics, 701 W. Stadium Ave.Associate Fellow AIAA.
290
JOURNAL OF PROPULSION AND POWER
Vol. 30, No. 2, March–April 2014
Dow
nloa
ded
by P
EN
NSY
LV
AN
IA S
TA
TE
UN
IVE
RSI
TY
on
May
30,
201
5 | h
ttp://
arc.
aiaa
.org
| D
OI:
10.
2514
/1.B
3495
0

with respect to the combustor acoustics. In addition to changing thesystem resonance, varying the resonance of the tube changes the flowdynamics in the tube and gives rise to different stability behavior as afunction of tube length.Once past the choked inlet, the oxidizer flowed through the
oxidizer post and mixed with the fuel that was introduced to thesystem through a coaxial swirl configuration. A step expansionoccurred immediately after the fuel injector as the fuel and oxidizerentered the combustion chamber. Ignition was achieved byintroducing 50 ml of JP-8 into the combustion chamber beforethe experimental fuel arrived. JP-8 readily ignites with high-concentration decomposed hydrogen peroxide. The first third of thecombustion chamber consisted of a quartz tube surrounded by anacrylic housing to provide structural support. This optical chamberallowed for visual measurements of the combustion process. Thecombustion products then traveled down the steel combustionchamber and out a short sonic nozzle.Low-frequency (Druck PMP 1260 and PMP 1265 8-30 Vdc
sampling at 500 Hz) pressure transducers were placed in variouslocations throughout the combustion system.High-frequency (KuliteWCT-312M sampling at 100 kHz) pressure transducers were locatedin the oxidizer and fuel manifolds, 7.6 and 0.6 cm upstream of thestep expansion, and 36.8 cm downstream of the step expansion,0.2 cm upstream from the nozzle. These pressure measurementsallowed for analysis of mean pressures as well as high-frequency
pressure variations. Further details of this setup can be foundelsewhere [18,19].
C. Measurement Techniques
Two high-speed cameras were used simultaneously for visualizingcombustion light. The first system used a Vision Research Phantomsampling at 10 kHz and fitted with a Nikon 28-105 mm lensconnected to a Thorlabs laser line filter with a 70% transmission(centered at 543.5 nm�2 with a full width half maximum of 10 nm�2). This filter was employed to bandpass light emitted by boronoxidation, as researchers have reported that boron compoundsproduce strong emission bands between 536 and 548 nm duringcombustion [20].Water steam is also present in the combustor, whichwith oxygen can cause boron to react and formBHO2 [21]; however,BHO2 probably reacts with OH radicals producing BO2 [22], whichhas emission bands within the limits of the line filter. Thus, lightemission obtained using this camera system should be a goodindicator of the location of the boron reaction. The resulting imageswere partially obstructed by the combustor hardware, Fig. 2; thus, theimage was smoothly interpolated across the obstructed part of theimage using the Laplace equation before analysis of the data.The other high-speed camera system employed a Video Scope
International high-speed image intensifier (VS4-1845Hs) attachedto another Vision Research Phantom sampling at 10 kHz. A Sigma24-70mmF2.8 lenswith a Semrock interference filter (FF01-434/17-25) with a 90% transmission (centered at 434 nm with a full widthhalf maximum of 21 nm) was attached to the camera assembly. Thefilter wavelength corresponds to the radical CH* that is present inearly combustion reactions. This method has been used in previousefforts to evaluate the combustion response to pressure oscillations inan unsteady combustor [23].
III. Results
Operation of the combustor was the same for both fuels. Hydrogenperoxide begins to flow at time � 5 s into the experiment, Fig. 3. Anitrogen purge is activated in the fuel line at the same time so that nooxidizer will travel into the fuel lines, causing the pressure in the fuelmanifold to rise to around 1500 kPa. The H2O2 reaches the catalystbed, decomposes, and then begins to fill the combustor at time � 6 s.Once H2O2 decomposition and operation are well established, thefuel nitrogen purge is stopped and fuel begins to flow at time � 9 s.Ignition occurs around time � 10.4 s, causing a sharp rise inpressure in the fuel manifold and combustor. The oxidizer postposition is kept constant for around 1 s to eliminate transient behaviorcaused by ignition and then begins to translate at time � 11.6 s. Thepost then translates at a rate of 5.1 cm∕s for 2 s. Fuel flow is thenterminated at time � 14.1 s, and the nitrogen purge in the fuel lineis once again initiated. The H2O2 becomes depleted aroundtime � 16.3 s, and the pressure within the combustor returns to itsinitial state. The resulting mixing of the fuel–oxidizer andcombustion is close to complete for both fuels with characteristic
Fig. 1 Schematic of the continuously variable resonance combustorused in the study [19].
Fig. 2 Image obtained using the high-speed camera system imaging thereaction of boron before interpolation (above) and after interpolation(below).
0
500
1000
1500
2000
2500
3000
3500
Pre
ssur
e, k
Pa
PFman
PCham
5 10 150
0.1
0.2
0.3
0.4
0.5
Time, s
Mas
s F
low
Rat
e, k
g/s
Oxi
dize
r P
ost
Len
gth/
100,
cm
MdotH2O2
MdotEth
OPL/100
Fig. 3 Measured flowparameters as a function of time during operationof combustor for neat ethanol fuel.
Table 1 Experimental conditions
Fuel Additive Mean Pressure, kPa O/F
Ethanol None 1480 6.88Ethanol 6 wt % AB 1480 7.00
PFEIL, SON, AND ANDERSON 291
Dow
nloa
ded
by P
EN
NSY
LV
AN
IA S
TA
TE
UN
IVE
RSI
TY
on
May
30,
201
5 | h
ttp://
arc.
aiaa
.org
| D
OI:
10.
2514
/1.B
3495
0
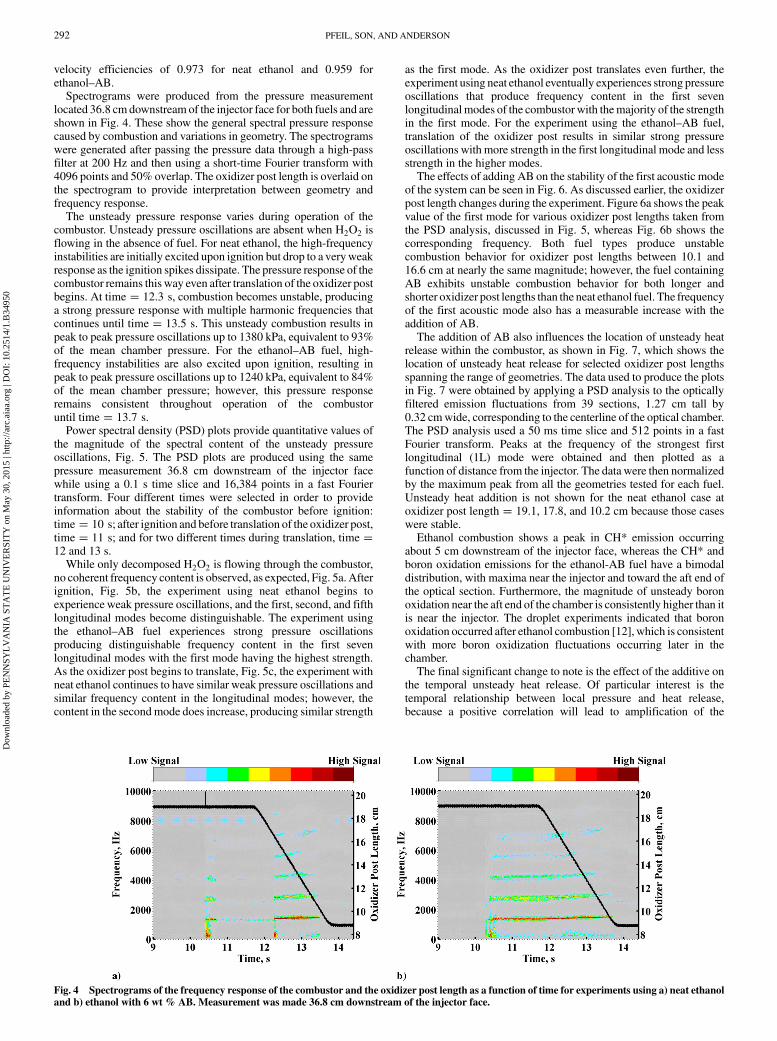
velocity efficiencies of 0.973 for neat ethanol and 0.959 forethanol–AB.Spectrograms were produced from the pressure measurement
located 36.8 cm downstream of the injector face for both fuels and areshown in Fig. 4. These show the general spectral pressure responsecaused by combustion and variations in geometry. The spectrogramswere generated after passing the pressure data through a high-passfilter at 200 Hz and then using a short-time Fourier transform with4096 points and 50% overlap. The oxidizer post length is overlaid onthe spectrogram to provide interpretation between geometry andfrequency response.The unsteady pressure response varies during operation of the
combustor. Unsteady pressure oscillations are absent when H2O2 isflowing in the absence of fuel. For neat ethanol, the high-frequencyinstabilities are initially excited upon ignition but drop to a veryweakresponse as the ignition spikes dissipate. The pressure response of thecombustor remains this way even after translation of the oxidizer postbegins. At time � 12.3 s, combustion becomes unstable, producinga strong pressure response with multiple harmonic frequencies thatcontinues until time � 13.5 s. This unsteady combustion results inpeak to peak pressure oscillations up to 1380 kPa, equivalent to 93%of the mean chamber pressure. For the ethanol–AB fuel, high-frequency instabilities are also excited upon ignition, resulting inpeak to peak pressure oscillations up to 1240 kPa, equivalent to 84%of the mean chamber pressure; however, this pressure responseremains consistent throughout operation of the combustoruntil time � 13.7 s.Power spectral density (PSD) plots provide quantitative values of
the magnitude of the spectral content of the unsteady pressureoscillations, Fig. 5. The PSD plots are produced using the samepressure measurement 36.8 cm downstream of the injector facewhile using a 0.1 s time slice and 16,384 points in a fast Fouriertransform. Four different times were selected in order to provideinformation about the stability of the combustor before ignition:time � 10 s; after ignition and before translation of the oxidizer post,time � 11 s; and for two different times during translation, time �12 and 13 s.While only decomposed H2O2 is flowing through the combustor,
no coherent frequency content is observed, as expected, Fig. 5a. Afterignition, Fig. 5b, the experiment using neat ethanol begins toexperience weak pressure oscillations, and the first, second, and fifthlongitudinal modes become distinguishable. The experiment usingthe ethanol–AB fuel experiences strong pressure oscillationsproducing distinguishable frequency content in the first sevenlongitudinal modes with the first mode having the highest strength.As the oxidizer post begins to translate, Fig. 5c, the experiment withneat ethanol continues to have similar weak pressure oscillations andsimilar frequency content in the longitudinal modes; however, thecontent in the secondmode does increase, producing similar strength
as the first mode. As the oxidizer post translates even further, theexperiment using neat ethanol eventually experiences strong pressureoscillations that produce frequency content in the first sevenlongitudinal modes of the combustor with themajority of the strengthin the first mode. For the experiment using the ethanol–AB fuel,translation of the oxidizer post results in similar strong pressureoscillations with more strength in the first longitudinal mode and lessstrength in the higher modes.The effects of adding AB on the stability of the first acoustic mode
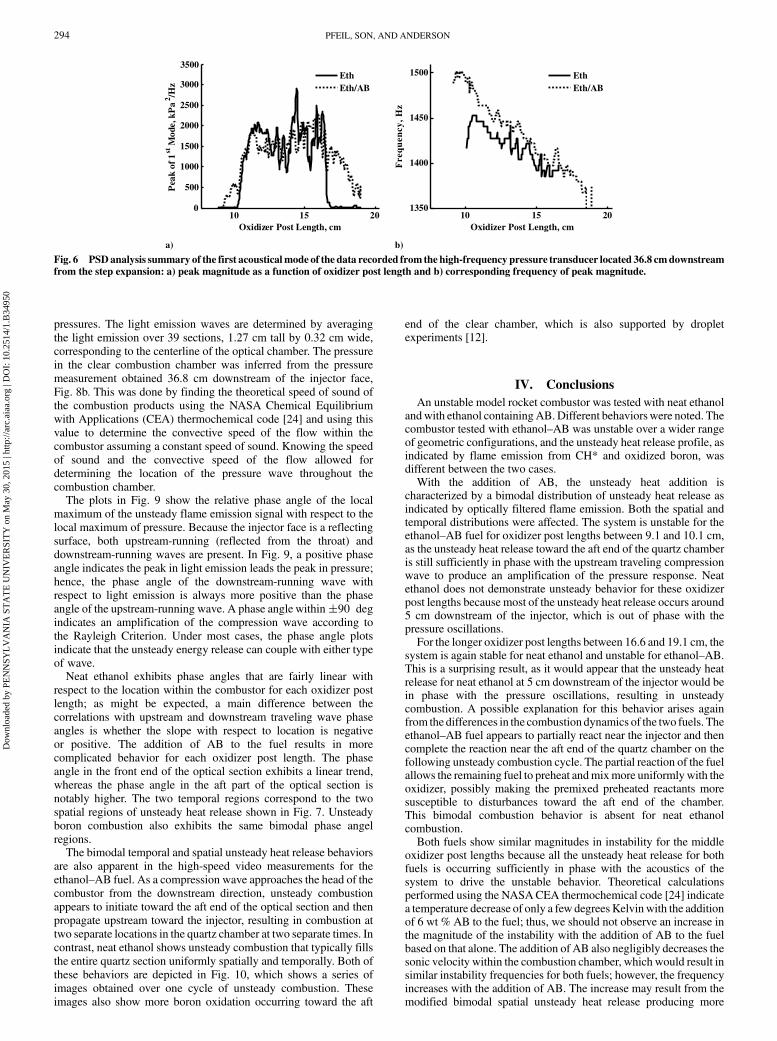
of the system can be seen in Fig. 6. As discussed earlier, the oxidizerpost length changes during the experiment. Figure 6a shows the peakvalue of the first mode for various oxidizer post lengths taken fromthe PSD analysis, discussed in Fig. 5, whereas Fig. 6b shows thecorresponding frequency. Both fuel types produce unstablecombustion behavior for oxidizer post lengths between 10.1 and16.6 cm at nearly the same magnitude; however, the fuel containingAB exhibits unstable combustion behavior for both longer andshorter oxidizer post lengths than the neat ethanol fuel. The frequencyof the first acoustic mode also has a measurable increase with theaddition of AB.The addition of AB also influences the location of unsteady heat
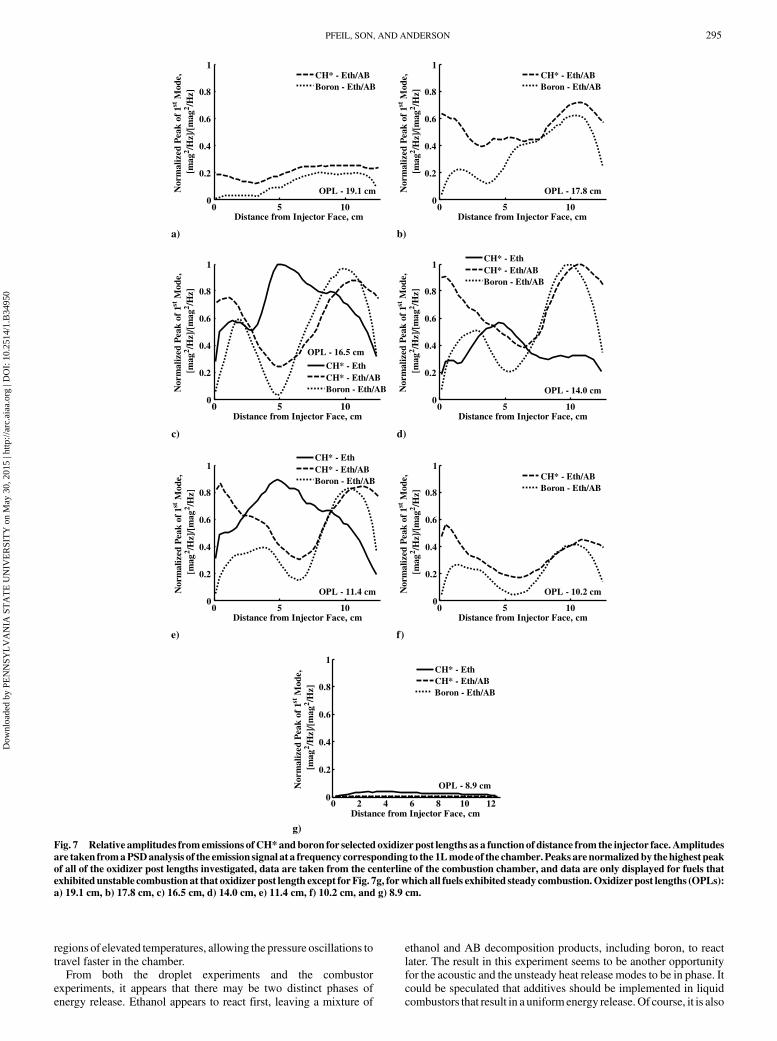
release within the combustor, as shown in Fig. 7, which shows thelocation of unsteady heat release for selected oxidizer post lengthsspanning the range of geometries. The data used to produce the plotsin Fig. 7 were obtained by applying a PSD analysis to the opticallyfiltered emission fluctuations from 39 sections, 1.27 cm tall by0.32 cmwide, corresponding to the centerline of the optical chamber.The PSD analysis used a 50 ms time slice and 512 points in a fastFourier transform. Peaks at the frequency of the strongest firstlongitudinal (1L) mode were obtained and then plotted as afunction of distance from the injector. The data were then normalizedby the maximum peak from all the geometries tested for each fuel.Unsteady heat addition is not shown for the neat ethanol case atoxidizer post length � 19.1, 17.8, and 10.2 cm because those caseswere stable.Ethanol combustion shows a peak in CH* emission occurring
about 5 cm downstream of the injector face, whereas the CH* andboron oxidation emissions for the ethanol-AB fuel have a bimodaldistribution, with maxima near the injector and toward the aft end ofthe optical section. Furthermore, the magnitude of unsteady boronoxidation near the aft end of the chamber is consistently higher than itis near the injector. The droplet experiments indicated that boronoxidation occurred after ethanol combustion [12], which is consistentwith more boron oxidization fluctuations occurring later in thechamber.The final significant change to note is the effect of the additive on
the temporal unsteady heat release. Of particular interest is thetemporal relationship between local pressure and heat release,because a positive correlation will lead to amplification of the
Fig. 4 Spectrograms of the frequency response of the combustor and the oxidizer post length as a function of time for experiments using a) neat ethanoland b) ethanol with 6 wt % AB. Measurement was made 36.8 cm downstream of the injector face.
292 PFEIL, SON, AND ANDERSON
Dow
nloa
ded
by P
EN
NSY
LV
AN
IA S
TA
TE
UN
IVE
RSI
TY
on
May
30,
201
5 | h
ttp://
arc.
aiaa
.org
| D
OI:
10.
2514
/1.B
3495
0

pressure oscillation according to Rayleigh’s criterion and becausepressure provides a useful reference in the stationary system. It isalso likely that the dominant coupling mechanism can be linked tothe stationary fluid dynamics that can be defined by the easilymeasurable pressure modes. However, because the pressure modecomprises both upstream and downstream traveling waves, the exactrole that each play in the initiation and sustenance of the combustioninstability is not clear.
The temporal relationship between pressure and light emissionoscillations is defined here as the phase angle. To determine thephase angle, the time between two separate peaks in the pressureoscillations, Fig. 8a, is averaged for 50 ms of oscillations for aparticular geometry and then set equivalent to 360 deg. The timebetween the peak light emission and pressure oscillation is thendetermined, Fig. 8a, averaged for 50 ms of oscillations, and thenconverted into a phase angle using the average time between peak
0 5000 10000 15000
100
102
104
Frequency, Hz
Mag
nitu
de, k
Pa2 /H
z
Eth10 s
0 5000 10000 15000
100
102
104
Frequency, Hz
Mag
nitu
de, k
Pa2 /H
z
Eth/AB10 s
a)
0 5000 10000 15000
100
102
104
Frequency, Hz
Mag
nitu
de, k
Pa2 /H
z
Eth11 s
0 5000 10000 15000
100
102
104
Frequency, Hz
Mag
nitu
de, k
Pa2 /H
z
Eth/AB11 s
b)
0 5000 10000 15000
100
102
104
Frequency, Hz
Mag
nitu
de, k
Pa2 /H
z
Eth12 s
0 5000 10000 15000
100
102
104
Frequency, Hz
Mag
nitu
de, k
Pa2 /H
z
Eth/AB12 s
c)
0 5000 10000 15000
100
102
104
Frequency, Hz
Mag
nitu
de, k
Pa2 /H
z
Eth13 s
0 5000 10000 15000
100
102
104
Frequency, Hz
Mag
nitu
de, k
Pa2 /H
z
Eth/AB13 s
d)
Fig. 5 PSD of neat ethanol (left column) and ethanol with 6 wt%AB (right column) for times of a) 10 s, b) 11 s, c) 12 s, and d) 13 s into operation of thecombustor. Measurement was made 36.8 cm downstream of the injector face.
PFEIL, SON, AND ANDERSON 293
Dow
nloa
ded
by P
EN
NSY
LV
AN
IA S
TA
TE
UN
IVE
RSI
TY
on
May
30,
201
5 | h
ttp://
arc.
aiaa
.org
| D
OI:
10.
2514
/1.B
3495
0
pressures. The light emission waves are determined by averagingthe light emission over 39 sections, 1.27 cm tall by 0.32 cm wide,corresponding to the centerline of the optical chamber. The pressurein the clear combustion chamber was inferred from the pressuremeasurement obtained 36.8 cm downstream of the injector face,Fig. 8b. This was done by finding the theoretical speed of sound ofthe combustion products using the NASA Chemical Equilibriumwith Applications (CEA) thermochemical code [24] and using thisvalue to determine the convective speed of the flow within thecombustor assuming a constant speed of sound. Knowing the speedof sound and the convective speed of the flow allowed fordetermining the location of the pressure wave throughout thecombustion chamber.The plots in Fig. 9 show the relative phase angle of the local
maximum of the unsteady flame emission signal with respect to thelocal maximum of pressure. Because the injector face is a reflectingsurface, both upstream-running (reflected from the throat) anddownstream-running waves are present. In Fig. 9, a positive phaseangle indicates the peak in light emission leads the peak in pressure;hence, the phase angle of the downstream-running wave withrespect to light emission is always more positive than the phaseangle of the upstream-running wave. A phase angle within�90 degindicates an amplification of the compression wave according tothe Rayleigh Criterion. Under most cases, the phase angle plotsindicate that the unsteady energy release can couple with either typeof wave.Neat ethanol exhibits phase angles that are fairly linear with
respect to the location within the combustor for each oxidizer postlength; as might be expected, a main difference between thecorrelations with upstream and downstream traveling wave phaseangles is whether the slope with respect to location is negativeor positive. The addition of AB to the fuel results in morecomplicated behavior for each oxidizer post length. The phaseangle in the front end of the optical section exhibits a linear trend,whereas the phase angle in the aft part of the optical section isnotably higher. The two temporal regions correspond to the twospatial regions of unsteady heat release shown in Fig. 7. Unsteadyboron combustion also exhibits the same bimodal phase angelregions.The bimodal temporal and spatial unsteady heat release behaviors
are also apparent in the high-speed video measurements for theethanol–AB fuel. As a compression wave approaches the head of thecombustor from the downstream direction, unsteady combustionappears to initiate toward the aft end of the optical section and thenpropagate upstream toward the injector, resulting in combustion attwo separate locations in the quartz chamber at two separate times. Incontrast, neat ethanol shows unsteady combustion that typically fillsthe entire quartz section uniformly spatially and temporally. Both ofthese behaviors are depicted in Fig. 10, which shows a series ofimages obtained over one cycle of unsteady combustion. Theseimages also show more boron oxidation occurring toward the aft
end of the clear chamber, which is also supported by dropletexperiments [12].
IV. Conclusions
An unstable model rocket combustor was tested with neat ethanolandwith ethanol containingAB.Different behaviorswere noted. Thecombustor tested with ethanol–AB was unstable over a wider rangeof geometric configurations, and the unsteady heat release profile, asindicated by flame emission from CH* and oxidized boron, wasdifferent between the two cases.With the addition of AB, the unsteady heat addition is
characterized by a bimodal distribution of unsteady heat release asindicated by optically filtered flame emission. Both the spatial andtemporal distributions were affected. The system is unstable for theethanol–AB fuel for oxidizer post lengths between 9.1 and 10.1 cm,as the unsteady heat release toward the aft end of the quartz chamberis still sufficiently in phase with the upstream traveling compressionwave to produce an amplification of the pressure response. Neatethanol does not demonstrate unsteady behavior for these oxidizerpost lengths because most of the unsteady heat release occurs around5 cm downstream of the injector, which is out of phase with thepressure oscillations.For the longer oxidizer post lengths between 16.6 and 19.1 cm, the
system is again stable for neat ethanol and unstable for ethanol–AB.This is a surprising result, as it would appear that the unsteady heatrelease for neat ethanol at 5 cm downstream of the injector would bein phase with the pressure oscillations, resulting in unsteadycombustion. A possible explanation for this behavior arises againfrom the differences in the combustiondynamics of the two fuels. Theethanol–AB fuel appears to partially react near the injector and thencomplete the reaction near the aft end of the quartz chamber on thefollowing unsteady combustion cycle. The partial reaction of the fuelallows the remaining fuel to preheat andmixmore uniformlywith theoxidizer, possibly making the premixed preheated reactants moresusceptible to disturbances toward the aft end of the chamber.This bimodal combustion behavior is absent for neat ethanolcombustion.Both fuels show similar magnitudes in instability for the middle
oxidizer post lengths because all the unsteady heat release for bothfuels is occurring sufficiently in phase with the acoustics of thesystem to drive the unstable behavior. Theoretical calculationsperformed using the NASACEA thermochemical code [24] indicatea temperature decrease of only a few degrees Kelvinwith the additionof 6 wt % AB to the fuel; thus, we should not observe an increase inthe magnitude of the instability with the addition of AB to the fuelbased on that alone. The addition of AB also negligibly decreases thesonic velocity within the combustion chamber, which would result insimilar instability frequencies for both fuels; however, the frequencyincreases with the addition of AB. The increase may result from themodified bimodal spatial unsteady heat release producing more
10 15 200
500
1000
1500
2000
2500
3000
3500
Oxidizer Post Length, cm
Pea
k of
1st
Mod
e, k
Pa
2 /Hz
EthEth/AB
10 15 201350
1400
1450
1500
Oxidizer Post Length, cm
Fre
qu
ency
, H
z
EthEth/AB
a) b)
Fig. 6 PSDanalysis summary of the first acousticalmode of the data recorded from the high-frequency pressure transducer located 36.8 cmdownstreamfrom the step expansion: a) peak magnitude as a function of oxidizer post length and b) corresponding frequency of peak magnitude.
294 PFEIL, SON, AND ANDERSON
Dow
nloa
ded
by P
EN
NSY
LV
AN
IA S
TA
TE
UN
IVE
RSI
TY
on
May
30,
201
5 | h
ttp://
arc.
aiaa
.org
| D
OI:
10.
2514
/1.B
3495
0
regions of elevated temperatures, allowing the pressure oscillations totravel faster in the chamber.From both the droplet experiments and the combustor
experiments, it appears that there may be two distinct phases ofenergy release. Ethanol appears to react first, leaving a mixture of
ethanol and AB decomposition products, including boron, to reactlater. The result in this experiment seems to be another opportunityfor the acoustic and the unsteady heat release modes to be in phase. Itcould be speculated that additives should be implemented in liquidcombustors that result in a uniform energy release.Of course, it is also
0 5 100
0.2
0.4
0.6
0.8
1
Distance from Injector Face, cm
Nor
mal
ized
Pea
k of
1st
Mod
e,
[mag
2 /Hz]
/[m
ag2 /H
z]
CH* - Eth/ABBoron - Eth/AB
OPL - 19.1 cm
0 5 100
0.2
0.4
0.6
0.8
1
Distance from Injector Face, cm
Nor
mal
ized
Pea
k of
1st
Mod
e,
[mag
2 /Hz]
/[m
ag2 /H
z]
CH* - Eth/ABBoron - Eth/AB
OPL - 17.8 cm
0 5 100
0.2
0.4
0.6
0.8
1
Distance from Injector Face, cm
Nor
mal
ized
Pea
k of
1st
Mod
e,
[mag
2 /Hz]
/[m
ag2 /H
z]
CH* - EthCH* - Eth/ABBoron - Eth/AB
OPL - 16.5 cm
0 5 100
0.2
0.4
0.6
0.8
1
Distance from Injector Face, cm
Nor
mal
ized
Pea
k of
1st
Mod
e,
[mag
2 /Hz]
/[m
ag2 /H
z]
CH* - EthCH* - Eth/ABBoron - Eth/AB
OPL - 14.0 cm
0 5 100
0.2
0.4
0.6
0.8
1
Distance from Injector Face, cm
Nor
mal
ized
Pea
k of
1st
Mod
e,
[mag
2 /Hz]
/[m
ag2 /H
z]
CH* - EthCH* - Eth/ABBoron - Eth/AB
OPL - 11.4 cm
0 5 100
0.2
0.4
0.6
0.8
1
Distance from Injector Face, cm
Nor
mal
ized
Pea
k of
1st
Mod
e,
[mag
2 /Hz]
/[m
ag2 /H
z]
CH* - Eth/ABBoron - Eth/AB
OPL - 10.2 cm
0 2 4 6 8 10 120
0.2
0.4
0.6
0.8
1
Distance from Injector Face, cm
Nor
mal
ized
Pea
k of
1st
Mod
e,
[mag
2 /Hz]
/[m
ag2 /H
z]
CH* - EthCH* - Eth/ABBoron - Eth/AB
OPL - 8.9 cm
g)
a) b)
c) d)
e) f)
Fig. 7 Relative amplitudes fromemissions ofCH*andboron for selected oxidizer post lengths as a function of distance from the injector face. Amplitudes
are taken fromaPSDanalysis of the emission signal at a frequency corresponding to the 1Lmodeof the chamber. Peaks arenormalized by thehighest peakof all of the oxidizer post lengths investigated, data are taken from the centerline of the combustion chamber, and data are only displayed for fuels thatexhibited unstable combustion at that oxidizer post length except for Fig. 7g, forwhich all fuels exhibited steady combustion.Oxidizerpost lengths (OPLs):a) 19.1 cm, b) 17.8 cm, c) 16.5 cm, d) 14.0 cm, e) 11.4 cm, f) 10.2 cm, and g) 8.9 cm.
PFEIL, SON, AND ANDERSON 295
Dow
nloa
ded
by P
EN
NSY
LV
AN
IA S
TA
TE
UN
IVE
RSI
TY
on
May
30,
201
5 | h
ttp://
arc.
aiaa
.org
| D
OI:
10.
2514
/1.B
3495
0

0.0002 0.0004 0.0006 0.0008
-200
0
200
400
600
Time, s
Pre
ssur
e, k
Pa
Lig
ht M
agni
tude
-4
-2
0
2
4
6
8
x 105
PressureLight
360o
Phase Angle
Injector Face
ShiftedPressure
360o
Measured Pressure
a) b)Fig. 8 Schematics depicting how phase angles were determined: a) schematic of the relationship between peak light emission andmaximum of travelingpressure waves and b) schematic of correlating pressure measurement at the aft end of the combustor to pressure throughout the combustor.
0 5 10-100
-50
0
50
100
150
200
Distance from Injector Face, cm
Pha
se A
ngle
, Deg
CH* - Eth/ABBoron - Eth/ABOPL - 10.2 cm
0 5 10-100
-50
0
50
100
150
200
Distance from Injector Face, cm
Pha
se A
ngle
, Deg
CH* - EthCH* - Eth/ABBoron - Eth/ABOPL - 11.4 cm
0 5 10-100
-50
0
50
100
150
200
Distance from Injector Face, cm
Pha
se A
ngle
, Deg
CH* - EthCH* - Eth/ABBoron - Eth/AB
OPL - 14.0 cm
0 5 10-100
-50
0
50
100
150
200
Distance from Injector Face, cm
Pha
se A
ngle
, Deg
CH* - EthCH* - Eth/ABBoron - Eth/ABOPL - 16.5 cm
0 5 10-100
-50
0
50
100
150
200
Distance from Injector Face, cm
Pha
se A
ngle
, Deg
CH* - Eth/ABBoron - Eth/ABOPL - 17.8 cm
0 5 10-100
-50
0
50
100
150
200
Distance from Injector Face, cm
Pha
se A
ngle
, Deg
CH* - Eth/ABBoron - Eth/ABOPL - 19.1 cm
a) b)
c) d)
e) f)
Fig. 9 Temporal phase angle of local maximum in light oscillations with respect to local maximum in unsteady pressure oscillations. Data are onlydisplayed for fuels that exhibited unstable combustion at that oxidizer post length. OPL: a) 19.1 cm, b) 17.8 cm, c) 16.5 cm, d) 14.0 cm, e) 11.4 cm, andf) 10.2 cm. The vertical lines indicate the location of the highest light emission fluctuations from Fig. 7 and are added for reference.
296 PFEIL, SON, AND ANDERSON
Dow
nloa
ded
by P
EN
NSY
LV
AN
IA S
TA
TE
UN
IVE
RSI
TY
on
May
30,
201
5 | h
ttp://
arc.
aiaa
.org
| D
OI:
10.
2514
/1.B
3495
0

possible that this bimodal energy distribution could be stabilizing, ifthe injector design can temporally decouple unsteady combustionfrom the chamber pressure modes.
Acknowledgments
The authors are appreciative of the support of the U.S. Air Forcethrough grant no. FA9550-09-0073 under the direction of MitatBirkan. They would also like to thank Thomas Feldman and BrittanyFey for their help in performing experiments.
References
[1] Natanzon, M. S., Combustion Instability, Progress in Astronautics andAeronautics, AIAA, Reston, VA, 1999, pp. 95–124.
[2] Yang, V., and Anderson, W. E., Liquid Rocket Engine Combustion
Instability, Progress in Astronautics and Aeronautics, AIAA,Washington, D.C., 1995, pp. 3–37.
[3] Tyagi, H., Phelan, P. E., Prasher, R., Peck, R., Lee, T., Pacheco, J. R., andArentzen, P., “Increased Hot-Plate Ignition Probability for Nano-particle-Laden Diesel Fuel,” Nano Letters, Vol. 8, No. 5, 2008,pp. 1410–1416.doi:10.1021/nl080277d
[4] Wickham, D. T., Cook, R., De Voss, S., Engel, J. R., and Nabity, J.,“Soluble Nano-Catalysts for High Performance Fuels,” Journal of
Russian Laser Research, Vol. 27, No. 6, 2006, pp. 552–561.doi:10.1007/s10946-006-0034-8
[5] Allen, C., Mittal, G., Sung, C., Toulson, E., and Lee, T., “An AerosolRapid Compression Machine for Studying Energetic-Nanoparticle-Enhanced Combustion of Liquid Fuels,” Proceedings of the
Combustion Institute, Vol. 33, No. 2, 2011, pp. 3367–3374.doi:10.1016/j.proci.2010.06.007
[6] Sabourin, J. L., Yetter, R. A., Asay, B. W., Lloyd, J. M., Sanders, V. E.,Risha, G. A., and Son, S. F., “Effect of Nano-Aluminum and FumedSilica Particles on Deflagration and Detonation of Nitromethane,”Propellants, Explosives, Pyrotechnics, Vol. 34, No. 5, 2009, pp. 385–393.doi:10.1002/prep.v34:5
[7] Pang, K., Yu, K. H., and Young, G., “Characterization of Nano- andMicron-Sized Aluminum Particles Burning in Dump Combustor,”AIAA Paper 2009-228, 2009.
[8] Young, G., Balar, R., Krasel, M., and Yu, K., “Effect of NanoparticleAdditives in Airbreathing Combustion,” AIAA Paper 2006-7593,2006.
[9] Kesselring, R. C., and Oberg, C. L., “Combustion Stability ofMetallized Gelled Propellants-Final Report,” AFRPL TR-67-164,May 1967.
[10] Pfeil, M. A., Rosen, S. C., Yu, Y. C., Anderson, W. E., and Son, S. F.,“Effects of NanoAluminum on Droplet Combustion and CombustionInstabilities in a Single Element Rocket Combustor,” AIAA Paper2010-7154, 2010.
[11] Bowden, M., Autrey, T., Brown, I., and Ryan, M., “The ThermalDecomposition of Ammonia Borane: A Potential HydrogenStorage Material,” Current Applied Physics, Vol. 8, Nos. 3–4, 2008,pp. 498–500.doi:10.1016/j.cap.2007.10.045
[12] Pfeil, M. A., Groven, L. J., Lucht, R. P., and Son, S. F., “Effects ofAmmonia Borane on the Combustion of an Ethanol Droplet atAtmospheric Pressure,”Combustion andFlame, Vol. 160,No. 10, 2013,pp. 2194–2203.doi:10.1016/j.combustflame.2013.04.014
[13] Sankaran, R., and Im, H. G., “Effects of Hydrogen Addition on theMarkstein Length and Flammability Limit of Stretched Methane/AirPremixed Flames,” Combustion Science and Technology, Vol. 178,No. 9, 2006, pp. 1585–1611.doi:10.1080/00102200500536217
[14] Schefer, R. W., Wicksall, D. M., and Agrawal, A. K., “Combustion ofHydrogen Enriched Methane in a Lean Premixed Swirl-StabilizedBurner,” Proceedings of the Combustion Institute, Vol. 29, No. 1, 2002,pp. 843–851.doi:10.1016/S1540-7489(02)80108-0
[15] Schefer, R. W., “Hydrogen Enrichment for Improved Lean FlameStability,” International Journal of Hydrogen Energy, Vol. 28, No. 10,2003, pp. 1131–1141.doi:10.1016/S0360-3199(02)00199-4
[16] Wang, C. H., Liu, X. Q., and Law, C. K., “Combustion andMicroexplosion of Freely Falling Multicomponent Droplets,”
Fig. 10 One cycle of neat ethanol, CH* filter (left column); ethanol with 6 wt%AB, CH* filter (center column); and ethanol with 6 wt%AB, green filter(right column). Measurements were for an oxidizer post length of 16.5 cm. Time steps between each image are the same. False coloring is added to theimages to accentuate magnitude of heat release.
PFEIL, SON, AND ANDERSON 297
Dow
nloa
ded
by P
EN
NSY
LV
AN
IA S
TA
TE
UN
IVE
RSI
TY
on
May
30,
201
5 | h
ttp://
arc.
aiaa
.org
| D
OI:
10.
2514
/1.B
3495
0

Combustion and Flame, Vol. 56, No. 2, 1984, pp. 175–197.doi:10.1016/0010-2180(84)90036-1
[17] Solomon, Y., and Natan, B., “Experimental Investigation of theCombustion of Organic-Gellant-Based Gel Fuel Droplets,”CombustionScience and Technology, Vol. 178, No. 6, 2006, pp. 1185–1199.doi:10.1080/00102200600620259
[18] Sisco, J., Yu, Y., Sankaran, V., and Anderson, W., “Examination ofMode Shapes in an Unstable Model Rocket Combustor,” Journal of
Sound and Vibration, Vol. 330, No. 1, 2011, pp. 61–74.doi:10.1016/j.jsv.2010.07.016
[19] Yu, Y., Sisco, J., Rosen, S., Madhav, A., and Anderson, W.,“Spontaneous Longitudinal Combustion Instability in a Continuously-Variable Resonance Combustor,” Journal of Propulsion and Power,Vol. 28, No. 5, 2012, pp. 876–887.doi:10.2514/1.B34308
[20] Pearse, R. W. B., and Gaydon, A. G., The Identification of Molecular
Spectra, Chapman and Hall, New York, 1976, pp. 10, 57–59.
[21] King,M. K., “Ignition and Combustion of Boron Particles and Clouds,”Journal of Spacecraft and Rockets, Vol. 19, No. 4, 1982, pp. 294–306.doi:10.2514/3.62256
[22] Kaskan, W. E., and Milliken, R. C., “Source of Green Bands fromBoron-Containing Flames,” Journal of Chemical Physics, Vol. 32,No. 4, 1960, pp. 1273–1274.doi:10.1063/1.1730899
[23] Lee, J. G., and Santavicca, D. A., “Experimental Diagnostics for theStudy of Combustion Instabilities in Lean Premixed Combustors,”Journal of Propulsion and Power, Vol. 19, No. 5, 2003, pp. 735–750.doi:10.2514/2.6191
[24] NASA CEA, Chemical Equilibrium with Applications, Ver. 2, LewisResearch Center, Cleveland, OH, 2002.
E. KimAssociate Editor
298 PFEIL, SON, AND ANDERSON
Dow
nloa
ded
by P
EN
NSY
LV
AN
IA S
TA
TE
UN
IVE
RSI
TY
on
May
30,
201
5 | h
ttp://
arc.
aiaa
.org
| D
OI:
10.
2514
/1.B
3495
0


![Charge Transfer Fluorescence in Imine Borane Adducts ... · 1.2.1 Synthesis of the borane reagents. Tris(pentafluorophenyl) borane. Tris(pentafluorophenyl)borane [1]was synthesised](https://static.fdocuments.net/doc/165x107/5ec38c345e3bae053a7989e0/charge-transfer-fluorescence-in-imine-borane-adducts-121-synthesis-of-the.jpg)


