Inflation Report ——— II/2020
46
www.cnb.cz Inflation Report ——— II/2020 Czech National Bank ——— Inflation Report ——— II/2020
Transcript of Inflation Report ——— II/2020

www.cnb.cz
Inflation Report ——— II/2020
Cze
ch
Na
tio
na
l B
an
k —
——
In
fla
tio
n R
ep
ort
——
— I
I/2
02
0

This Inflation Report was approved by the CNB Bank Board on 14 May 2020 and – with some exceptions – contains
the information available as of 24 April 2020. Unless stated otherwise, the sources of the data contained in this
Inflation Report are the CZSO or the CNB. All the Inflation Reports published to date are available on our website.
Underlying data for the tables and charts presented in the text of this Inflation Report, minutes of Bank Board
meetings, and time series of selected economic and monetary indicators (available in the ARAD database) are also
published there.

Contents
FOREWORD 4
I. SUMMARY 6
II. THE FORECAST, ITS CHANGES AND RISKS 8
II.1 DEVELOPMENTS ABROAD AND EXTERNAL ASSUMPTIONS OF THE FORECAST 8
II.1.1 Economic developments abroad 8 The impacts of the Covid-19 pandemic in the Czech Republic’s main trading partner countries 9
II.1.2 Price developments abroad 10 II.1.3 Financial developments abroad 12
II.2 THE FORECAST 14
Direct impacts of the Covid-19 pandemic on the Czech economy 14 II.2.1 Inflation and monetary policy 16 II.2.2 Costs and the labour market 18 II.2.3 Economic activity 20 II.2.4 The balance of payments 23 II.2.5 Fiscal developments 24
II.3 RISKS AND UNCERTAINTIES OF THE FORECAST 26
II.3.1 Risks perceived by the CNB 26 II.3.2 Risks signalled by other entities’ forecasts 31
III. CURRENT ECONOMIC DEVELOPMENTS 32
III.1 INFLATION AND INFLATION TARGET FULFILMENT 32
III.2 ECONOMIC DEVELOPMENTS 34
III.3 THE LABOUR MARKET 35
III.4 FINANCIAL AND MONETARY DEVELOPMENTS 36
ABBREVIATIONS 38
GLOSSARY 39
KEY MACROECONOMIC INDICATORS 44

Foreword 4
Czech National Bank ——— Inflation Report ——— II/2020
Foreword Dear Readers,
The Inflation Report is our key monetary policy publication. We have
been publishing it since 1998. In each Report, we react to the latest
developments. The content of this issue is significantly affected by the
current dramatic situation regarding the coronavirus pandemic. Because of
the pandemic, we have significantly shortened the passages in which we
normally comment on the latest available data for previous quarters. These
data have become highly outdated in terms of their effect on future
developments, so we have left them out of this Report. We have also left
out the detailed comparison of our new forecast with the previous one. On
the contrary, alternative scenarios of future economic developments have
moved to the forefront in an environment of high uncertainty depending on
the duration of the quarantine measures and the further evolution of the
epidemiological situation. Section I of the Report presents the message of
our new quarterly forecast and the reasons behind the monetary policy
decision adopted by the CNB Bank Board. In section II you will find
a detailed description of the new forecast and its risks. Section III contains
a brief summary of past developments.
According to the Czech Constitution and the Act on the CNB, our primary objective is to maintain price stability. In
addition, we maintain financial stability and see to the sound and smooth operation of the financial system in the
Czech Republic. Without prejudice to our primary objective, we also aim to support the general economic policies of
the Government leading to sustainable economic growth. By maintaining price stability, we assist Czech firms and
households in their decision-making and planning, which ultimately results in greater stability of the entire Czech
economy. Our independence is a necessary condition for successful implementation of monetary policy focused on
price stability. For that reason, we are not allowed to seek or take instructions from the President of the Republic,
from the Government, from Parliament, from administrative authorities or from any other body.
We have been maintaining price stability in the inflation targeting regime since 1998. The main features of this regime
are a publicly announced inflation target, a focus on forecasts of the future path of inflation, and open communication
with the public. We set the inflation target as year-on-year growth in consumer prices of 2% starting from 2010. We
endeavour to ensure that actual inflation does not differ from this target by more than one percentage point on either
side. Most advanced economies have similar inflation targets. There are several reasons why we define price stability
as slight growth in prices rather than zero inflation. Inflation measures tend to be distorted upward because of
imperfect adjustment for the impacts of changes in the quality of goods and services, where growth in quality is
sometimes statistically captured as growth in prices. This distortion is also due to an assumption of constant weights
in the consumer basket, whereas in reality people have a natural tendency to move away from goods and services
whose prices are rising faster to those which are recording below-average growth or even falling. Last but not least,
if we were to target an inflation rate that was too low or even zero, there would often be a threat of deflation, wh ich
has very harmful consequences for society as a whole. In such situations, moreover, the central bank would
repeatedly hit the zero lower bound on interest rates and would often have to use other, less conventional
instruments.
Changes in the monetary policy settings manifest themselves in the economy with a lag. Therefore, it is the future
evolution of the Czech economy, rather than its current situation, that is of prime importance for the CNB Bank
Board’s decisions. The forecast for inflation at the “monetary policy horizon” (about 12–18 months ahead) is of
greatest relevance to our decision-making. Our forecast tells us the most likely future course of the economy. It is
drawn up by experts from the Monetary Department using a structural macroeconomic model. The g3+ core model
provides a comprehensive and consistent view of the relationships between nominal variables and the real economy.
It captures the basic characteristics of the Czech economy as described by key variables such as prices, wages,
GDP components in both nominal and real terms, the koruna exchange rate and nominal interest rates. Given the
openness of the Czech economy, the structural linkages in the external economy affecting foreign trade and the
koruna-euro exchange rate play an important role in the new model. Forward-looking expectations gradually
reflecting outlooks for exogenous variables and their interaction with monetary policy, which reacts to economic
shocks through changes in interest rates in an effort to stabilise inflation close to 2% at the monetary policy horizon,
are an important feature of the model. The main forecasting inputs are an assessment of the current state of the

Foreword 5
Czech National Bank ——— Inflation Report ——— II/2020
economy (the initial state), projected developments abroad, and the outlook for administered prices and domestic
fiscal policy. Based on this input information, and using the model and additional detailed analyses drawn up by
economists from the Monetary Department, a forecast of the most likely course of the Czech economy is then
compiled. In the current situation, the weight of the expert inputs in our forecast as opposed to the model mechanisms
has naturally increased. In addition to the baseline scenario of the forecast, alternative or sensitivity scenarios are
prepared as needed using the core projection model. This issue of the Inflation Report includes a longer-lasting
pandemic scenario and a pandemic resurgence scenario.
The forecast is the key, but not the only, input to our monetary policy decision-making. Unless the economic situation
requires an extraordinary monetary policy meeting (like in mid-March 2020), the Bank Board meets eight times a year
to discuss monetary policy issues. At four of the meetings (in February, May, August and November) we discuss
a new forecast, while at the other four (in March, June, September and December) we discuss the risks and
uncertainties of the most recent forecast in the light of newly available information on domestic and foreign economic
developments. The arrival of new information since the forecast was drawn up and the possibility of the Bank Board
members assessing its risks differently mean that the decision we adopt may not fully match the message of the
forecast prepared by our experts. The role of this qualitative assessment by the Bank Board is naturally stronger in
periods of higher uncertainty like the current pandemic situation.
The CNB’s main monetary policy instrument is the two-week repo rate. We also set the discount rate and the Lombard
rate. By changing these monetary policy rates, we influence financial market interest rates from which commercial
banks derive their loan and deposit rates for their customers. A rate increase leads – via the “transmission
mechanism” – to slower demand growth in the economy, which, in turn, causes inflation to go down. Lowering the
repo rate has the opposite effect. If the forecast indicates growing inflation pressures which might cause inflation to
exceed the 2% target, this is a signal that our monetary policy should be more restrictive, i.e. that interest rates
should be raised. The opposite applies, of course, if inflationary tendencies decrease, as monetary policy in the
(future) inflation-targeting regime is symmetrical in both directions. The exception is a situation where inflation is
affected by extraordinary supply-side shocks which we cannot influence and which will cause it to deviate from the
target only temporarily. Changes to indirect taxes and sharp swings in oil prices are typical examples of such shocks.
Attempts to keep inflation on target despite such shocks would lead to unnecessary volatility in economic growth and
employment. We therefore look past the first-round effects of such factors in our decision-making and tolerate
a temporary deviation of inflation from the target due to such price shocks. Inflation then returns to the target after
the shocks fade away.
We have a whole range of other instruments besides the monetary policy rates described above. These we can use in
situations where the use of interest rates is not enough to reach the inflation target. One such situation was the
adoption of the exchange rate commitment in autumn 2013, which we did after monetary policy rates had been
lowered to “technical zero” in November 2012 and the situation called for a further easing of the monetary conditions.
The exchange rate commitment was used until April 2017, when the Bank Board decided to discontinue it. In the
standard managed float exchange rate regime to which we have returned, we can moreover respond to potential
excessive fluctuations of the koruna exchange rate by intervening in the foreign exchange market. We use these
instruments primarily to deliver price stability; to maintain financial stability we use a separate set of instruments
called macroprudential tools. However, monetary policy and macroprudential policy affect one another, as monetary
policy decisions have an impact on the financial sector and, conversely, macroprudential policy decisions influence
the economy and inflation. We therefore take the interactions between the two policies into account. In this context,
it is highly welcome that the Czech Parliament has approved an amendment to the Act on the CNB which broadens
the range of our financial market operations and thereby the range of potential instruments to achieve the price
stability objective, but also the financial stability objective, until the end of 2021.
We are proud of the fact that the CNB is one of the most transparent central banks in the world according to renowned
international analyses. We publish our forecast and its risks and an explanation of the reasons for the Bank Board ’s
decision in order to make our monetary policy as transparent, comprehensible, predictable and therefore credible as
possible. We are convinced that credible monetary policy effectively anchors inflation expectations and thereby
significantly helps to maintain price stability and overall macroeconomic stability in the Czech Republic . I believe that
our monetary policy framework will succeed in doing so even in the current difficult situation.
On behalf of the Czech National Bank
Jiří Rusnok
Governor

I. —— Summary 6
Czech National Bank ——— Inflation Report ——— II/2020
I. SUMMARY
Inflation will decline rapidly into the tolerance band and will be
close to the CNB’s 2% target over the monetary policy horizon (see
Chart I.1). Consumer prices increased by 3.6% in 2020 Q1, driven
by buoyant core inflation and faster growth in food prices and
administered prices. Inflation will fall rapidly below the upper
boundary of the tolerance band around the target in the coming
months, mainly due to the generally anti-inflationary impacts of
the coronavirus pandemic amid a deep decline in domestic
economic activity. Growth in total costs will temporarily surge due
to the recent sharp depreciation of the koruna. However, this will
soon be outweighed by appreciably weaker domestic inflation
pressures reflecting the impacts of the quarantine measures of
the government and firms. This will lead to a further decline in
inflation, which will temporarily fall slightly below the 2% target in
late 2020/early 2021. The decline in inflation will also be fostered
by a drop in fuel prices connected with the collapse of world oil
prices and slower growth in administered prices. By contrast, food
price inflation will remain high this year, owing to high consumer
demand on the one hand and as a result of labour shortages in
agriculture, cold weather in early spring and international
transport restrictions due to the coronavirus pandemic on the
other. The decline in inflation will also be slowed this year and
the next by the expected price impacts of changes to indirect
taxes. As a result, inflation will be close to the 2% target in 2021
amid significantly accommodative monetary conditions. Monetary
policy-relevant inflation will be slightly lower than headline
inflation (see Chart I.2).
The Czech Republic has been hit significantly by the coronavirus
pandemic, and the decline in the global and domestic economy will
be exceptionally deep this year (see Chart I.3). The anti-pandemic
measures adopted by the government caused the shutdown of
a large part of the domestic economy in March. According to the
assumptions of the forecast, the epidemiological situation will
allow the restrictions to be gradually lifted and most sectors to
start up again during Q2. However, the negative impacts of higher
unemployment and the unfavourable overall perception of the
economic situation among households and firms will persist. The
previously very tight labour market will thus cool down rapidly.
GDP will fall by 8% overall this year and, despite a gradual return
to growth, economic activity will not return to the pre-pandemic
level before the end of next year. This will be due chiefly to fixed
investment. Its return to growth will be dampened by the deep
decline in external demand associated with the significant
deterioration in global economic sentiment. Exports of goods and
services can therefore be expected to drop sharply. This will be
reflected in a negative contribution of net exports to GDP growth
this year. Following an initial decline, household consumption will
fare somewhat better, supported by decreasing but still positive
wage growth and massive stabilising budgetary measures. In
addition to programmes to support the liquidity of households and
firms hit by the pandemic, government expenditure will rise owing
to a previously approved increase in non-market sector wages,
pensions and public investment.
Over the entire forecast horizon, the exchange rate will remain
close to the current level to which it weakened after the pandemic
broke out (see Chart I.4). The exchange rate forecast for 2020 Q2
Chart I.3 GDP growth forecast
The Czech economy will contract this year due to the
coronavirus pandemic; its growth will resume next year,
but from a substantially lower base
(annual percentage changes; seasonally adjusted)
Note: The current uncertainty regarding future GDP growth
is much higher than implied by the historical forecast errors.
The confidence intervals of the GDP growth forecast have
therefore been widened significantly to reflect this increased
uncertainty.
-20
-15
-10
-5
0
5
10
15
20
II/18 III IV I/19 II III IV I/20 II III IV I/21 II III IV
90% 70% 50% 30% confidence interval
Chart I.2 Monetary policy-relevant inflation
forecast
Monetary policy-relevant inflation will be slightly lower
than headline inflation and will also be close to the
CNB’s 2% target over the monetary policy horizon
(year on year in %)
Note: The confidence intervals of the monetary policy-
relevant inflation forecast reflect the predictive power of past
forecasts and are symmetric. They are widening only for the
first five quarters and then stay constant. This is consistent
with both the past predictive power and the stabilising role of
monetary policy.
0
1
2
3
4
5
II/18 III IV I/19 II III IV I/20 II III IV I/21 II III IV
90% 70% 50% 30% confidence interval
2% inflation target
Monetary policy
horizon
Chart I.1 Headline inflation forecast
Headline inflation will fall rapidly for the rest of this year
and will be close to the CNB’s 2% target next year
(year on year in %)
Note: The confidence intervals of the headline inflation
forecast reflect the predictive power of past forecasts and
are symmetric. They are widening only for the first five
quarters and then stay constant. This is consistent with both
the past predictive power and the stabilising role of
monetary policy.
0
1
2
3
4
5
II/18 III IV I/19 II III IV I/20 II III IV I/21 II III IV
90% 70% 50% 30% confidence interval
2% inflation target
Monetary policy
horizon

I. —— Summary 7
Czech National Bank ——— Inflation Report ——— II/2020
is set at CZK 27.2 to the euro and thus reflects the sharp
weakening of the koruna at the end of Q1 caused by the outbreak
of the coronavirus pandemic. The exchange rate will remain close
to its current level over the entire forecast horizon due to the
worse foreign and domestic economic outlook and narrower
interest rate differential.
Consistent with the forecast is a further decline in domestic market
interest rates in Q2 (see Chart I.5). This decline in rates is
a continuation of the sharp drop recorded in March and reflects
the effects of government quarantine measures in the domestic
economy as well as the significantly worse external outlook.
These factors will lead to a significant cooling of the labour market
and worsening sentiment among households and firms. This will
have significant anti-inflationary consequences. However, the
decline in rates will be slowed by the recent sharp weakening of
the koruna, which is contributing to an easing of the overall
monetary conditions. Rates will then remain broadly stable over
the rest of the forecast horizon.
At its May monetary policy meeting, the CNB Bank Board lowered
the two-week repo rate by 75 basis points to 0.25%. At the same
time, it lowered the Lombard rate to 1.00%. The discount rate
remains unchanged at 0.05%. Five members voted in favour of
this decision, and two members voted for lowering the repo rate
by 50 basis points. The new interest rate levels come into effect
on 11 May 2020.
The Bank Board assessed the risks to the forecast in the current
extraordinary situation as being unprecedentedly high. The risks
are connected with the course of the pandemic and especially
with the duration and size of the impacts of the quarantine
measures on the global and Czech economy. These risks require
an even greater easing of the monetary conditions compared with
the baseline scenario of the forecast.
Chart I.4 Exchange rate forecast
The exchange rate of the koruna will remain close to its
current weakened level due to unfavourable economic
developments
(CZK/EUR)
Note: The confidence intervals of the CZK/EUR exchange
rate reflect the predictive power of past forecasts (with the
exception of the exchange rate commitment period). They
are symmetric and linearly widening.
24
25
26
27
28
29
30
II/18 III IV I/19 II III IV I/20 II III IV I/21 II III IV
90% 70% 50% 30% confidence interval
Chart I.5 Interest rate forecast
After the sharp fall in domestic market interest rates
recorded in March, consistent with the forecast is a
further decline in 2020 Q2 followed by broad stability
(3M PRIBOR in %)
Note: The confidence intervals of the 3M PRIBOR forecast
reflect the predictive power of past forecasts (with the
exception of the exchange rate commitment period). They
are symmetric, linearly widening and limited below by the
zero lower bound.
0
1
2
3
II/18 III IV I/19 II III IV I/20 II III IV I/21 II III IV
90% 70% 50% 30% confidence interval

II. —— The forecast, its changes and risks 8
Czech National Bank ——— Inflation Report ——— II/2020
II. THE FORECAST, ITS CHANGES AND RISKS
II.1 DEVELOPMENTS ABROAD AND EXTERNAL ASSUMPTIONS OF THE FORECAST
The global economy will contract significantly this year due to the Covid-19 pandemic, but will return to
growth next year. The euro area, one of the hardest-hit areas of the world, will experience a deep
economic decline in the first half of this year. The situation will then gradually stabilise and economic
growth will resume next year. Producer prices are expected to fall substantially this year, owing to the
unprecedented drop in economic activity and the collapse of oil prices. Consumer price inflation will
slow almost to zero this year. The ECB has launched massive securities purchases. Short-term euro
rates remain negative, as does their outlook. A radical monetary policy easing in the USA has led to
a further decline in US interest rates. The euro-dollar exchange rate will appreciate slightly.
II.1.1 Economic developments abroad
The output of the world economy will decrease markedly this year
due to the pandemic, but its growth will recover next year.1 Europe
and the USA are the most severely hit areas of the world. Among
the largest economies, only China, India and Brazil will make
positive contributions to global growth. Overall, the weighted
decline in the economies monitored is expected to reach about
1.5% this year. The world economy is expected to grow by 5.5%
next year2 (see Chart II.1.1).3
The solid economic activity seen in the euro area in early 2020 was
hit by measures introduced to counter the spread of the virus. The
April Purchasing Managers’ Index (PMI) in manufacturing (see
Chart II.1.2) indicates that the decline in industrial production will
approach double figures. The unemployment rate hit an all-time
low in February (7.3%). However, unemployment remained
relatively high in countries that were subsequently hit the most by
the coronavirus. Now it can be expected to rise sharply.
GDP in the effective euro area4 will drop markedly in Q2, but its
year-on-year decline will then start to moderate (see Chart II.1.3).
The economic impacts of governments’ quarantine measures to
combat the pandemic will be partly offset by the fiscal measures
being adopted by individual euro area countries. From 2020 Q3
onwards, the moderation of the year-on-year decline in GDP will
be driven mainly by improving household consumption, while
corporate investment will remain subdued for longer as a result
of high uncertainty and negative sentiment. The euro area
economy in effective terms will contract by almost 7% overall this
year. Next year, it will partly recover from an extremely low level,
rising by more than 4%. The risks to the outlook are currently
extreme and tilted towards lower growth. They are described by
—
1 A more detailed description of expected developments abroad, updated every month, is available in Global Economic Outlook.
2 The CF and EIU outlooks for this year converted into the effective euro area are rather more optimistic than the external assumptions of the forecast, but the difference is not substantial.
3 The outlook is indicated by the grey area in the chart. This convention is used throughout this Report.
4 For the purposes of the forecast, external real and price developments are proxied by effective euro area indicators (see the Glossary).
Chart II.1.2 PMI in manufacturing
Industrial production can be expected to decline
markedly both in Germany and in the euro area as a
whole
(Purchasing Managers’ Index; source: Bloomberg)
30
35
40
45
50
55
60
65
1/15 1/16 1/17 1/18 1/19 1/20
Germany Euro area
Chart II.1.1 World economy growth outlook
The world economy will contract this year and recover
next year
(annual percentage changes in real GDP; contributions in
percentage points; source: EIU, CF, CNB calculation)
Note: World economy growth is proxied by the growth of the
eight largest economies, which account for around 75% of
global GDP. The weights of the individual economies are
calculated on the basis of nominal GDP at purchasing power
parity. The sources of the outlooks are CF and EIU.
-3
-2
-1
0
1
2
3
4
5
6
2011 2012 2013 2014 2015 2016 2017 2018 2019 2020 2021
China USA
India Japan
Euro area United Kingdom
Russia Brazil
World economy

II. —— The forecast, its changes and risks 9
Czech National Bank ——— Inflation Report ——— II/2020
two scenarios in section II.3 (Longer-lasting pandemic scenario
and Pandemic resurgence scenario).5
The impacts of government quarantine measures and company
shutdowns will differ across the Czech Republic’s trading partner
countries. While the quarantine measures (see Box 1) in Italy and
Spain have halted economic activity except in a few key sectors,
the restrictions in Slovakia and Germany have been much softer.
As a result, the year-on-year contraction in GDP this year will be
below 6% in Germany and Slovakia, whereas in Italy and Spain
it will exceed 11%. From a sectoral perspective, travel has been
hit in a fundamental manner and a more permanent loss of output
can be expected there. The economic impacts of the pandemic
will be partly offset by fiscal measures, which are expected to
exceed 1% of GDP in Italy, Spain, France and Slovakia. So far,
Germany has approved the largest additional expenditure,
totalling almost EUR 105 billion (3% of GDP), focused on direct
support for firms and state-subsidised shorter working hours
(“Kurzarbeit”).
Economic activity in the Czech Republic’s main trading partner
countries will recover rapidly after the pandemic subsides.
However, the recovery will not be enough for GDP in the effective
euro area to return to the pre-pandemic level (see Chart II.1.4). The
output gap will thus remain negative over the entire forecast
horizon and will close only gradually.
The impacts of the Covid-19 pandemic in the Czech Republic’s main trading partner countries
The Covid-19 pandemic has fundamentally affected all
European economies, most of all the Italian and Spanish ones
(see Chart 1). These two countries, along with Germany, France
and Slovakia, rank among the Czech Republic’s largest trading
partners and proxy for external demand for the purposes of the
forecast. This box therefore focuses on them. In just a few days
in early March, Italy saw a dramatic rise in infections and the
virus spread to other EU states. Most countries responded by
introducing social distancing measures and travel restrictions
to slow the spread of the pandemic as much as possible. Spain
and Slovakia brought in restrictions less than a week after Italy,
while Germany did not clamp down until 20 March, when the
number of cases was already high relative to other countries.
In most of these countries, the numbers of new cases peaked
in late March/early April (see Chart 2). In France, the reversal
was less pronounced and the growth in the number of cases
may stay high for longer. Given this trend, it can be assumed
that most countries will reach the overall peak of the pandemic
(as measured by the number of active cases) by May.
The sharp rise in the number of cases and deaths led to the
introduction of a range of quarantine measures. Social contact
has been restricted the most in Italy and Spain, where social
—
5 The risks associated with Brexit and trade wars have been significantly overshadowed by the latest economic developments.
Chart II.1.3 Euro area GDP growth outlook
Economic activity will drop sharply during the first half of
this year and its year-on-year decline will then start to
moderate gradually
(annual percentage changes; contributions in percentage
points to growth in the effective euro area; seasonally
adjusted; CNB calculation)
Note: Other comprises 12 other euro area countries. Its
forecasted growth corresponds to the average growth of the
five countries shown in the chart.
-15
-10
-5
0
5
10
15
I/15 I/16 I/17 I/18 I/19 I/20 I/21
Germany Slovakia
France Italy
Spain Other
Effective euro area Euro area
Chart II.1.4 Effective euro area GDP outlook
The recovery in growth in the second half of this year will
not be enough for GDP to return to the pre-pandemic
level over the forecast horizon
(index; 2000 = 100)
115
120
125
130
135
140
I/15 I/16 I/17 I/18 I/19 I/20 I/21
Chart 1 (BOX) Numbers of active cases in
the Czech Republic’s largest trading partner
countries in the euro area
The Covid-19 pandemic has hit Italy and Spain
particularly hard, while in Slovakia the pandemic has
been very limited
(number of active cases per million inhabitants)
0
500
1000
1500
2000
2500
1/3 8/3 15/3 22/3 29/3 5/4 12/4 19/4 26/4 3/5 10/5
Italy Spain France Germany Slovakia
II. —— The forecast, its changes and risks 10
Czech National Bank ——— Inflation Report ——— II/2020
life has virtually ground to a halt and economic activity has
frozen. In Italy the situation is expected to last at least until the
end of April, while Spain has already started easing the
restrictions in some sectors (construction and manufacturing).
By contrast, other countries have introduced more moderate
restrictive measures. Shops and restaurants are closed, but
tourism has also suffered. Moreover, many car manufacturers
and their suppliers have shut down production in Europe.
Germany started to lift its restrictions in late April (when small
shops were reopened), while France is not expected to do so
until May. The Slovak government has announced a four-step
plan for gradually relaxing its restrictions, with full lifting
planned for early June.
The expected economic consequences depend on the
assumptions made about the course of the pandemic and the
government measures. The impacts of the pandemic on each
economy can be estimated on the basis of an analysis of gross
value added by sector. Restrictions had been in force in all the
economies under review for 2–4 weeks at the end of Q1 and
will remain in effect until at least either the end of April or mid-
May. Although some of them may be softened before the end
of Q2, the recovery in the sectors concerned will be gradual.
The size of the downturn in each sector was selected on the
basis of available estimates of the expected duration and
effectiveness of the restrictive measures in each country.
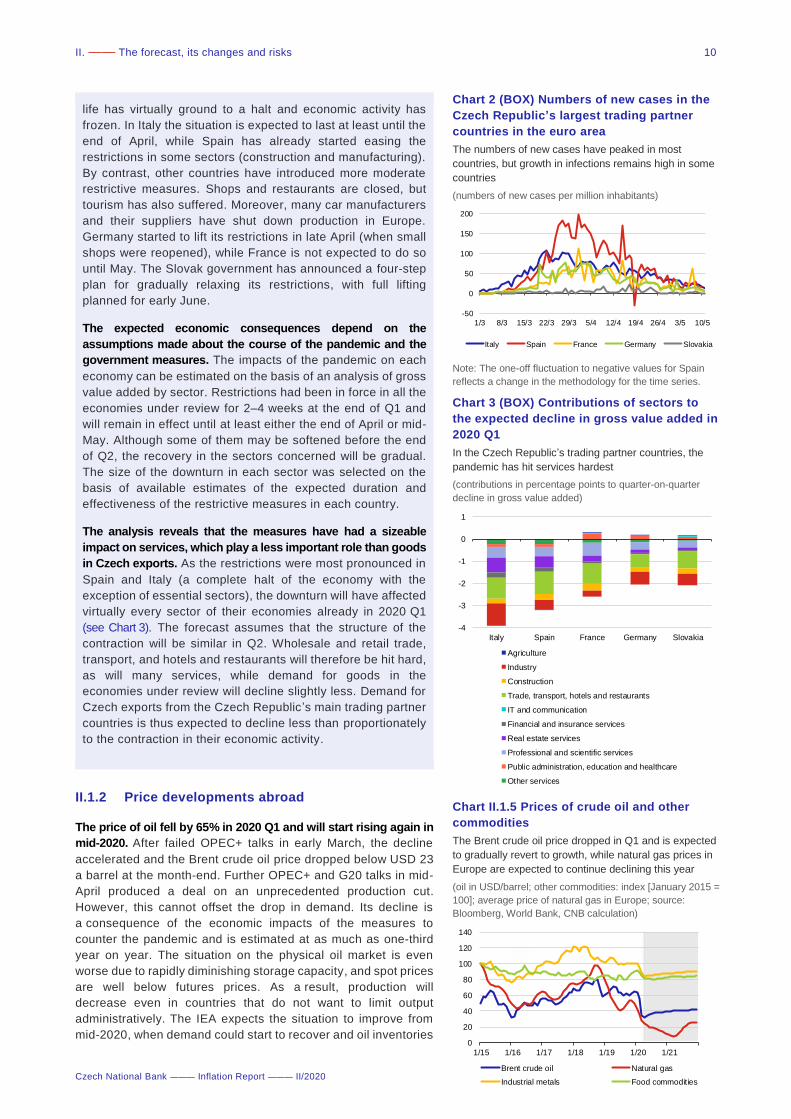
The analysis reveals that the measures have had a sizeable
impact on services, which play a less important role than goods
in Czech exports. As the restrictions were most pronounced in
Spain and Italy (a complete halt of the economy with the
exception of essential sectors), the downturn will have affected
virtually every sector of their economies already in 2020 Q1
(see Chart 3). The forecast assumes that the structure of the
contraction will be similar in Q2. Wholesale and retail trade,
transport, and hotels and restaurants will therefore be hit hard,
as will many services, while demand for goods in the
economies under review will decline slightly less. Demand for
Czech exports from the Czech Republic ’s main trading partner
countries is thus expected to decline less than proportionately
to the contraction in their economic activity.
II.1.2 Price developments abroad
The price of oil fell by 65% in 2020 Q1 and will start rising again in
mid-2020. After failed OPEC+ talks in early March, the decline
accelerated and the Brent crude oil price dropped below USD 23
a barrel at the month-end. Further OPEC+ and G20 talks in mid-
April produced a deal on an unprecedented production cut.
However, this cannot offset the drop in demand. Its decline is
a consequence of the economic impacts of the measures to
counter the pandemic and is estimated at as much as one-third
year on year. The situation on the physical oil market is even
worse due to rapidly diminishing storage capacity, and spot prices
are well below futures prices. As a result, production will
decrease even in countries that do not want to limit output
administratively. The IEA expects the situation to improve from
mid-2020, when demand could start to recover and oil inventories
Chart 3 (BOX) Contributions of sectors to
the expected decline in gross value added in
2020 Q1
In the Czech Republic’s trading partner countries, the
pandemic has hit services hardest
(contributions in percentage points to quarter-on-quarter
decline in gross value added)
-4
-3
-2
-1
0
1
Italy Spain France Germany Slovakia
Agriculture
Industry
Construction
Trade, transport, hotels and restaurants
IT and communication
Financial and insurance services
Real estate services
Professional and scientific services
Public administration, education and healthcare
Other services
Chart II.1.5 Prices of crude oil and other
commodities
The Brent crude oil price dropped in Q1 and is expected
to gradually revert to growth, while natural gas prices in
Europe are expected to continue declining this year
(oil in USD/barrel; other commodities: index [January 2015 =
100]; average price of natural gas in Europe; source:
Bloomberg, World Bank, CNB calculation)
0
20
40
60
80
100
120
140
1/15 1/16 1/17 1/18 1/19 1/20 1/21
Brent crude oil Natural gas
Industrial metals Food commodities
Chart 2 (BOX) Numbers of new cases in the
Czech Republic’s largest trading partner
countries in the euro area
The numbers of new cases have peaked in most
countries, but growth in infections remains high in some
countries
(numbers of new cases per million inhabitants)
Note: The one-off fluctuation to negative values for Spain
reflects a change in the methodology for the time series.
-50
0
50
100
150
200
1/3 8/3 15/3 22/3 29/3 5/4 12/4 19/4 26/4 3/5 10/5
Italy Spain France Germany Slovakia

II. —— The forecast, its changes and risks 11
Czech National Bank ——— Inflation Report ——— II/2020
could decline. In the second half of April, the Brent market curve
was signalling a gradual rise to around USD 39 a barrel at the
close of 2020 and USD 42 a barrel at the end of 2021 (see
Chart II.1.5).
The two non-energy commodity price sub-indices also declined at
the start of 2020 and their outlook is slightly rising (see Chart II.1.5).
The food commodity price sub-index lost 9%, due mainly to prices
of pork and beef, sugar, maize, cocoa, coffee and soy. The price
of wheat was virtually unchanged and the price of rice went up.
Most components of the industrial metals price sub-index fell by
about 15% due to low activity in manufacturing. The price decline
halted in late March as production resumed in China. Rubber and
cotton prices showed a similar pattern (falling by more than 20%).
The decline in industrial producer prices is gradually deepening
and will bottom out in the second half of this year (see Chart II.1.6).
This is due mainly to a negative contribution of the energy
component caused by the collapse of oil prices. Later on, the core
component will also contribute to the overall decline in producer
prices in the effective euro area due to the expected fall in
economic activity. The negative demand pressures will be
augmented by a downturn in investment activity amid substantial
growth in uncertainty. Some time later, the expected decline in
core prices will also reflect the second-round cost effects of the
low price of oil and, to a lesser extent, other inputs, such as
industrial metals. These effects will outweigh the initial negative
supply shock, which will foster price growth due to disruptions to
the supply of industrial products and possible temporary
shortages of those products in the market.6 Overall, producer
prices in the effective euro area will decline by 4% in 2020 as
a whole and rise by 1% in 2021.
Consumer price inflation in the euro area will slow considerably
this year (see Chart II.1.7). Headline inflation stood at only 0.7% in
March. This slowdown was due mainly to a negative contribution
of energy prices. Core inflation also slowed, suggesting persisting
subdued inflation pressures and low inflation expectations. The
forthcoming sharp slowdown in inflation will be due to the above-
mentioned fall in energy prices and negative demand pressures.
Consumer price inflation will thus almost halt at the end of this
year. This year, prices will grow the most in Slovakia, while
declines are forecasted for Italy and Spain. A partial correction of
this year’s fall in consumer demand combined with the fade-out
of the decrease in oil prices will lead to a temporary recovery in
inflation to 2% in the effective euro area in 2021.
—
6 The PMI survey indicates a significant increase in delays in supplier relationships between industrial firms. Unlike in the past, when a deterioration in this sub-index was accompanied by demand-driven price growth, it is now being accompanied by a decline in industrial producer prices. This is because industrial firms are offering discounts to boost their sales and reduce inventories. Discount policies are also being reported by firms in the services sector. On top of that, declining labour costs are fostering lower corporate costs.
Chart II.1.6 Industrial producer prices in the
euro area
The collapse of energy prices and the expected fall in
economic activity will lead to a sizeable decline in
industrial producer prices this year
(annual percentage changes; contributions in percentage
points to growth in the effective euro area; seasonally
adjusted; CNB calculation)
Note: The energy component is determined by
developments in industries strongly linked to the oil price.
The rest of the PPI index in effective terms is the core
component.
-4
-2
0
2
4
6
I/15 I/16 I/17 I/18 I/19 I/20 I/21
Core component Energy component
Effective euro area Euro area
Chart II.1.7 Consumer price inflation outlook
in the euro area
Inflation will slow considerably this year and return to 2%
during 2021
(HICP; annual percentage changes; contributions in
percentage points to growth in the effective euro area;
seasonally adjusted; CNB calculation)
Note: Other comprises 12 other euro area countries. Its
forecasted growth corresponds to the average growth of the
five countries shown in the chart.
-1
0
1
2
3
I/15 I/16 I/17 I/18 I/19 I/20 I/21
Germany Slovakia
France Italy
Spain Other
Effective euro area Euro area

II. —— The forecast, its changes and risks 12
Czech National Bank ——— Inflation Report ——— II/2020
II.1.3 Financial developments abroad
According to the market outlook, the 3M EURIBOR will remain
negative over the entire forecast horizon (see Chart II.1.8).7 The
spread of the coronavirus pandemic beyond China visibly
affected sentiment on financial and commodity markets in March.
Growth in risk aversion led to capital being transferred into safe
assets. Yields on US and German government bonds fell to all -
time lows, while those on riskier government bonds (Italy,
Greece) briefly increased. The ECB responded to the situation in
two steps. At its regular meeting in March, it announced support
measures, including an increase in asset purchases totalling
EUR 120 billion. Following a further deterioration of the economic
and financial situation, it announced a new, EUR 750 billion
Pandemic Emergency Purchase Programme (PEPP) at an
extraordinary meeting.8 The announcement of the programme
was accompanied by an assurance that the ECB would do
everything necessary to support the euro area so that all
economic sectors could absorb the pandemic-related shock. The
market responded with a decline in yields on risky bonds,
especially Italian and Greek ones. Conversely, increases were
recorded for returns on safe assets, including the ten-year
German government bond. Its yield is expected to rise only
gradually from its current negative levels to zero at the end of
2021 (see Chart II.1.9).
The 3M USD LIBOR dropped sharply following radical measures
taken by the Federal Reserve (see Chart II.1.8). At extraordinary
meetings in March and April, the Fed cut the interest rate target
range progressively to zero and announced unlimited asset
purchases under various programmes. It also adjusted the
conditions for short-term funding and supported dollar liquidity
through new or enhanced swap lines and repos. These measures
helped stabilise financial markets, especially segments related to
corporate securities. The current market outlook for the 3M USD
LIBOR is broadly stable at the one-year horizon. The spread vis-
à-vis the euro rate with the same maturity should thus remain
below one percentage point.
According to the April CF outlook, the euro will appreciate slightly
against the dollar (see Chart II.1.10). The euro is also expected to
strengthen in effective terms, mainly due to appreciation against
the Chinese and British currencies. The financial market turmoil
fostered volatility of the USD/EUR currency pair (among others).
Currency markets did not calm until central banks took
coordinated action in March. This intervention helped stabilise
demand for dollar liquidity mainly through swap lines. News from
the USA (a rise in the number of unemployed persons and
complex talks about public support for the US economy) and the
—
7 Given the financial market stress, short-term unsecured EURIBOR rates are increasing while secured segments are remaining stable. The 3M EURIBOR is therefore temporarily proxied in the forecast by the outlook for the EONIA rate with the relevant spread. This forecast takes into account expectations regarding the ECB’s asset purchase programme through expert adjustments using shadow interest rates, which are significantly lower than market rates.
8 Besides the assets previously purchased by the ECB, the list of eligible assets under the PEPP includes non-financial commercial paper and Greek bonds. Standards for collateral in refinancing operations have also been lowered – bond purchases have been extended to include lower-rated bonds (speculative-grade BB+ or higher).
Chart II.1.10 Euro exchange rate
The CF analysts expect the euro to appreciate against
the dollar and other currencies
(USD/EUR; NEER of euro against currencies of euro area
countries’ 18 main partners; 2015 Q1 = 100; right-hand
scale)
92
98
104
110
1,0
1,1
1,2
1,3
I/15 I/16 I/17 I/18 I/19 I/20 I/21
USD/EUR NEER (right-hand scale)
Chart II.1.8 3M EURIBOR and 3M USD LIBOR
The radical monetary policy easing in the USA was
reflected in a decline in the spread between 3M rates in
the USA and the euro area
(percentages; differences in percentage points)
-1
0
1
2
3
4
I/15 I/16 I/17 I/18 I/19 I/20 I/21
Differences 3M EURIBOR 3M USD LIBOR
Chart II.1.9 10Y government bond yields
The spread between ten-year government bond yields in
the USA and Germany narrowed
(percentages; differences in percentage points)
-1
0
1
2
3
4
I/15 I/16 I/17 I/18 I/19 I/20 I/21
Differences Germany United States

II. —— The forecast, its changes and risks 13
Czech National Bank ——— Inflation Report ——— II/2020
peaking of the pandemic in the euro area also contributed to the
subsequent correction. The key factor for the currency pair going
forward will be how the USA and the euro area deal with the
economic impacts of the coronavirus pandemic.

II. —— The forecast, its changes and risks 14
Czech National Bank ——— Inflation Report ——— II/2020
II.2 THE FORECAST
Inflation will fall below the upper boundary of the tolerance band around the 2% target in the coming
months, mainly due to the generally anti-inflationary impacts of the coronavirus pandemic amid a deep
decline in domestic economic activity.9 The latter will drop sharply in 2020 H1 as a result of measures
taken by the government and firms to counter the spread of the virus. Despite stabilising fiscal, monetary
and macroprudential policy measures, the labour market will be visibly affected. It will cool quickly in
the first half of the year and continue to do so in 2021 despite a modest economic recovery. The cooling
of the labour market will significantly dampen wage growth and thus largely also the related recovery in
household consumption growth. Investment activity will also remain weak in the coming quarters, due
in part to worse business sentiment. It will recover only partially next year. Goods and services exports
will also fall very sharply. A pronounced cooling of the overall price pressures will cause inflation to
return close to the 2% target in late 2020/early 2021. This will be also be fostered by a drop in fuel
prices and slower growth in administered prices. After the sharp fall in domestic market interest rates
recorded in March, consistent with the forecast is a further decline in 2020 Q2 followed by broad
stability. The exchange rate of the koruna, which depreciated sharply at the end of Q1 due to the
outbreak of the coronavirus pandemic, will remain close to its current level until the end of 2021.
Direct impacts of the Covid-19 pandemic on the Czech economy
The Czech Republic – like the rest of the world – is facing the
coronavirus pandemic. The government has responded by
introducing measures that have temporarily frozen economic
activity in some sectors. This has been amplified by the
spontaneous decisions of some firms to temporarily suspend
production. This box complements Box 1 on the impacts of the
pandemic in the Czech Republic ’s main trading partner
countries by summarising the measures taken locally and
estimating their direct impact on the domestic economy.
In mid-March, the government declared a state of emergency
and took a number of measures to curb the pandemic. Schools,
restaurants, hotels, service providers and most shops10 were
gradually closed and all mass events cancelled. The national
borders were closed to passenger transport at the same time.
At company level, decisions were made to temporarily suspend
or significantly cut production in the Czech automotive industry
and other industrial sectors. The measures have affected
about 40% of the Czech economy overall and will cause total
economic activity to decline in 2020 Q1 and especially in
2020 Q2. The drop in output will occur mainly in services and
industry. In Q2, however, it will also affect construction,
primarily due to restrictions on the movement of foreign
nationals (see Chart 1).
As regards the expenditure components of GDP, household
consumption, exports and investment will be hit hardest in H1.
Symmetric input-output tables are used to calculate the impact
of the decline in gross value added in the sectors under
—
9 The economic impacts of the global coronavirus pandemic and the quarantine measures subsequently introduced by individual governments make it difficult to produce a forecast for macroeconomic variables based on standard model mechanisms. The current situation has thus made it necessary to make greater use of expert judgements in the forecast, especially this year.
10 Except for food retailers, pharmacies, drugstores and some others.
Chart 1 (BOX) Direct impact of the measures
on gross value added
The measures will have the strongest effect on services,
especially tourism
(index; unrestricted operation = 100)
Note: The return to 100 in 2020 Q3 means a return to
operation unrestricted by the quarantine measures of the
government and firms, not to the pre-coronavirus output
level.
40
60
80
100
IV/19 I/20 II/20 III/20
Cars Trade Transport
Restaurants Tourism Other industry
Construction Other services Real estate

II. —— The forecast, its changes and risks 15
Czech National Bank ——— Inflation Report ——— II/2020
consideration on the expenditure components of GDP. In Q1,
according to the estimate, declines were recorded mainly by
household consumption and exports (see Table 1). This reflects
developments in other services, wholesale and retail trade,
and tourism. In Q2, more capital-intensive sectors (industry
and construction) will be affected to a greater extent as well.
This will lead to a substantial decline in investment. In Q3, the
lifting of the measures of the government and firms will help
revive growth in these expenditure components.
The government is dampening the negative impact on firms and
the labour market using measures to support the economy and
maintain liquidity. The government measures are having major
budgetary impacts. They include an employment protection
programme (Antivirus),11 assistance for the self-employed12
and payment of an attendance allowance13 after schools were
closed. In 2021, legal entities and individuals will be able to
recover this year’s tax loss against taxes paid for 2018 and
2019 (“loss carryback”).14 This is expected to boost private
investment and household consumption. The coronavirus-
related fiscal measures included in the forecast15 amount to
2% of GDP in 2020 and 0.4% of GDP in 2021 (see Table 2). On
top of this, further programmes have been introduced that have
no immediate impact on the budget but do affect the liquidity
situation of firms and the consumption of households, such as
a moratorium on loan payments and guarantees for corporate
loans.16
The current situation will also be reflected in the components of
inflation. On the one hand, food prices will go up, mainly due
to higher transport costs and shortages of seasonal agricultural
workers in Europe. On the other hand, prices of services will
dampen inflation during the spring and summer months. Given
the expected sustained downturn in international tourism, this
will not be fully offset later this year. Lower inflation will also be
fostered by a decline in fuel prices linked with the fall in crude
—
11 This involves a wage subsidy graded according to the reason for introducing Kurzarbeit (such as insufficient demand, input shortages and business closures due to government resolutions).
12 This involves the cancellation of minimum social and health insurance contributions for the self-employed and the payment of a one-off benefit (the 25k Programme).
13 Unlike the other compensation programmes, neither the attendance allowance nor the wage subsidy for quarantined individuals will be included in the average wage statistics, so wage growth will drop significantly and subsequently become volatile next year. This will be amplified by cases where employers reimburse wages only partially.
14 The approval of this measure is uncertain. Although it was announced by the Ministry of Finance in “Liberation Package II”, a draft legal amendment has yet to be submitted at a government meeting.
15 The forecast includes the measures known as of 21 April. However, take-up of some of them is currently rather lower than the government assumed.
16 The indirect support includes government guarantees for preferential loans to firms ranging from several tens to hundreds of billions of koruna (COVID programmes). The potential future payment of these guarantees represents a risk of worse public finance performance than previously expected.
Table 1 (BOX) Direct impacts of the
measures on the components of GDP
The measures taken will substantially dampen economic
activity in 2020 H1
(impacts in percentage points on quarterly GDP growth;
constant prices)
1Q20 2Q20 3Q20
Household consumption -2.8 -4.6 7.8
Gross fixed capital formation -1.4 -4.9 6.9
Exports -1.7 -3.8 6.2
Table 2 (BOX) Fiscal measures to support
the economy and maintain liquidity
The volume of fiscal stabilisation measures will be
exceptionally high this year
(% of nominal GDP)
2020 2021
Extension and increase in attendance allowance 0.3 0.0
Wage subsidies for companies (Kurzarbeit) 0.7 0.0
Cancelling of social and health contributions for self-employed 0.4 0.0
One-off benefit for self-employed (25k Programme) 0.4 0.0
Increase in health care and emergency services expenditure 0.2 0.0
"Loss carryback" – recoverable tax loss 0.0 0.4
Total 2.0 0.4

II. —— The forecast, its changes and risks 16
Czech National Bank ——— Inflation Report ——— II/2020
oil prices, which to some extent also reflects the global
economic contraction caused by the coronavirus pandemic.
The Czech government started to ease some of its quarantine
measures in April. Selected shops were gradually reopened.
Based on the epidemiological situation, most of the original
measures were expected to be relaxed in five stages by
8 June17 (the restrictions relating to the cross-border
movement of persons, schools and mass cultural, sports and
social events are likely to stay in place longer). This will lead
to a gradual recovery of the Czech economy in 2020 H2. The
forecast assumes that the government restrictions will have
been fully lifted by Q3, with the exception of tourism-related
sectors, which will be affected for longer.
The coronavirus pandemic will also have an indirect effect on
economic activity. Despite the government support measures,
the labour market situation will worsen quite considerably, due
largely to adverse developments abroad. The general
unemployment rate will rise significantly and the previously
very tight labour market will cool down. Both business and
consumer sentiment will meanwhile deteriorate considerably.
II.2.1 Inflation and monetary policy
Headline inflation will fall below the upper boundary of the
tolerance band in Q2 and return close to the target in 2021 (see
Chart II.2.1). Inflation will slow in the remainder of this year. This
will be due to all its components except food prices, whose growth
will temporarily rise in Q2. In addition to a marked cooling of
domestic price pressures, the weakening core inflation will be due
to households’ concerns about the coronavirus pandemic, which
will be reflected mainly in tourism-related prices. The previously
buoyant growth in administered prices will also weaken as the
high growth in energy prices subsides. Fuel prices, which fell in
April, will stay at low levels for the rest of the year (see Chart II.2.2).
Food price inflation will slow at the end of this year. Inflation will
thus temporarily drop slightly below 2% at the start of 2021,
despite an easing of the monetary conditions in both the
exchange rate and interest rate components. It will then increase
slightly. Monetary policy-relevant inflation18 will be below
headline inflation over the entire forecast horizon, as the first-
round effects of changes to indirect taxes19 will be slightly
positive.
Core inflation will slow considerably on account of declining
domestic price pressures. It will near 2% in Q2 (see Chart II.2.3). In
addition to the expected price decline in services (especially
tourism), this will be due to the gradually worsening labour market
—
17 According to the updated version of the government's plan for the gradual easing of quarantine measures from the end of April, most restrictions should be lifted as early as 25 May.
18 Monetary policy-relevant inflation is inflation adjusted for the first-round effects of changes to indirect taxes. The difference between headline and monetary policy-relevant inflation is equal to the size of the first-round tax effect.
19 The effect of changes to indirect taxes in 2020 on the inflation forecast was described in detail in a box in IR III/2019.
Table II.2.1 Forecasts of selected variables
GDP will fall sharply this year and return to growth in
2021
(annual percentage changes unless otherwise indicated)
2019 2020 2021
actual forecast forecast
Headline inflation 2.8 2.8 2.1
GDP 2.5 -8.0 4.0
Average nominal wage 7.1 2.5 5.8
Exchange rate (CZK/EUR) 25.7 26.9 27.5
3M PRIBOR (in %) 2.1 0.9 0.6
Chart II.2.1 Headline inflation and monetary
policy-relevant inflation
Headline inflation will fall quickly and will be close to the
2% target at the monetary policy horizon
(annual percentage changes)
I/15 I/16 I/17 I/18 I/19 I/20 I/21
-1
0
1
2
3
4
5
Headline inflation Monetary policy-relevant inflation
2% inflation target
Monetary policy
horizon
Chart II.2.2 Structure of inflation and the
inflation forecast
Inflation will slow this year mainly due to a decline in
core inflation and a fall in fuel prices
(annual percentage changes; contributions in percentage
points)
Note: Food prices also include prices of alcoholic beverages
and tobacco. The contribution of the first-round effects of
changes to indirect taxes relates to non-administered prices.
-1
0
1
2
3
4
I/15 I/16 I/17 I/18 I/19 I/20 I/21
Core inflation Food prices
Administered prices Fuel prices
Indirect taxes Headline inflation

II. —— The forecast, its changes and risks 17
Czech National Bank ——— Inflation Report ——— II/2020
situation. Although positive second-round effects of the lower
VAT on some services (e.g. restaurants and hairdressing) will
affect core inflation from May 2020 onwards, with substantial
depreciation of the koruna also acting in the same direction, they
will only partly offset the downward pressure on core inflation.
Core inflation will thus be fluctuating around 1.5% from 2020 H2.
As economic activity gradually recovers and price pressures re-
emerge, core inflation will pick up to 2% in 2021 Q2 and remain
close to this level until the end of 2021.
Food price inflation will reflect supply-side constraints and strong
demand in the near future and not decrease until late 2020 and
early 2021. The almost 6% growth in prices will be due to high
demand for food, labour shortages in agriculture in Europe and
international transport restrictions due to the coronavirus
pandemic. Cold weather (morning frost) in early spring is another
factor that will lead to growth in prices, especially those of fruit.
Growth in food prices will also be fostered in the second half of
the year by renewed growth in agricultural producer prices. These
factors will fade out next year and food price inflation will drop
significantly (see Chart II.2.3).
Domestic fuel prices will fall significantly due to the collapse of
global oil prices. This year’s global oil price developments have
pushed fuel prices into a sharp year-on-year decline. That decline
will be deepest in Q2 (see Chart II.2.3) but will stay in double figures
for the rest of the year, despite considerable depreciation of the
koruna against both the euro and the dollar. Fuel prices will start
growing again in year-on-year terms in 2021.
The recent high growth in administered prices will slow further this
year. This will be due mainly to a gradual decline in the currently
high growth in electricity prices and a decrease in heat prices.
Next year, they will be joined by a fall in gas prices for
households, reflecting an observed drop in the exchange price.
Overall, administered price inflation will thus decrease to 1.5% in
early 2021 and stay there throughout 2021 (see Table 2.2).
Over the entire forecast horizon, the exchange rate will remain
close to the current level to which it weakened after the pandemic
broke out (see Chart II.2.4). The exchange rate forecast for
2020 Q2 is set at CZK 27.2 to the euro and thus reflects the sharp
weakening of the koruna at the end of Q1 caused by the outbreak
of the coronavirus pandemic. The exchange rate will remain close
to its current level over the entire forecast horizon due to the
worse foreign and domestic economic outlook and narrower
interest rate differential.
Consistent with the forecast is a further decline in domestic market
interest rates in Q2 (see Chart II.2.5). This decline in rates is
a continuation of the sharp drop recorded in March and reflects
the effects of government quarantine measures in the domestic
economy as well as the significantly worse external outlook.
These factors will lead to a significant cooling of the labour market
and worsening sentiment among households and firms. This will
have significant anti-inflationary consequences. However, the
decline in rates will be slowed by the recent sharp weakening of
the koruna, which is contributing to an easing of the overall
monetary conditions. Rates will then remain broadly stable over
the rest of the forecast horizon.
Table II.2.2 Forecast of administrative
effects
Administered price inflation will slow and continue to be
driven mainly by electricity prices
(annual average percentage changes; contributions to
headline inflation in percentage points)
a) including effects of indirect tax changes
ADMINISTERED PRICESa)
4.4 0.69 3.2 0.47 1.5 0.21
of which (main changes):
electricity 10.6 0.45 7.8 0.30 2.0 0.08
natural gas 3.3 0.08 0.6 0.01 -2.3 -0.05
heat 4.6 0.08 -1.4 -0.02 2.4 0.04
water 2.6 0.02 2.6 0.02 1.7 0.01
health care 2.3 0.03 2.2 0.03 2.8 0.04
transport -5.0 -0.08 1.7 0.02 2.0 0.03
actual forecastforecast
202120202019
Chart II.2.4 Exchange rate forecast
The exchange rate of the koruna will remain close to its
current weakened level due to unfavourable economic
developments
(CZK/EUR and CZK/USD)
20
22
24
26
28
I/15 I/16 I/17 I/18 I/19 I/20 I/21
CZK/EUR exchange rate CZK/USD exchange rate
Chart II.2.3 Components of inflation
The already strong growth in food prices will briefly
increase further, while core inflation will decrease and
fuel prices will continue to decline sharply for the rest of
this year
(annual percentage changes)
-18
-12
-6
0
6
12
18
-6
-4
-2
0
2
4
6
I/15 I/16 I/17 I/18 I/19 I/20 I/21
Core inflation
Food prices
Fuel prices (right-hand scale)

II. —— The forecast, its changes and risks 18
Czech National Bank ——— Inflation Report ——— II/2020
The new forecast contains a dramatically lower path of domestic
interest rates due to the economic impacts of the pandemic (see
Chart II.2.6). The contribution of the worse external demand
outlook is the dominant factor fostering lower market interest
rates than in the previous forecast. Reduced outlooks for foreign
producer prices, oil prices and foreign shadow interest rates also
shift the domestic interest rate path downwards. The contribution
of the short-term inflation outlook fosters slightly lower interest
rates, too. The effect of the sharp reduction in interest rates at
the end of Q1, which is captured in the interest rate rule as
a short-term monetary policy shock, also contributes in the same
direction this year, as the significant decline in rates in the second
half of March naturally had only a limited effect on their average
level in Q1. Expert adjustments act overall towards higher rates
this year, mainly due to a significant decrease in labour efficiency
during the quarantine restrictions. The expert adjustments also
take into consideration the anti-inflationary effects of the sharp
contraction of the Czech economy and the cooling of the labour
market this year due to the coronavirus pandemic. These effects
will recede only slowly, still fostering lower domestic interest rates
in 2021.
II.2.2 Costs and the labour market
Growth in costs will initially surge temporarily on the back of
a weaker exchange rate, but will later slow sharply due to subdued
domestic inflationary pressures (see Chart II.2.7). At the start of this
year, growth in total costs in the consumer sector decreased
further as the decline in energy import prices deepened and
growth in domestic costs slowed. In 2020 Q2, however, growth in
total costs will surge temporarily on the back of a noticeable
weakening of the koruna. This will be reflected in a significantly
positive contribution of core import prices and will also partly
offset the decline in oil prices within energy import prices.
Conversely, domestic inflationary pressures will ease
significantly over the course of this year. This, together with
a stable exchange rate, will lead to a sharp slowdown in total cost
growth in Q3. The resumption of GDP growth in the second half
of this year will manifest itself in a recovering contribution of the
domestic economy. Growth in total costs will thus gradually
accelerate to close to its steady-state level, where it will remain
next year. The contribution of price convergence will be
constantly positive over the entire forecast horizon.
Growth in domestic costs will initially almost come to a halt due to
the freeze of the economy, and then gradually return to its steady-
state level (see Chart II.2.8). Growth in domestic nominal marginal
costs in the intermediate goods sector slowed in the first quarter
of this year as a result of government quarantine measures
leading to a freeze of economic activity in many sectors. This was
manifested via a fall in domestic demand in a decline in the
contribution of the price of capital deep into negative territory. At
the same time, it was only partially offset by continued wage
growth and a significant decline in labour efficiency linked with
the limited usability of employees in workplaces affected by
quarantine measures. The effect of government restrictions
dampening economic activity on the one hand and reducing
labour efficiency on the other will be even more pronounced in
Q2. However, these conflicting effects in terms of cost growth will
Chart II.2.5 Interest rate forecast
After the sharp fall in domestic market interest rates
recorded in March, consistent with the forecast is
a further decline in 2020 Q2 followed by broad stability
(percentages)
-1.0
-0.5
0.0
0.5
1.0
1.5
2.0
2.5
I/15 I/16 I/17 I/18 I/19 I/20 I/21
3M PRIBOR 3M EURIBOR
Chart II.2.6 Decomposition of changes in the
interest rate forecast
Compared to the previous forecast, the worse external
outlook is the dominant factor fostering significantly
lower rates
(3M PRIBOR; percentage points)
-3.5
-3.0
-2.5
-2.0
-1.5
-1.0
-0.5
0.0
0.5
1.0
1.5
2.0
II/20 III/20 IV/20 I/21 II/21 III/21 IV/21
Initial state Foreign environment
Administered prices Government consumption
Short-term exch. rate forecast Short-term inflation forecast
Expert adjustments Short-term MP shock
Difference
Chart II.2.7 Costs in the consumer sector
Growth in costs will initially surge on the back of
a temporary increase in the contribution of core import
prices, but will later slow sharply due to subdued
domestic inflation pressures
(nominal quarterly percentage changes; contributions in
percentage points; annualised)
-3
-2
-1
0
1
2
3
4
5
I/15 I/16 I/17 I/18 I/19 I/20 I/21
Intermediate goods prices Price convergence
Core import prices Energy import prices
Total

II. —— The forecast, its changes and risks 19
Czech National Bank ——— Inflation Report ——— II/2020
continue to roughly offset each other. The rapid cooling on the
labour market will be reflected in a decrease in the contribution
of wages. As a result, growth in domestic costs will almost come
to a halt in Q2. It will recover in the second half of this year, when
the previous effects will fade due to the economic recovery. The
re-emergent growth in the price of capital and wages will
meanwhile be offset by renewed growth in labour efficiency.
Growth in domestic costs will thus gradually return to its steady-
state level, where it will remain in 2021.
Employment will decline appreciably almost until the end of
next year owing to the fall in economic activity (see Chart II.2.9).
This will primarily be the result of a significant decline in economic
activity amid a downturn in domestic and external demand this
year. Next year, as economic growth resumes, demand for labour
will stop declining further. This will cause growth in employment
to turn slightly positive again at the close of the year. The number
of employees converted into full-time equivalents will fall more
significantly than the physical number of employees this year, due
to a reduction in average hours worked. From a sectoral point of
view, industry and market services will contribute roughly equally
to the decline in the converted number of employees.
The unemployment rate will increase rapidly, peaking at the start
of next year (see Chart II.2.9). Despite the government’s
employment protection measures, the general unemployment
rate will rise rapidly to about 5% due to the sharp economic
downturn. This will be reflected mainly in a significant increase in
the number of unemployed, accompanied by a slight reduction in
the workforce. More marked growth in unemployment will be
prevented by lay-offs of foreign workers and a high initial number
of vacancies. In 2021 H2, conversely, a recovery in demand for
work will be reflected in a slight decrease in the number of
unemployed. The share of unemployed persons will follow
a similar path as the general unemployment rate. The economic
downturn is reflected over the forecast horizon in a marked
increase in the number of registered job applicants amid
a continued slight decline in the population aged 15–64.
Wage growth will slow significantly this year owing to the rapid
cooling of the labour market and government quarantine
measures, and will then recover (see Chart II.2.10). The average
wage in market sectors will decrease in Q2. This will be due
mainly to the statistical effect of a short-term drop in the wages
of employees drawing attendance allowance or wage
compensation in the event of quarantine. A drop in wages can be
expected for employees not working as a result of obstacles to
work on the employer’s part connected with the pandemic and the
government measures to counter it. Some of these employees
are receiving only partial wage compensation.20 This statistical
effect is clear from Chart II.2.11, which shows the average wage in
absolute terms. Conversely, the further increase in the minimum
—
20 Methodologically, the attendance allowance and compensation for mandatory quarantine are not components of wages, so drawdown of these benefits reduces the average wage, similar to the payment of only partial wage compensation to employees by firms impacted by the coronavirus. This effect will be most noticeable in 2020 Q2. Firms are partially reimbursed for the provision of wage compensation under the Antivirus programme.
Chart II.2.9 Labour market forecast
Total employment will noticeably decrease, while the
unemployment rate will increase markedly
(annual percentage changes in employment; general
unemployment rate in percentages; seasonally adjusted)
0
1
2
3
4
5
6
-3
-2
-1
0
1
2
3
I/15 I/16 I/17 I/18 I/19 I/20 I/21
Employment General unemployment rate (right-hand scale)
Chart II.2.10 Average nominal wages
Wage growth will slow significantly in both market and
non-market sectors, but will be highly volatile over the
entire forecast horizon
(annual percentage changes; total wages – source: CZSO;
wages in market and non-market sectors – source: CNB
calculation)
-4
-2
0
2
4
6
8
10
12
14
I/15 I/16 I/17 I/18 I/19 I/20 I/21
Nominal wages, total
Nominal wages in market sectors
Nominal wages in non-market sectors
Chart II.2.8 Costs in the intermediate goods
sector
The economic freeze will be reflected – via a decline in
the contribution of the price of capital and a decrease in
the contribution of wages – in a temporary halt in growth
of domestic costs, which will be partially offset by the
related fall in labour efficiency
(nominal quarterly percentage changes; contributions in
percentage points; annualised)
-10
-5
0
5
10
I/15 I/16 I/17 I/18 I/19 I/20 I/21
Labour efficiency Wages in market sectors
Price of capital Total

II. —— The forecast, its changes and risks 20
Czech National Bank ——— Inflation Report ——— II/2020
wage introduced at the start of this year21 and the compositional
effect22 connected with the marked rise in unemployment will act
in the opposite direction. Growth of the average wage in market
sectors will thus slow below 2% for the whole of this year due to
the above combination of factors and the cooled labour market.
Wage growth will then pick up again next year. The effect of this
year’s low comparison base (resulting from the above-mentioned
drop in incomes captured in the wage statistics) will also
contribute to this. Wage growth in non-market sectors will remain
high this year, reflecting both a significant increase in the salaries
of teaching and non-teaching staff in the education system, and
a fixed salary increase for other employees of institutions
financed directly from the state budget.23 As in the case of market
wages, the above statistical effect will cause wage growth in non-
market sectors to fluctuate, but to a lesser extent.
II.2.3 Economic activity
The Czech economy will fall into a deep decline this year as result
of the coronavirus pandemic (see Chart II.2.12). GDP will fall by 8%
this year. A large part of the economy has been “switched off”
since the end of Q1 due to government quarantine measures,
production shutdowns in some companies and a drop in external
demand. All expenditure components except government
consumption will contribute to a significant drop in GDP in the first
half of this year. After the expected easing of government
restrictions in the domestic economy during the spring, the
decline in economic activity will begin to moderate in the second
half of the year, partly due to a recovery in external demand.
The output gap will open into significantly negative values in the
first half of this year, and potential output will also decrease
temporarily. The fall in economic activity in the first half of this
year will lead to a modest decline in potential output. In addition
to the longer-term impacts of the pandemic on some sectors
(such as international tourism), this will reflect a decline in
corporate investment due to deteriorating sentiment. At the same
time, the output gap will open into significantly negative values
(see Chart II.2.13). Economic activity will begin to recover in the
second half of the year. This will lead to renewed growth of
potential output and simultaneously to a gradual closing of the
negative output gap. However, the gap will not have closed
entirely even by the end of 2021.
The depth of the economic contraction will meanwhile depend on
how long the quarantine measures remain in place. As the level
charts in Block 1 show, economic activity will start to increase
again in the middle of this year. This will initially primarily reflect
the easing of the restrictive government measures. However,
overall economic activity will not have reached the end-2019 level
even by the end of the forecast horizon. This will be prevented
mainly by a drop in fixed private investment, as the resumption of
—
21 The minimum wage was increased by CZK 1,250 to CZK 14,600 in January 2020.
22 The statistical distortion of the average wage due to the dismissal of low-income employees.
23 In connection with the pandemic, the forecast also assumes a temporary increase in compensation for front-line employees (staff of public hospitals and the emergency services).
Chart II.2.11 Average nominal wages in
market sectors
The average wage will be affected this year by a drop in
wages linked with the pandemic and statistical effects
(CZK billions; in market sectors; seasonally adjusted)
26000
28000
30000
32000
34000
36000
38000
I/15 I/16 I/17 I/18 I/19 I/20 I/21
Chart II.2.12 Annual GDP growth structure
Only government consumption will make a positive
contribution to GDP growth in 2020; the other
components will resume positive contributions next year
(annual percentage changes; contributions in percentage
points; seasonally adjusted)
-16
-12
-8
-4
0
4
8
12
I/15 I/16 I/17 I/18 I/19 I/20 I/21
Household consumption Net exports
Gross fix. capital formation Government consumption
Change in inventories Gross domestic product
Chart II.2.13 Output gap as measured by the
small structural model
The output gap will remain negative over the entire
forecast horizon
(% of potential output)
-10
-8
-6
-4
-2
0
2
I/10 I/11 I/12 I/13 I/14 I/15 I/16 I/17 I/18 I/19 I/20 I/21

II. —— The forecast, its changes and risks 21
Czech National Bank ——— Inflation Report ——— II/2020
its growth will be hindered by dramatically worsening corporate
sentiment. Household consumption will also be below the pre-
pandemic level at the end of the forecast horizon, albeit just
barely. This will be due to the closure of many businesses,
especially in the services sector, and a decline in wage growth.
Exports of goods and services will be strongly affected by the
drop in external demand and the restrictions on the international
movement of persons.
Household consumption will slow this year as a result of the
government measures and the subsequent abrupt cooling of the
labour market. The income situation of households will worsen.
The previously robust growth in nominal gross disposable income
will come to a halt, mainly reflecting a drop in entrepreneurs’
income and in wages and salaries (see Chart II.2.14). Many firms
and households have already run into liquidity problems. For this
reason, increased social allowances will act in the opposite
direction. In addition, private consumption expenditure will be
supported by other (previously approved as well as completely
new) government measures.24 After the impact of the quarantine
measures subsides and services get up and running, the decline
in household consumption will begin to moderate. Next year,
consumption will grow at a rate of more than 4% overall (see
—
24 These include the increase in parental allowance and the higher-than-usual increase in old-age pensions approved last year and the newly adopted extended attendance allowance, moratorium on loan repayments, cancellation of health and social security contributions for the self -employed and (as yet uncertain) tax loss carryback.
Gross capital formation
(CZK billions; constant prices; seasonally adjusted)
Household consumption
(CZK billions; constant prices; seasonally adjusted)
GDP
(CZK billions; constant prices; seasonally adjusted)
Exports of goods and services
(CZK billions; constant prices; seasonally adjusted)
Block 1: Selected indicators in levels
Chart II.2.14 Nominal disposable income
Disposable income will return to positive growth next
year, when this year’s drop in wages and salaries and
entrepreneurs’ income will fade out
(annual percentage changes; contributions in percentage
points)
Note: Entrepreneurs’ income comprises gross operating
surplus and mixed income.
-12-10-8-6-4-202468
101214
I/15 I/16 I/17 I/18 I/19 I/20 I/21
Wages and salaries Entrepreneurs' income
Property income Social benefits
Taxes and social contrib. Other current transfers
Gross disposable income Individual consumption

II. —— The forecast, its changes and risks 22
Czech National Bank ——— Inflation Report ——— II/2020
Chart II.2.15). After a temporary rise this year reflecting cautious
behaviour and sharply deteriorating sentiment of households, the
saving rate will return to a similar level as at the start of the year.
Government consumption will be the only component of demand
to maintain a positive contribution to GDP growth this year. Its real
growth will rise to 4% on average this year (see Chart II.2.15). In
nominal terms, government consumption will be affected mainly
by increased spending on health care, including wages of
employees in this sector. Growth in the government consumption
deflator will nevertheless slow. This will be due to a drop in the
salaries of some government employees drawing attendance
allowance due to school closures. Real government consumption
will fall to 2% in 2021.
The effects of the coronavirus pandemic and the sharp
deterioration in corporate sentiment will be adversely reflected in
private investment activity. The decline in private sector
investment this year will be caused by the domestic quarantine
measures and the production stoppages in some firms. The deep
decline in external demand associated with the global spread of
the coronavirus pandemic and the significant deterioration in
global economic sentiment will have the same effect. In contrast
to the two preceding factors, this one will persist longer.
Government investment will conversely maintain modest growth,
which will continue to be supported by drawdown of EU funds.
Next year, private investment will benefit from renewed economic
growth abroad and will also be supported by the previous easing
of domestic monetary conditions. Tax loss carryback will also
have a favourable, though limited, effect.25 The year-on-year fall
in overall gross capital formation will reach more than 11% this
year (see Chart II.2.16). In 2021, gross capital formation growth will
be positive, with a dominant contribution from private investment.
Exports of goods and services will drop sharply as a result of the
freeze in external demand. The fall in exports to the 2010 level will
not be significantly affected even by the improvement in domestic
exporters’ price competitiveness resulting from the depreciation
of the koruna. Following the expected fading of the coronavirus
pandemic in both the domestic and foreign economies, the
dynamics of exports will begin to recover in the second half of this
year (see Chart II.2.17). Next year, they will strengthen further and
then return to growth in line with external demand. However, the
drop in tourism income (under exports of services) will be more
protracted.
Import growth will decrease significantly this year due to the drop
in domestic demand and exports. The expected unfavourable
trend in exports and investment by Czech firms will lead to
a decrease in imports of almost 20% due to their high import
intensity (see Chart II.2.17). External and domestic demand will
return to positive growth next year. This will lead to a recovery in
import growth.
The contribution of net exports to GDP growth will be negative this
year. Both sides of foreign trade will fall sharply, while the decline
in exports will be deeper than that in imports. In 2021, their
—
25 If approved.
Chart II.2.16 Investment decomposition
The deep decline in gross capital formation will fade
away in 2021, with a renewed positive contribution of
private investment
(annual percentage changes; contributions in percentage
points; constant prices; seasonally adjusted)
-20
-15
-10
-5
0
5
10
15
20
I/15 I/16 I/17 I/18 I/19 I/20 I/21
Private investment Public investment
Change in inventories Gross capital formation
Chart II.2.17 Real exports and imports
The current strongly negative pace of growth in both
exports and imports will not turn positive until next year
(year-on-year changes in per cent and CZK billions;
seasonally adjusted)
-80
-60
-40
-20
0
20
40
60
80
-40
-30
-20
-10
0
10
20
30
40
I/15 I/16 I/17 I/18 I/19 I/20 I/21
Real net exports (change in CZK bn; right-hand scale)
Real exports
Real imports
Chart II.2.15 Real household and
government consumption
Growth in government consumption will remain positive,
while household consumption will drop sharply this year
(annual percentage changes; seasonally adjusted)
-10
-8
-6
-4
-2
0
2
4
6
8
10
I/15 I/16 I/17 I/18 I/19 I/20 I/21
Household consumption Government consumption

II. —— The forecast, its changes and risks 23
Czech National Bank ——— Inflation Report ——— II/2020
dynamics will converge and the contribution of net exports to
GDP growth will thus be roughly neutral.
II.2.4 The balance of payments
Compared with 2019, the current account deficit will increase
slightly this year, with significantly lower turnovers in almost all
sub-items. The deficit-to-GDP ratio will reach -0.6% (see
Chart II.2.18). The drop in external demand will impact the Czech
export-oriented economy very strongly. Exports of goods will
decrease by around 25% and exports of services (especially in
the tourism sector) by more than 30%. The current account deficit
(see Table II.2.3) will widen only slightly, because, just like external
demand, domestic demand and associated imports of goods and
services will go down. Furthermore, commodity prices on world
markets (oil and gas in particular) have decreased dramatically.
The mild winter moreover reduced the need to import natural gas.
A decline in the primary income deficit, where the direct
investment earnings deficit will fall sharply, will also help keep the
current account deficit only slightly below last year’s level. The
secondary income deficit will also narrow, as the European
Commission has made it easier to draw down unused EU funds
in the current programming period.
In 2021, the current account deficit will decrease (to 0.2% of GDP),
mainly due to a marked improvement in the goods and services
balance. This will be due above all to renewed growth in external
demand. A widening of the primary income deficit, associated
primarily with the high share of non-residents in key sectors of
the economy and growth in their earnings, will act in the opposite
direction, but to a much lesser extent. The one-off effect of
accelerated drawdown of unused European funds will fade.
The capital account surplus will increase sharply this year and
drop next year. This will be linked primarily with the above-
mentioned accelerated drawdown of unused European funds.
This year, the increase in the capital account surplus will also be
affected by a decline in net payments for emission permits
(a sharp fall in prices and lower emissions).
The financial account (excluding banking sector operations) will
be balanced in 2020. The net outflow of capital under other
investment and reserve assets will be roughly equal to the net
inflow of direct and portfolio investment. The overall direct
investment balance (see Chart II.2.19) will decrease only slightly
compared with 2019, but both the inflow and the outflow will
decrease in terms of both new capital and reinvestment. As for
portfolio investment (see Chart II.2.20), the forecast expects
a slight year-on-year increase in the net inflow. Unlike last year,
however, the dominant factor underpinning the inflow will be
a rapidly growing volume of foreign government funding rather
than a highly positive interest rate differential. The net outflow of
capital under other investment excluding banking sector
operations will be associated mainly with a reversal of the flow of
investment in the business sector (a sharp increase in claims
abroad under trade credits). The increase in reserve assets will
be slightly smaller than in 2019 (despite a significant increase in
the balance vis-à-vis the EU) due to a sharp decline in the return
on the CNB’s foreign exchange reserves.
Table II.2.3 Balance of payments forecast
The forecast expects a slightly wider current account
deficit this year compared with 2019
(CZK billions)
a) forecast excluding operations of banking sector and
financial derivatives
2019 2020 2021prelim.
outcome forecast forecast
A. CURRENT ACCOUNT -21.2 -35.0 -10.0
Goods 239.8 130.0 170.0
Services 103.7 65.0 85.0
Primary income -324.1 -215.0 -230.0
Secondary income -40.6 -15.0 -35.0
B. CAPITAL ACCOUNT 14.1 55.0 35.0
C. FINANCIAL ACCOUNTa)
32.8 0.0 0.0
Direct investment -61.0 -50.0 -70.0
Portfolio investment -117.6 -140.0 -70.0
Financial derivatives 1.0 - -
Other investment 102.1 95.0 60.0
Reserve assets 108.3 95.0 80.0
Chart II.2.19 Direct investment structure
The net inflow of direct investment into the Czech
Republic will decrease only slightly compared with 2019
(CZK billions)
Note: The figures for 2019 are preliminary.
0
50
100
150
200
250
300
2015 2016 2017 2018 2019 2020 2021
Direct investment in CZ Direct investment abroad
Chart II.2.18 Ratios of the balance of
payments accounts to GDP
The current account will run a slight deficit in relation to
GDP in both forecast years
(percentages)
Note: The figures for 2019 are preliminary.
-1.0
-0.5
0.0
0.5
1.0
1.5
2.0
2.5
3.0
2015 2016 2017 2018 2019 2020 2021
Current account/GDP
Current and capital account/GDP

II. —— The forecast, its changes and risks 24
Czech National Bank ——— Inflation Report ——— II/2020
The forecast sees the financial account being balanced in 2021 as
well. An increase in the overall net inflow and relatively strong
growth in turnover is expected for direct investment. On both the
inflow and outflow side, the amount of acquisitions will rise,
especially in sectors hit by the coronavirus pandemic.
A disinvestment by ČEZ, which was originally planned for an
earlier date but will be postponed until next year due to the
pandemic, will also foster an increase in the net capital inflow.
Under portfolio investment, by contrast, the capital inflow will slow
substantially. This will be due mainly to lower supply of
government bonds and, to a lesser extent, to the expected end of
sales of foreign assets by residents, as investment in foreign
shares will become more attractive to residents owing to their low
prices. As regards other investment (excluding banking sector
operations), the outflow of capital will decrease significantly. This
will be due mainly to a decrease in trade credits provided by
Czech exporters to foreign partners owing to an improvement in
the economic situation and payment discipline in Europe. Growth
in reserve assets will slow further (owing to a decline in the
surplus on operations vis-à-vis the EU).
Despite an initial deep decline in exports, the Czech economy will
not need foreign financing. According to the forecast, the
government’s rising foreign debt will be fully eliminated by an
increase in the creditor position of the CNB and other sectors.
After the financial market situation calms, the favourable
macroeconomic characteristics of the Czech Republic and its
external balance should make koruna assets an attractive
investment in Europe, despite a decrease in the CNB’s monetary
policy rates. Given the high volume of short-term foreign capital
in the Czech Republic, its movements may be a significant factor
affecting the exchange rate.
II.2.5 Fiscal developments
The general government sector will run large deficits due to the
current pandemic and fiscal stabilisation measures. The forecast
expects a deficit of 4.8% of GDP this year. This will be due to
a marked drop in tax revenues owing to the temporary shutdown
of economic activity in some sectors and the fiscal measures
adopted to support the economy in this situation. Once most of
the support measures have been phased out, the deficit will fall
to 3.4% of GDP next year (see Table II.2.4).
The fiscal stabilisation measures will amount to 2% of GDP this
year and 0.4% of GDP next year. The employment support
programme (Antivirus), the support for the self-employed26 and
the payment of increased attendance allowance while schools
are closed will have the biggest fiscal impacts this year.
Government consumption will reflect a rise in expenditure on
materials in the health and emergency services and temporarily
higher compensation of front-line state employees. In 2021, legal
entities and individuals will be able to recover this year’s tax loss
against taxes paid for 2018 and 2019 (“loss carryback”).27 On top
—
26 This involves the half-year cancellation of minimum social and health insurance contributions for the self-employed and the payment of a one-off benefit (the 25k Programme).
27 The approval of this measure is uncertain. Although it was announced by the Czech Ministry of Finance in “Liberation Package II”, a draft legal amendment has yet to be submitted at a government meeting.
Chart II.2.20 Portfolio investment structure
The net inflow of portfolio investment in 2020 will be
driven by foreign investment in the rapidly rising
government debt
(CZK billions)
Note: The figures for 2019 are expected outcomes.
-50
0
50
100
150
200
250
300
350
2015 2016 2017 2018 2019 2020 2021
Assets: debt securities
Assets: participations and interests in investment funds
Liabilities: debt securities
Liabilities: participations and interests in investment funds
Table II.2.4 Fiscal forecast
The general government sector will run large deficits
over the forecast horizon
(% of nominal GDP unless otherwise indicated)
a) government budget balance minus interest payments
b) This item consists of expected revenue from primary
sales of emission permits, expenditure on the (New) Green
Savings Programme, guarantees and revenue from the sale
of frequency bands to mobile operators.
c) adjusted for one-off measures; CNB estimate
d) CNB estimate; the disaggregated method is based on the
evolution of the individual tax bases in the business cycle;
the aggregated method defines the position of the cycle on
the basis of the output gap only.
e) year-on-year change in structural balance
2019 2020 2021
actual forecast forecast
Government revenue 42.1 43.3 43.3
Government expenditure 41.9 48.1 46.7
of which: interest payments 0.7 0.8 0.8
GOVERNMENT BUDGET BALANCE (CZK in bn) 15.4 -258.9 -198.4
GOVERNMENT BUDGET BALANCE 0.3 -4.8 -3.4
of which:
primary balancea)
1.0 -4.0 -2.7
one-off measuresb)
0.2 0.2 0.2
ADJUSTED BUDGET BALANCEc)
0.0 -5.0 -3.6
Cyclical component (disaggregated method)d)
1.4 -1.0 -0.6
Structural balance (disaggregated method)d)
-1.3 -4.0 -3.0
Fiscal stance in pp (disaggregated method)e)
-0.8 -2.7 1.0
Cyclical component (aggregated method)d)
0.3 -1.5 -0.6
Structural balance (aggregated method)d)
-0.3 -3.5 -3.0
Fiscal stance in pp (aggregated method)e)
-0.7 -3.2 0.5
GOVERNMENT DEBT (CZK in bn) 1738.7 2031.8 2236.8
GOVERNMENT DEBT 30.8 37.6 38.6

II. —— The forecast, its changes and risks 25
Czech National Bank ——— Inflation Report ——— II/2020
of the above-mentioned support measures, the previously
approved higher-than-usual increase in pensions,28 increase in
parental allowance29 and increase in salaries of teachers in the
education system will manifest themselves this year. As of this
year, general government revenues have been influenced by an
increase in excise duty on cigarettes and alcohol, restrictions on
the exemption for winnings in games of chance from income tax,
an increase in tax rates on lotteries and gambling,30 a change in
the method of creation and tax deductibility of technical reserves
of insurance companies and, as from 1 August 2020, by the
launch of the third and fourth phases of ESR (delayed by three
months compared with the original schedule).31 A further hike in
excise duty on cigarettes is expected in January 2021.
Fiscal stabilisation policy is being implemented through
substantial support for household consumption this year (see
Table II.2.5). This year, the positive fiscal impulse is largely a result
of the extraordinary measures taken to support the economy due
to the pandemic.32 As most of the support measures will be
temporary, the forecast expects the fiscal impulse to be negative
in 2021. Only tax loss carryback, which will reduce the negative
contribution of fiscal policy to economic growth, will have
a supportive effect next year.
The general government sector will also run a deep deficit in
structural terms and the government debt will rise substantially.
The general government structural deficit will markedly exceed
the medium-term objective – a structural deficit of 0.75% of GDP
from 2020 – this year. However, due to the ongoing coronavirus
pandemic, this situation will be evaluated as justified. A change
to the Budget Responsibility Act has been approved for next year
allowing a structural deficit of up to 4% of GDP. Consolidation of
public finances should subsequently start under a European
Council regulation.33 Government debt will grow to 38.6% of GDP
by the end of 2021 owing to high primary deficits and rising debt
service costs34 and this year due in large measure to a drop in
nominal GDP as well.
—
28 In January 2020, pensions were raised: the average old-age pension went up by CZK 900 (increasing pension spending by some 0.1% of GDP).
29 With effect from 1 January 2020, the total parental allowance was increased from CZK 220,000 to CZK 300,000, which means an increase in expenditure on social benefits of approximately 0.1% of GDP.
30 These proposed tax changes form part of a “rate package”. The most important change in terms of budgetary impact is the increase in excise duty on cigarettes (0.13% of GDP).
31 The third and fourth phases of ESR should contribute about 0.1% of GDP to the growth in tax revenues. However, this impact will be largely offset by the reassignment of selected goods and some services to the reduced VAT rate in May 2020.
32 The fiscal impulse does not cover the guarantees provided by the Czech-Moravian Guarantee and Development Bank (ČMZRB) for preferential loans to firms (the COVID programmes), as these do not directly affect the government deficit or the government debt. The potential future payment of these guarantees represents a risk of worse public finance performance.
33 Pursuant to European Council Regulation No. 1466/97, public finances will be consolidated by at least 0.5 percentage point of GDP a year until the medium-term objective is met again.
34 Debt service costs will rise due to expected significant growth in government debt. The effective interest rate will fall slightly, as new debt will be financed by issuing government bonds with yields lower than the average yield on the existing debt.
Table II.2.5 Fiscal impulse
The fiscal impulse will be strongly positive this year and
negative to almost the same extent next year due to the
unwinding of most of the stabilisation measures taken
this year
(contributions to GDP growth in percentage points)
2019 2020 2021
actual forecast forecast
FISCAL IMPULSE 0.5 1.1 -0.8
of which impact through:
private consumption 0.4 1.2 -1.0
private investment 0.0 0.0 0.1
government investment, domestic 0.1 -0.1 0.0
government investment, EU funded 0.0 0.0 0.1

II. —— The forecast, its changes and risks 26
Czech National Bank ——— Inflation Report ——— II/2020
II.3 RISKS AND UNCERTAINTIES OF THE FORECAST
The Bank Board assessed the risks to the forecast in the current extraordinary situation as being
unprecedentedly high. The risks are connected with the course of the pandemic and especially with the
duration and size of the impacts of the quarantine measures on the global and Czech economy. These
risks require an even greater easing of the monetary conditions compared with the baseline scenario of
the forecast.
II.3.1 Risks perceived by the CNB
The risks to the forecast are exceptionally high. Their
quantification is associated with a high degree of uncertainty. The
risks are described by two scenarios. Under the first scenario, the
current pandemic and its economic impacts will last longer than the
forecast expects. The second scenario assumes that the pandemic
will resurge in the autumn.
The longer-lasting pandemic scenario assumes that the
pandemic recedes more slowly and has longer-lasting
negative impacts abroad. In this scenario, the government
restrictions in Germany and Slovakia will be extended by two to
three weeks. The scenario therefore assumes a slower return of
economic activity in the effective euro area to growth (see
Table II.3.1). A longer-lasting pandemic will also worsen consumer
confidence and business sentiment compared with the baseline
scenario. Due to the worse economic growth and demand
outlooks, the oil price is lower than in the forecast. This will be
reflected in a sharper fall in the energy component of the PPI.
The recovery of the core component of the PPI will also be slower
than in the baseline scenario due to more subdued demand
pressures. A similar pattern can be expected for consumer prices
in the euro area, which will grow at a slower rate this year and the
next due to a deeper and longer-lasting drop in demand and
energy prices. In addition to the already announced measures,
the ECB will respond to the worse economic growth outlook for
the euro area by broadening and prolonging its asset purchases
under the PEPP programme, especially in areas with a direct
impact on the corporate sector (short-term commercial paper).
Purchases at 2020 Q2 levels are thus extended until the end of
the year, their total annual amount being much higher than in the
baseline scenario. Asset purchases will be gradually reduced in
2021, but the effect of the ECB’s accommodative monetary policy
will last until the end of 2022. The ECB’s response will be
reflected in the shadow 3M EURIBOR rate, which will be lower
than in the baseline scenario over the entire forecast horizon.
The domestic epidemiological measures are also phased out
more gradually in the longer-lasting pandemic scenario. The
scenario assumes that the epidemiological situation will start to
improve a little later. This will prevent the government from lifting
its quarantine restrictions according to the initial plan made public
in mid-April. The timetable (see Box 2 in section II.2) will be
moved back by about one month relative to the baseline scenario.
Except for tourism-related measures, the restrictions should be
fully lifted by the end of the summer holidays. The longer-lasting
measures will lead to a larger decline in economic activity (see
Table II.3.2) and a greater deterioration in the labour market
situation than in the baseline scenario. This will be accompanied
Table II.3.1 Comparison of scenarios –
selected foreign variables
A more adverse course of the pandemic and especially
a resurgence will lead to a deeper drop in euro area
GDP than in the baseline scenario
(annual percentage changes unless otherwise indicated)
2019 2020 2021
actual forecast forecast
PPI in the effective euro area
Baseline 1.2 -4.1 0.9
Longer-lasting pandemic scenario 1.2 -4.9 0.6
Pandemic resurgence scenario 1.2 -5.7 0.0
GDP in the effective euro area
Baseline 1.2 -6.9 4.4
Longer-lasting pandemic scenario 1.2 -8.7 3.4
Pandemic resurgence scenario 1.2 -11.4 -1.8
Brent crude oil price (USD/barrel)
Baseline 64.2 40.1 40.7
Longer-lasting pandemic scenario 64.2 35.8 38.7
Pandemic resurgence scenario 64.2 34.6 35.7
Shadow 3M EURIBOR (%)
Baseline -0.5 -1.9 -2.0
Longer-lasting pandemic scenario -0.5 -1.9 -2.3
Pandemic resurgence scenario -0.5 -2.4 -3.7

II. —— The forecast, its changes and risks 27
Czech National Bank ——— Inflation Report ——— II/2020
by a longer-lasting deterioration in both household and business
sentiment.
A longer-lasting pandemic will be reflected in a deeper economic
decline this year. The larger drop in economic activity, particularly
in 2020 Q2 and 2020 Q3, will reflect the direct impacts of the
longer-lasting government quarantine measures. The measures
will lead to a bigger decline in household consumption than in the
baseline scenario. At the same time, the GDP growth projection
is lower over the entire forecast horizon due to much worse-than-
forecasted household and business sentiment, which will be
mirrored in a slower recovery in private investment growth. Wage
growth will also be more gradual due to a greater cooling of the
labour market both this year and the next. The fall in tax revenue
will increase, while government expenditure on support measures
will rise more. General government will thus record a wider deficit
and faster growth in government debt than under the baseline
forecast scenario. Despite a weaker koruna, inflation will be lower
due to the lower wage growth and weaker domestic price
pressures. The weaker koruna will meanwhile improve Czech
exporters’ price competitiveness and thus at least partly
neutralise the impacts of the lower external demand on the
domestic economy. Compared with the baseline scenario, the
longer-lasting pandemic scenario requires greater monetary
policy easing in the interest rate component. This will foster
a return of inflation close to the 2% target from below over the
monetary policy horizon.
The second scenario expects the first wave of the pandemic to
recede more gradually and a second wave to emerge in late 2020.
The forecast for the external environment in this scenario first
incorporates an extension of government measures across the
effective euro area during the spring months. In addition, the
scenario assumes that Europe will be hit by a resurgence of the
pandemic at the end of this year. Government quarantine
measures will be reintroduced for about two months, but on
a much smaller scale than during the first wave. However, the
longer period of uncertainty and the resurgence of the pandemic
will be gradually reflected in a structural change in the global
economic environment. Trade mobility will drop, the movement of
persons and capital will slow, and the interconnectedness
between countries will be limited by less permeable borders. This
will lead to a drop in potential output growth. This deglobalisation
trend will foster lower growth in economic activity and,
conversely, higher inflation. The negative impacts will fade only
very gradually due to stronger growth in uncertainty and more
sustained worse household and business sentiment. Despite the
deeper economic contraction, the core component of the PPI
follows roughly the same path this year as in the previous two
scenarios, as the GDP drop in the pandemic resurgence scenario
(see Table II.3.1) is so large that some supplier relationships will
break down irreversibly, resulting in upward pressure on selected
product prices. The oil price will respond to the deeper economic
contraction with a larger fall. Its recovery will be prevented by the
double-dip in GDP combined with high oil stocks. As a result, the
energy component of the PPI will be affected more significantly.
In this scenario, the ECB makes unlimited asset purchases but
keeps the deposit rate unchanged. The 3M EURIBOR shadow
rate thus falls well below zero and the effect of the ECB ’s easier
monetary policy lasts until late 2023.
Table II.3.2 Comparison of scenarios –
selected domestic variables
In response to the deep fall in economic activity, the
central bank eases monetary conditions to mitigate the
fall in inflation below the 2% target
(annual percentage changes unless otherwise indicated)
2019 2020 2021
actual forecast forecast
Headline inflation
Baseline 2.8 2.8 2.1
Longer-lasting pandemic scenario 2.8 2.6 1.8
Pandemic resurgence scenario 2.8 2.5 1.7
GDP
Baseline 2.5 -8.0 4.0
Longer-lasting pandemic scenario 2.5 -10.1 3.2
Pandemic resurgence scenario 2.5 -13.5 -1.5
Average wage in market sectors
Baseline 6.6 1.9 5.6
Longer-lasting pandemic scenario 6.6 0.2 5.7
Pandemic resurgence scenario 6.6 -2.2 4.1
Exchange rate (CZK/EUR)
Baseline 25.7 26.9 27.5
Longer-lasting pandemic scenario 25.7 27.5 28.6
Pandemic resurgence scenario 25.7 28.5 31.6
3M PRIBOR (in %)
Baseline 2.1 0.9 0.6
Longer-lasting pandemic scenario 2.1 0.6 0.0
Pandemic resurgence scenario 2.1 0.0 -1.7
Government budget balance (in % of GDP)
Baseline 0.3 -4.8 -3.4
Longer-lasting pandemic scenario 0.3 -6.1 -4.3
Pandemic resurgence scenario 0.3 -8.3 -5.3
Government debt (in % of GDP)
Baseline 30.8 37.6 38.6
Longer-lasting pandemic scenario 30.8 39.7 41.6
Pandemic resurgence scenario 30.8 43.0 47.3
Current account (in % of GDP)
Baseline -0.4 -0.6 -0.2
Longer-lasting pandemic scenario -0.4 -0.9 -0.4
Pandemic resurgence scenario -0.4 -1.3 -0.9

II. —— The forecast, its changes and risks 28
Czech National Bank ——— Inflation Report ——— II/2020
The pandemic resurgence scenario assumes that the government
quarantine measures in the Czech Republic will be renewed from
October until Christmas. This scenario’s assumptions regarding
the first wave of the pandemic are the same as in the longer-
lasting pandemic scenario, so here too the government
restrictions are eased rather more gradually during the spring
months than in the baseline scenario. In addition, the pandemic
resurges in the autumn and the government responds by freezing
some segments of the domestic economy again. This wave of
closures and restrictions is smaller in both scale and duration
than the spring one, as all entities are better prepared and react
more effectively. The measures will thus be lifted during
December 2020. The resurgence of the pandemic, coupled with
the worse external outlook, has an even more adverse impact on
the entire domestic economy, including the labour market, than
in the previous scenarios. On the fiscal policy side, supportive
expenditure measures are introduced, though to a lesser extent
than during the first wave due to the risk of high deficits and
rapidly rising debt.
The resurgence of the pandemic and the emergent deglobalisation
will lead to an even deeper and longer-lasting domestic economic
downturn (see Table II.3.2). The repeated coronavirus blow will be
felt as early as late 2020 and even more strongly in 2021. Many
economically exhausted businesses will close. This will lead to a
dramatic cooling on the labour market, a deterioration in
households’ income situation and strongly negative sentiment.
Wage growth will thus be much lower than in the longer-lasting
pandemic scenario, with the average wage in market sectors
even declining in absolute terms in 2020 as a whole. All this will
foster significantly lower household consumption growth both this
year and the next than in the preceding scenarios. Government
consumption will grow this year on the back of increased health
care expenditure. Next year, however, it will be flat. The need to
consolidate public finances and slow the growth in government
debt will give rise to fiscal austerity measures. For the same
reason, government investment financed from domestic sources
will also fall next year. Following a deep fall in 2020 H1, firms’
investment activity will not recover this year amid a longer lasting
and stronger deterioration in sentiment. Its only very slow
recovery next year will reflect the breakdown of global production
chains on the one hand and transfers of production from other
continents back to Europe on the other. Lower growth in domestic
costs amid non-existent demand pressures will be reflected in the
outlook for inflation, which will temporarily dip below the lower
boundary of the tolerance band around the target early next year.
A markedly weaker exchange rate and a hypothetically deeply
negative path of market interest rates will support a gradual
recovery in economic activity and help inflation return to the 2%
target at the end of next year. The pandemic resurgence scenario
would thus most probably require monetary policy to be markedly
eased using an unspecified unconventional instrument. All three
scenarios are illustrated graphically for the main foreign and
domestic macroeconomic indicators in Blocks 2 and 3 below.
The Bank Board assessed the risks to the forecast in the current
extraordinary situation as being unprecedentedly high. The risks
are connected with the course of the pandemic and especially
with the duration and size of the impacts of the quarantine
measures on the global and Czech economy. These risks require

II. —— The forecast, its changes and risks 29
Czech National Bank ——— Inflation Report ——— II/2020
an even greater easing of the monetary conditions compared with
the baseline scenario of the forecast.
Brent crude oil price
(USD/barrel)
PPI in the effective euro area
(annual percentage changes)
GDP in the effective euro area
(annual percentage changes)
3M EURIBOR
(percentages)
Block 2: Comparison of scenarios – main foreign macroeconomic indicators
—— Baseline —— Longer-lasting pandemic scenario
—— Pandemic resurgence scenario — — Shadow rates

II. —— The forecast, its changes and risks 30
Czech National Bank ——— Inflation Report ——— II/2020
CZK/EUR exchange rate
(CZK/EUR)
3M PRIBOR
(percentages)
General unemployment rate
(percentages)
Block 3: Comparison of scenarios – main domestic macroeconomic indicators
GDP
(annual percentage changes)
GDP
(CZK billions)
Average nominal wages in market sectors
(annual percentage changes)
Average nominal wages in market sectors
(CZK)
Headline inflation
(percentages)
—— Baseline —— Longer-lasting pandemic scenario —— Pandemic resurgence scenario

II. —— The forecast, its changes and risks 31
Czech National Bank ——— Inflation Report ——— II/2020
II.3.2 Risks signalled by other entities’ forecasts
Inflation expectations in the economy continue to be anchored by
the CNB’s 2% target. Inflation forecasted by financial market
analysts is currently slightly below the CNB’s 2% target at the
one-year horizon. At the three-year horizon, it is exactly at the
target (see Table II.3.3). According to the analysts, inflation will
slow rapidly in the coming months. The slowdown will be due to
a deep decline in economic activity, which will subsequently spill
over into a deterioration in the labour market situation,
unemployment growth, slower nominal wage growth and subdued
household consumption. The recent collapse of oil prices will
meanwhile be reflected in a decline in fuel prices. However, these
effects will be dampened by the currently weak koruna.
The analysts estimate that the Czech economy will contract by 6%–
7% this year (see Table II.3.3). Most of them believe that the
economy will return to growth next year after the pandemic
recedes, although from a substantially lower initial base. The
economic contraction will also be reflected in the labour market.
The unemployment rate will rise, easing the previously very tight
conditions on the domestic labour market and simultaneously
weakening the bargaining power of employees when asking for
pay rises.
The analysts on average forecast appreciation of the koruna and
a decline in interest rates at the one-year horizon. Although the
analysts consider the current depreciation of the koruna as only
temporary, they believe that the risks are tilted towards sustained
weaker levels.35 The perceived uncertainties are reflected in
a wide expected range between the maximum and minimum
values of the koruna at the one-year horizon.36 Almost all the
analysts in the April FMIE survey were expecting the CNB Bank
Board to cut key interest rates at the May meeting by 0.25–
0.75 percentage point. Only two analysts were expecting the
rates to remain unchanged. Their average estimate of the
2W repo rate at the one-year horizon was 0.4%.
The analysts thus predict lower inflation, a more moderate drop in
GDP and a stronger koruna compared with the CNB forecast. The
analyst predict the koruna to strengthen again on average, while
the CNB forecast assumes it will stay close to the weaker levels
recorded in late April 2020. The analysts’ one-year outlook for
interest rates is almost the same as the central bank ’s forecast
(see Table II.3.3). The analysts’ wage expectations are higher than
the CNB forecast for this year and lower for next year.
The current market outlook for 3M rates implies a decline over the
one-year horizon. After the sharp fall in domestic market interest
rates recorded in March, consistent with the forecast is a further
decline in 2020 Q2 followed by broad stability. From mid-2020
onwards, the market outlook is thus slightly below the interest
rates contained in the CNB forecast (see Chart II.3.1).
—
35 The koruna might not strengthen if – in addition to adverse global economic developments and higher risk aversion on financial markets – the plant shutdowns in the car industry, in which the Czech economy largely specialises, were to be extended, for example.
36 At the one-year horizon, the range was CZK 25.1–26.8 to the euro in the April FMIE survey and CZK 24.7–27.0 to the euro in the CF survey.
Table II.3.3 Expected indicators of FMIE, CF
and corporations
The analysts’ inflation expectations are slightly below the
CNB’s 2% target at the one-year horizon and at the
target at the three-year horizon; the analysts expect the
economy to contract sharply this year and the koruna to
strengthen at the one-year horizon
(at 1Y; annual percentage changes unless otherwise
indicated)
12/19 1/20 2/20 3/20 4/20
FMIE:
CPI 2.3 2.2 2.2 1.9 1.6
CPI, 3Y horizon 2.0 2.0 2.0 1.9 2.0
Real GDP in 2020 2.1 2.2 2.1 0.7 -7.2
Real GDP in 2021 2.3 2.3 2.2 5.8
Nominal wages in 2020 5.7 5.9 5.8 5.2 3.8
Nominal wages in 2021 4.9 4.9 4.1 3.2
CZK/EUR exchange rate (level) 25.4 25.1 24.9 25.5 26.0
2W repo rate (in per cent) 2.0 2.1 2.2 1.4 0.4
1Y PRIBOR (in per cent) 2.3 2.3 2.3 1.7 0.8
Corporations:
CPI 2.2 2.2
CPI, 3Y horizon 2.6 2.7
CF:
Real GDP in 2020 2.1 2.2 2.1 1.2 -6.1
Real GDP in 2021 2.4 2.4 2.5 5.3
Nominal wages in 2020 5.9 5.8 5.9 5.6 4.1
Nominal wages in 2021 4.8 4.8 4.5 3.5
CZK/EUR exchange rate (level) 25.2 25.4 25.3 25.2 25.7
3M PRIBOR (in per cent) 2.2 2.2 2.2 1.9 0.7
Chart II.3.1 FRA rates versus the CNB
forecast
The market outlook for interest rates is falling; from mid-
2020 onwards it is slightly below the rates contained in
the CNB forecast
(percentages)
Note: Market rates represent for 2020 Q1 and 2020 Q2 the
3M PRIBOR and for 2020 Q3–2021 Q1 the average values
of the FRA 3*6, 6*9 and 9*12 rates for the last 10 trading
days as of 30 April 2020.
0.00
0.25
0.50
0.75
1.00
1.25
1.50
1.75
2.00
2.25
I/20 II/20 III/20 IV/20 I/21
CNB forecast Market rates

III. —— Current economic developments 32
Czech National Bank ——— Inflation Report ——— II/2020
III. CURRENT ECONOMIC DEVELOPMENTS
III.1 INFLATION AND INFLATION TARGET FULFILMENT
Inflation was appreciably above the upper boundary of the tolerance band around the target in the first
months of this year, averaging 3.6% in Q1. Core inflation was still the biggest contributor to the
continued high price growth in Q1, but rapidly rising food prices also fostered growth. By contrast, the
previous very brisk growth in administered prices slowed gradually and fuel prices switched to a decline.
The fall in oil prices was strongly reflected in both importer and industrial producer prices. By contrast,
construction work prices and prices of market services in the business sector kept rising apace in Q1.
The impact of the coronavirus pandemic on inflation was very limited in the observed data, but stronger
effects can be expected in the months ahead.
Observed inflation was much higher than the forecast published in autumn 2018, which is relevant for
evaluating the current fulfilment of the inflation target. This was due chiefly to unexpectedly high growth
in food prices combined with higher core inflation. However, the other components of inflation also grew
faster than expected. All external factors deviated considerably from the assumptions of the forecast.
Overall, external developments fostered more gradual depreciation of the koruna and lower domestic
interest rates and had a slightly negative impact on inflation. Observed domestic real GDP growth was
weaker than forecasted. The exchange rate remained significantly weaker than in the forecast due to
negative global sentiment and a declining outlook for external economic and price growth, which
domestic monetary policy took into account by raising interest rates rather faster than forecasted. With
the benefit of hindsight, the CNB ’s monetary policy in the past period can be assessed as having been
insufficiently tight as regards the fulfilment of the inflation target. Even so, it can be said that monetary
policy had created enough room in the past to allow it to relax interest rates during the coronavirus
pandemic. The Bank Board used part of this room at an extraordinary and a regular meeting in March,
cutting monetary policy rates by 1.25 percentage points overall.
Chart III.1.1 IR IV/2018 forecast versus actual
headline inflation
The deviation of observed inflation from the autumn 2018
forecast has increased significantly over time, amounting to
1.5 percentage points in 2020 Q1
(year on year in %)
0
1
2
3
4
III/18 IV/18 I/19 II/19 III/19 IV/19 I/20
Actual inflation IR IV/2018 forecast
2% inflation target
Table III.1.1 Fulfilment of the IR IV/2018 inflation
forecast
The positive deviation of actual inflation from the forecast was
due to all inflation components but most of all to unexpectedly
strong food price growth and higher core inflation
(annual percentage changes; contributions in percentage points)
a) impact on headline inflation except administered prices
b) excluding the first-round effects of changes to indirect taxes
CONSUMER PRICES 2.1 3.6 1.5
of which:
administered prices 1.8 4.2 0.3first-round impacts of
changes to indirect taxesa) 0.0 0.1 0.1
core inflationb)
2.2 2.9 0.4
food pricesb)
2.4 4.8 0.6
fuel pricesb)
-2.0 1.3 0.1
IR IV/2018
forecast
2020 Q1
outturn
Contribution
to total
difference
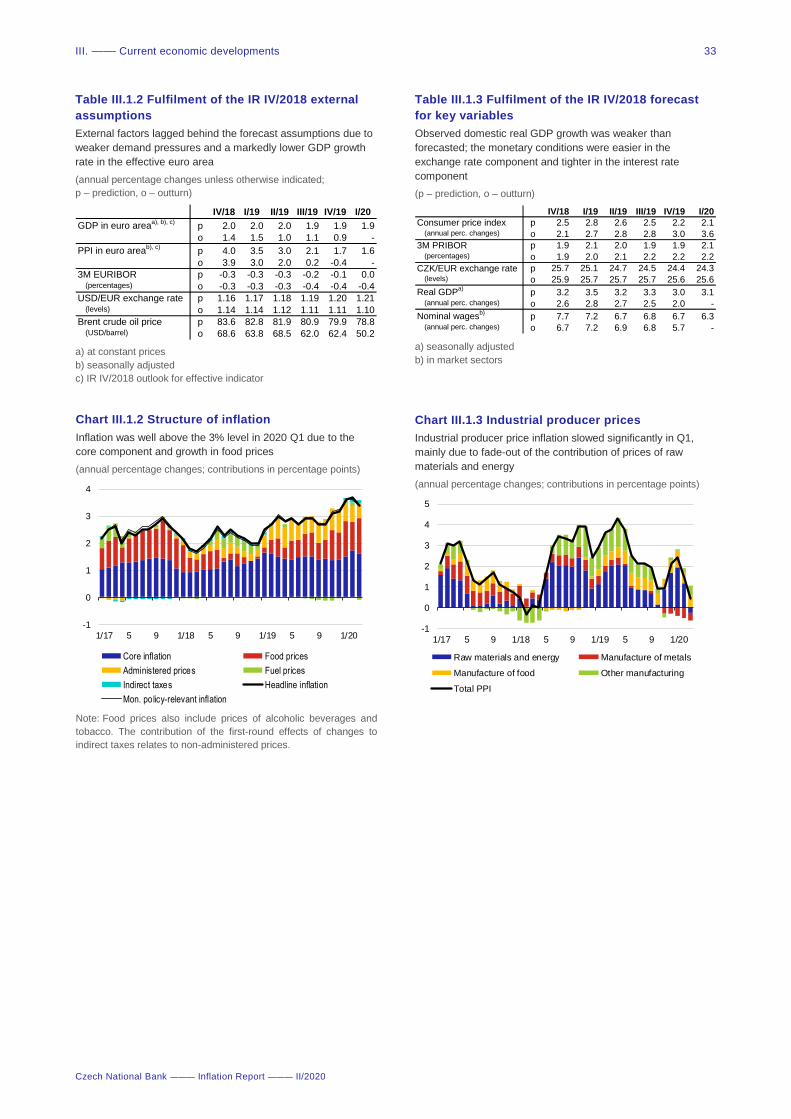
III. —— Current economic developments 33
Czech National Bank ——— Inflation Report ——— II/2020
Table III.1.2 Fulfilment of the IR IV/2018 external
assumptions
External factors lagged behind the forecast assumptions due to
weaker demand pressures and a markedly lower GDP growth
rate in the effective euro area
(annual percentage changes unless otherwise indicated;
p – prediction, o – outturn)
a) at constant prices
b) seasonally adjusted
c) IR IV/2018 outlook for effective indicator
IV/18 I/19 II/19 III/19 IV/19 I/20
GDP in euro areaa), b), c)
p 2.0 2.0 2.0 1.9 1.9 1.9
o 1.4 1.5 1.0 1.1 0.9 -
PPI in euro areab), c)
p 4.0 3.5 3.0 2.1 1.7 1.6
o 3.9 3.0 2.0 0.2 -0.4 -
3M EURIBOR p -0.3 -0.3 -0.3 -0.2 -0.1 0.0(percentages) o -0.3 -0.3 -0.3 -0.4 -0.4 -0.4
USD/EUR exchange rate p 1.16 1.17 1.18 1.19 1.20 1.21(levels) o 1.14 1.14 1.12 1.11 1.11 1.10
Brent crude oil price p 83.6 82.8 81.9 80.9 79.9 78.8(USD/barrel) o 68.6 63.8 68.5 62.0 62.4 50.2
Table III.1.3 Fulfilment of the IR IV/2018 forecast
for key variables
Observed domestic real GDP growth was weaker than
forecasted; the monetary conditions were easier in the
exchange rate component and tighter in the interest rate
component
(p – prediction, o – outturn)
a) seasonally adjusted
b) in market sectors
IV/18 I/19 II/19 III/19 IV/19 I/20
Consumer price index p 2.5 2.8 2.6 2.5 2.2 2.1(annual perc. changes) o 2.1 2.7 2.8 2.8 3.0 3.6
3M PRIBOR p 1.9 2.1 2.0 1.9 1.9 2.1(percentages) o 1.9 2.0 2.1 2.2 2.2 2.2
CZK/EUR exchange rate p 25.7 25.1 24.7 24.5 24.4 24.3(levels) o 25.9 25.7 25.7 25.7 25.6 25.6
Real GDPa)
p 3.2 3.5 3.2 3.3 3.0 3.1(annual perc. changes) o 2.6 2.8 2.7 2.5 2.0 -
Nominal wagesb)
p 7.7 7.2 6.7 6.8 6.7 6.3(annual perc. changes) o 6.7 7.2 6.9 6.8 5.7 -
Chart III.1.2 Structure of inflation
Inflation was well above the 3% level in 2020 Q1 due to the
core component and growth in food prices
(annual percentage changes; contributions in percentage points)
Note: Food prices also include prices of alcoholic beverages and
tobacco. The contribution of the first-round effects of changes to
indirect taxes relates to non-administered prices.
-1
0
1
2
3
4
1/17 5 9 1/18 5 9 1/19 5 9 1/20
Core inflation Food prices
Administered prices Fuel prices
Indirect taxes Headline inflation
Mon. policy-relevant inflation
Chart III.1.3 Industrial producer prices
Industrial producer price inflation slowed significantly in Q1,
mainly due to fade-out of the contribution of prices of raw
materials and energy
(annual percentage changes; contributions in percentage points)
-1
0
1
2
3
4
5
1/17 5 9 1/18 5 9 1/19 5 9 1/20
Raw materials and energy Manufacture of metals
Manufacture of food Other manufacturing
Total PPI

III. —— Current economic developments 34
Czech National Bank ——— Inflation Report ——— II/2020
III.2 ECONOMIC DEVELOPMENTS
The growth of the Czech economy slowed to 2% in 2019 Q4, lagging slightly behind the estimated rate
of growth of potential output, so the slightly positive output gap narrowed further. All components of
domestic demand, most notably household consumption, made positive contributions to the continuing
GDP growth. However, the contribution of net exports fell deep into negative territory, mainly due to
fading export growth related to persisting subdued growth in external economic activity. Government
consumption growth also weakened. By contrast, a recovery in gross capital formation growth due to
an upswing in fixed investment and a renewed positive contribution of change in inventories had
a positive effect on domestic economic growth. From the supply-side perspective, the tertiary sector
was the main driver of gross value added growth. The contribution of industry, linked to the weakening
growth in external demand, had the opposite effect. Production in this sector fell not just at the end of
last year, but also in January and February this year. Construction performed well in the first months of
this year, with civil engineering showing particularly brisk growth. Retail sales were also favourable.
Both consumer and business confidence cooled gradually early in the year and fell dramatically in April.
Chart III.2.2 Gross value added
On the supply side of the domestic economy, the slowdown in
external demand was reflected in the contribution of industry
turning slightly negative
(annual percentage changes; contributions in percentage points;
seasonally adjusted)
-1
0
1
2
3
4
5
6
I/15 I/16 I/17 I/18 I/19
Manufacturing Market services
Trade Non-market services
Construction Energy
Agriculture Gross value added
Chart III.2.1 Gross domestic product
Solid growth in domestic demand combined with subdued
growth in economic activity abroad led to a fall in the
contribution of net exports, which was the main cause of the
GDP slowdown
(annual percentage changes; contributions in percentage points;
seasonally adjusted)
-3
-2
-1
0
1
2
3
4
5
6
7
I/15 I/16 I/17 I/18 I/19
Household consumption Net exports
Gross fix. capital formation Government consumption
Change in inventories NPISH expenditure
Gross domestic product
Chart III.2.3 Industrial production and
construction output
Industrial production decreased slightly again at the start of this
year, while construction maintained a rapid rate of growth
(annual percentage changes)
-15
-10
-5
0
5
10
15
1/15 1/16 1/17 1/18 1/19 1/20
Industrial production Construction output
Chart III.2.4 Consumer confidence balance
Consumer confidence fell unprecedently in April due to the
coronavirus pandemic
(balance is difference in per cent between answers expressing
improvement and deterioration in expected and ongoing tendencies)
Note: Expectations 12 months ahead.
-30
-25
-20
-15
-10
-5
0
5
10
15
1/17 5 9 1/18 5 9 1/19 5 9 1/20
Economic situation Expected unemployment
Intention to save Financial situation
Consumer confidence indicator

III. —— Current economic developments 35
Czech National Bank ——— Inflation Report ——— II/2020
III.3 THE LABOUR MARKET
The labour market was still very tight at the end of 2019, as can be seen from the composite LUCI
indicator. Employment decreased slightly and the unemployment rate stayed close to a historical low.
The number of job vacancies was still high. This situation, coupled with growth in the minimum wage,
exerted continued strong upward pressure on wages. Despite slowing slightly, wage growth stood at
6.7% in Q4. This was due to slower wage growth in market sectors. By contrast, wage growth in non -
market sectors accelerated further. Growth in whole-economy labour productivity still lagged behind
average real wage growth, so nominal unit wage costs continued to grow at a brisk pace .
Chart III.3.1 LUCI – Labour Utilisation Composite
Index
Despite easing slightly, overall labour market tightness
remained high at the end of last year
(index; vertical axis shows standard deviations)
-1.5
-1.0
-0.5
0.0
0.5
1.0
1.5
2.0
2.5
I/00 I/02 I/04 I/06 I/08 I/10 I/12 I/14 I/16 I/18
Wages and costs Employment Demand for work
Unemployment Others LUCI
Chart III.3.2 Number of employees (full-time
equivalent)
Growth in the converted number of employees remained
subdued, with an increase in average hours worked
outweighing a slight decrease in the number of employees
(annual percentage changes; contributions in percentage points)
-1.0
-0.5
0.0
0.5
1.0
1.5
2.0
2.5
3.0
I/15 I/16 I/17 I/18 I/19
Hours worked per employee Number of employees
Number of employees (FTE)
Chart III.3.3 Beveridge curve
The number of vacancies was still much higher than the
number of registered unemployed persons, amid higher core
inflation
(numbers in thousands; seasonally adjusted; annual percentage
changes for core inflation; source: MLSA, CZSO)
Chart III.3.4 Average wage and whole-economy
labour productivity
Labour productivity growth still lagged well behind real wage
growth
(annual percentage changes; whole-economy productivity –
seasonally adjusted)
-1
0
1
2
3
4
5
6
7
8
9
I/15 I/16 I/17 I/18 I/19
Average nominal wage
Average real wage
Whole-economy labour productivity
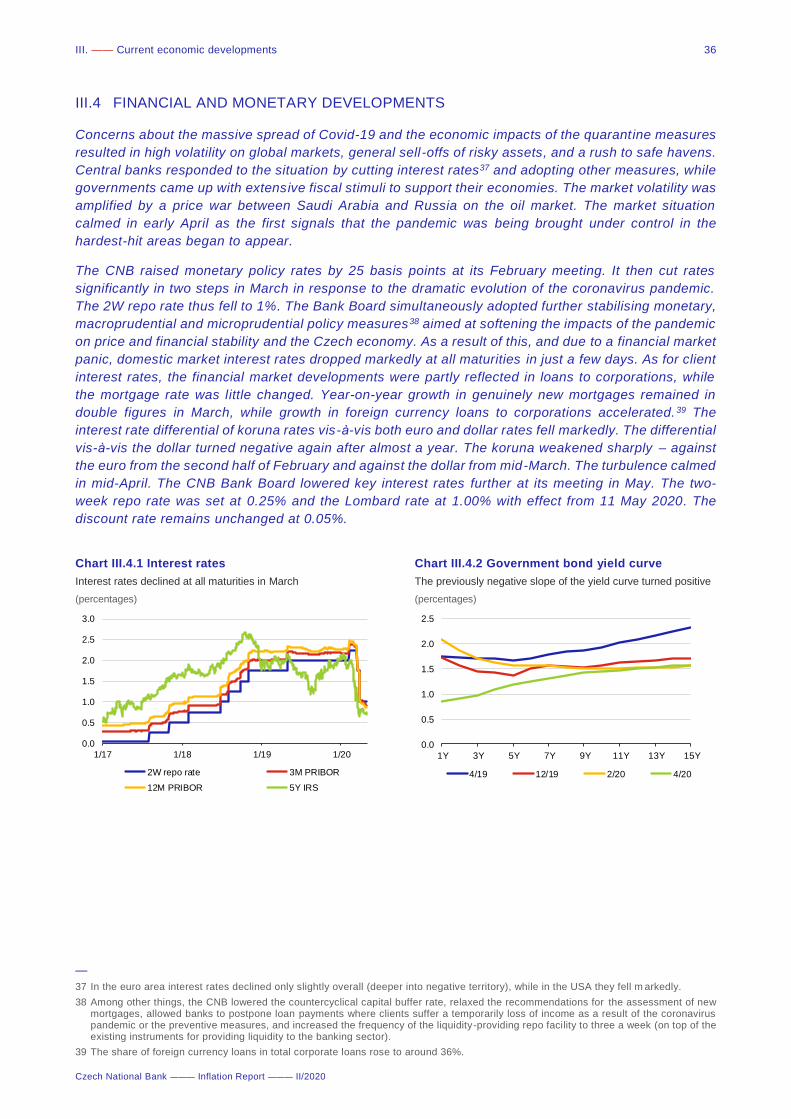
III. —— Current economic developments 36
Czech National Bank ——— Inflation Report ——— II/2020
III.4 FINANCIAL AND MONETARY DEVELOPMENTS
Concerns about the massive spread of Covid-19 and the economic impacts of the quarantine measures
resulted in high volatility on global markets, general sell -offs of risky assets, and a rush to safe havens.
Central banks responded to the situation by cutting interest rates37 and adopting other measures, while
governments came up with extensive fiscal stimuli to support their economies. The market volatility was
amplified by a price war between Saudi Arabia and Russia on the oil market. The market situation
calmed in early April as the first signals that the pandemic was being brought under control in the
hardest-hit areas began to appear.
The CNB raised monetary policy rates by 25 basis points at its February meeting. It then cut rates
significantly in two steps in March in response to the dramatic evolution of the coronavirus pandemic.
The 2W repo rate thus fell to 1%. The Bank Board simultaneously adopted further stabilising monetary,
macroprudential and microprudential policy measures38 aimed at softening the impacts of the pandemic
on price and financial stability and the Czech economy. As a result of this, and due to a financial market
panic, domestic market interest rates dropped markedly at all maturities in just a few days. As for client
interest rates, the financial market developments were partly reflected in loans to corporations, while
the mortgage rate was little changed. Year-on-year growth in genuinely new mortgages remained in
double figures in March, while growth in foreign currency loans to corporations accelerated.39 The
interest rate differential of koruna rates vis-à-vis both euro and dollar rates fell markedly. The differential
vis-à-vis the dollar turned negative again after almost a year. The koruna weakened sharply – against
the euro from the second half of February and against the dollar from mid-March. The turbulence calmed
in mid-April. The CNB Bank Board lowered key interest rates further at its meeting in May. The two-
week repo rate was set at 0.25% and the Lombard rate at 1.00% with effect from 11 May 2020. The
discount rate remains unchanged at 0.05%.
—
37 In the euro area interest rates declined only slightly overall (deeper into negative territory), while in the USA they fell m arkedly.
38 Among other things, the CNB lowered the countercyclical capital buffer rate, relaxed the recommendations for the assessment of new mortgages, allowed banks to postpone loan payments where clients suffer a temporarily loss of income as a result of the coronavirus pandemic or the preventive measures, and increased the frequency of the liquidity-providing repo facility to three a week (on top of the existing instruments for providing liquidity to the banking sector).
39 The share of foreign currency loans in total corporate loans rose to around 36%.
Chart III.4.1 Interest rates
Interest rates declined at all maturities in March
(percentages)
0.0
0.5
1.0
1.5
2.0
2.5
3.0
1/17 1/18 1/19 1/20
2W repo rate 3M PRIBOR
12M PRIBOR 5Y IRS
Chart III.4.2 Government bond yield curve
The previously negative slope of the yield curve turned positive
(percentages)
0.0
0.5
1.0
1.5
2.0
2.5
1Y 3Y 5Y 7Y 9Y 11Y 13Y 15Y
4/19 12/19 2/20 4/20

III. —— Current economic developments 37
Czech National Bank ——— Inflation Report ——— II/2020
Chart III.4.3 CZK/EUR and CZK/USD exchange
rates
The koruna weakened sharply against both the euro and the
dollar in 2020 Q1
19
21
23
25
27
29
1/17 1/18 1/19 1/20
CZK/EUR CZK/USD
Chart III.4.4 Interest rate differentials
The previously highly positive koruna-euro interest rate
differential decreased, while the koruna-dollar differential turned
slightly negative after almost a year
(percentage points)
-2.0
-1.5
-1.0
-0.5
0.0
0.5
1.0
1.5
2.0
2.5
3.0
1/17 1/18 1/19 1/20
EUR 3M EUR 12M USD 3M USD 12M
Chart III.4.5 Interest rates on stocks of loans to
corporations
Interest rates on stocks of loans to non-financial corporations
fell at all maturities in March
(percentages)
2.0
2.5
3.0
3.5
4.0
4.5
1/17 1/18 1/19 1/20
Short-term loans
Long-term loans
Medium-term loans
Table III.4.1 Client interest rates on new loans and
deposits
Interest rates on genuinely new loans to corporations started to
decline gradually, while those on mortgages were unchanged
(interest rates in percentages; changes in percentage points)
Note: The change in interest rates since November 2016, when
rates on corporate and mortgage loans were close to their historical
lows.
Interest
rate
3/20 2/20 11/16
HOUSEHOLDS
Mortgages 2.4 0.0 0.5
New mortgages (genuinely) 2.4 0.0 0.6
Consumer credit 8.1 0.1 -2.0
Deposits
Overnight deposits 0.3 0.0 0.1
Deposits with agreed maturity 1.4 -0.3 0.4
NON-FINANCIAL CORPORATIONS
Total loans to firms 3.2 -0.1 1.3
Total new loans (genuinely) 3.3 -0.4 1.3
Small loans (up to CZK 30 million) 3.8 -0.3 1.4
Large loans (over CZK 30 million) 3.1 -0.1 1.3
Change since

Abbreviations 38
Czech National Bank ——— Inflation Report ——— II/2020
Abbreviations AEIS Average Earnings Information System
BoE Bank of England
BoJ Bank of Japan
CF Consensus Forecasts
CNB Czech National Bank
Covid-19 disease caused by SARS-CoV-2 coronavirus
CPI consumer price index
CPIH experimental consumer price index
incorporating prices of older properties
CZK Czech koruna
CZSO Czech Statistical Office
DSTI debt service-to-income
DTI debt-to-income
ECB European Central Bank
EEA European Economic Area
EIA Environmental Impact Assessment
EIA U.S. Energy Information Administration
EIU Economist Intelligence Unit
ESA European System of Accounts
ESCB European System of Central Banks
ESR electronic sales registration
EU European Union
EUR euro
EURIBOR Euro Interbank Offered Rate
FDI foreign direct investment
Fed US central bank
FMIE Financial Market Inflation Expectations
FOMC Federal Open Market Committee
FRA forward rate agreement
GDP gross domestic product
GNP gross national product
GVA gross value added
HICP harmonised index of consumer prices
HP filter Hodrick-Prescott filter
HPI house price index
ICT information and communications technology
IEA International Energy Agency
Ifo index of economic confidence in Germany
ILO International Labour Organization
IMF International Monetary Fund
IR Inflation Report
IRI Institute for Regional Information
IRS interest rate swap
JPY Japanese yen
LFS Labour Force Survey
LIBOR London Interbank Offered Rate
LTV loan to value
LUCI Labour Utilisation Composite Index
M1, M3 monetary aggregates
MFIs monetary financial institutions
MLSA Ministry of Labour and Social Affairs
NAIRU non-accelerating inflation rate of
unemployment
NBS National Bank of Slovakia
OECD Organisation for Economic Co-operation and
Development
OPEC+ The OPEC member countries and another ten
oil-exporting countries (the most important
being Russia, Mexico and Kazakhstan)
PMI Purchasing Managers Index
pp percentage points
PPI producer price index
PRIBOR Prague Interbank Offered Rate
repo rate repurchase agreement rate
USD US dollar
VAT value added tax
WTI West Texas Intermediate

Glossary 39
Czech National Bank ——— Inflation Report ——— II/2020
Glossary This glossary explains some terms frequently used in the Inflation Report. A more detailed glossary can be found on
the CNB website (www.cnb.cz/en/general/glossary/index.html).
Administered prices: A sub-category of the consumer basket consisting of items with price ceilings (set at either
central or local level), prices regulated on a cost-plus basis (items whose prices may only reflect economically justified
costs and a reasonable profit) and administratively fixed fees. The selection of these items is based on the Price
Bulletin of the Czech Ministry of Finance.
Agricultural producer prices: Surveyed by the CZSO monthly on the basis of exercise contract prices (excluding their
own consumption) of products intended solely for the domestic market excluding VAT.
Apartment asking prices: Asking prices of apartments as estimated by the CZSO.
Apartment transaction prices (returns): Prices based on Ministry of Finance statistics from property transfer tax
returns and published by the CZSO. These prices are the closest to actual market prices of apartments in terms of
methodology, but are published with a time delay.
Apartment transaction prices (survey): An alternative source of data on transaction prices of older apartments based
on a CZSO survey in estate agencies and available with a shorter time delay.
Balance of payments: Records economic transactions with other countries (i.e. between residents and non-residents)
over a particular period. The basic structure of the balance of payments includes the current account, the capital and
financial accounts and the change in CNB international reserves.
Bid-to-cover ratio: The ratio of total demand to demand coverage in primary auctions of medium-term and long-term
government bonds.
Consensus Forecasts: A regular monthly publication issued by Consensus Economics bringing together the forecasts
of hundreds of prominent economists and analytical teams regarding future world developments. The CNB uses
these predictions in its macroeconomic forecast when forming assumptions regarding the future development of the
external environment.
Core inflation: (Formerly called adjusted inflation excluding fuels.) The increase in prices of non-food items of the
consumer basket excluding items with administered prices, indirect tax changes and fuels.
Covered bond: A bond collateralised (backed) by long-term assets, usually mortgage loans or public sector loans.
The issuers are mostly banks and the issuance of covered bonds is subject to strict legislative rules. Compared to
standard bonds, this type of bond has lower credit risk thanks to higher coverage (known as dual recou rse), which
gives the covered bond holder a preferential claim on the issuer ’s receivables underlying the mortgage loans or public
sector loans and likewise a claim on the issuer. If the issuer defaults, the holder therefore has a preferential right to
the assets backing the covered bond.
Current account: Records exports and imports of goods and services, income from capital, investment and labour
and unrequited transfers.
Cyclical component of the general government balance: Expresses the effect of the business cycle on the general
government fiscal balance.
Discount rate: A monetary policy rate which as a rule represents the floor for short-term money market interest rates.
The CNB applies it to the excess liquidity which banks deposit with the CNB overnight under the deposit facility.
Disinflation: A decline in inflation.
Effective euro area indicators: Proxy for the effect of economic activity (effective GDP) and inflation (effective producer
prices and consumer prices) in the euro area on the Czech economy. The weights used in the calculation are equal
to the shares of the individual euro area countries in the total exports of the Czech Republic to the euro area.

Glossary 40
Czech National Bank ——— Inflation Report ——— II/2020
Effective exchange rate: Shows the appreciation (index > 100) or depreciation (index < 100) of the national currency
against a basket of selected currencies for a certain time period relative to a base period. The weights applied in the
basket are the shares of major trading partners in foreign trade turnover.
Escape clause: Excuses the central bank from its obligation to hit the inflation target. In the flexible inflation targeting
regime, it is applied in the event of large shock changes in exogenous factors (particularly supply -side shocks,
e.g. indirect tax changes) that are completely or largely outside the purview of central bank monetary policy.
Euro area: The territory of all Member States of the European Union that have adopted the euro as a single currency
pursuant to the Treaty Establishing the European Community.
Experimental CPIH price index: Unlike the Consumer Price Index (CPI), the CPIH includes prices of older property,
i.e. the transactions that households carry out between themselves. The weight of housing is therefore substantially
higher. This index can be viewed as an experimental analytical tool for macrofinancial considerations. For details,
see BOX 1 in Inflation Report III/2017.
Financial account: Records transactions connected with the creation, liquidation and change in ownership of the
financial assets and liabilities of the government, the banking and corporate sectors and other entities vis -à-vis the
rest of the world. It consist of direct investment, portfolio investment, other investment and financial derivatives
transactions.
Fiscal impulse: A variable taking into account the effect of fiscal policy on economic activity in the short run.
Fiscal stance: The annual change in the general government structural balance (in percentage points). A positive
figure indicates fiscal restriction and a negative figure indicates fiscal expansion.
Food prices: In CNB documents, the term food prices refers to the consolidated category of prices of food and non -
alcoholic beverages and prices of alcoholic beverages and tobacco.
General government balance: Revenues minus expenditures of the general government sector. A negative
government balance is called a general government deficit and a positive government balance is called a general
government surplus.
General government primary balance: The general government balance net of interest payments (i.e. debt service).
General government structural balance: The cyclically adjusted general government balance adjusted for
extraordinary one-off operations. It captures the structural configuration of fiscal policy.
General unemployment rate: Covers the 15–64 age group (as measured by the ILO methodology in the LFS). It is the
ratio of the number of unemployed persons to the labour force (i.e. the sum of employed and unemployed persons)
in the given age group.
Gross domestic product (GDP): The key indicator of economic development. It represents the sum of the value added
by all economic sectors. In terms of use it consists of expenditure on final consumption (consumption of households,
the government and non-profit institutions), gross capital formation (fixed investment and change in inventories) and
foreign trade (net exports of goods and services).
Gross operating surplus and mixed income of the household sector: Gross operating surplus – as a part of the gross
disposable income of households – is the difference between gross value added in the household sector and the
sum of compensation of employees and other taxes less other subsidies on production in this sector. Gross mixed
income is generated only in the household sector, where remuneration for labour performed by a firm ’s owner or by
family members cannot be distinguished from the entrepreneurial profit of the owner.
Housing transaction prices: An internationally comparable House Price Index (HPI), which measures movements in
the price level of apartments and houses including related plots of land according to a single harmonised EU
standard. It includes both new and older (previously inhabited) residential property. The source of the data is the
CZSO.
Industrial producer prices: Surveyed by the CZSO monthly on the basis of data provided by selected organisations.
Industrial producer prices are those agreed upon between the supplier and the customer inland. They exclude VAT,
excise tax, costs of transport to the customer and costs incidental to transport, and are invoiced for more important
trade cases.

Glossary 41
Czech National Bank ——— Inflation Report ——— II/2020
Industrial producer prices in the euro area: Divided into their energy and core components for the purposes of the
g3+ projection model. The core component approximates price developments in foreign industrial sectors affecting
the price competitiveness of Czech exports. By contrast, the energy component captures price developments in
foreign industrial sectors most sensitive to oil prices.
Inflation: Commonly, inflation is considered to be recurring growth of most prices in the economy. It means a decrease
in the real value (i.e. purchasing power) of a given currency relative to the goods and services which consumers buy.
If there is inflation in the economy, consumers need ever more currency units of the given country to buy the same
basket of goods and services. In practice, inflation is measured by the increment of the consumer price index.
Inflation pressures: Determined in the CNB’s modelling system by real marginal costs in the consumption sector and
are divided into domestic (in the intermediate goods sector) and imported (in the import price sector).
Inflation rate: The increase in the average (basic) consumer price index for the last 12 months relative to the average
for the previous 12 months.
Inflation target: The level of consumer price inflation that the CNB endeavours to achieve, set publicly and well in
advance.
Labour efficiency: Affects the quantity of output per unit of labour. From a model perspective, it is the productivity of
the production factor of labour in the Cobb-Douglas production function. A rise in labour efficiency enables a higher
real volume of output to be produced using the same quantity of production factors. It therefore increases suppl y and
causes the price of output relative to inputs to go down.
Loan-to-value ratio (LTV): The ratio of the amount of a loan to the value of the property securing the financing.
Lombard rate: A monetary policy interest rate which provides a ceiling for short-term interest rates on the money
market. The CNB applies it to the liquidity which it provides to banks overnight under the lending facility.
Market services prices: Surveyed by the CZSO monthly. Market services prices comprise prices of domestic freigh t
transport, postal and telecommunications services, banking and finance and insurance and sewerage charges.
Monetary aggregates: Represent the amount of money in the economy and are calculated from the liquid liabilities of
a monetary nature of resident monetary financial institutions (the “money-issuing” sector) to other resident sectors
(the “money-holding” sector). Besides households, the latter include non-financial corporations and non-monetary
financial institutions, as well as local government authorities and social security funds (excluding central
government). The Eurosystem has defined a narrow (M1), an intermediate (M2) and a broad aggregate (M3). These
aggregates differ with respect to the degree of moneyness of the assets of residents of the Czech Republic included.
The monetary aggregates also include liquid assets denominated in foreign currency of residents of the Czech
Republic which are held with monetary financial institutions located in the Czech Republic. Narrow money (M1)
consists of currency in circulation and overnight deposits. Intermediate money (M2) comprises narrow money (M1)
and, in addition, deposits with an agreed maturity of up to two years and deposits redeemable at notice of up to three
months. Broad money (M3) comprises M2 and marketable instruments issued by the monetary financial institutions
sector. Certain money market instruments, in particular money market fund shares/units, and repurchase
agreements, which are close substitutes for deposits, are included in this aggregate.
Monetary conditions: Represent the combined effect of interest rates (the interest rate component of the monetary
conditions) and the exchange rate (the exchange rate component) on the economy. These are the key variables
through which monetary policy can affect economic activity and, through it, inflation. Interest rates and the exchange
rate do not necessarily affect the economy in the same direction.
Monetary policy horizon: The time horizon which monetary policy-makers focus on when making decisions and which
takes into account the monetary policy transmission lag. This horizon is about 12–18 months ahead.
Monetary policy interest rates: Short-term interest rates associated with monetary policy-making. They comprise the
two-week repo rate, the discount rate and the Lombard rate.
Monetary policy-relevant inflation: Inflation to which monetary policy reacts. It is defined as headline inflation adjusted
for the first-round effects of changes to indirect taxes.
Money market: The part of the financial markets which is used to obtain short-term loans and where debt instruments
maturing in less than one year are traded. T-bills are typical securities traded on this market. Within this market the
CNB carries out its repo operations.

Glossary 42
Czech National Bank ——— Inflation Report ——— II/2020
Nominal costs in the consumption sector: These comprise output prices in the intermediate goods sector and import
sector, as final consumption goods are produced using inputs from these sectors. In addition, the import sector is
divided into a component importing energy and a component importing other goods and services. Import prices are
divided analogously (for a more detailed description of the breakdown of foreign prices into their core and energy
components, see “Industrial producer prices in the euro area”). They also include price convergence, which
approximates the productivity differential between the tradables sector and the non-tradables sector and its price
effect, known as an analogy to the Balassa-Samuelson effect.
Nominal costs in the intermediate goods sector: Co-determined by prices of production factors, i.e. labour costs in
the market sector and the price of capital. In addition to these components, they are determined by labour efficiency.
In addition to domestic and external demand, the price of capital reflects the price deflator of fixed investment, which
is affected by movements in the prices of imported capital goods.
Nominal unit labour costs: The labour costs needed to produce a unit of output. Nominal unit labour costs are
calculated as the ratio of the nominal volume of wages and salaries to GDP at constant prices (both seasonally
adjusted).
Non-tradables prices: Prices of items in the CZSO consumer basket which have the nature of services. These items
can be divided into administered (e.g. water supply and sewerage collection charges, waste collection charges, public
transport, electricity and gas, health care and education) and other (e.g. imputed rent proxying for housing prices,
rental housing, repair services, recreation and accommodation, restaurants and canteens, body care services and
financial and insurance services). These other items are included in core inflation.
Primary income: An item on the current account of the balance of payments comprising income from labour, capital,
financial resources provided and non-produced non-financial assets (wages and salaries, dividends, reinvested
earnings, interest, rent as well as taxes and subsidies on production and on imports, which represent a part of the
financial flows vis-à-vis the EU budget). In a more detailed breakdown, primary income consists of three balances:
compensation of employees, investment income and other primary income.
Repo rate: The CNB’s key monetary policy rate, paid on commercial banks ’ excess liquidity as withdrawn by the CNB
in two-week repo tenders.
Secondary income: An item on the current account of the balance of payments covering offsets to real and financial
resources provided or acquired without a quid pro quo (subsidies and contributions vis -à-vis the EU budget and EU
funds, pensions, foreign assistance, benefits, etc.)
Share of unemployed persons: The ratio of available job applicants aged 15–64 to the population of the same age.
Tradables prices: Prices of items of the CZSO consumer basket which are included in core inflation and have the
nature of goods. They include, for example, clothing, footwear, equipment for housing and gardening, transport
equipment and IT equipment. However, this category excludes prices of food, alcohol, tobacco and fuels, which
follow specific patterns.
Unemployment rate: The ratio of the number of unemployed persons to the total labour force. We distinguish between
the general unemployment rate, as determined by the CZSO according to International Labour Organisation
methodology, and the share of unemployed persons, as determined by the Ministry of Labour and Social Affairs.
Whole-economy labour productivity: Calculated as the ratio of seasonally adjusted GDP to employment (i.e. including
the effect of taxes and subsidies on products). Labour productivity in individual sectors is calculated as the ratio of
gross value added to employment (i.e. excluding taxes and subsidies on products).


Key macroeconomic indicators 44
Czech National Bank ——— Inflation Report ——— II/2020
Key macroeconomic indicators
2011 2012 2013 2014 2015 2016 2017 2018 2019 2020 2021
DEMAND AND SUPPLY
Gross domestic product
GDP CZK bn, constant p. of 2010, seas. adjusted 4028.8 3999.6 3980.2 4088.2 4308.4 4409.9 4610.5 4740.8 4859.1 4472.0 4652.2
GDP %, y-o-y, real terms, seas. adjusted 1.8 -0.7 -0.5 2.7 5.4 2.4 4.5 2.8 2.5 -8.0 4.0
Household consumption %, y-o-y, real terms, seas. adjusted 0.3 -1.2 0.5 1.8 3.8 3.5 4.4 3.1 3.0 -4.8 4.2
Government consumption %, y-o-y, real terms, seas. adjusted -3.2 -2.0 2.5 1.1 1.9 2.7 1.3 3.4 2.6 4.0 2.1
Gross capital formation %, y-o-y, real terms, seas. adjusted 1.8 -3.8 -5.1 8.6 13.1 -4.4 4.3 5.5 3.3 -11.5 4.6
Gross fixed capital formation %, y-o-y, real terms, seas. adjusted 0.9 -3.0 -2.5 3.9 10.3 -3.2 4.0 7.5 2.7 -9.8 4.8
Exports of goods and services %, y-o-y, real terms, seas. adjusted 9.2 4.4 0.2 8.7 6.2 4.1 7.1 4.4 1.0 -21.4 15.6
Imports of goods and services %, y-o-y, real terms, seas. adjusted 6.7 2.8 0.1 10.1 6.9 2.6 6.3 5.9 1.5 -18.3 16.0
Net exports CZK bn, constant p. of 2010, seas. adjusted 193.5 245.8 249.5 232.7 225.0 282.8 330.2 291.7 276.0 101.9 102.7
Coincidence indicators
Industrial production %, y-o-y, real terms 5.9 -0.8 -0.1 5.0 4.3 3.4 6.5 3.0 -0.2 - -
Construction output %, y-o-y, real terms -3.6 -7.6 -6.7 4.3 6.8 -5.6 3.3 9.2 2.7 - -
Receipts in retail sales %, y-o-y, real terms 1.7 -1.1 1.2 5.5 7.7 6.1 4.5 2.7 3.7 - -
PRICES
Main price indicators
Inflation rate %, end-of-period 1.9 3.3 1.4 0.4 0.3 0.7 2.5 2.1 2.8 - -
Consumer Price Index %, y-o-y, average 1.9 3.3 1.4 0.4 0.3 0.7 2.5 2.1 2.8 2.8 2.1
Regulated prices (14.58%)* %, y-o-y, average 4.7 8.6 2.2 -3.0 0.0 0.2 0.0 1.8 4.4 3.2 1.5
Food prices (incl. alcoholic beverages and tobacco) (26.41%)* %, y-o-y, average 4.3 2.9 3.1 1.8 0.1 0.2 3.6 1.6 2.6 4.9 1.3
Core inflation (55.61%)* %, y-o-y, average -0.4 -0.3 -0.5 0.5 1.2 1.2 2.4 2.1 2.7 2.0 1.9
Fuel prices (3.40%)* %, y-o-y, average 7.2 6.0 -2.1 0.2 -13.5 -8.5 6.7 6.3 -0.4 -9.8 3.3
Monetary policy-relevant inflation %, y-o-y, average 1.9 2.1 0.6 0.2 0.2 0.5 2.5 2.1 2.9 2.7 1.8
GDP deflator %, y-o-y, seas. adjusted 0.0 1.5 1.4 2.5 1.2 1.3 1.4 2.6 3.5 4.1 2.9
Partial price indicators
Industrial producer prices %, y-o-y, average 5.6 2.1 0.8 -0.8 -3.2 -3.3 1.8 2.0 2.6 0.5 0.6
Agricultural prices %, y-o-y, average 22.1 3.3 -12.1 4.7 -6.2 -6.0 7.4 -0.2 5.8 -0.3 0.5
Construction work prices %, y-o-y, average -0.5 -0.7 -1.1 0.5 1.2 1.1 1.7 3.2 4.6 - -
Brent crude oil (in USD/barrel) %, y-o-y, average 38.2 0.7 -2.6 -8.5 -46.1 -16.0 21.7 30.5 -10.3 -37.5 1.5
LABOUR MARKET
Average monthly wage %, y-o-y, nominal terms 2.5 2.5 -0.1 2.9 3.2 4.4 6.7 7.6 7.1 2.5 5.8
Average monthly wage %, y-o-y, real terms 0.6 -0.8 -1.6 2.6 2.8 3.8 4.3 5.4 4.2 -0.4 3.7
Number of employees %, y-o-y 0.0 -0.1 1.6 0.6 2.2 2.1 1.7 1.6 0.4 -1.5 -1.3
Unit labour costs %, y-o-y 0.4 3.3 1.0 0.8 -0.5 3.3 3.6 6.5 4.5 9.0 0.5
Unit labour costs in industry %, y-o-y 0.8 5.7 5.2 -0.4 1.6 4.5 -0.9 7.0 4.2 - -
Aggregate labour productivity %, y-o-y 2.1 -1.1 -0.8 2.1 3.9 0.8 2.9 1.5 1.8 -6.1 5.1
ILO general unemployment rate %, average, age 15–64 6.8 7.0 7.1 6.2 5.1 4.0 2.9 2.3 2.1 3.5 4.8
Share of unemployed persons (MLSA) %, average 6.7 6.8 7.7 7.7 6.5 5.5 4.2 3.2 2.8 4.1 5.6
PUBLIC FINANCE
Government budget balance (ESA2010) CZK bn, current prices -109.9 -159.6 -51.1 -90.6 -28.3 34.1 76.7 49.3 15.4 -258.9 -198.4
Government budget balance / GDP** %, nominal terms -2.7 -3.9 -1.2 -2.1 -0.6 0.7 1.5 0.9 0.3 -4.8 -3.4
Government debt (ESA2010) CZK bn, current prices 1606.5 1805.4 1840.4 1819.1 1836.3 1755.1 1749.7 1734.6 1738.7 2031.8 2236.8
Government debt / GDP** %, nominal terms 39.8 44.5 44.9 42.2 40.0 36.8 34.7 32.6 30.8 37.6 38.6
EXTERNAL RELATIONS
Current account
Trade balance CZK bn, current prices 75.5 123.8 167.0 220.0 188.0 245.7 259.1 201.1 239.8 130.0 170.0
Trade balance / GDP %, nominal terms 1.9 3.0 4.1 5.1 4.1 5.2 5.1 3.8 4.2 2.4 2.9
Balance of services CZK bn, current prices 81.3 77.6 70.4 55.7 78.0 107.6 127.7 122.0 103.7 65.0 85.0
Current account CZK bn, current prices -84.8 -63.3 -21.8 7.9 11.3 74.2 83.5 22.6 -21.3 -35.0 -10.0
Current account / GDP %, nominal terms -2.1 -1.6 -0.5 0.2 0.2 1.6 1.7 0.4 -0.4 -0.6 -0.2
Foreign direct investment
Direct investment CZK bn, current prices -46.8 -121.3 7.4 -80.4 49.7 -186.5 -45.9 -51.0 -61.0 -50.0 -70.0
Exchange rates
CZK/USD average 17.7 19.6 19.6 20.8 24.6 24.4 23.4 21.7 22.9 24.4 24.4
CZK/EUR average 24.6 25.1 26.0 27.5 27.3 27.0 26.3 25.6 25.7 26.9 27.5
CZK/EUR %, y-o-y, real (CPI euro area), avg. -1.9 1.5 3.5 6.3 -0.9 -1.3 -3.4 -2.8 -1.2 2.5 1.4
CZK/EUR %, y-o-y, real (PPI euro area), avg. -3.0 2.2 2.4 5.1 -0.2 0.1 -1.8 -1.5 -1.2 0.2 2.5
Foreign trade prices
Prices of exports of goods %, y-o-y, average 1.7 2.9 1.2 3.5 -1.7 -3.1 -0.1 -0.3 0.9 -0.5 2.2
Prices of imports of goods %, y-o-y, average 4.3 4.2 -0.2 1.9 -1.9 4.0 0.9 -0.7 0.3 -1.5 2.2
MONEY AND INTEREST RATES
M3 %, y-o-y, average 1.0 5.1 5.1 5.1 7.3 9.1 11.7 6.7 6.3 8.0 5.7
2W repo rate %, end-of-period, CNB forecast = average 0.75 0.05 0.05 0.05 0.05 0.05 0.50 1.75 2.00 0.56 0.46
3M PRIBOR %, average 1.2 1.0 0.5 0.4 0.3 0.3 0.4 1.3 2.1 0.9 0.6
* figures in brackets are constant weights in current consumer basket
** CNB calculation
- data not available/forecasted/released
data in bold = CNB forecast

Key macroeconomic indicators 45
Czech National Bank ——— Inflation Report ——— II/2020
Key macroeconomic indicators
QI QII QIII QIV QI QII QIII QIV QI QII QIII QIV QI QII QIII QIV QI QII QIII QIV
1127.3 1154.8 1160.5 1167.9 1173.6 1180.5 1188.0 1198.6 1206.3 1212.3 1217.4 1223.1 1182.5 1071.2 1098.2 1120.1 1139.5 1156.2 1170.8 1185.7
2.9 5.1 5.1 5.1 4.1 2.2 2.4 2.6 2.8 2.7 2.5 2.0 -2.0 -11.6 -9.8 -8.4 -3.6 7.9 6.6 5.9
3.6 4.8 4.6 4.4 4.1 3.3 2.9 2.4 3.0 3.0 2.7 3.2 0.4 -9.1 -5.9 -4.6 -1.7 8.9 5.8 4.2
1.7 1.2 0.8 1.5 2.9 3.0 4.2 3.6 2.3 2.8 3.5 1.7 4.7 4.5 2.8 4.2 2.0 1.7 2.2 2.7
-4.1 4.0 7.4 10.1 12.1 3.7 4.9 2.0 5.3 -0.6 -0.9 9.2 -5.4 -10.5 -12.2 -17.5 -7.5 8.3 9.7 9.4
-0.7 5.5 5.0 6.1 8.5 7.0 7.7 6.9 3.6 1.5 1.1 4.6 -0.9 -12.4 -11.9 -13.6 -6.8 8.6 9.6 9.2
5.8 7.3 7.6 7.7 4.9 3.6 4.3 4.8 1.3 2.6 1.9 -1.5 -5.8 -34.2 -26.3 -18.8 -8.0 34.7 24.9 18.4
3.6 5.9 7.1 8.4 7.3 5.1 6.3 4.9 2.1 1.7 1.1 1.4 -4.0 -30.0 -22.5 -16.8 -6.5 34.6 24.9 18.1
86.0 86.8 81.2 76.1 69.3 76.4 67.3 78.7 62.5 87.1 76.1 50.3 42.0 18.1 20.3 21.6 24.6 25.1 25.3 27.7
8.4 4.3 5.5 7.8 2.3 3.2 3.5 3.2 0.8 0.0 1.7 -3.3 - - - - - - - -
0.9 7.2 1.6 3.0 14.1 7.8 12.3 4.9 3.6 3.8 1.4 2.7 - - - - - - - -
7.0 3.5 3.3 4.6 2.8 3.2 2.5 2.2 3.3 3.0 5.4 3.3 - - - - - - - -
1.2 1.7 2.2 2.5 2.3 2.3 2.3 2.1 2.3 2.5 2.6 2.8 3.1 - - - - - - -
2.5 2.2 2.5 2.6 1.9 2.3 2.4 2.1 2.7 2.8 2.8 3.0 3.6 2.9 2.6 2.4 1.7 2.1 2.1 2.3
-0.5 -0.1 0.2 0.3 1.4 1.8 2.1 1.7 3.7 4.5 4.3 5.3 4.2 3.3 2.9 2.6 1.5 1.4 1.5 1.5
3.4 2.9 3.9 4.4 2.5 2.5 1.1 0.4 1.7 2.2 2.9 3.5 4.8 5.6 5.4 3.8 2.1 0.8 0.8 1.7
2.1 2.5 2.7 2.4 1.7 1.9 2.3 2.4 2.9 2.6 2.7 2.6 2.9 2.2 1.3 1.6 1.4 2.1 2.3 2.0
15.1 7.5 1.7 2.6 -1.6 5.0 12.4 9.5 1.3 2.5 -2.1 -3.1 1.3 -16.5 -12.9 -11.1 -10.2 5.4 8.0 10.1
2.5 2.3 2.7 2.7 1.8 2.1 2.3 2.0 2.7 2.9 2.9 3.1 3.6 2.8 2.4 2.2 1.4 1.8 2.0 2.1
0.7 1.0 1.6 2.4 2.6 2.5 2.5 2.6 3.4 3.5 3.5 3.7 3.7 4.7 4.1 3.9 3.3 2.5 2.9 3.0
2.7 2.3 1.4 0.9 0.1 1.5 3.3 3.4 3.5 3.5 2.0 1.3 1.4 0.6 -0.6 0.6 -0.3 -0.2 1.7 1.2
0.2 10.1 11.4 8.2 4.0 -3.4 -2.3 1.7 6.9 11.1 6.0 -1.8 -3.6 -1.8 1.7 3.2 1.0 -0.6 -0.1 2.3
1.4 1.6 1.7 2.0 2.3 2.8 3.7 4.0 4.6 4.7 4.5 4.5 4.2 - - - - - - -
57.6 9.1 11.0 20.8 23.0 47.6 45.8 11.6 -4.8 -8.6 -18.3 -6.0 -19.3 -50.6 -39.9 -38.2 -16.3 20.4 10.4 8.3
5.1 7.2 6.7 7.8 7.8 8.1 7.9 6.5 7.5 7.2 7.0 6.7 4.2 -2.2 4.0 3.9 4.8 10.8 3.8 4.0
2.6 4.9 4.1 5.1 5.8 5.7 5.4 4.3 4.7 4.3 4.1 3.6 0.6 -5.1 1.4 1.5 3.1 8.7 1.7 1.7
1.1 1.3 2.2 2.1 2.1 2.1 0.9 1.3 1.0 0.3 0.3 -0.1 -0.5 -0.8 -1.8 -2.9 -2.7 -2.0 -0.7 0.4
3.5 3.0 3.1 4.7 5.9 7.7 7.2 5.2 4.8 4.5 4.1 4.5 6.3 9.0 11.8 8.7 4.8 0.6 -2.7 -0.6
0.5 -1.8 -2.7 0.4 4.4 8.7 8.4 6.6 5.0 4.3 3.7 3.7 0.0 0.0 0.0 0.0 0.0 0.0 0.0 0.0
1.4 3.7 3.1 3.6 2.6 0.5 1.4 1.4 1.4 1.9 1.9 2.0 -1.3 -10.2 -7.4 -5.7 -0.9 9.8 6.9 5.2
3.5 3.0 2.8 2.4 2.4 2.2 2.4 2.1 2.1 1.9 2.2 2.1 2.3 2.8 4.2 4.7 5.1 4.7 4.9 4.5
5.1 4.2 3.9 3.6 3.7 3.1 3.0 2.9 3.1 2.6 2.7 2.7 3.0 3.3 4.7 5.5 6.0 5.5 5.4 5.3
- - - - - - - - - - - - - - - - - - - -
- - - - - - - - - - - - - - - - - - - -
- - - - - - - - - - - - - - - - - - - -
- - - - - - - - - - - - - - - - - - - -
95.1 77.2 46.5 40.4 79.2 63.8 20.5 37.7 73.3 79.5 50.4 36.5 67.0 18.0 23.0 22.0 55.0 53.0 33.0 29.0
8.2 6.1 3.6 3.0 6.4 4.8 1.5 2.7 5.6 5.6 3.5 2.5 5.0 1.4 1.7 1.6 4.2 3.7 2.2 1.9
29.8 34.4 31.8 31.7 31.5 36.6 23.4 30.4 34.5 36.9 19.9 12.4 25.0 21.0 11.0 8.0 26.0 30.0 17.0 12.0
110.5 -2.1 -30.1 5.1 58.0 3.8 -58.7 19.6 40.0 25.5 -63.7 -23.1 41.0 -33.0 -41.0 -2.0 26.0 5.0 -35.0 -6.0
9.5 -0.2 -2.3 0.4 4.7 0.3 -4.3 1.4 3.1 1.8 -4.4 -1.6 3.1 -2.5 -3.0 -0.1 2.0 0.3 -2.4 -0.4
-40.3 -3.8 10.3 -12.0 17.7 -16.3 -27.0 -25.5 -4.5 -28.6 -26.6 -1.2 - - - - - - - -
25.4 24.1 22.2 21.8 20.7 21.5 22.1 22.7 22.6 22.9 23.2 23.1 23.2 24.9 24.8 24.6 24.5 24.4 24.4 24.3
27.0 26.5 26.1 25.7 25.4 25.6 25.7 25.9 25.7 25.7 25.7 25.6 25.6 27.2 27.4 27.5 27.6 27.6 27.5 27.5
-0.7 -2.6 -4.3 -6.0 -6.3 -3.7 -1.6 0.8 0.2 -0.8 -1.4 -2.7 -2.2 3.5 4.0 5.0 5.7 0.2 0.1 -0.1
0.4 -1.3 -2.5 -3.7 -4.4 -2.1 -0.5 1.3 0.6 -1.1 -1.7 -2.8 -2.3 0.9 0.3 1.8 3.9 2.1 2.6 1.4
2.2 0.9 -1.1 -2.4 -4.4 -1.6 1.6 3.4 3.0 1.7 0.3 -1.4 -2.1 -0.3 -0.6 1.1 2.8 1.6 2.6 1.7
5.1 2.9 -0.9 -3.3 -6.1 -2.3 2.6 3.5 2.8 1.6 -1.2 -1.8 -2.4 -1.9 -1.3 -0.4 1.7 1.7 2.9 2.4
10.2 12.6 12.8 11.1 8.7 6.0 5.4 6.4 5.5 6.5 6.7 6.7 8.6 9.1 7.6 6.7 5.7 4.6 6.0 6.7
0.05 0.05 0.25 0.50 0.75 1.00 1.50 1.75 1.75 2.00 2.00 2.00 1.00 0.49 0.39 0.35 0.39 0.45 0.49 0.53
0.3 0.3 0.4 0.7 0.9 0.9 1.4 1.9 2.0 2.1 2.2 2.2 2.1 0.6 0.5 0.5 0.5 0.6 0.6 0.6
20212017 2018 2019 2020

www.cnb.cz
Issued by:
CZECH NATIONAL BANK
Na Příkopě 28
115 03 Praha 1
Czech Republic
Contact:
COMMUNICATIONS DIVISION
GENERAL SECRETARIAT
Tel: +420 22441 3112
Fax: +420 22441 2179
www.cnb.cz
ISSN 1803-2419 (Print)
ISSN 1804-2465 (Online)