INFILTRATION: AN ASSESSMENT OF THE EFFECT OF...
72
INFILTRATION: AN ASSESSMENT OF THE EFFECT OF ANIMAL GRAZING ON AGRICULTURE LAND IN ABEOKUTA SOUTH WEST NIGERIA "A CASE STUDY OF COLLEGE OF ANIMAL SCIENCE FARM UNAAB" ADENLE ADEMOLA A. MATRICULATION NUMBER 02/0664 DEPARTMENT OF WATER RESOURCES MANAGEMENT AND AGRICULTURAL METEOROLOGY UNIVERSITY OF AGRICULTURE ABEOKUTA, NIGERIA A PROJECT REPORT SUBMITTED IN PARTIAL FULFILLMENT OF THE REQUIREMENTS FOR THE AWARD OF THE DEGREE OF BACHELOR OF WATER RESOURCES MANAGEMENT AND AGRICULTURE METEOROLOGY (B.WMA). IN THE DEPARTMENT OF WATER RESOURCES MANAGEMENT AND AGRICULTURAL METEOROLOGY COLLEGE OF ENVIRONMENTAL RESOURCES MANAGEMENT UNIVERSITY OF AGRICULTURE, ABEOKUTA, OGUN STATE
Transcript of INFILTRATION: AN ASSESSMENT OF THE EFFECT OF...

INFILTRATION: AN ASSESSMENT OF THE EFFECT
OF ANIMAL GRAZING ON AGRICULTURE LAND IN
ABEOKUTA SOUTH WEST NIGERIA
"A CASE STUDY OF COLLEGE OF ANIMAL
SCIENCE FARM UNAAB"
ADENLE ADEMOLA A.
MATRICULATION NUMBER 02/0664
DEPARTMENT OF WATER RESOURCES MANAGEMENT
AND AGRICULTURAL METEOROLOGY
UNIVERSITY OF AGRICULTURE ABEOKUTA, NIGERIA
A PROJECT REPORT SUBMITTED IN PARTIAL FULFILLMENT OF
THE REQUIREMENTS FOR THE AWARD OF THE DEGREE OF
BACHELOR OF WATER RESOURCES MANAGEMENT AND
AGRICULTURE METEOROLOGY (B.WMA).
IN THE DEPARTMENT OF WATER RESOURCES MANAGEMENT AND
AGRICULTURAL METEOROLOGY
COLLEGE OF ENVIRONMENTAL RESOURCES MANAGEMENT
UNIVERSITY OF AGRICULTURE, ABEOKUTA,
OGUN STATE
The project report investigates the effect of animal grazing on agricultural land at the
University of Agriculture Abeokuta. The study was conducted within the month October
when there was five days rainfall cessassional interval. Specifically the study site is the
College of Animal Science Farm of the university. The site locations used for this
experiment includes: the vegetative land, the farms old and new paddock, the animal's
foot or traffic path and the door step of the old paddock. The experiment was done in
replicates ..
The significant changes in soil structure pointed to the cause of hindrance to infiltration
rate on the old and new paddock as a result of the cfTect of grazing practices. Equally the
slow rate of infiltration as witnessed by foot path and door step are due to animal grazing
as compared to a non disturbances to infiltration rate on vegetative land.
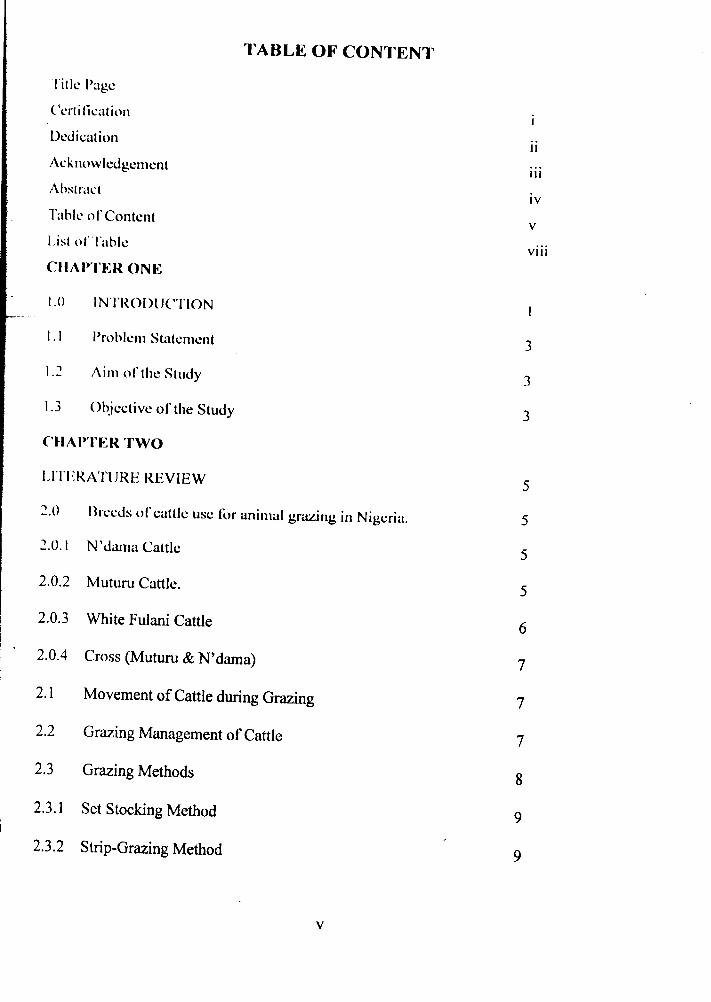
Titk Page
('crt ification
Dcdication
Acknowlcdgcmcnt
Abstract
Tahh: of Content
List of Table
CHAPTER ONE
1.0 INTRODUCTION
CHAI)TER TWO
LITERATURE REVIEW
Bn:l'ds of cattlc usc fix animal grazing in Nigeria.
2.0.1 N'dama Cattle
2.0.2 Mutum Cattle.
2.0.3 White Fulani Cattle
2.0.4 Cross (Mutum & N'dama)
2.1 Movement of Cattle during Grazing
2.2 Grazing Management of Cattle
2.3 Grazing Methods
2.3.1 Set Stocking Method
2.3.2 Strip-Grazing Method
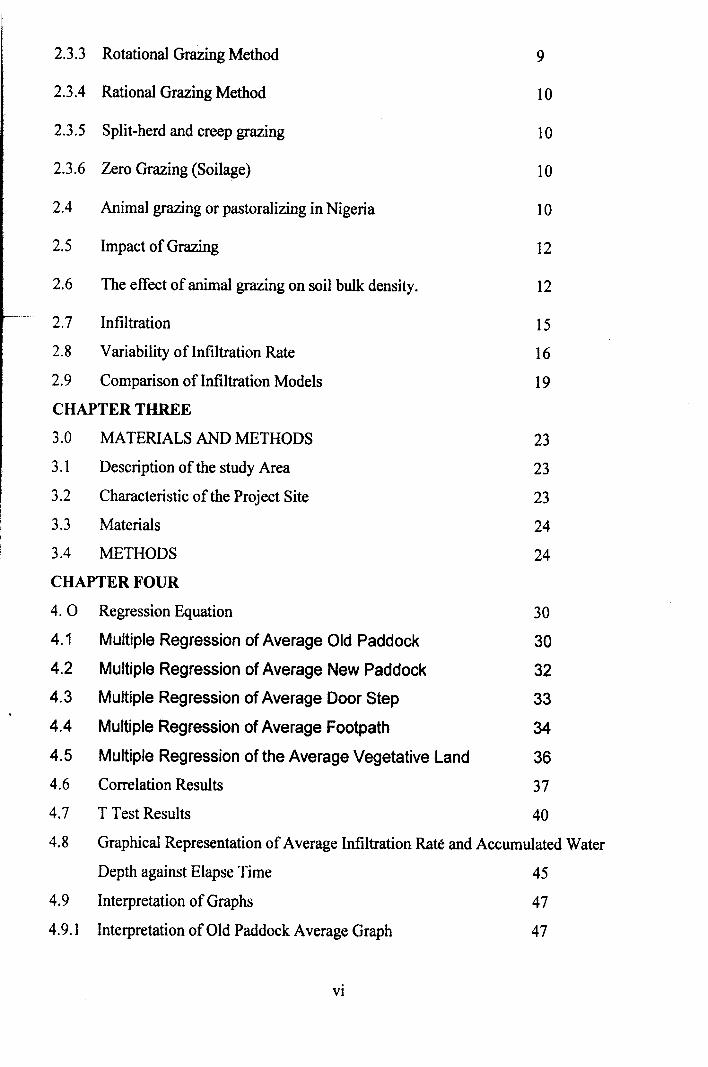
2.3.3 Rotational Grazing Method
2.3.4 Rational Grazing Method
2.3.5 Split-herd and creep grazing
2.3.6 Zero Grazing (Soilage)
T.T Infiltration
2.8 Variability ofInfiltration Rate
2.9 Comparison ofInfiltration Models
CHAPTER THREE
3.0 MATERIALS AND METHODS
3.1 Description of the study Area
3.2 Characteristic of the Project Site
3.3 Materials
3.4 METHODS
CHAPTER FOUR
4. 0 Regression Equation 30
4.1 Multiple Regression of Average Old Paddock 30
4.2 Multiple Regression of Average New Paddock 32
4.3 MUltipleRegression of Average Door Step 33
4.4 Multiple Regression of Average Footpath 34
4.5 Multiple Regression of the Average Vegetative Land 36
4.6 Correlation Results 37
4.7 T Test Results 40
4.8 Graphical Representation of Average Infiltration Rate and Accumulated Water
Depth against Elapse Time 45
4.9 Interpretation of Graphs 47
4.9.1 Interpretation of Old Paddock Average Graph 47

4.9.2 Interpretation of New Paddock Average Graph.
4.9.3 Interpretation of Doorstep Average Graph
4.9.4 Interpretation of Foot/Traffic Path Average Graph.
4.9.5 Interpretation of Vegetative Land Average Graph.
4.10 Interpretation of Average Accumulated Infiltration
CHAPTER FIVE5.0 Conclusion
5.1 Recommendation

Table I:
Table 2:
Table 3:
Table 4:
Table 5:
Table 6:
Table 7:
Table 8:
Table 9:
Table 10:
Table II:
Table 12:
Table 13:
Table 14:
Table 15:
Table 16:
Table 17:
Table 18:
Table 19:
Table 20:
Combined Table of Old Paddock Replicates
Combined Table of New Paddock Replicates
Combined Table of Door Step Paddock Replicates
Combined Table of Foot Path Paddock Replicates
Combined Table of Vegetative Land Paddock Replicates
Replicate I Old padlock
Replicate 1 New Paddlock
Replicate 1 Doorpost
Replicate I Foot path/traffic path
Replicate 1 Vegetable and ungrazed cal
Replicate 2 Old padlock
Replicate 2 New Paddlock
Replicate 2 Doorpost
Replicate 2 Foot path/traffic path
Replicate 2 Vegetable
Replicate 3 Old padlock
Replicate 3 New padlock
Replicate 3 Foot path
Replicate 3 Vegetative
Replicate 3 Door step

Man's deliberate effort to till the soil cultivate crop and rear animal for food
clothing, shelter and other purposes is an age thing. The surface of the earth that is not the
sea where these man's activities are carried out is the land which is part of the four global
J"t':llms nanwly Riosphere. Atmosphere. Hydrosphere and T.ithosphere.
The role of land to IlIlIn IInd Agriculture to nUIIl cllnnol hul h(: slresscd in Ihlll il is on land
thatth\.' whole \,fm •.lIl·s Agricultural practices are carried out (Iwena. 1(95) gave some of
till' Ii.'atun's of land that land is the solid part of the earth crust where productions like
crop 1~lrtlling Animal Itlrming can take place. It is one of lhe factors of production that
l'annot he wished away by any producer whether primary. secondary and tertiary
producer.
This glohal realm is II free gin of nature it is permanently immobile and it is
suh.kd to the universal law of diminishing return that alleet every fixed factor of product
which land is II parI.
The land needs to be rewarded with rent for it to appreciate. (Iwena, 1(95)
l'Iassilicd thl' USl'Sofland liS non-Agricultural and Agricultural uses orland. he listed non
agricultural uses of land as I lousing either for estate. township or settlement, transport
such as mad railway and airport, petroleum coal as mining uses of land and uses such a'i
school. stadia, lIlosqu\.', church, hospital as social economic uses of land. lie further listed
forestry wildlili." and game reserves, fishery. plantation and crop farm and livestock
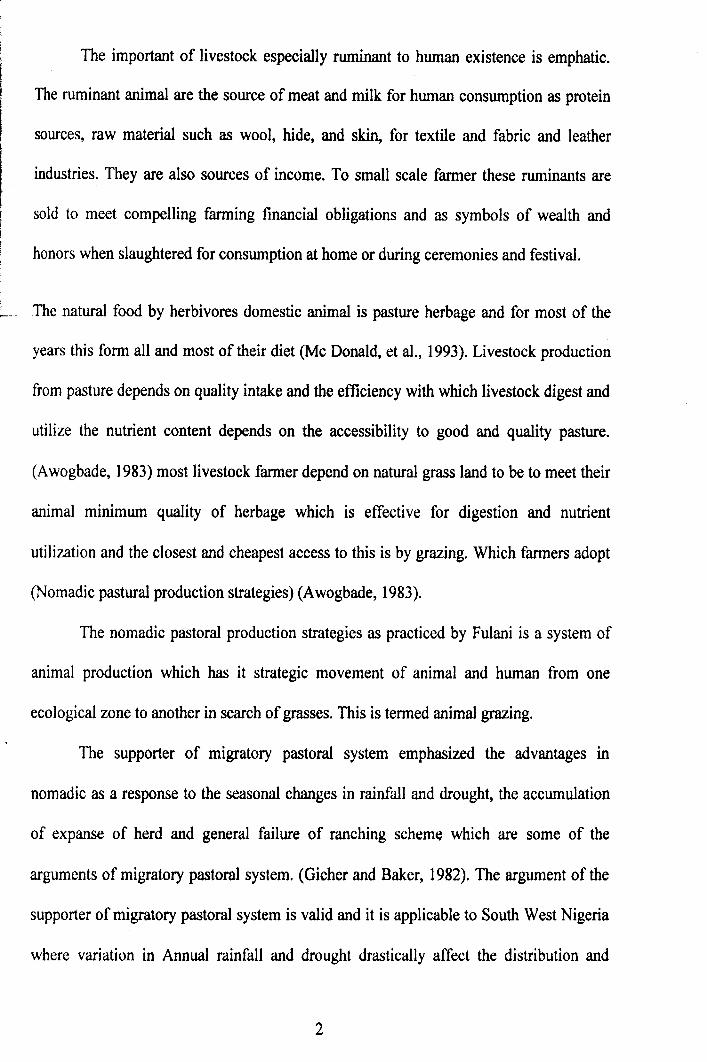
The important of livestock especially ruminant to human existence is emphatic.
The ruminant animal are the source of meat and milk for human consumption as protein
sources, raw material such as wool, hide, and skin, for textile and fabric and leather
industries. They are also sources of income. To small scale farmer these ruminants are
sold to meet compelling farming financial obligations and as symbols of wealth and
honors when slaughtered for consumption at home or during ceremonies and festival.
The natural food by herbivores domestic animal is pasture herbage and for most of the
years this form all and most of their diet (Me Donald, et aI., 1993). Livestock production
from pasture depends on quality intake and the efficiency with which livestock digest and
utilize the nutrient content depends on the accessibility to good and quality pasture.
(Awogbade, 1983) most livestock farmer depend on natural grass land to be to meet their
animal minimum quality of herbage which is effective for digestion and nutrient
utilization and the closest and cheapest access to this is by grazing. Which farmers adopt
(Nomadic pastural production strategies) (Awogbade, 1983).
The nomadic pastoral production strategies as practiced by Fulani is a system of
animal production which has it strategic movement of animal and human from one
ecological zone to another in search of grasses. This is termed animal grazing.
The supporter of migratory pastoral system emphasized the advantages in
nomadic as a response to the seasonal changes in rainfall and drought, the accumulation
of expanse of herd and general failure of ranching scheme which are some of the
arguments of migratory pastoral system. (Gicher and Baker, 1982). The argument of the
supporter of migratory pastoral system is valid and it is applicable to South West Nigeria
where variation in Annual rainfall and drought drastically affect the distribution and

availability of vegetation as herd of livestock is increasing yearly and ranching system
cannot cater for this increase even ranching system which as failed as said by (Gicher and
Baker,1-982) is not the usual practice. Migratory pastoral system is therefore the order of
the day in south west Nigeria.
1.1 Problem Statement
World wide there are more than 1.5 billion sheep and goat and 1.2 billion cattle:
this estimate suggests that this number will increase to about 1.8 billion sheep and goat
and 1.6 billion cattle by the end of this century (Botkin ef. al .. 200 I) and south west
Nigeria cannot be an exception usually these livestock are maintained on pasture and
ranges which is part of Agricultural land. This expected increase will also have a telling
impact on agricultural land; some of the likely impacts before the end of this century are
leaching, soil compaction, and reduction in soil aeration, hindrances to soil water
infiltration, water logging and flooding, runoff generation among other. This impact is
due to the negative correlation between animal grazing and agricultural land and it is
quite unfortunate that most livestock farmer are not aware of this detrimental correlation
and this calls for urgent attention.
1.2 Aim of the Study
• To carry out the infiltration assessment of the effect of animal grazmg on
agricultural land.
1.3 Objective of the Study
• To give a descriptive association between average infiltration rates on grazing
land and elapse time.

• To give an equation which describes the relationship between infiltration rate,
accumulated depth of water on grazing land and elapse time.
• . To use a statistical method to show the significant difference of the effect of
animal grazing on agricultural land
• To produce a graph showing the relationship between average infiltration rates
average accumulated infiltration and elapse time on grazing land.

-Benin and Nigeria. They are no seasonal movement. However, grazing being entirely
and concave forehead accentuated by prominent orbit arched the pull board and straight
and the horn short. They develop an umbilical cord and tights. The skin of true dwarf
breed is usually unpigmented throughout although some variation occur. It responds in
tenn of growth rate, breeding performance to improve management although their dwarf
characteristics remain constant.
2.0.3 White Fulani Cattle
(Hill,1998) Describe white Fulani as the most cosmopolitant in distribution of
_. -West African type. Homed group of Zebu cattle and this is probability due to it somewhat
better tolerant to trypanosomiasis then West African Zebu. It is triple purpose animal of
powerful frame and docile temperament well fitted to cultivation and general packed or
haulage purpose.
Although it has been improved for milk production. It is a good beef animal and
despite the slopping sacrum has well to dry season ranging and respond well to move
intensive grazing. In it natural habitat over 95% of these cattle are in the herd of Nomadic
or transhumance Fulani. For whom they represent as source of prestige as basis wealth
and investment and together with their product to provide the mean of exchange for
purchase of daily needs.
2.0.4 Cross (Muturu & N'dama)
It is a cattle breed in crossing Muturu and N'dama. They are horned type animal.
They develop an umbilical cords and tight. They are trypano -tolerant animal. It colour
varies with black and white patches with brown colour etc. the head is short and broad
with straight profile. They are usually beef type animal producing fair good carcass. They
are slow moving animal intensive grazing.
2.1 Movement of Cattle during Grazing
-~ Travel (walking) influences the energy requirement of grazing cattle (Walker et
aI., 1985;) observed a decreased in daily travel distance in five and seven years old cattle.
Comparewith three year old cow further indicating that previous grazing experiences can
influence current behaviour. The genetic cost of travel can increase maintenance
requirement from 10 to 25% in grazing animal compared with stall fed animal (Riberi et
al., 1977).
Some individual cattle range further than other, some readily range into upland,
habits while other seems contented to utilize riparian habitant (Ruthenhouse, 1984).
(Harley, 1982) determined that travel occurred at the same time as foraging and only
occasionally did animal travel without foraging. Cattle on grass land range, travelled less
per day under continuous than under short duration when confined to 30 acre paddock.
2.2 Grazing Management of Cattle
Understanding how livestock adjust their grazing behavior to content with
changing environmental and forage dynamics is paramount to development of
management strategies design to optimize livestock production (Demment et a/., 1986)
emphasis on grazing management is well desired, deserved because of via relatively low

cost and potential great return per management input (Lewis and Rolesky 1988).
However, behavior variable should be more sensitive to management changes than
nutrient intake because intake may be buffered by adaptive behaviour «Hodgson, 1982).
Grazing management is a tool that can be use to increase the amount of soil
moisture that become available for plant use (Rauzi, 1973). The reason for this is that
grazing affect plant material both standing crop and often, which has a pronounced on
infiltration (Rauzi and Smith, 1973). Secondly can affect the surface porosity of soil due
>----- to trampling and "vegetative root thinning". Thus, changing the run off of the range land.
(VanHaveren, 1983)when runoff occur, it erosive nature transports soil nutrient from the
site and can even reduce A horizon top soil depth, which decreases, the amount of water
that can be stored in the profile of the soil (Mc Ginty et al., 1991). The A horizon is rich
in organic matter, giving it the ability to hold more water than deeper soil horizon,
erosion research has shown that loss of soil reduces crop yield due to a decrease in the
amount of water available to plant (Schertz et al., 1989).Also the (USDA, 1989) reported
that a shallow soil with sloping terrain erosion may completely destroy crop productivity.
When the ability of a soil profile to store water is reduced, plant run out of water sooner.
Increasing the frequency and severity of drought. (Mc Ginty et aI, 1991). This situation
adversely affect vegetative growth and therefore has a direct effect on the productivity of
rangeland.
2.3 Grazing Methods
(Robert, 2002) defined grazing as the process of feeding on standing plant other than
browse by livestock grazing as the process of conserving or feeding on standing
vegetation as by man domestic livestock and certain species of wildlife (Lewis, 2002). He

classified the degree to which an area is cropped by grazing into ungrazed, lightly grazed
moderately grazed, closely grazed and severely grazed. (Anonymous source). A lecture
note of the department of Animal Production and Health of the University of Agriculture
classified the grazing methods as:
• Set stocking,
• Strip grazing,
• Rotational grazing,
--.-S-plit-herd creep grazing and
• Zero or soilage grazing.
2.3.1 Set Stocking Method
This is a least complicated and least productive system of grazing control. The
cattle are given free access to a given area of pasture at a predetermined stocking rate. No
part of the grazing area is reserved for conservation but the pasture may be topped.
2.3.2 Strip-Grazing Method
This described strip -grazing as a method involving short term grazing of pasture
followed by long period of rest of varying under this is a restricted grazing method, this
system grazing ensure efficient pasture utilization with little selection and wastage.
2.3.3 Rotational Grazing Method
This method involve a division of the available pasture into paddock with
permanent fence usually (2- 5 are block) with watering facilities in the entire paddock.
The animal are allow to remain in one paddock .They are retu~ed to the original paddock
after all the other have been grazed and that the interval depend on the number of

paddock and whether the programme incorporate alternate grazing and cutting for
conservation.
2.3.4 Rational Grazing Method
French man Andre Viosin, described it as an elaboration of Rotation grazing. This
method attempts to vary the rest period between grazing according to the season of the
year.
2.3.5 Split-herd and creep grazing
------ Since the physiological need of different group within a herd demand different
grazing management to meet the nutritional required of cattle. Split-herd and Creeping
grazing is an option. Cattle herd consist of cows in early-mid and late lactation, heifers
being grazed with adult cow and so on .Top grazer with high yielding cow are feed first
by allowing rotational grazing at low intensity then bottom grazer with low yielder are
followed in consideration of the requirement of the animal and their account to which
they turn herbage.
2.3.6 Zero Grazing (Soilage)
This is a long established system of grazing control. The practice is a very popular
as a result of intensification of grassland management and the improvement of machinery
for harvesting fresh herbage. The system has achieve a reduction in herbage wastage
caused by selective grazing and by trampling and fowling, yard ling the herd all the year
round and cutting the grass during the growing season for direct feeding of the animals.
2.4 Animal grazing or pastoralizing in Nigeria
The nomadic pastoral production strategy as practiced-by Fulani's is a system of
animal production which has it strategic movement of animal and human from one

ecological zone to the other. Movement. When they occur, are always in response to
seasonal variation in weather condition and Forage availability (Awogbade, 1983).
Willians,1981) has listed and described four system of pastoralism Le. grazing
management system are used through the world. Nomadism, semi-sedentary,
transhumance and sedentary. The Nomadic pastorist occupies semi and savannah land
movingin response to the seasonal grazing and water of this herd and flock.
The perennial search for grass and water place intense pressure upon him
---espeCially during period of drought, while in search for grass to take livestock into tsetse
fly area is risking infection from trypanosomiasis. Nomad have an intense infinity for
their animals knowing and naming each of them often by colour, size percentage or
month in which they are born. Their cattle respond to various commands and reprimand
either by voice or by trapping loudly on their walking stick. The trick of commanding
them to scatter when a cattle head tax collector appear on the scene and their recall
remustering after his departure are good example of this communication between the herd
men and his stock (Hill, 1998).
The policy of government at settling the transhumance livestock producer
emanate from strong belief that no sustained husbandry can be embarked upon without
the producer right to land. By setting the Nomadic pastorialist not only in a land made
available to them for both animal and crop raising ,they could also benefit more than
infrastructure provided by government to improve their well being (Ennovon, 1998).
Supporter of migratory pastoral system emphasis the advaJ.ltageof Nomadism as a
response to seasonal change in rainfall and drought. (Gicher and Baker, 1982).

2.5 Impact of grazing
Grazing has significant effect on the soil structure and damaging one are
particularly likely in dry rangeland subject to erosion as well as considerable fluctuation
in annual rainfall. Averagely such impacts require careful and continuous adjustment of
grazing intensity (Tomannek et al.,1994). Heavy grazing level are associated with
reduced rate of water infiltration (since the soil particles are liable to compact) increase
runoff, accelerated erosion (Rauzi and Smith, 1973). Any land use which changes the soil
and vegetative cover and hoof impact on soil structure (Arnold, 1981,2002) over grazing
occur when the stock rate (Animal per unit land per unit time) exceed the carry capacity
of the pasture or ranch or when livestock are not properly distributed across a ranch or
pasture.
Overgrazing tend to reduce protective vegetative cover and compact the soil (hoof
impact) causing deterioration in soil. Structure thus over grazing can lead to reduced
infiltration, increase over land flow and increase potential for non point source pollution
generation transport (Thenes et al., 1985).
2.6 The effect of animal grazing on soil bulk density.
The soil bulk density is an index of compaction and densification. The density of
any material is the ratio of it mass to volume. The relationship is used variously to define
soil particle density. Soil dry density and soil wet total bulk density (Hillel,
1980:.Campbell et aI, 1994).The soil particle density is the measure of dry soil mass to
volume of solid. The wet bulk density is the ratio of mass of soil and liquid to volume of
solid, air water .usually the dry bulk density is measure by many researchers (Campbell et
al 983 ).So whenever the term bulk density is used for soil, the dry bulk is assumed.

(Ahn, 1970, 1979), also caused irreversible increase in bulk in bulk density.

of trampling and thinning. (Augers, 1995) Calculated the static ground pressures exerted
by mature cattle to be in the order of 24 pounds per square inch at stand still. pressures
will he limf times thWl Wllount as the animal moves and the weight is trWls1erred
hetween hoof (Foth,1990).Thus it is logical that as the stocking increases, the effect of
additional trampling will be and measurable (Hartge,1994) Bulk density is then a
function of the root mass that occupies the soil column. Since above ground foliage is
proportional to the roof mass, increased grazing will also increase bulk densities.
However, the ability of livestock to alter soil bulk densities is not solely a function of
stocking densities.
Pre existing soil texture and soil and moisture conditions are important variables to
consider when investigating the relationship between soil and grazing
intensity(Hudson,1965).Soil physics dictates that wet soil will compact more readily than
dry soil because of the lesser force that is required to compact a wet soil than to compact
the same soil to the same density when dry(Hudson, 1995).Given that geographic climate
di1fers ,the ease of soil compaction due to wetness, on average, will be regionally
dependent(CuIly, I993).Soil texture is also important in determining the potential for soil
compaction a visit to beach gives insight as though the ground is heavily traveled the
coarse textured remains loose and unconsolidated.(Bartoil et aI,1992) found that coarse
textured soil bulk densities were not affected by grazing intensity. However, bulk density
was found to increase with grazing intensity on fme textured soil. This indicates that
there must be a greater awareness of the effect of over grazing on soil with significant
clay fraction.

2.7 Infiltration
Infiltration is a relatively new concept in hydrology unlike precipitatio~
evaporation, ground water and surface run off which have been observed and studies
(Horton, 1933) described the flow of water through the soil surface following (Musgrave
and Holton, 1964) the infiltration process can be seen as having three part surface entry,
the movement of water through the soil and the lastly reduction of the soil storage
capacity (Ayo Ade, 2003) said that for infiltration to occur, water has to enter the soil
surface concerned, be transmitted through the soil surface and eventually stored with. It
to make good and soil moisture deficient. Thus, the storage and movement of soil
moisture is linked with infiltration. He further said water will continue to enter the soil if
there is no hindrance to surface entry as long as water is being transmitted down with the
soil profile. Among the factor influencing the transmission capacity of soil profile are
texture and structure of successive horizontal making up the soil profile (Akitola, 1974).
The maximum rate at which water can be absorbed by a soil in a given time
condition is known as infiltration capacity of the surface (Horto~ 1933) infiltration rate
refer to the amount of the rain water that passes into the ground surface in unit time. The
actual infiltration rate is equivalent to infiltration capacity for a given surface whenever
rainfall intensity is greater or equal to the infiltration capacity (Ward, 1975).
The hydrologic significance if infiltration was identified by (Ayo Ade, 2003) as
having influence on the pattern of runoff, determination of the amount of moisture in the
soil and is related to the transpiration of plant and evaporation of soil moisture. He further
stressed that infiltration rate and infiltration capacity vary over space and time on to
several factor.

2.8 VARIABILITY OF INFILTRATION RATE
Several factors influence the process of infiltration hence the rate of infiltration
varies over both space and time. The factors controlling the rate of infiltration over a
given surface relate to the characteristics of that surface as a penneable medium as well
as characteristics of the percolating fluid.
The initial surface entry of rain water into the soil depends on the soil surface and
surface cover conditions. Studies have shown that vegetation is one of the most important
factors affecting surface entry of water. Vegetation or mulches protect the soil surface
from rainfall impact. Infiltration is reduced by surface compaction, the in-washing of fine
particles into surface pores and by frost. On the other hand, sun cracks and vegetation
cover favors infiltration. Infiltration tends to be greater in areas with vegetation cover
rather than bare ground because vegetation forces water to infiltrate by reducing surface
water movement and also reduces compacting of the surface by raindrops. (Ward, 1975).
The rate of downward transmission of water through the soil profile is controlled
by the characteristics of the various horizons constituting the soil profile. The most
relevant soil properties are texture and structure which detennine to a large extent the
degree of penneability of the soil. As the water passes into the soil, the available storage
capacity in the soil decreases. The storage capacity of the soil may therefore directly
affect the rate of infiltration of rain water during rain storm as infiltration rates tends to
diminish as the storage capacity is depleted. The storage capacity of any soil horizon as
mentioned earlier depends on porosity, thickness of the horizon and the amount of water
already present. The nature and magnitude of the porosity of-a given soil horizon in turn
depend on texture, structure, organic matter content, biological activity and degree of root

penetration. Organic matter promotes a crumb structure and thus improves permeability.
Also, massive root system perforates the soil making it unconsolidated and porous.
Intense biological activity in the soil o[pens the soil up resulting in high entrance capacity
(Musgrave and Holton, 1964).
The characteristics of the percolating rain water may also hinder or favours have
infiltration rates. Clcar water will infiltrate more eao;ily and quickly than muddy watcr
pollllll..-d by tine clays and colloids.
The suspendcd matcrials in the infiltrating water block the fine pores through
which watcr has to pass. Salts atTect the viscosity of water and may form complcxes with
the soil colloids, especially in alkali soils. Viscous water does not infiltrate as easily or
quickly as non-viscous water. Also, warm water infiltrates bettcr than cold water as
shown by the greater proportion of rainfall that occurs as runoffs in temperate regions in
the cool months of spring and autumn compared to the warm summer months. Rate of
evaporation is admittedly another important factor. Thus, the clarity, temperature and
viscosity of the percolating water are the major characteristics which can hinder or
encourage high rates of infiltration, all other things bcing equal.
A further factor which influcnces the amount of water that infiltrates into thc soil
is. of course, the time the water has to infiltrate. This depends on the slope of the ground
surface. On steep slope for instance, watcr will movc rapidly over the surface and will
thus have little time to infiltrate. In contrast, in depressions or on flat surfaces will be held
until it infiltratcs or is othcrwise cvaporated {Jackson] 977}.
Infiltration rates are expressed in units of depth of water that passes into the ground
surface per unit of time, usually an hour. Infiltration rate is .obviously higher when the

soil is dry and can absorb much moisture than after it has been wetted. Thus, during a
given rainstorm we fmd that the infiltration rate decreases with time and eventually
assumes a near constant uniform value. Values of infiltration capacity earlier defined are
based usually on this near constant infiltration rates arrived at the end of a test run using
one of the infiltrometers described above.
Rates of infiltration decreases with time for a given rain storm for two main
reasons. First the wetting of the soil at the beginning of the rain causes granules of clay or
silt to extend thus closing some of the pore spaces in the soil. Second, the film of water
surrounding each soil grain forms a net of interconnected veins of water offering
frictional resistance to the infiltrating water. This slows down the rate of downward
movement of the water, thus slowing the rate of entrance of new water from the surface
{Leopold, 1974}. The frictional resistance offered increases with the depth of wetting in
the soil.
Available data on infiltration rates suggests that the values are relatively low in
the tropics mainly because of high rainfall intensities. This leads to considerable runoffs
and soil erosion and has an adverse effect on the amount of soil water available for plant
growth {Jackson 1977}.
Minimum infiltration rate vary considerably between soil types. Infiltration rates
also vary with soil texture. In general, sandy soils have higher infiltration rates than clay
because of their higher permeability and effective porosity. Human activity such as
grazing, cultivation and urbanization also affect infiltration rates. Overgrazing will reduce
infiltration rates and encourage high surface runoffs and soil erosion. This is because
overgrazing leads to destruction of the vegetation and the compaction of the soil surface

due to trampling by grazing animals. Arable farming also tends to reduce infiltrationand
favor greater water yield and the increased possibility of erosion, unless adequate
protective cover for soil especially in mountainous steep sided and high rainfall
environments. The forest cover encourages infiltration and thereby reduces storm flow

water scientist, and a large member of model for its computation has been developed.
Infiltrationmodels can be classified. In general into three groups (Mishra et al., 1999):
I. Physically based (or theoretical or mechanistic),
2. Semi-empirical and
3. Empirical, physically based models rely on the law of conversation of mass and the
Darcy law
Depending on the consideration of dimensionality, flow dynamics hydraulic
conductivity-capillary head, moisture content retention relation, and initial and boundary
condition, physically based models of varying complexity have been derived. Example of
such models are the models of Green and Ampt (1911), Phillips (1957, 1969), Mein and
Larson (1976 & 1973), Parlange (1978). Among others.
Semi-empirical models employ simple forms of continuity equation often
spatially lumped and simple. Hypothesis as the infiltration rate-cumulative infiltration
relation (or the flux-concentration relation). These models are used on the system
approach popularly employed in surface water hydrology and are a compromise between
empirical and physically based models. Examples of semi-empirical models are the
models of Horton (1998), Holtan (1961), Overton (1964); Sutddlife ss (1970), Griger and
lritz (1991). Among others. Empirical models are based on data derived from either field
or laboratory experiment. Examples of such model are SCS-CN, Kostiakw (1932),
Huggins and modified by Kostiakov (Collis George (1977) models, among others.
Obviously, there are a large number of infiltration models but their suitable for
real would that clear, hence it is not always evident as to which model is bent and under
what condition. Using large field data, Skaggs et al (1969) evaluated the green-Ampt,
Horton, Holtan and Philip model. They obtained mode parameters for several
different soil a't varying initial water contents and surface condition. Adequate fit to
experimental infiltration data were obtained for all of the four model. However, the
Green-Ampt and Philip models predicted infiltration rate that were too low for times
greater than the duration of the experiment test.
The Holtan and Hortan models predicted steady state infiltration rates accurately.
Due to soil variation, crusting effects initial non-uniform soil water content, the model
parameters varied widely. Elrick DE, Bowman Dff (1964) compared the Green-Ampt,
Philip and numerical analysis gave the best agreement with observations but required
considerable input data-comparing the Green-Ampt and Philip models, FOK Y3 (1975)
showed the latter model can be derived from the former one and the maximum difference
between the models was less than 17%.
Rawls et al (1976) calibrated and compared the infiltration models of green and
Hampt (1911) horton model best represented the infiltration capacity curves. The models
of green and ampt, holtan and Phillip consistently over estimated the early portion of the
infiltration capacity curve and underestimated the later portion. Gifford (1976) examined
the suitability of horton, kostiakov and Phillip models for infiltration data collected from
a variety of mostly semi and rangeland plant community from both Australia and the
USA. Nearly 1100 infiltrometer plots were included in the analysis. His result indicated
that the horton model best fit the infiltrometer data only under certain condition.
Innes (1980) compared the green-ampt, holton, main-larson, philip and SCS-Cn
models for 10 different types of Hawii soil varying from clay to sand soil to silty clay
loam. The green-ampt, holton, main-larson, Philip models did not fit well. The mein-

larson model was found to be the best and SCS-CN performed well for dry soils but
poorly for wet conditions. Idike et al (1980) experimentally evaluated the green-Ampt
and Holtan, model generally failed to predict the delay in ponding.
Brakensiek et al (1981). Compared three versions of the combined green-ampt and main-
larson model on four different soil types using soil properties determined from laboratory
techniques and analytical methods. The observed infiltration data were divided into wet
and dry runs. All three models failed to satisfactory predict the wet runs, probably
because of change the soil properties due to reconsolidation and or formation of a surface
scale.
Only the version accounting for the entrapped air predicted satisfactory. Singh et
al (1992) evaluated the Horton and Philip models for determining the optimum slope of
graded check borders. Field evaluation revealed that the Philip model yielded values of
slope closer to the observed field values than the Horton model.
The above, discussion shows that in studies on comparative evaluation, only two
to four infiltration models have been considered, using either laboratory experiments or
held experiment and the result obtained have been mixed. Furthermore, it is not clear
which model is better and under what conditions. The models perform differently when
applied in the laboratory and in the field. The objective of this paper therefore was to
evaluate 14 popular infiltration models representing the three aforementioned groups of
models, compare their or their performance on a large set of filtration data collected in
the laboratory as well as in the field for various soil types, and finally comment on their
suitable for these soils.

3.1 Description of the study Area~~
The stud~ carned out in a part of the permanent site of the University of
Agriculture Abeokuta, College of Animal Science farm precisely. The university is
in which Abeokuta is found is Ogun state which lies with latitude 6CN and sCN and
camaceous at the basal considered thickness of clay, sand, shale of the continental
margm.
Generally the study area has a gentle slope which is valley determinate in the
rivers and streams in the study area.
3.3 Materials
Materials are:
• Infiltrometcr,
• soil moisture meter (moisture tester),
• Stop watch,
• SOL gallon,
• Meter rule,
• Graduated cup,
• Paper tape,
• Weighing Scale,
• Weighing vessel,
• Scoop,
• AbsorbenUReagent (Carbide)
• Scrubbing brush
• The farm layout map,
3.4 METHODS
• Site Preparation
• Experimental Set Up
• Experimental trial

• Replicate
• Plot Treatment
• Plot Management
• Data Collection
• Precautions
• Statistical Analysis
Site Preparation: It is only the site meant for control experiment that will prepare
i.e. the vegetation land (ungrazed land). This is just a piece of land not too far
from the Paddock that is not grazed on by the animals. The site is prepared
manually by using cutlass to clear the bushes and stumping if necessary. Also
include in the site preparation is site determination with the aid of rope to prevent
intruders.
Experimental Trial: Before the real experiment is carried out an experimental
trail was conducted for the purpose of reducing experimental error and for proper
understanding of the working of the instrument. The readings from the
experimental trial serves as a guide to the real reading but will be discarded and
not use during analysis.
(C) Experimental Set Up: The experimental set up involves the activities that are
general towards the usage of the infiltrometer and the moisture tester.
A. Infiltrometer set up: It involves the arrangement, positioning of the infiltrometer
to comply with the set standard. They are as follows:
(1) The cylinder is usually about 25cm deep and are formed of2mm rolled sheet.
(2) The inner cylinder, from which the infiltration is measure is 15cm in diameter.

(6) The meter rule is installed inside the inner cylinder with the help of a paper tafle.
(7) The water level in the inner cylinder is read with the field type point range or
(8) The point rod is set at the desired level to which water is to be added, water is
added to the inner cylinder from a container of known volume and gradua~ jar.
about 3 - 4th of the desired level, the matting is removed.
measurement.
(13) After the initial reading, meter rule or point gauges measurement are made at
frequent intervals to determine the amount of water that has infiltrated during the
time interval. Water is added quickly after each measurement so that a constant
average infiltration head could be maintained.
(14) Meter rule reading is taking before water level recedes more than 1cm
(15) The average depth of water maintained in the cylinder is 11cm, which is
approximately equal to water level expected in the border or basin during
irrigation.
(16) The buffer point is filled with water immediately after filling the inner cylinder
water level. The water levels in the two cylinders are kept the same.
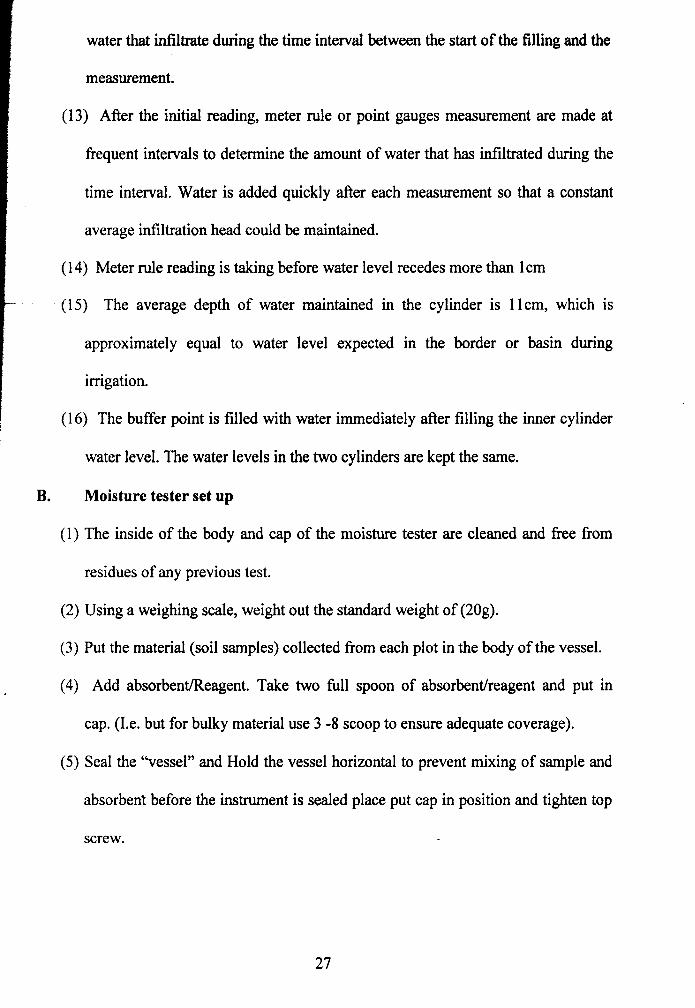
B. Moisture tester set up
(1) The inside of the body and cap of the moisture tester are cleaned and free from
residues of any previous test.
(2) Using a weighing scale, weight out the standard weight of (20g).
(3) Put the material (soil samples) collected from each plot in the body of the vessel.
(4) Add absorbent/Reagent. Take two full spoon of absorbent/reagent and put in
cap. (I.e. but for bulky material use 3 -8 scoop to ensure adequate coverage).
(5) Seal the "vessel" and Hold the vessel horizontal to prevent mixing of sample and
absorbent before the instrument is sealed place put cap in position and tighten top


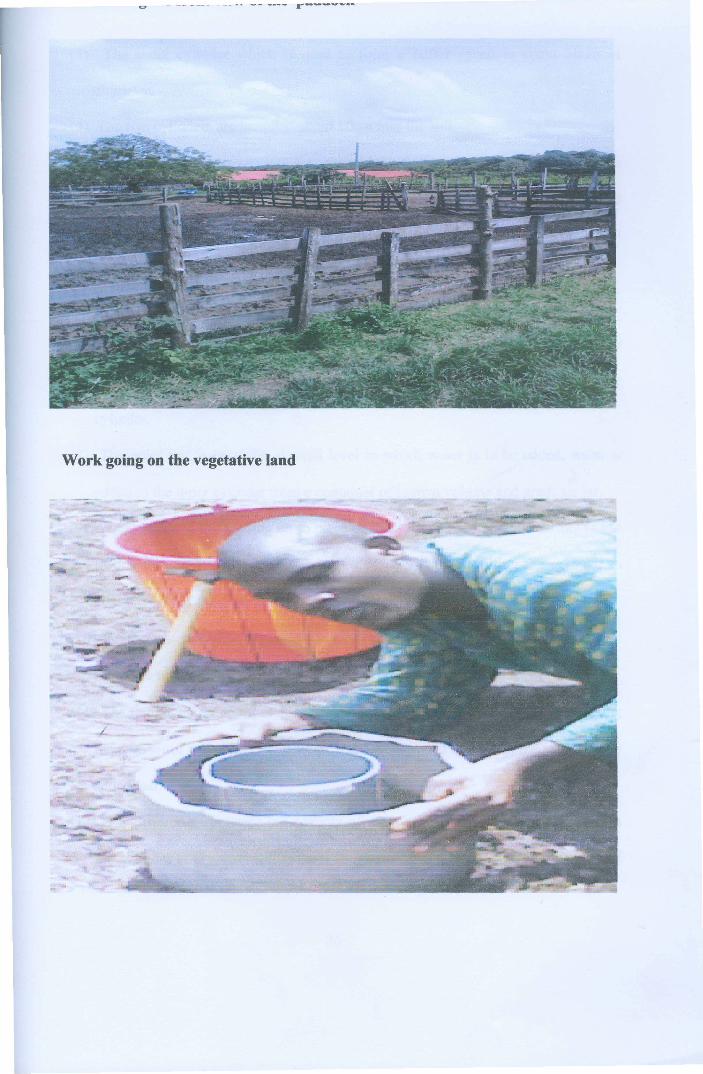
e>ldFloor of the 1JtML paddock
,~
Picture of vegetative land


• Accumulated infiltration dwing the period
• Date of experiment
• Plot number
• Replicate number
• Soil moisture content
(g) Plot Management: The following are the plot management practice that are
employed
• The control plot is weeded regularly i.e. ( a weed free plot space is ensured).
• Cattle were allowed to graze the land working throughout the foot path by the
Fulani's.
• Cattle are allows to dwell in the paddock for resting.
(h) Precautionary Measures:
• Care was taken to keep the installed depth of the two cylinders the same.
• Matting is used to prevent pudding and sealing of the surface soil.
• Error due to parallax on the plastic scale meter rule is avoided .
• Zero error is avoided on the stopwatch.
(i) Statistical Analysis:
Simple correlation and regression
T test
Graphical representation
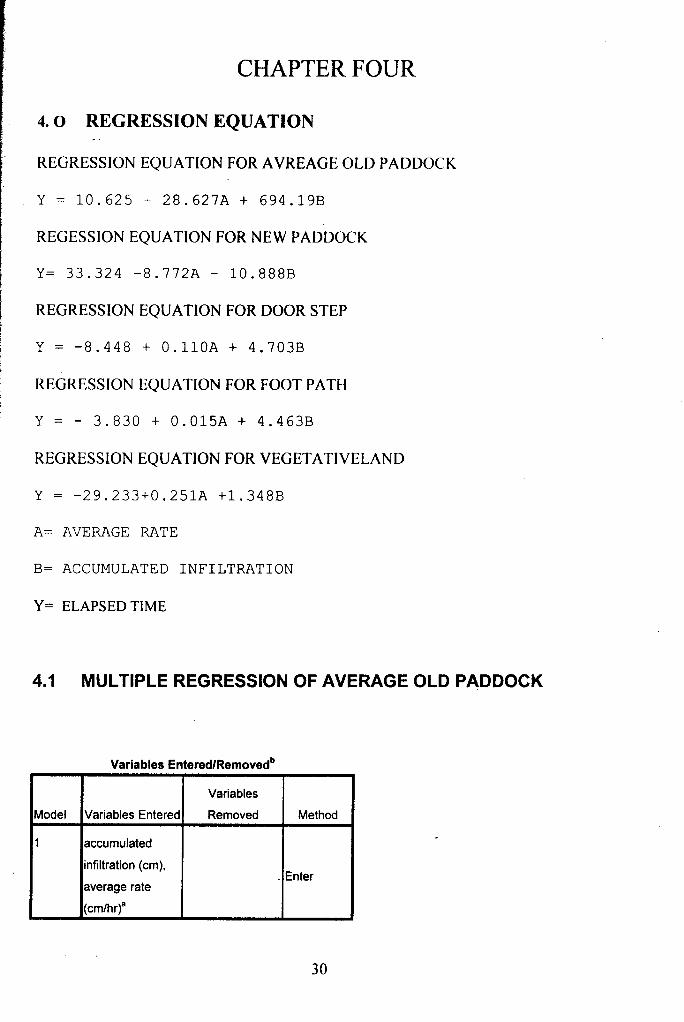
Variables
Model Variables Entered Removed Method
1 accumulated
infiltration (em),. Enter
average rate
(cm/hr)a

Adjusted R Std. Error of the
Model R R Square Square Estimate
1 .725- .525 .406 12.7776
a. Predictors: (Constant), accumulated infiltration (an), average rate
(cm/hr)
Model Sum of Squares df Mean Square F Sig.
1 Regression 1443.862 2 721.931 4.422 .0518
Residual 1306.138 8 163.267
Total 2750.000 10
a. Predictors: (Constant), accumulated infiltration (an), average rate (cmlhr)
b. Dependent Variable: elapsed time
Standardized
Unstandardized Coefficients Coefficients
Model B Std. Error Beta t Sig.
1 (Constant) 10.625 9.035 1.176 .273
average rate (cmlhr) -28.627 24.982 -.279 -1.146 .285
accumulated infiltration (em) 694.196 256.122 .661 2.710 .027

Variables
Model Variables Entered Removed Method
1 accumulated
infiltration (em),. Enter
average rate
(cmlhr)8
a. All requested variables entered.
b. Dependent Variable: elapsed time
Adjusted R Std. Error of the
Model R R Square Square Estimate
1 .4828 .232 .040 16.2459
a. Predictors: (Constant), accumulated infiltration (em), average rate
(cmlhr)
Model Sum of Squares df Mean Square F Sig.
1 Regression 638.571 2 319.286 1.210 .348·
Residual 2111.429 8 263.929
Total 2750.000 10
a. Predictors: (Constant), accumulated infiltration (em), average rate (cmlhr)
b. Dependent Variable: elapsed time

Standardized
Unstandardized Coefficients Coefficients
Model B Std. Error Beta t Sig.
1 (Constant) 33.324 5.462 6.101 .000
average rate (em/hr) -8.772 43.058 -.079 -.204 .844
accumulated infiltration (em) -10.888 9.740 -.431 -1.118 .296
Variables
Model Variables Entered Removed Method
1 accumulated
infiltration (em).. Enter
average rate
(emlhrt
a. All requested variables entered.
b. Dependent Variable: elapsed time
Adjusted R Std. Error of the
Model R R Square Square Estimate
1 .9998 .999 .999 .6129
a. Predictors: (Constant), accumulated infiltration (em). average rate
(em/hr)

Model Sum of Squares df Mean Square F Sig.
1 Regression 2746.995 2 1373.497 3.656E3 .0008
Residual 3.005 8 .376
Total 2750.000 10
Standardized
Unstandardized Coefficients Coefficients
Model B Std. Error Beta t Sig.
1 (Constant) -8.448 1.358 -6.219 .000
average rate (cmJhr) .110 .062 .028 1.769 .115
accumulated infiltration (em) 4.703 .073 1.018 64.067 .000
Variables
Model Variables Entered Removed Method
1 accumulated
infiltration (em),. Enter
average rate
(cm/hr)8

Variables
Model Variables Entered Removed Method
1 accumulated
infiltration (em),. Enter
average rate
(cmlhr)8
a. All requested variables entered.
b. Dependent Variable: elapsed time
Adjusted R Std. Error of the
Model R R Square Square Estimate
1 1.0008 1.000 1.000 .3592
a. Predictors: (Constant), accumulated infiltration (em), average rate
(cm/hr)
Model Sum of Squares Of Mean Square F Sig.
1 Regression 2748.968 2 1374.484 1.065E4 .0008
Residual 1.032 8 .129
Total 2750.000 10
a. Predictors: (Constant), accumulated infiltration (em), average rate (cmJhr)
b. Dependent Variable: elapsed time

Standardized
Unstandardized Coefficients Coefficients
Model B Std. Error Beta t Sig.
1 (Constant) -3.830 .856 -4.475 .002
average rate (emlhr) .015 .047 .003 .324 .755
accumulated infiltration (em) 4.463 .035 1.001 126.386 .000
4.5 MULTIPLE REGRESSION OF THE AVERAGE VEGETATIVELAND
Variables
Model Variables Entered Removed Method
1 accumulated
infiltration (em),. Enter
average rate
(cmlhr)8
a. All requested variables entered.
b. Dependent Variable: elapsed time
Adjusted R Std. Error of the
Model R R Square Square Estimate
1 .9968 .991 .989 1.7110
a. Predictors: (Constant), accumulated infiltration (em), average rate
(cmlhr)
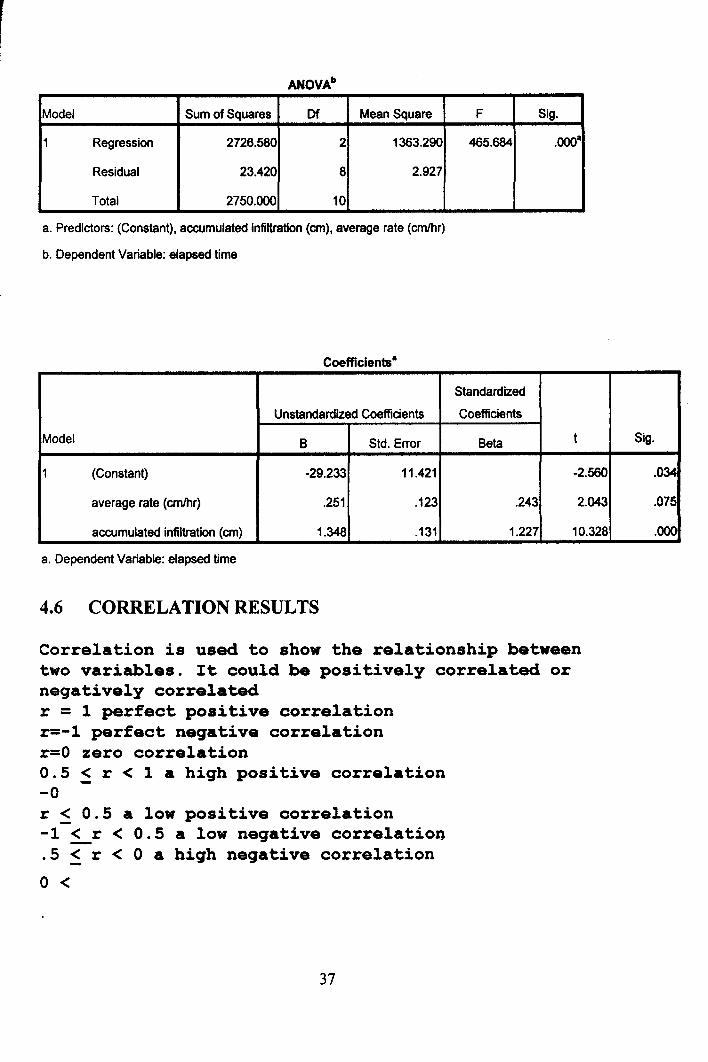
Model Sum of Squares Of Mean Square F Sig.
1 Regression 2726.580 2 1363.290 465.684 .000·
Residual 23.420 8 2.927
Total 2750.000 10
a. Predictors: (Constant), accumulated infiltration (an), average rate (cmlhr)
b. Dependent Variable: elapsed time
Standardized
Unstandardized Coefficients Coefficients
Model B Std. Error Beta t Sig.
1 (Constant) -29.233 11.421 -2.560 .034
average rate (cmlhr) .251 .123 .243 2.043 .075
accumulated infiltration (em) 1.348 .131 1.227 10.328 .000
Correlation is used to show the relationship betweentwo variables. It could be positively correlated ornegatively correlatedr = 1 perfect positive correlationr=-l perfect negative correlationr=O zero correlation0.5 < r < 1 a high positive correlation-0r < 0.5 a low positive correlation-1 < r < 0.5 a low negative correlatio~.5 < r < 0 a high negative correlationo <
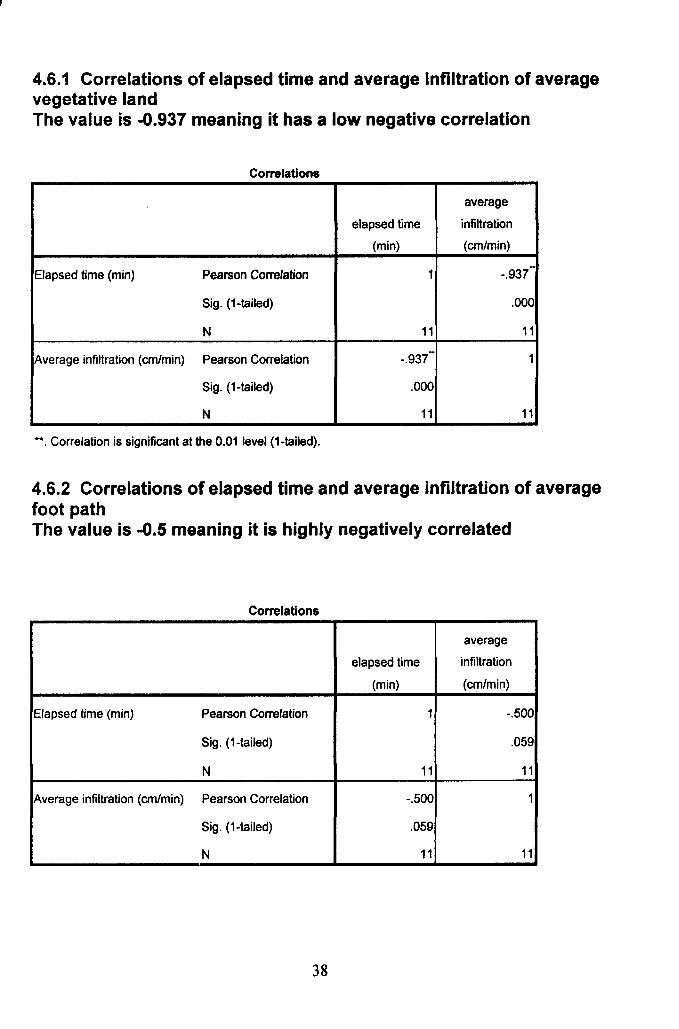
4.6.1 Correlations of elapsed time and average infiltration of averagevegetative landThe value is -0.937 meaning it has a low negative correlation
average
elapsed time infiltration
(min) (cm/min)
Elapsed time (min) Pearson Correlation 1 -.937 -5ig. (1-tailed) .000
N 11 11
Average infiltration (cmlmin) Pearson Correlation -.937 - 1
5ig. (1-tailed) .000
N 11 11
4.6.2 Correlations of elapsed time and average infiltration of averagefoot pathThe value is -0.5 meaning it is highly negatively correlated
average
elapsed time infi Itration
(min) (cm/min)
Elapsed time (min) Pearson Correlation 1 -.500
5ig. (1-tailed) .059
N 11 11
Average infiltration (cmlmin) Pearson Correlation -.500 1
5ig. (1-tailed) .059
N 11 11
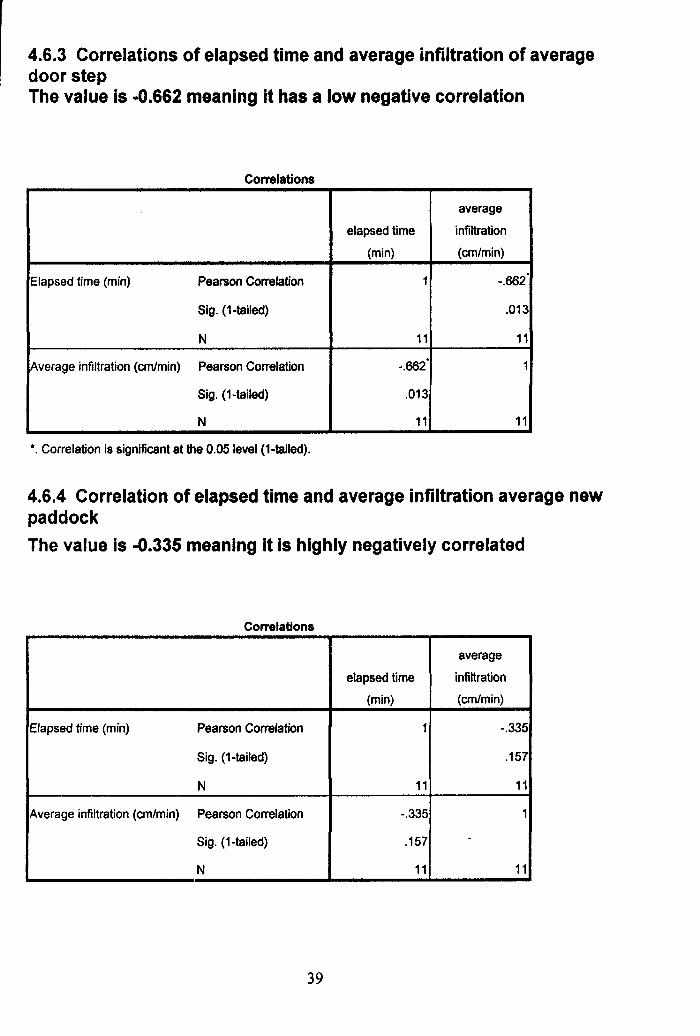
4.6.3 Correlations of elapsed time and average infiltration of averagedoor stepThe value is -0.662 meaning it has a low negative correlation
average
elapsed time infiltration
(min) (cm/min)
Elapsed time (min) Pearson Correlation 1 -.662.
Sig. (1-tailed) .013
N 11 11
Average infiltration (cmlmin) Pearson Correlation -.662.
1
Sig. (1-tailed) .013
N 11 11
4.6.4 Correlation of elapsed time and average infiltration average newpaddockThe value is -0.335 meaning it is highly negatively correlated
average
elapsed time infiltration
(min) (cm/min)
Elapsed time (min) Pearson Correlation 1 -.335
Sig. (1-tailed) .157
N 11 11
Average infiltration (an/min) Pearson Correlation -.335 1
Sig. (1-tailed) .157 -
N 11 11
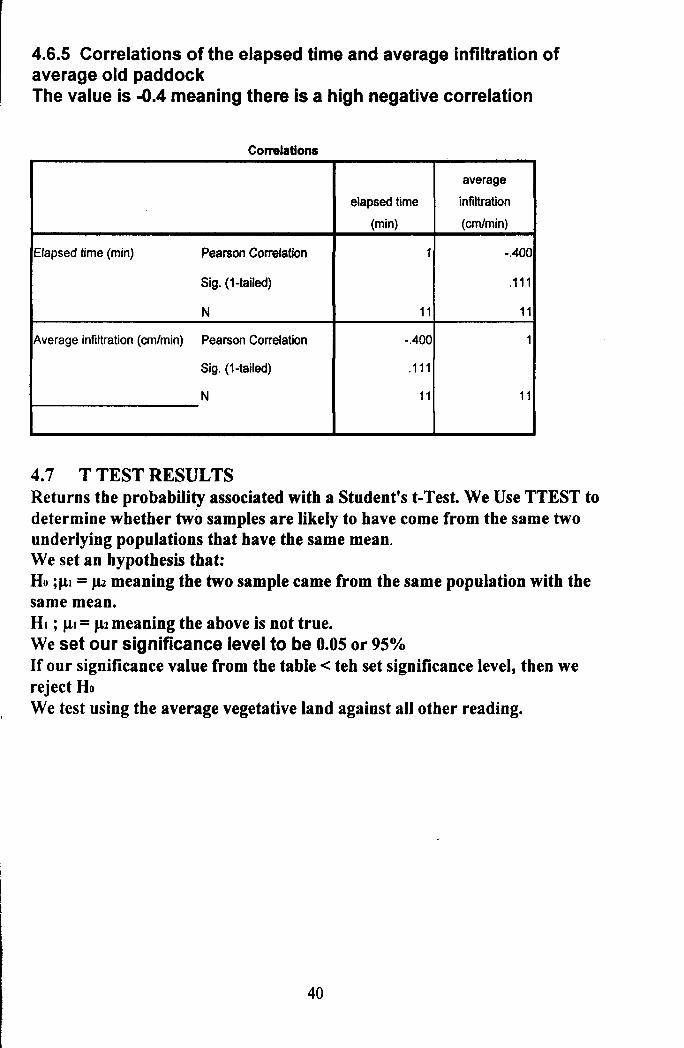
4.6.5 Correlations of the elapsed time and average infiltration ofaverage old paddockThe value is -0.4 meaning there is a high negative correlation
average
elapsed time infiltration
(min) (cm/min)
Elapsed time (min) Pearson Correlation 1 -.400
Sig. (1-tailed) .111
N 11 11
Average infiltration (cm/min) Pearson Correlation -.400 1
Sig. (1-tailed) .111
N 11 11
4.7 T TEST RESULTSReturns the probability associated with a Student's t-Test. We Use TTEST todetermine whether two samples are likely to have come from the same twounderlying populations that have the same mean.We set an hypothesis that:Ho ;J.11 = J.12 meaning the two sample came from the same population with thesame mean.HI ; J.11 = J.12 meaning the above is not true.We set our significance level to be 0.05 or 95%.If our significance value from the table < teh set significance level, then wereject HoWe test using the average vegetative land against all other reading.

4.7.1 T-Test for average vegetative land against average old paddockSince the significance level in the table below is less than 0.05, weconclude that their means are different.
Mean N Std. Deviation Std. Error Mean
Pair 1 average infiltration (cmlmin) 58.5455 11 16.01227 4.82788
average infiltration .0364 11 .12060 .03636
N Correlation Sig.
Pair 1 average infiltration (cmJmin) &11 .411 .209
average infiltration
Paired Samples Test
Paired Differences
95% Confidence
Interval of the
Difference Sig. (2-
Mean Std. Deviation Std. Error Mean Lower Upper t df tailed)
1 average
infiltration
(cm/min) - 5.85091E1 15.96305 4.81304 47.78497 69.23321 12.156 10 .000
average
infiltration-
41
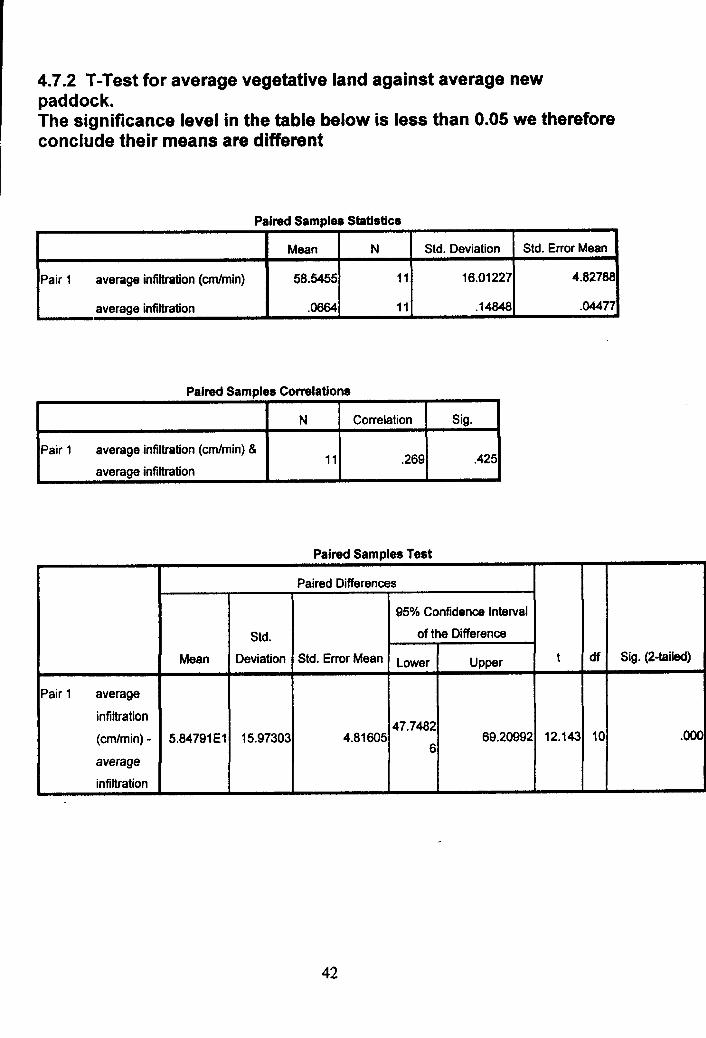
4.7.2 T-Test for average vegetative land against average newpaddock.The significance level in the table below is less than 0.05 we thereforeconclude their means are different
Mean N Std. Deviation Std. Error Mean
Pair 1 average infiltration (cmJmin) 58.5455 11 16.01227 4.82788
average infiltration .0664 11 .14848 .044n
N Correlation Sig.
Pair 1 average infiltration (cmJmin) &11 .269 .425
average infiltration
Paired Differences
95% Confidence Interval
Std. of the Difference
Mean Deviation Std. Error Mean Lower Upper t df Sig. (2-tailed)
Pair 1 average
infiltration47.7482
(cm/min) - 5.84791E1 15.97303 4.81605 69.20992 12.143 10 .0006
averageinfiltration

4.7.3 t test for the average vegetative land against door step.Since the significance level is less than 0.05, we conclude that theirmeans are different
Mean N Std. Deviation Std. Error Mean
Pair 1 average infiltration (cmJmin) 58.5455 11 16.01227 4.82788
average infiltration 14.2909 11 4.24487 1.27988
N Correlation Sig.
Pair 1 average infiltration (cmJmin) &11 .719 .013
average infiltration
Paired Differences
95% Confidence Interval of the
Std. Std. Error Difference
Mean Deviation Mean lower Upper
Pair 1 average infiltration
(cmJmin) - average 4.42545E1 13.28972 4.00700 35.32639 53.18270
infi Itration

4.7.4 T-Test for the average vegetative land against average footpath.Since the significance level from the table below is less than 0.05 wereject the null hypothesis and conclude that the two samples are notfro the same population and therefore have different means
Mean N Std. Deviation Std. Error Mean
Pair 1 average infiltration (cmlmin) 58.5455 11 16.01227 4.82788
average infiltration 14.4364 11 2.77390 .83636
N Correlation Sig.
Pair 1 average infiltration (cmlmin) &11 .585 .059
average infiltration
Paired Differences
95% Confidence
Interval of the
Std. Error Difference
Mean Std. Deviation Mean Lower Upper t df Sig. (2-tailed)
Pair 1 average
infiltration53.89
(cmfmin) - 4.41091E1 14.56362 4.39110 34.32512 10.045 10 .000306
average
infiltration

4.8 GRAPHICAL REPRESENTATION OF AVERAGEINFILTRATION RATE AND ACCUMULATED WATERDEPTH AGAINST ELAPSE TIME
0.451:"E 0.40E~0.35•! 0.30c~ 0.25l!~ 0.20;. 0.15E~0.10E80.05C 0.00
o
0.45
1:" 0.40E
0.35E~.! 0.30l!
0.25c0
I 0.20~;: 0.15c0:::E 0.10~E 0.05:lI
8 0.00c0
-.-Average-&- Acctmulative
5 10 15 20 25 30 35 40 45 50 55
Bapsed time (min)
Graph of New Paddock (Average)
~Average-e-Accumulated
5 10 15 20 25 30 35 40 45 50 55Elapsed time (min)

;, 30.00oI.; 25.00•••••~ .:: .20.00•••••.! I;:. ~ 15.00I ••~; 10.00
:I •~ 5.00'"< 0.00
o
co-; 20.0~--- ~~:E 15.0-:::E-u~ -; 10.0I __
raE~::J 5.0 -u(,)
c( 0.0
o
Graph of Door Step (Average)
.....- Average
-e- Accurrulated
5 ~ 15 W ~ ~ ~ ~ ~ ~ ~
Elapsed Time (min)
Graph of FootlTraffic path (Avera e-+-Awrage-e- Accumulated
1------I
G) 100.00••ca.."C 80.00G)••ca...
60.00 -..-- ~;;:.cc-::::e40.00- CJe-
CJ-e 20.00 -=sCJCJ 0.00 -<
0
Graph of Vegetative land (Average)
5 10 15 20 25 30 35 40 45 50 55
8apsed time (min)
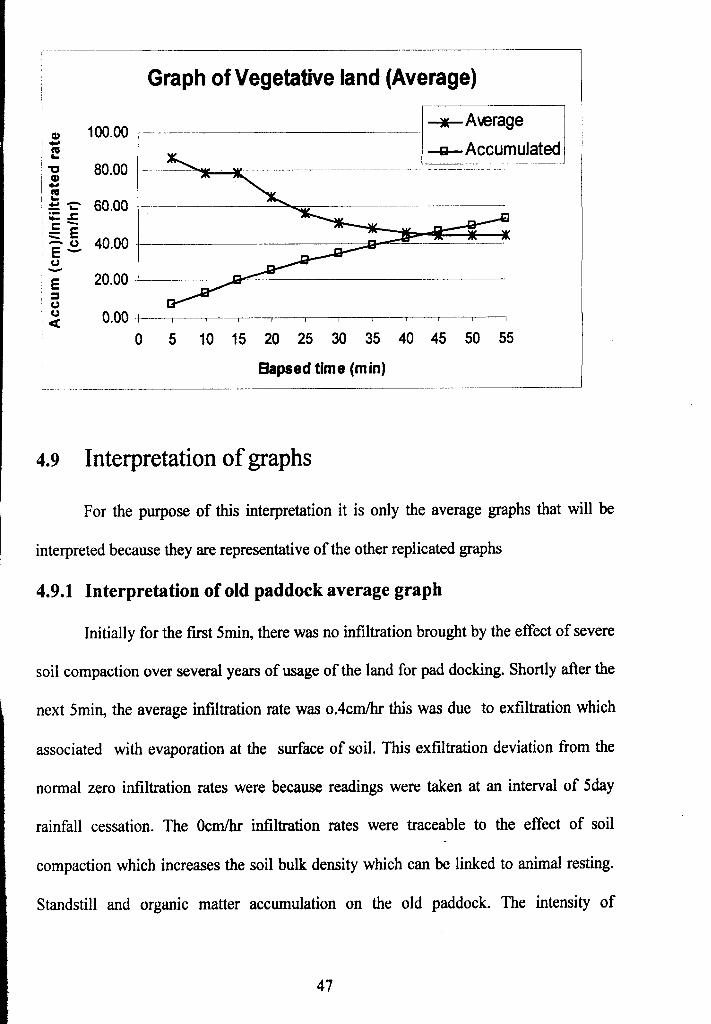
4.9 Interpretation of graphs
4.9.1 Interpretation of old paddock average graph

compaction is also the cause of Ocm/hrof infiltration rate. 1bis not unconnected with the
fact that more mature cattle are present in the herd of cattle in my study area and the exert
more pressure than when the cattle herd consist of small young animals.
4.9.2 Interpretation of new paddock average graph.
The initial rate of 0.33cm/hr at the first 5mins was due to exfiltration on the
site.fot the next 2Omin,the infiltration rate recorded was Ocm/hr.this was largely caused
by soil compaction and consolidation of the upper soil layer. Because the new paddock
has not been intensively utilized like the old paddock, The was a sudden infiltration rate
of O.4cm/hr.The soil below the upper compacted soil is not well compacted yet like the
upper soil. The water flow into the uncompacted soil filling the pore spaces. The next
O.cm/hr is because the water has saturated the pore spaces below sa more time is needed
for water to enter the adjourning soil zone but if other factor are constant it is expected
that the trend will repeat itself.
4.9.3 Interpretation of doorstep average graph
At the door step, two factor controls infiltration of water they are
The effect of animal trampling that is hoof trampling that tend to leads to the
disintegration of surface soil which one of the agent of weathering of rocks .the second
factor controlling infiltration rate of water is soil compaction, below the upper soil
surface that has been disturbed by trampling activities of the animals, there are
compacted soils, therefore the increase in the initial infiltration rate was because the
animals hoof has created spaces for water entrdIlce and for the initial 5min, the
infiltration rate of 26.80cm/hr was recorded. The drastic reduction of 14.
s60cm/hr/13.60cm/h and 12.0Ocm/hrwas due to soil compaction below. Also because

there was less or no organic matter deposition like the old paddock and new paddock,
surface water entry was quick.
4.9.4 Interpretation of foot/traffic path average graph.
At the traffic path of the animal the two factors controlling infiltration rate at the
doorstep are also applicable. Therefore the initial sharp infiltration rate of 22.80cm/hr
was due to animal trampling .while the constant of 13.60cm/hr for the rest of the
experiment's period was due to soil compaction during animal travelling. During animal
travelling the weight of the animal is transferred between the hoofs of the animal.
4.9.5 Interpretation of vegetative land average graph.
At the vegetative land, infiltration rate proceeded nonnally as expected because
there is no interference by animal. The maximum expected infiltration relte of 86.80cm/hr
for the first 5mins.further decrease continues till the end of the experiment.
4.10 Interpretation of AVERAGE Accumulated Infiltration
The resultant accumulated infiltration depth on each plot is dependent on the infiltration
rate and are both affected by similar factors.
Old Paddock
In the old paddock, for the first 5min,since there was no infiltration,
accumulated infiltration depth was O.OOcm.but 10min into the experiment, because there
was infiltration of OAcm/hr, the resultant accumulated infiltrationofO.03cm depth was
recorded. Till the end of experiment, infiltration rate of O.Ocmwas constant and the depth
of accumulated infiltration remained constant there was no surface entry of water.

In the new paddock, for the first 5min, the infiltration rate was 0.33cm/hr this
gives a resultant accumulation depth of O.03cm.and for the next adjourning 25min into
the experiment because there was no infiltration of water into the ground, The depth of
accumulated water remained constant at O.03cm.for the next 5 min (30min into the
experiment) an infiltration rate of O.40cmwas recorded. Thus the depth of accumulated
water increased to O.07cmand because there was no further infiltration till the end of the
experiment which lasted for 55mim,the accumulated infiltration depth remained at
O.07cm.
Doorstep
At the door step/for the first 5min into the experiment infiltration rate of
26.80cm/hr gave a corresponding infiltration depth of 2.23cm..when the infiltration rate
increased to 14.40cm/hr, the depth of accumulated water increased to
3.43cm.furtherly,when when the infiltration was 14.0cm/hr depth of accumulated water
increased to 4.60cm.moreover, when the infiltration was 13.60cm/hr for a time of
15min,the accumulated infiltration increased to 5.73cm,6.68cm,8.oocm
respectively..35min into the experiment, the infiltration rate of13.20cm/hr was observed,
this increased the depth of accumulated water to 9.lOcm and finally, the infiltration rate
of 12.00cm/hr was constant till the end of the experiment, Thus, accumulated infiltration
depth of water were 1O.10cm,11.1Ocm,12.10cmand 13.10cm for every five minute
respectively

Foot Pathffraffic Path
At the foot path, averagely when the infiltration rate was 22.80cm/hr, The depth of
accumulated water was 19.0cm but since the infiltration rate was constant at 13.60cm/hr
till the end of the experimental period 55min.Theaccumulated infiltration depth
increasedfrom3.03cm,4.17cm,5.30cm,6.43cm,7.57cm,8.53cm,,9.83cm, 1O.97cm, 12.1Oem
and13.0cm for every five minute interval till the end of the experiment respectively.
Vegetative Land
At the vegetative land, averagely, for the first 5min into the experiment,
infiltration rate of 86.80cm/hr gave an accumulated infiltration water depth of 7.20cm,at
10min into the experiment, infiltration rate was 78.40cm/hr and the accumulated
infiltration depth of water increased to 13.60cm.at 15min into the experiment the rate was
78,40 cm/hr with the accumulated depth of water increasing to 20.3cm.20min into the
experiment an infiltration rate of 65.60cm/hr was recorded the accumulated depth of
water increased t025.77cm.at 25min into the experiment, infiltration rate was 56.40cm/hr
with the accumulated depth of water increasing to 30,46cm.at 35min into the experiment
the, the infiltration rate was 48.00cm/hr with the accumulated depth of water increasing
38.73cm.At 40.00min into the experiment ,the infiltration rate was 46.00cm/hr with
infiltration depth increasing to 42.57cm,for the last 15min to the end of the experiment,
infiltration rate was constant 44,40cm/hr with the accumulated depth of water increasing
form 46.27cm,49.97cm,53.66cm respectively for every 5min interval.

4.10 DISCUSSION OF THE EFFECT OF ANIMAL GRAZING ON
EACH SUB PLOT.
New paddock and old paddock
On the old and the new paddock, there wiII be aeration problem caused by the
CPllspl illal ion and anollllllliat ion or organic lIlaller.the exchange or gases het ween the pore
spaces and tlK' atmosphere is hindered because or the blockage or the pore spaces
At till' doorstep and tranic path there will he aeration prohlem hut not as severe as
that or thc old ami new paddock.
Vegetntive Land
Till' vcgetHtive land is the control expcrimcnt the land will not have aeration
hl.'causc grazing practiccs arc not su~jectedto the land.
Old ~lIId new paddock.
On the old and new pHddock. water logging or water detention is likely especially
during till.' raining. This lIlight create a marshy or lIluddy terrain on the plot especially
alkr trampling but the cattle. The water logging process will be more rapid on these two
plots becausc or soil compaction and long time accumulation or organic mineral which
pr~vcnt in1iltrationo
At till' door step and trallic path there will he slIrf:lce water detention hilt it not
bas rapid as the of the old paddock and new paddock. The cause of this is connected to
th~'lkpression at the surtace which is traceable to the ellcct of soil compaction
Vc~chltivc L~lIId.
At the vegetative Jand, the rapidity or water detention is very slow even there may
be water logging the occurrence of water logging or water detention is dependent on the
characteristic of precipitation like the intensity, duration etc
Old paddock and new paddock.
On the old and new paddock., the land is depressed due to the impact tramping,
long time resting and this also gives room for water depression
Door Step and Traffic Path
The depression on the land depends on the degree of standstill but usually. The
door step have depression because of constant trampling by animal when they are about
to move out for grazing, the trampling path have depression due to continuous
stampeding by the animals along the same path on regular basis in search for grasses.
Vegetative Land
The vegetative land surface will not be depressed.

Runoff represents the excess of precipitation over evapotranspiration losses when
allowances have been made for infiltration and surface detention.
Old and New Paddock
On the old "andnew paddock runoff generation will be high and will occur rapidly
because there are zero allowances for infiltration caused by compacted soil. The increase
in runoff is increased if the paddocks are not located on a leveled topography
Door Step and Vegetative Land
Runoff generation is slower as compared with the old and new paddock
Vegetative Land
On the vegetative land, runoff generation is not as rapid or visible as that of old
and new paddock and even at door step and vegetative land.

CHAPTER FIVE
CONCLUSION AND RECOMMENDATION
5.0 CONCLUSION
It was not surprising to find out that animal grazing appear to influence the
physical properties of Agricultural land, differences in bulk density, porosity, infiltration
rate, and Accumulated depth of water were all notices which produce different effect on
Agricultural land. Due to the change in the soil structure. It was also believed that
continuous accumulation of animal waste (dung) may be one of the most critical
determinate that dictates the problem associated with Agricultural land. Also trampling
intensity is directly related to soil compaction. Thus many of the problems encounter in
grazing management arise from mainly soil compaction and Accumulation of organic
While project of this ftlture cannot be used to make definite statement due to
limitations in the number of resources available to me, it can be viewed as a valid
indicator. Therefore the information yielded by this project is important in that it is a
"piece of the puzzle" that is needed in order to serve as a linking between the problem
arising from the effect on animal grazing on Agricultural land, in order to check the
problem, caused by grazing and make sound animal grazing management decision.
From the observation and inferences made, it is therefore recommended that
effective grazing management which is the foundation of grass land base live stock
production should be employed which include:

1. Rest rotations: Rest rotation should be employed which is a management scheme
in which there is a rest period for pasture of grazing unit.
2. Rotational grazing: In which animal are removed from one grazing area to another
without regard to specific graze rest period should be employed ..
3. Stock rating: Which involves regulating the number of specific kind and classes
of animal utilizing a unit of land for a specific time period. Should be employed.
4. Stock planning: Which involves efficient planning or the number and kind of
should be employed.
Equally sustainable grass land production practices which is the basis of grass
land management should be employed this will prevent indiscriminate animal grazing
one of such is by slashing and carrying in which grasses and cut and carried to animal in
their paddock this will limit the effect of soil compaction to just their paddock.

Ahn, P.M. (1970). West African soils. Oxford University press, Oxford, Great Britain.
322 pp.
Ahn, P.M. (1979). Micro aggregation in tropical soils: Its measurement and effects on the
maintenance of soil productivity. In: r. Lal and D.l Greenland (ed) Soil physics
properties and crop production in the tropics. John Wiley & Son Ltd., Chichester,
UK. Pp.78-85.a
Anderson, lM. and 1S.I. Ingram (eds) (1993). Tropical soil biology and fertility: A
handbook of methods. Second edition. CAB International, W Eallingford. 221 pp.
Angers, D.A. and G.R. Mehuys (1993). Aggregate stability water. In: M.R. Cater (ed.)
Soil sampling and methods of analysis. Canadian Society of Soil Science/Lewis
Publishers, Boca Raton, Florida, USA. pp. 651-657.
Arnolds O.D (2002)(1981).Grazing for Change;Range and Watershed Management
Success Stories in Iowa
Akintola, 1".0. (1974) The parameters of infiltration equation of urban land-use surface,
Unpubilshed Ph.d thesis, University ofIbadan.c
Bartoli, F. ,R. Philip and G. Burtin (1992). Influence of organic matter on aggregation in
Oxisols rich in gibbsite or in goethite. i Struture; the fractal approach. Geoderma,
54: 231-257.
Bartoli, F. ,G. Burtin and J. Guerif (1992). Influence of organic matter on aggregation in
oxisol rich in gibbsite or goethite. Ii Clay, dispersion, aggregation strength and
water-stability. Geodema, 54: 259-274
Black, T.A., Gardner W.R., Tuurtell G.W. (1969). The prediction of evaporation.
Drainage & soil water storage for a bare soil. Soil science society of America
Proceedings 33: 655 - 660.
Brackensick D.L. Onstad CA. (1977). Parameter estimation of the green. AMPT equation
water Resources Research 13[2] 325-359.
Brackensick D.L. Enleman RL, Rawls W.L. (1981) variation writing texture class of soil
parameter. Transactions of the ASAE 24 [2] 335-339.
Campbell and W.Nicholaichuk (1983). Water retention equation and their relationships to
soil organic matter and particle size distribution for disturbed samples. Canadian
journal of soil Science, 63: 291-302.
Collenille, H. and E. Braudeau(1996). A soil fractionation related to soil structural
behaviour. Australianjournal of soil Research, 34: 653-669.
Culley, lL.B. (1993). Density and compressibility. In: M.R. Carter (ed) soil sampling
and methods of analysis. Canadian Society of soil Science/Lewis Publishers,
Boca Raton, Florida, USA. pp. 615-624.

Cully and R.R. Bruce (1993). A comparison of methods for measuring water-stable
aggregates: Implication for determining environmental effects on soil structure.
Geoderma, 56:87-104
Ckensick D.L. Onstad CA. (1977). Parameter estimation of the green. AMPT equation
water Resources Research 13[2] 325-359.
Collis-George N. (1977). Infiltration equations for simple soil system. Water Resource
Research 13[2] : 395-403.
Daniel 13,Eward A(1998) Environmental Science
Demment T. A and T .Y, Akes (1988).Management of Animal Grazing. Cattle Research
Journal.
De vos, lA, P.AC. Raats and E.C. Vos (1994). Macroscopic soil physical processes
considered within an agronomical and a soil biological context. Agriculture,
Ecosystems and environment, 51: 43-73
Elrick DE, Howman D.H. (1964). On an improved apparatus for soil moisture flow
measurement. Soil science society of America proceeding 28: 450-483
Ennovon CooK (1998).Influence of Forest and Rangeland Management. Effect of
Livestock Grazing.
Fok vs. (1975). A comparison of the green Ampt & philip two-term infiltration equation.
Transaction of the ASAE 28: 1007 -1075.
Foth, H.D. (1990). Fundamentals of soil science. 8th Edition. John Wiley &Sons, new
York, USA 360pp
Gicher J and E.A Barker (l982).Dietary Choice of Livestock on Rangeland and it
Implications for Magement.

Gifford G.F. (1976). Applicability of some infiltration formulae to nmgeland
infiltrometer data Journal of hydrology 28 :1-11.
Green RE. (1962). Infiltration of water into soil as influenced by antecedent moisture.
Unpublished Ph.d thesis. IOWA State University. Towa .
Green W.H., AMPT CA. 1911. Studies on soil physics, flow of air & water through soils.
Journal of Agricultural Science 4: 11-24.
Grigoryev V.Y., Iritz L. 1991. Dynamic Simulation model of vertical infiltration of water
in soil. Journal of Hydrological services 26[2] 171-179.
Hall., A .H .(1998).GrdZing Behaviuor,Herbage Intake and Grazing in Young Cattle
Veterinary .
Harley S.Y .(1982). Analysis of Animal Grazing on Free Range Management.
Hartge, K.H. (1994). Soil structure, its development and its implication for properties and
processes in soils - a synopsis based on recent research in Germany. Zeitschrift
fur Pflanzenernahrung und bodenkunle, 157: 159-164.
Hill D .H (1988).Cattle and Buffalos meat production in the Tropics.
Hillel, D. (1980a). Fundamentals of soil physics. Academic Press, New York, USA. 405
pp.
Hillel, D. (1980b). Applications of soil physics. Academics Press, New York, USA.
385pp.
Hodason, T .K (1982). Animal Grazing and the Environment.
Horn, R.,H. Taubner, M. Wuttke and Baumgard (1994). Soil physics properties related to
soil structure. Soil & Tillage Research, 30: 187-216.

Horn, R.,H. Dornzal, A. slowinska-jurkiwicz and C. Van Onwerkerk (1995), Soil
compaction processes and their effects on the structure of arable soils and the
environmental. Soil & Tillage Research, 35: 23-36.
Holtan E.E. (1933) The role of infiltrdtion in the hydrologic cycle, TrdfisactionsAmerican Geophysical union, vol. 14, pp.446-460.
Holtan H.N.; 1961. A concept of infiltration estimates in water shed engineering. ARSH
- 51,U.S. Department of Agricultural service. Washington D.C.
Horton RI. 1938. The interpretation and application of runoff plot experiment with
reference to soil erosion problems. Soil science society of America proceeding
340-348
HSU N-S, Kuo 3-T, chu W-S, 1995. Proposed daily stream flow-forecasting model for
reservoir operation. Journal of water research and management, ASCE 121[2].
132-143.
Hudson, N.W. (1965). The influence of rainfall on the mechanics of soil erosion with
particular reference to southern Rhodesia. M. sc. 'Thesis. University of Cape
Town, South Africa.
Hudson, N. (1995). Soil conservation. Third edition, Iowa State University Press, Ames,Iowa, USA. 391 pp.
Hulugalle, N.R. (1994). Effect of tied ridges and under sown stylosanthes hamata (L) on
soil properties and growth of maize in the sudano savannah of Burkina faso.
Agriculture. Ecosystems and Environment, 25: 39-51. In:A. klute (ed) methods ofsoil analysis. Part 1. physical and mineralogical methods. Second edition,
American Society of Agronomy-soil Science Society of America, Madison,
Wisconsin, USA. pp. 425-442.

Huggins L.F. Monke EJ, (1966). The mathematical Stimulation of hydrology of small
watershed. Technical report, purdne water Resources Research center, lafayette.
Idlike FI, Carson CC, Slack DC,Young RA, (1980). Experimental evaluation of two
infiltration models. Transaction of the ASAE 23 [2] 1428-1433.
Innes G. (1980). Comparison of infiltration models of disturbed soils using parameter
optimization. Unpublished M sc. Thesis, University of Tennesse. Knoxvilla
83pp
Kincaid DC,Heerman DF, Kruse EG, (1969), Application, rates 7runoff in center pivotsprankler irrigation Transaction ASAE 23 [6] 790.
Lewis G.E, and T.S Volesky (1988).The effect of Wet Composted and Untreated Cattle
Slurry and Soil Compaction on Infiltration Rate in Cultivated Soil.
Mc Guinty,Lugingbuhi, Tm Green (1191).Use of Goats to Manage Vegetation in Cattle
Pasture in the Appalachian Region.
Musgrave, G.W. and Holton H.N (1964) Infiltration, in Chow Ven T (ed) Handbook of
Applied Hydrology, McGraw-Hill, New York
Olayiwola, M.B, Buvanendral, J J and lkhatuna T.S (198"1).lntensive Fattening at
Indigenous Breed of Cattle in Nigeria.

Tomanek, H.A and S.R. Swanson (1994).Sheep Grazing Riparines and Watershed
Management. Sheep Research Journal. Special Issue p 65-71
Thenes, S,W and AC Mendel.(1985).The Cows as a Geomorphic. Agent. A Critical
View Geomorphology, 13 .p 233-253
Rauzi. A.L (1993), Foraging Behavour in Grazing Management; Ecological
Perpective.Timbre Press.Inc,Portland.
Roberito .A K, Balley Dereic,K.W,and Landry Henhouse,R.C (1982).Management of
Cattle Distribution on Rangeland 1(4), p 159-161
Schertz,R .M,and Leonards S.G (1989).Riparian Area Mangement;Grazing management
for Ripariana Wetland Area.
Walker, C J ,Bums (1985).Managing forage Availability for Animal Responses in
Temperate Grazing System Forage Land
Ward, R.C. (1975) Principles of Hydrology (2nd ed), McGraw-Hill, London.