

Inferring Relevant Social Networks from Interpersonal ... · Inferring Relevant Social Networks...
38
Inferring Relevant Social Networks from Interpersonal Communication Munmun De Choudhury 1 , Winter Mason 2 , Jake Hofman 2 and Duncan Watts 2 1 Arts, Media and Engineering, Arizona State University 2 Yahoo! Research
Transcript of Inferring Relevant Social Networks from Interpersonal ... · Inferring Relevant Social Networks...

Inferring Relevant Social Networks from Interpersonal Communication
Munmun De Choudhury1, Winter Mason2, Jake Hofman2 and Duncan Watts2
1Arts, Media and Engineering, Arizona State University 2Yahoo! Research
Background and Motivation Inferring Social Networks Network Descriptive Statistics Network-based Prediction Conclusions

6/10/2010 3
Interpersonal Communication Modes
Slashdot
Engadget
Flickr
LiveJournal Digg
YouTube Blogger
MetaFilter Reddit
MySpace Orkut

Viral Marketing, Advertizing Campaigns

Collaboration

Crisis management w.r.t. real-time events
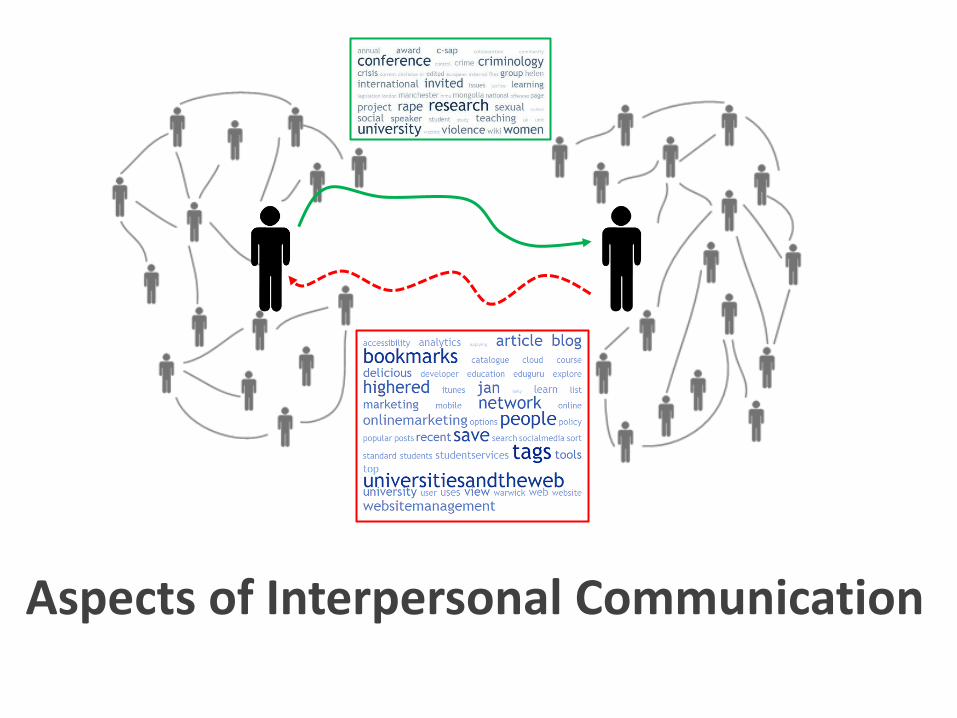
Aspects of Interpersonal Communication

Communication & Social Engagement
6/10/2010 8
Creation/evolution of social engagement
Dynamic social phenomena
Latent micro and macro behavior
I. Preferential attachment (Barabasi & Albert, 1999)
II. Homophily (McPherson, Lovin, Smith, 1998) III. Group identity (Watts, Dodds, Newman, 2002
I. Diffusion properties (Kempe & Kleinberg, 2003; Leskovec, et al, 2007)
II. Search strategies on the network (Kleinberg, 2000; Adamic & Adar, 2005
I. Community detection (Newman, 2002) II. Discovering hidden node properties (Namata,
Getoor, Diehl, 2006) III. Predicting future activity (Burt, 2000)

How to define a tie?

Defining a tie from communication data
• Reasonable definitions: – At least one communication in past year
– Average of one communication every week
– One reciprocated communication in past month
• What is the research question? – Search on network
– Information diffusion
– Uncovering hidden node properties
• One method: define a minimum threshold
6/10/2010 10
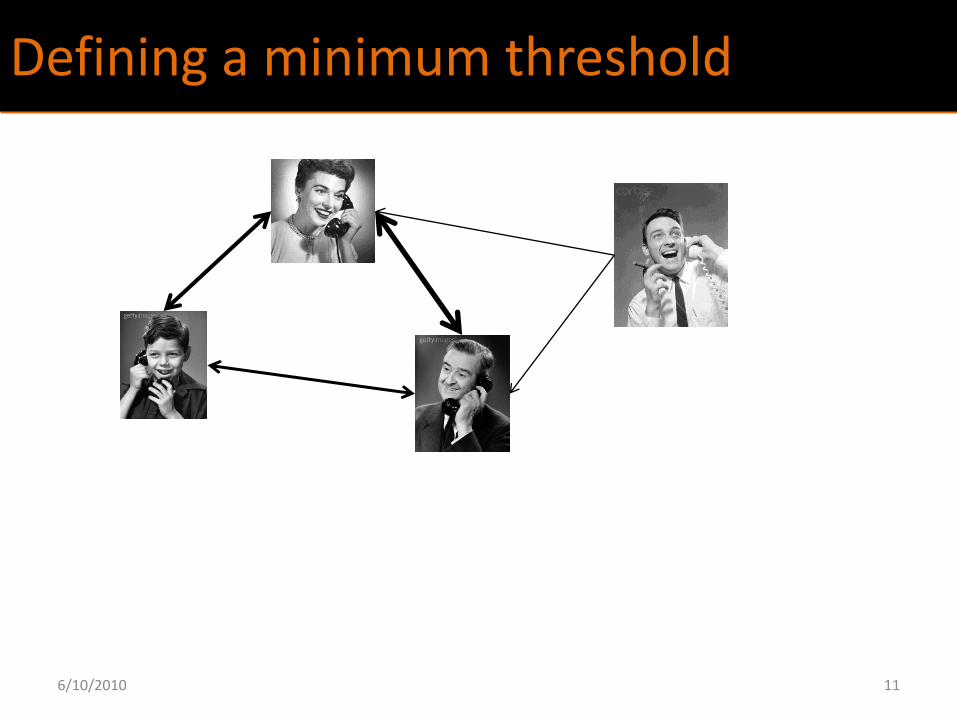
Defining a minimum threshold
6/10/2010 11
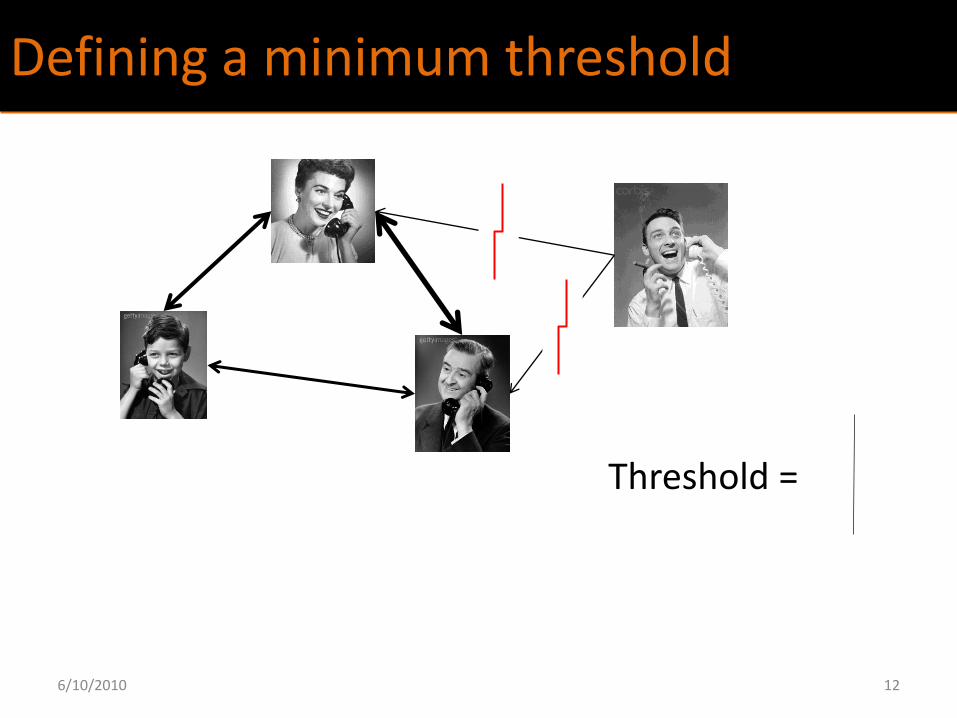
Defining a minimum threshold
Threshold =
6/10/2010 12
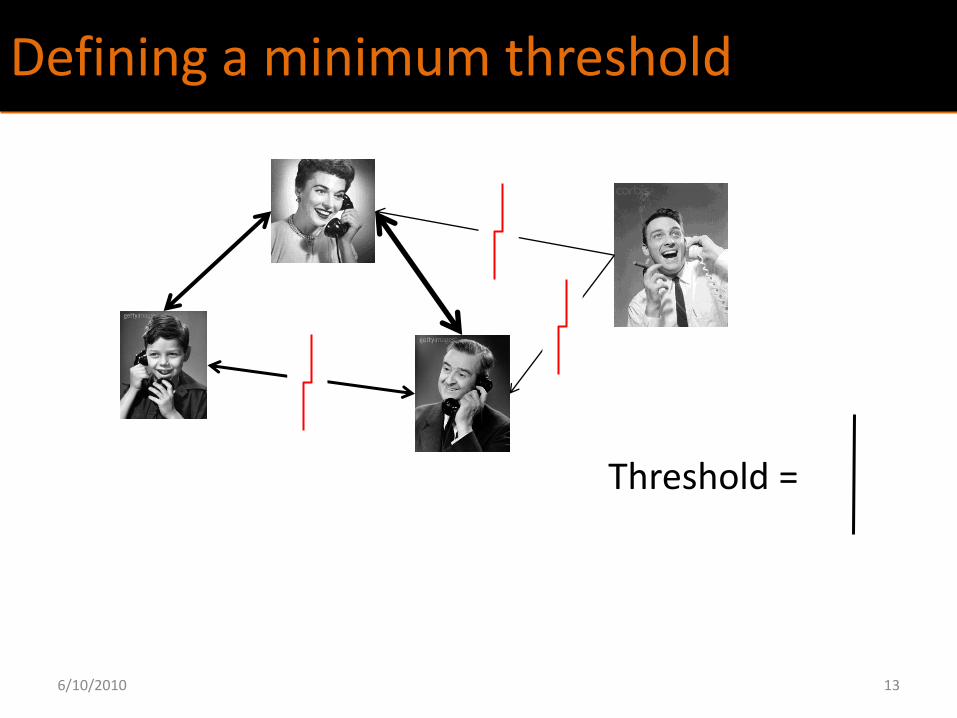
Defining a minimum threshold
Threshold =
6/10/2010 13
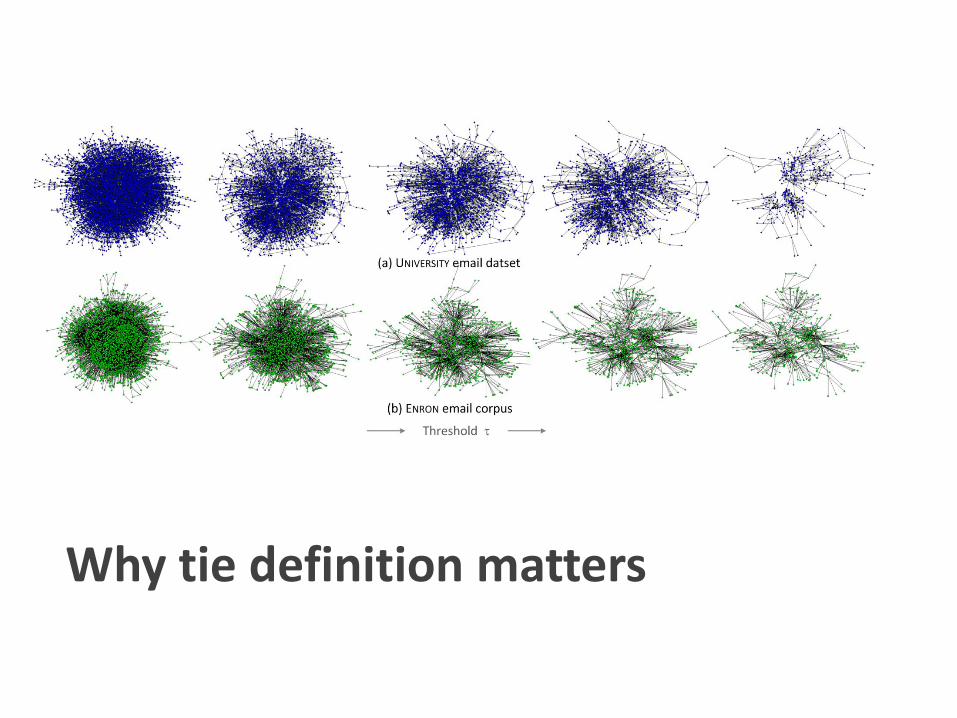
Why tie definition matters
Our Contributions
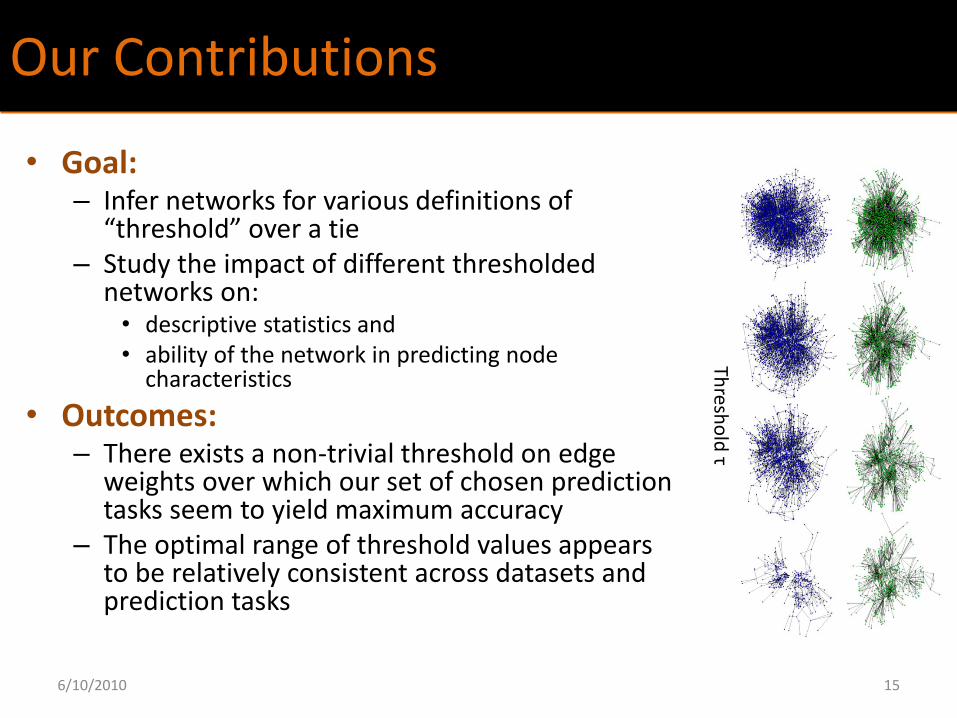
• Goal: – Infer networks for various definitions of
“threshold” over a tie – Study the impact of different thresholded
networks on: • descriptive statistics and • ability of the network in predicting node
characteristics
• Outcomes: – There exists a non-trivial threshold on edge
weights over which our set of chosen prediction tasks seem to yield maximum accuracy
– The optimal range of threshold values appears to be relatively consistent across datasets and prediction tasks
Thresh
old
τ
6/10/2010 15
Inferring Social Networks Network Descriptive Statistics Network-based Prediction Conclusions
Background and Motivation
Datasets
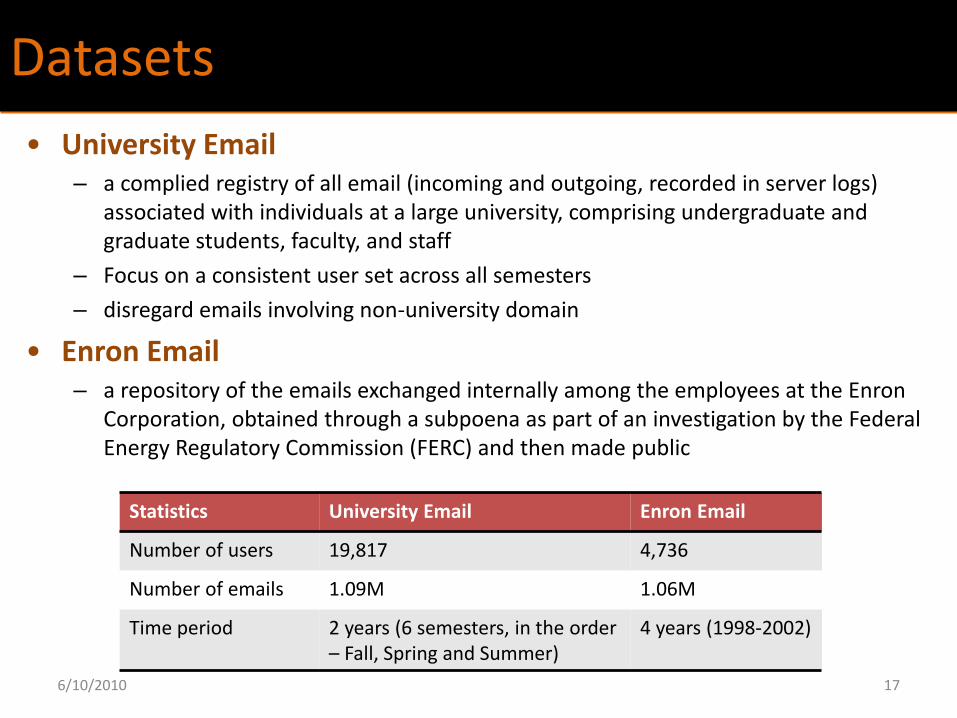
• University Email – a complied registry of all email (incoming and outgoing, recorded in server logs)
associated with individuals at a large university, comprising undergraduate and graduate students, faculty, and staff
– Focus on a consistent user set across all semesters
– disregard emails involving non-university domain
• Enron Email – a repository of the emails exchanged internally among the employees at the Enron
Corporation, obtained through a subpoena as part of an investigation by the Federal Energy Regulatory Commission (FERC) and then made public
6/10/2010 17
Statistics University Email Enron Email
Number of users 19,817 4,736
Number of emails 1.09M 1.06M
Time period 2 years (6 semesters, in the order – Fall, Spring and Summer)
4 years (1998-2002)
“Thresholded” Networks
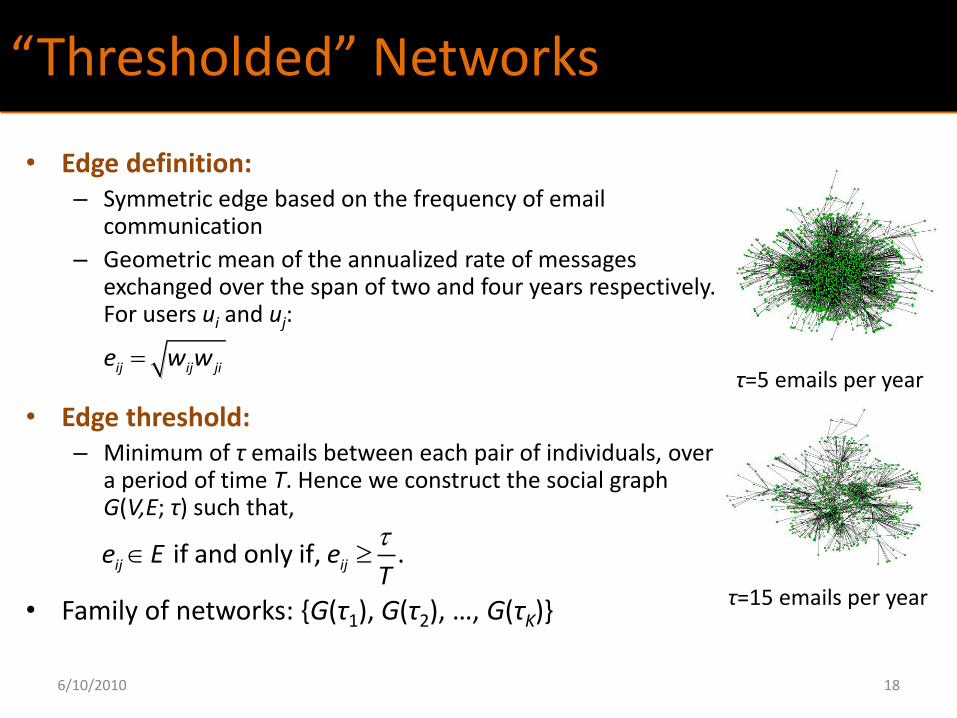
• Edge definition: – Symmetric edge based on the frequency of email
communication
– Geometric mean of the annualized rate of messages exchanged over the span of two and four years respectively. For users ui and uj:
• Edge threshold: – Minimum of τ emails between each pair of individuals, over
a period of time T. Hence we construct the social graph G(V,E; τ) such that,
• Family of networks: {G(τ1), G(τ2), …, G(τK)}
6/10/2010 18
ij ij jie w w
if and only if, .ij ije E eT
τ=5 emails per year
τ=15 emails per year
Network Descriptive Statistics Network-based Prediction Conclusions
Background and Motivation Inferring Social Networks
Network-level Features
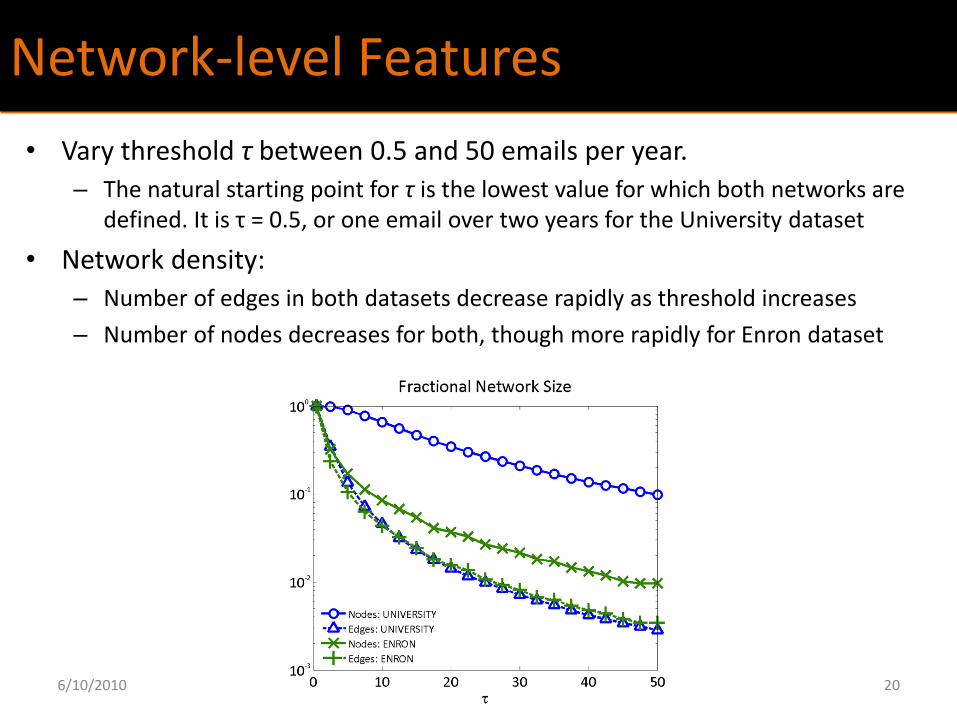
• Vary threshold τ between 0.5 and 50 emails per year.
– The natural starting point for τ is the lowest value for which both networks are defined. It is τ = 0.5, or one email over two years for the University dataset
• Network density:
– Number of edges in both datasets decrease rapidly as threshold increases
– Number of nodes decreases for both, though more rapidly for Enron dataset
6/10/2010 20
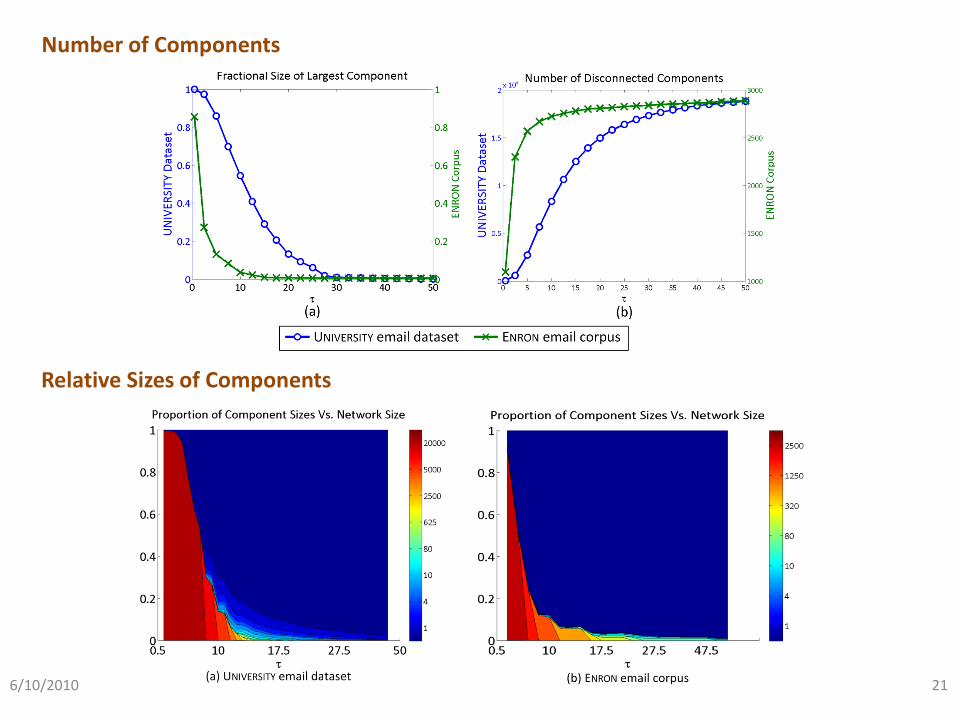
6/10/2010 21
Number of Components
Relative Sizes of Components
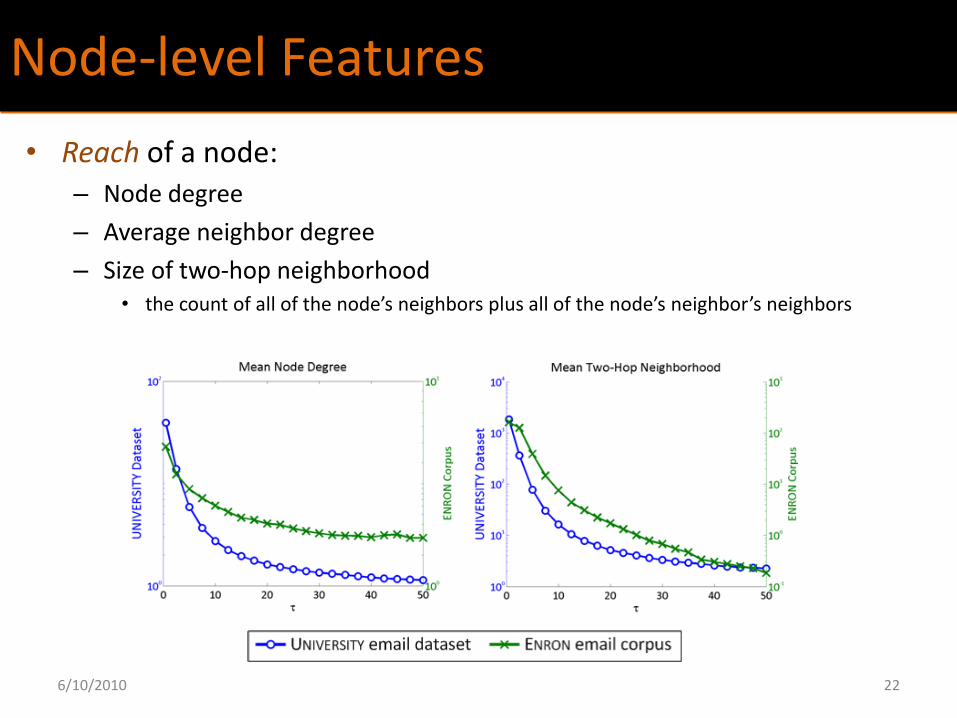
Node-level Features
• Reach of a node: – Node degree
– Average neighbor degree
– Size of two-hop neighborhood • the count of all of the node’s neighbors plus all of the node’s neighbor’s neighbors
6/10/2010 22
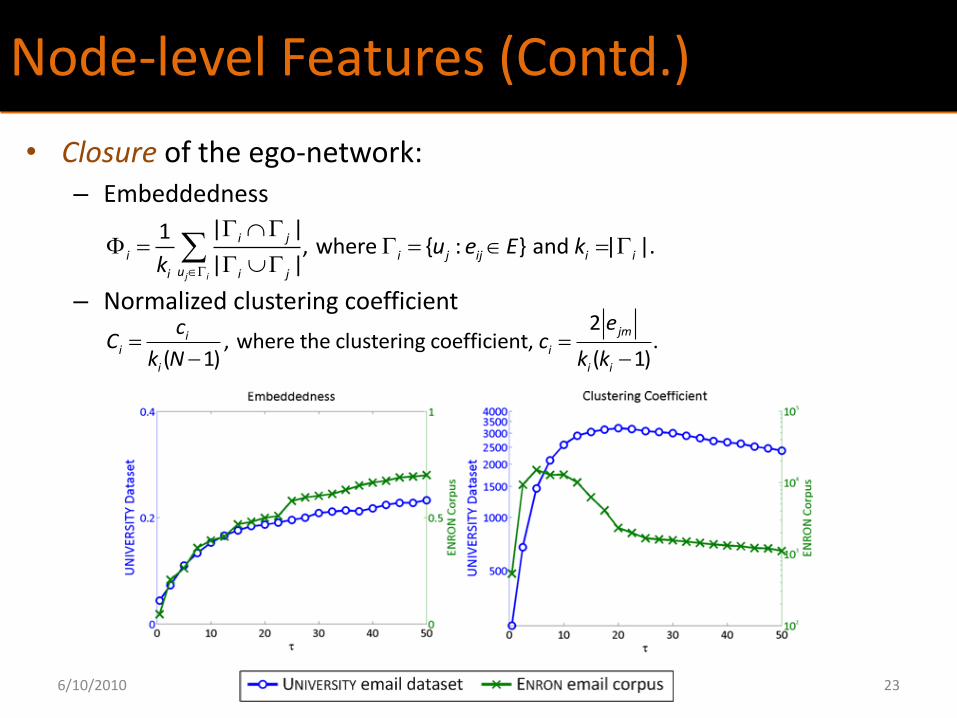
Node-level Features (Contd.)
• Closure of the ego-network: – Embeddedness
– Normalized clustering coefficient
6/10/2010 23
2, where the clustering coefficient, .
( 1) ( 1)
jmii i
i i i
ecC c
k N k k
| |1, where { : } and | |.
| |j i
i j
i i j ij i iui i j
u e E kk
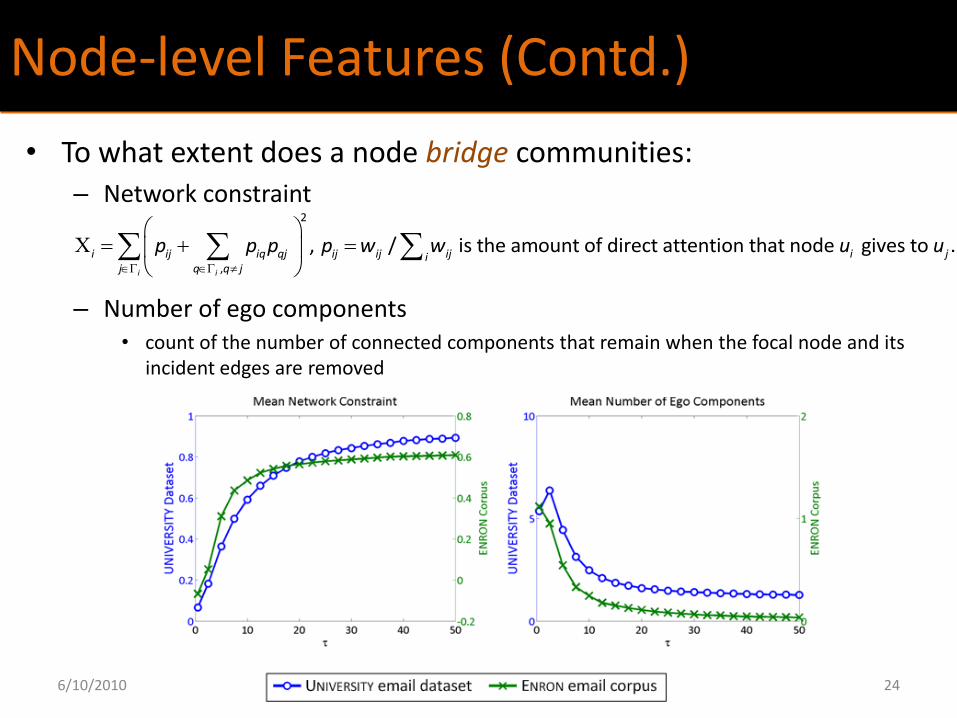
Node-level Features (Contd.)
• To what extent does a node bridge communities: – Network constraint
– Number of ego components • count of the number of connected components that remain when the focal node and its
incident edges are removed
6/10/2010 24
2
,
, / is the amount of direct attention that node gives to .i i
i ij iq qj ij ij ij i jij q q j
p p p p w w u u

6/10/2010 25
How to choose the right threshold?

Network-based Prediction Conclusions
Background and Motivation Inferring Social Networks Network Descriptive Statistics
Premise of Prediction
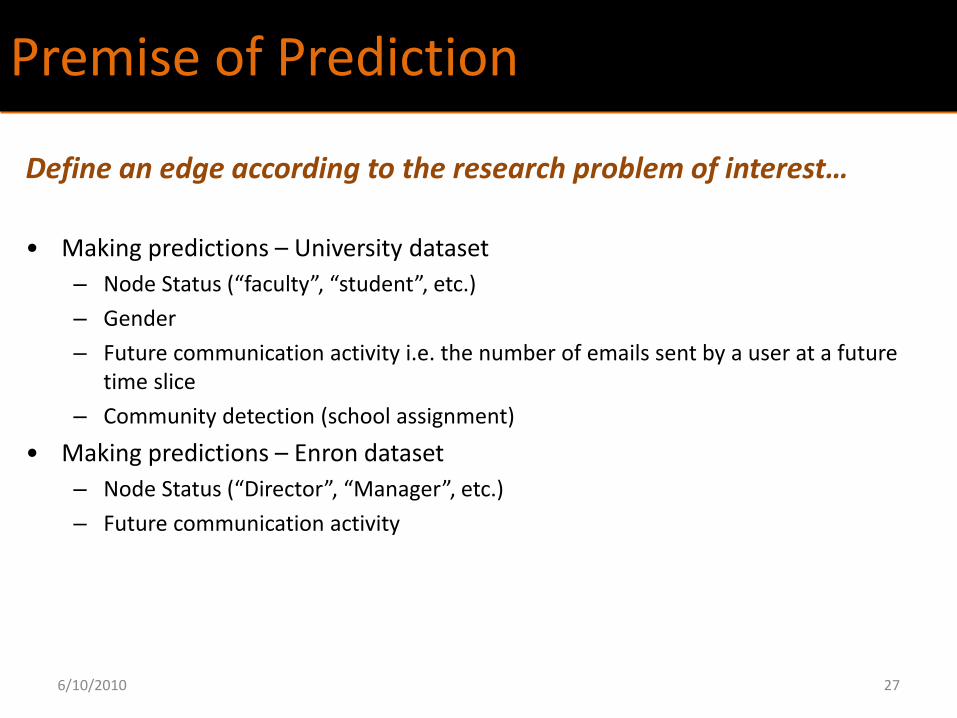
Define an edge according to the research problem of interest…
• Making predictions – University dataset
– Node Status (“faculty”, “student”, etc.)
– Gender
– Future communication activity i.e. the number of emails sent by a user at a future time slice
– Community detection (school assignment)
• Making predictions – Enron dataset
– Node Status (“Director”, “Manager”, etc.)
– Future communication activity
6/10/2010 27
Prediction Tasks: Node Status/Gender
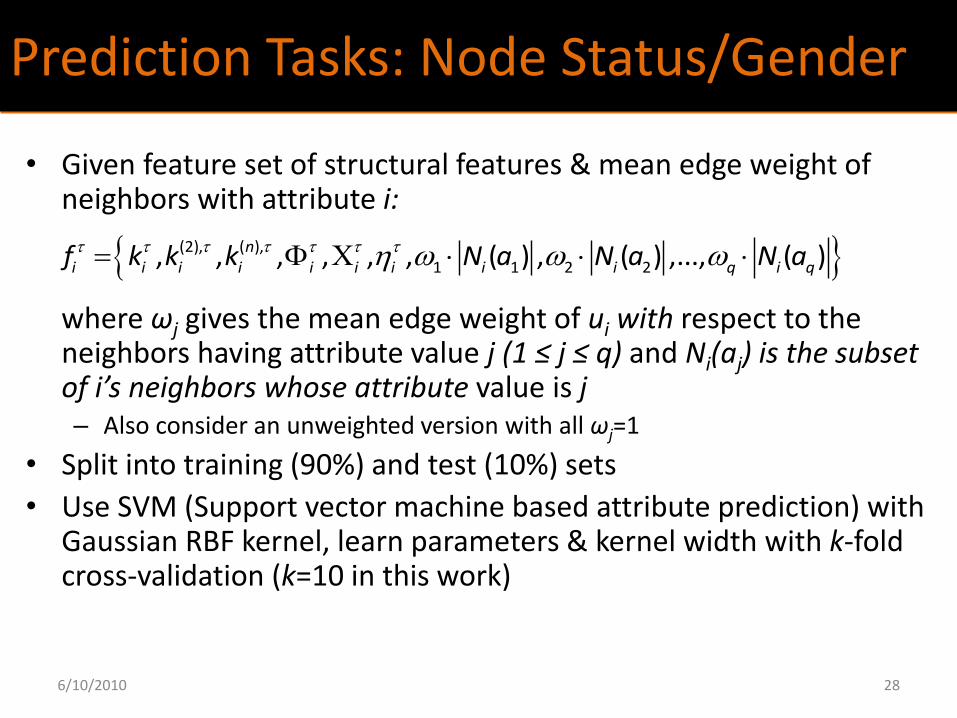
• Given feature set of structural features & mean edge weight of neighbors with attribute i:
where ωj gives the mean edge weight of ui with respect to the neighbors having attribute value j (1 ≤ j ≤ q) and Ni(aj) is the subset of i’s neighbors whose attribute value is j – Also consider an unweighted version with all ωj=1
• Split into training (90%) and test (10%) sets
• Use SVM (Support vector machine based attribute prediction) with Gaussian RBF kernel, learn parameters & kernel width with k-fold cross-validation (k=10 in this work)
(2), ( ),1 1 2 2, , , , , , ( ) , ( ) ,..., ( )n
i i i i i i i i i q i qf k k k N a N a N a
6/10/2010 28
Prediction Tasks: Future Communication
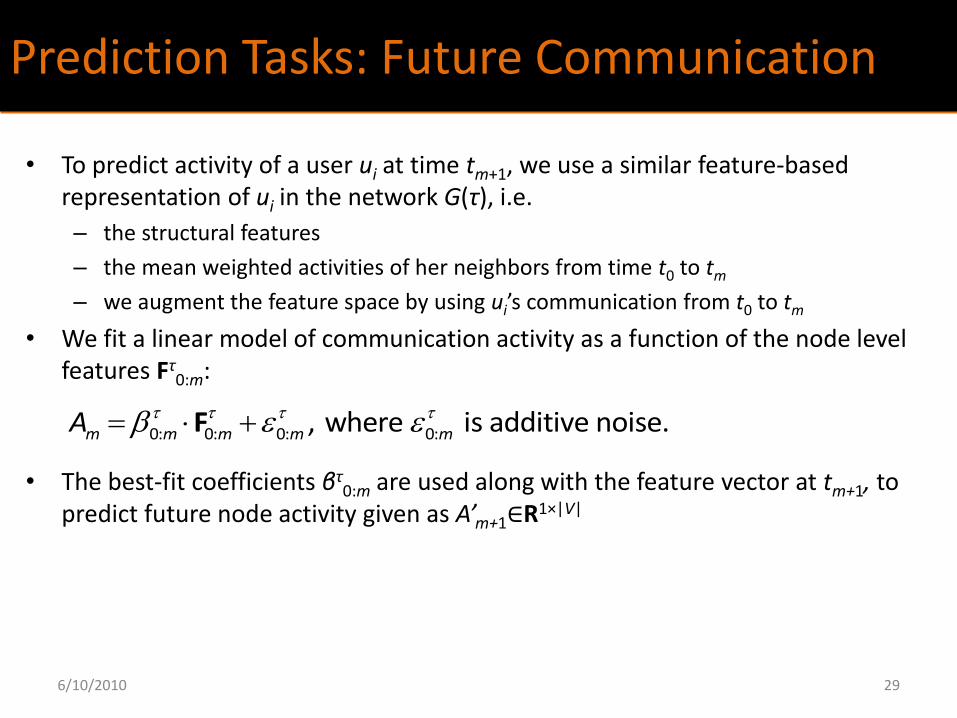
• To predict activity of a user ui at time tm+1, we use a similar feature-based representation of ui in the network G(τ), i.e.
– the structural features
– the mean weighted activities of her neighbors from time t0 to tm
– we augment the feature space by using ui’s communication from t0 to tm
• We fit a linear model of communication activity as a function of the node level features Fτ
0:m:
• The best-fit coefficients βτ0:m are used along with the feature vector at tm+1, to
predict future node activity given as A’m+1∈R1×|V|
0: 0: 0: 0:, where is additive noise.m m m m mA F
6/10/2010 29
Prediction Tasks: Community Detection
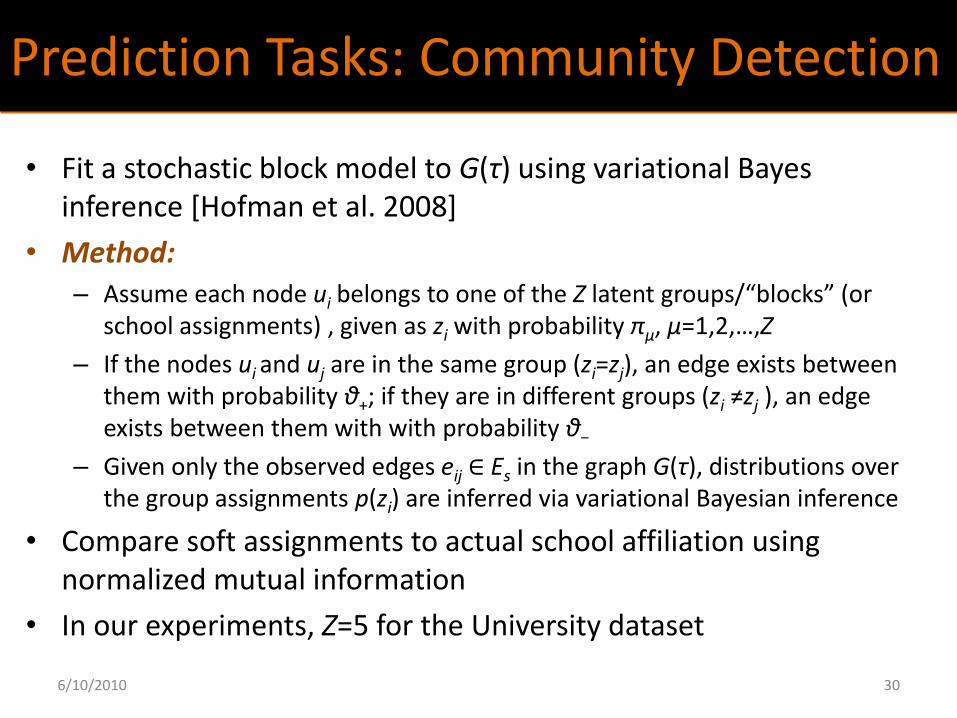
• Fit a stochastic block model to G(τ) using variational Bayes inference [Hofman et al. 2008]
• Method: – Assume each node ui belongs to one of the Z latent groups/“blocks” (or
school assignments) , given as zi with probability πμ, μ=1,2,…,Z
– If the nodes ui and uj are in the same group (zi=zj), an edge exists between them with probability θ+; if they are in different groups (zi ≠zj ), an edge exists between them with with probability θ−
– Given only the observed edges eij ∈ Es in the graph G(τ), distributions over the group assignments p(zi) are inferred via variational Bayesian inference
• Compare soft assignments to actual school affiliation using normalized mutual information
• In our experiments, Z=5 for the University dataset
6/10/2010 30
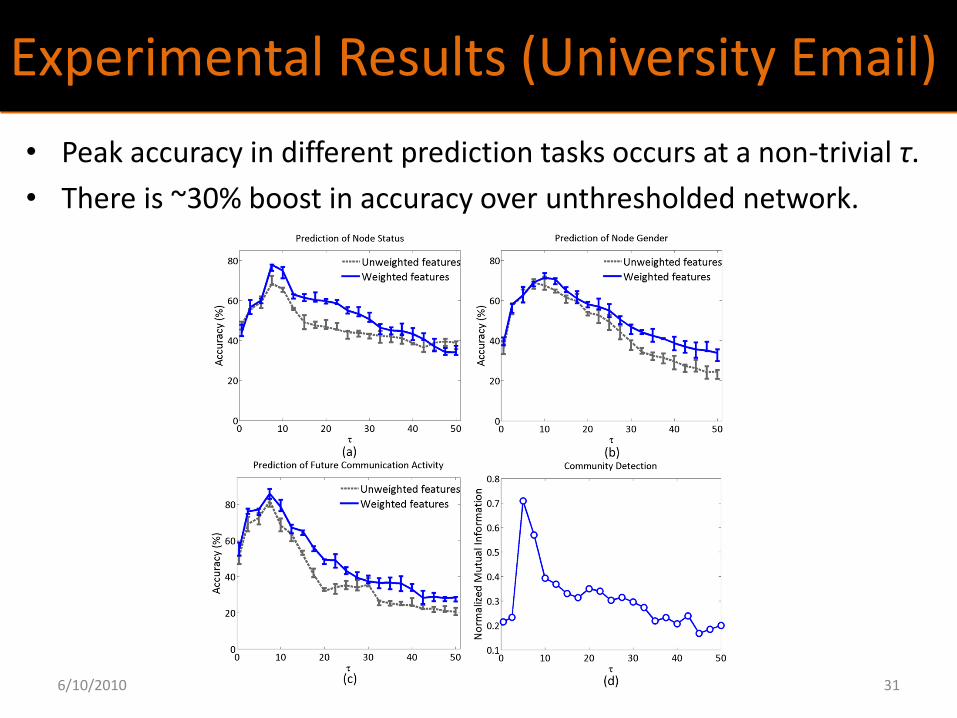
Experimental Results (University Email)
• Peak accuracy in different prediction tasks occurs at a non-trivial τ.
• There is ~30% boost in accuracy over unthresholded network.
6/10/2010 31
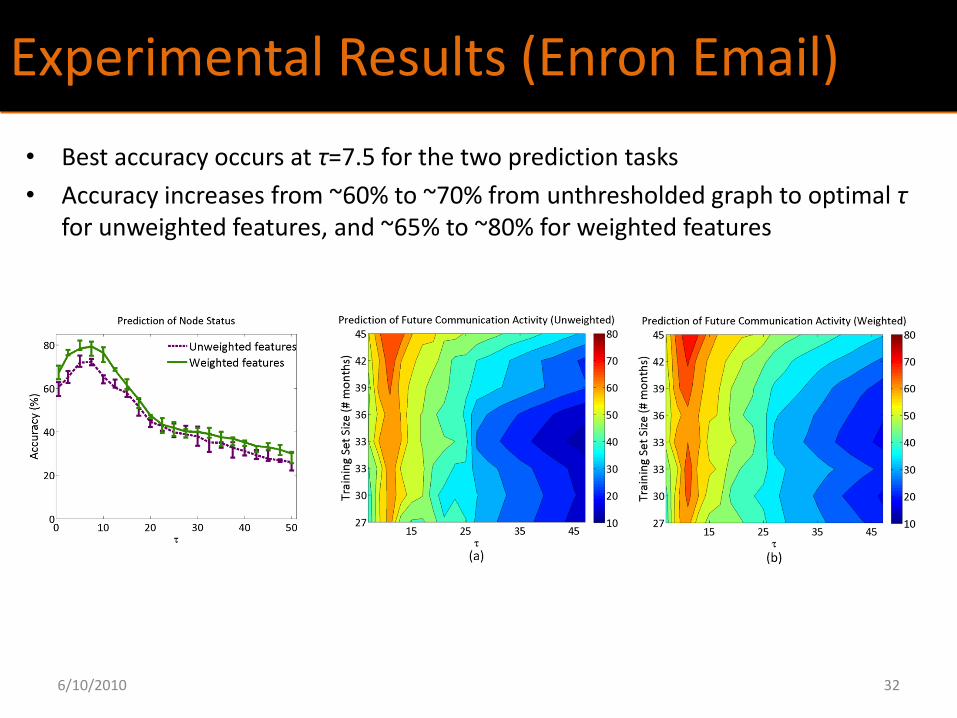
Experimental Results (Enron Email)
• Best accuracy occurs at τ=7.5 for the two prediction tasks
• Accuracy increases from ~60% to ~70% from unthresholded graph to optimal τ for unweighted features, and ~65% to ~80% for weighted features
6/10/2010 32
Observations
6/10/2010 33
• Finding Optimal Threshold – Accuracy maximized at non-obvious point
– Increase in accuracy from unthresholded graph as much as ~30%
– Increase in accuracy exists even including information about weights at edges; therefore deleting edges removes noise (increasing signal)
• Optimal threshold at consistent value – For different prediction tasks
– For different data sets
Discussion
• Initial assumptions made on social graph construction: – Elimination of out-of-network nodes, focusing on a consistent user set over
time
– Geometric mean: alternative definitions of an edge?
– Considered symmetric edges: communication is often asymmetrical
• Only tested with email datasets
• Type of prediction tasks constrained by available data
• Thresholds on edge weights are not the only way to define edges
6/10/2010 34
Conclusions
Background and Motivation Inferring Social Networks Network Descriptive Statistics Network-based Prediction
Summary
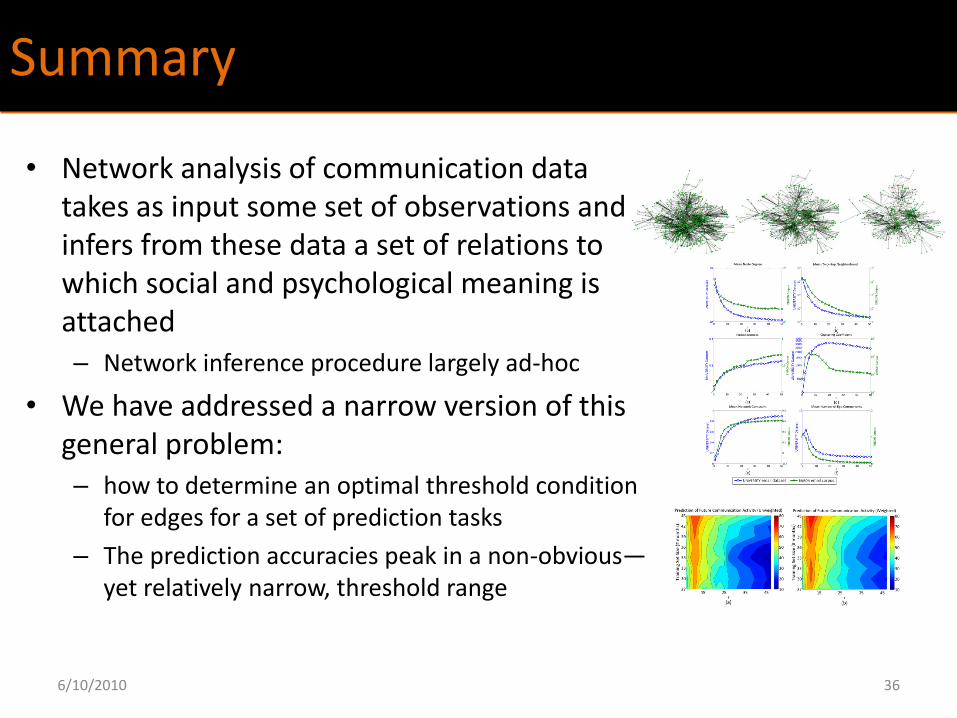
• Network analysis of communication data takes as input some set of observations and infers from these data a set of relations to which social and psychological meaning is attached – Network inference procedure largely ad-hoc
• We have addressed a narrow version of this general problem: – how to determine an optimal threshold condition
for edges for a set of prediction tasks
– The prediction accuracies peak in a non-obvious—yet relatively narrow, threshold range
6/10/2010 36
Future Directions
• Incorporate model of edge definition in prediction task – E.g., Learn threshold parameter / edge definition in prediction model
• Apply method to variety of networks – Industry production / consumption networks
– Food web
– Genetic networks
• Learn optimal threshold for known feature, test on unknown feature – In other words, is the threshold always consistent across prediction tasks?
6/10/2010 37