Inferring Networks of Substitutable and Complementary...
10
Inferring Networks of Substitutable and Complementary Products Julian McAuley Rahul Pandey Jure Leskovec UC San Diego Pinterest Stanford University & Pinterest [email protected] [email protected] [email protected] ABSTRACT In a modern recommender system, it is important to understand how products relate to each other. For example, while a user is looking for mobile phones, it might make sense to recommend other phones, but once they buy a phone, we might instead want to recommend batteries, cases, or chargers. These two types of rec- ommendations are referred to as substitutes and complements: sub- stitutes are products that can be purchased instead of each other, while complements are products that can be purchased in addition to each other. Here we develop a method to infer networks of substitutable and complementary products. We formulate this as a supervised link prediction task, where we learn the semantics of substitutes and complements from data associated with products. The primary source of data we use is the text of product reviews, though our method also makes use of features such as ratings, specifications, prices, and brands. Methodologically, we build topic models that are trained to automatically discover topics from text that are suc- cessful at predicting and explaining such relationships. Experimen- tally, we evaluate our system on the Amazon product catalog, a large dataset consisting of 9 million products, 237 million links, and 144 million reviews. 1. INTRODUCTION Recommender systems are ubiquitous in applications ranging from e-commerce to social media, video, and online news plat- forms. Such systems help users to navigate a huge selection of items with unprecedented opportunities to meet a variety of special needs and user tastes. Making sense of a large number of products and driving users to new and previously unknown items is key to enhancing user experience and satisfaction [2, 14, 15]. While most recommender systems focus on analyzing patterns of interest in products to provide personalized recommendations [14, 30, 34, 36], another important problem is to understand relation- ships between products, in order to surface recommendations that are relevant to a given context [17, 35]. For example, when a user in an online store is examining t-shirts she should receive recom- mendations for similar t-shirts, or otherwise jeans, sweatshirts, and Permission to make digital or hard copies of all or part of this work for personal or classroom use is granted without fee provided that copies are not made or distributed for profit or commercial advantage and that copies bear this notice and the full citation on the first page. Copyrights for components of this work owned by others than the author(s) must be honored. Abstracting with credit is permitted. To copy otherwise, or republish, to post on servers or to redistribute to lists, requires prior specific permission and/or a fee. Request permissions from [email protected] KDD ’15 August 11 - 14, 2015, Sydney, NSW, Australia Copyright is held by the owner/author(s). Publication rights licensed to ACM. ACM 978-1-4503-3664-2/15/08 ...$15000. DOI: http://dx.doi.org/10.1145/2783258.2783381. socks, rather than (say) a movie even though she may very well be interested in it. From these relationships we can construct a product graph, where nodes represent products, and edges represent var- ious types of product relationships. Such product graphs facilitate many important applications: Navigation between related products, discovery of new and previously unknown products, identification of interesting product combinations, and generation of better and more context-relevant recommendations. Despite the importance of understanding relationships between products there are several interesting questions that make the prob- lem of building product graphs challenging: What are the common types of relationships we might want to discover? What data will allow us to reliably discover relationships between products? How do we model the semantics of why certain products are related?— For example, the semantics of why a given t-shirt might be related to a particular pair of jeans are intricate and can only be captured by a highly flexible model. And finally, how do we scale-up our methods to handle graphs of millions of products and hundreds of millions of relations? Inferring networks of product relationships. Here we are inter- ested in inferring networks of relationships between millions of products. Even though our method can be used to learn any type of relationship, we focus on identifying two types of links between products: substitutes and complements [21]. Substitutable products are those that are interchangeable—such as one t-shirt for another, while complementary products are those that might be purchased together, such as a t-shirt and jeans. We design a system titled Sceptre (Substitute and Complemen- tary Edges between Products from Topics in Reviews), that is ca- pable of modeling and predicting relationships between products from the text of their reviews and descriptions. At its core, Sceptre combines topic modeling and supervised link prediction, by identi- fying topics in text that are useful as features for predicting links be- tween products. Our model also handles additional features such as brand, price, and rating information, product category information, and allows us to predict multiple types of relations (e.g. substitutes and complements) simultaneously. Moreover, Sceptre harnesses the fact that products are arranged in a category hierarchy and allows us to extend this hierarchy to discover ‘micro-categories’—fine- grained categories of closely related products. An example of the output of Sceptre is shown in Figure 1. Here, given a query item (a hiking boot), our system identifies a ranked list of potential substitutes (other hiking boots), and complements (heavy-duty socks, shoe polish, etc.). We train Sceptre on a large corpus of 9 million products from Amazon, with 237 million connections derived from browsing and co-purchasing data. We evaluate Sceptre in terms of its accuracy at link prediction and ranking, where we find it to be significantly
Transcript of Inferring Networks of Substitutable and Complementary...

Inferring Networks of Substitutableand Complementary Products
Julian McAuley Rahul Pandey Jure LeskovecUC San Diego Pinterest Stanford University & Pinterest
[email protected] [email protected] [email protected]
ABSTRACTIn a modern recommender system, it is important to understandhow products relate to each other. For example, while a user islooking for mobile phones, it might make sense to recommendother phones, but once they buy a phone, we might instead wantto recommend batteries, cases, or chargers. These two types of rec-ommendations are referred to as substitutes and complements: sub-stitutes are products that can be purchased instead of each other,while complements are products that can be purchased in additionto each other.
Here we develop a method to infer networks of substitutableand complementary products. We formulate this as a supervisedlink prediction task, where we learn the semantics of substitutesand complements from data associated with products. The primarysource of data we use is the text of product reviews, though ourmethod also makes use of features such as ratings, specifications,prices, and brands. Methodologically, we build topic models thatare trained to automatically discover topics from text that are suc-cessful at predicting and explaining such relationships. Experimen-tally, we evaluate our system on the Amazon product catalog, alarge dataset consisting of 9 million products, 237 million links,and 144 million reviews.
1. INTRODUCTIONRecommender systems are ubiquitous in applications ranging
from e-commerce to social media, video, and online news plat-forms. Such systems help users to navigate a huge selection ofitems with unprecedented opportunities to meet a variety of specialneeds and user tastes. Making sense of a large number of productsand driving users to new and previously unknown items is key toenhancing user experience and satisfaction [2, 14, 15].
While most recommender systems focus on analyzing patterns ofinterest in products to provide personalized recommendations [14,30, 34, 36], another important problem is to understand relation-ships between products, in order to surface recommendations thatare relevant to a given context [17, 35]. For example, when a userin an online store is examining t-shirts she should receive recom-mendations for similar t-shirts, or otherwise jeans, sweatshirts, and
Permission to make digital or hard copies of all or part of this work for personal orclassroom use is granted without fee provided that copies are not made or distributedfor profit or commercial advantage and that copies bear this notice and the full citationon the first page. Copyrights for components of this work owned by others than theauthor(s) must be honored. Abstracting with credit is permitted. To copy otherwise, orrepublish, to post on servers or to redistribute to lists, requires prior specific permissionand/or a fee. Request permissions from [email protected] ’15 August 11 - 14, 2015, Sydney, NSW, AustraliaCopyright is held by the owner/author(s). Publication rights licensed to ACM.ACM 978-1-4503-3664-2/15/08 ...$15000.DOI: http://dx.doi.org/10.1145/2783258.2783381.
socks, rather than (say) a movie even though she may very well beinterested in it. From these relationships we can construct a productgraph, where nodes represent products, and edges represent var-ious types of product relationships. Such product graphs facilitatemany important applications: Navigation between related products,discovery of new and previously unknown products, identificationof interesting product combinations, and generation of better andmore context-relevant recommendations.
Despite the importance of understanding relationships betweenproducts there are several interesting questions that make the prob-lem of building product graphs challenging: What are the commontypes of relationships we might want to discover? What data willallow us to reliably discover relationships between products? Howdo we model the semantics of why certain products are related?—For example, the semantics of why a given t-shirt might be relatedto a particular pair of jeans are intricate and can only be capturedby a highly flexible model. And finally, how do we scale-up ourmethods to handle graphs of millions of products and hundreds ofmillions of relations?
Inferring networks of product relationships. Here we are inter-ested in inferring networks of relationships between millions ofproducts. Even though our method can be used to learn any typeof relationship, we focus on identifying two types of links betweenproducts: substitutes and complements [21]. Substitutable productsare those that are interchangeable—such as one t-shirt for another,while complementary products are those that might be purchasedtogether, such as a t-shirt and jeans.
We design a system titled Sceptre (Substitute and Complemen-tary Edges between Products from Topics in Reviews), that is ca-pable of modeling and predicting relationships between productsfrom the text of their reviews and descriptions. At its core, Sceptrecombines topic modeling and supervised link prediction, by identi-fying topics in text that are useful as features for predicting links be-tween products. Our model also handles additional features such asbrand, price, and rating information, product category information,and allows us to predict multiple types of relations (e.g. substitutesand complements) simultaneously. Moreover, Sceptre harnesses thefact that products are arranged in a category hierarchy and allowsus to extend this hierarchy to discover ‘micro-categories’—fine-grained categories of closely related products.
An example of the output of Sceptre is shown in Figure 1. Here,given a query item (a hiking boot), our system identifies a rankedlist of potential substitutes (other hiking boots), and complements(heavy-duty socks, shoe polish, etc.).
We train Sceptre on a large corpus of 9 million products fromAmazon, with 237 million connections derived from browsing andco-purchasing data. We evaluate Sceptre in terms of its accuracy atlink prediction and ranking, where we find it to be significantly

ery product Substitutes Complements
Figure 1: Sceptre learns the concept of substitute and complementgoods from product information (descriptions, reviews, etc.). Givena query item, Sceptre allows us to generate substitute and comple-mentary recommendations as shown above.
more accurate than alternatives. We also use Sceptre to build aproduct graph, where for every product we recommend a list of themost related complementary and substitutable products. Finally, weshow that Sceptre can be applied in ‘cold-start’ settings, by usingother sources of text when reviews are unavailable. Overall, we findthat the most useful source of information to identify substitutesand complements is the text associated with each product (i.e., re-views, descriptions, and specifications), from which we are able touncover the key features and relationships between products, andalso to explain these relationships through textual signals.
We envision several applications of the product graphs producedby our system. Our system can help users to navigate, explore anddiscover new and previously unknown products. Or, it can be usedto identify interesting product combinations, e.g. we can recom-mend outfits by matching a shirt with complementary trousers and ajacket. And, our system can be used as a candidate-generation stepin providing better and more context-relevant recommendations.
2. RELATED WORKThe basic task of a recommender system is to suggest relevant
items to users, based on their opinions, context, and behavior. Onecomponent of this task is that of estimating users’ ratings or rank-ings of products [14], e.g. by matrix factorization [15] or collabo-rative filtering [17]. Our goal here is related but complementary torating estimation as we aim to discover relations between products.
In principle the types of relationships in which we are inter-ested can be mined from behavioral data, such as browsing andco-purchasing logs. For example, Amazon allows users to navigatebetween products through links such as ‘users who bought X alsobought Y’ and ‘users who viewed X also viewed Y’ [17]. Such a‘co-counting’ solution, while simple, has a few shortcomings, for
example it may produce noisy recommendations for infrequently-purchased products, and has limited ability to explain the recom-mendations it provides. More sophisticated solutions have been pro-posed that make use of browsing and co-purchasing data (e.g. [35]),but in contrast to such ‘behavioral-based’ solutions our goal is tolearn the semantics of ‘what makes products related?’ in order togenerate new links, adapt to different notions of relatedness, and tounderstand and explain the features that cause humans to considerproducts to be related.
Topic models are a fundamental building block of text modeling[3, 4, 5] and form the cornerstone of our model. A variety of workshave used topic models within recommender systems (e.g. [6, 10,11, 22, 23, 28, 31, 32]), though generally with the goal of predict-ing user ratings (or opinions) rather than learning relationships be-tween products as we do here. More specifically, our work builds ontopic models for networks: Block-LDA [1], topic-link LDA [18],and relational topic models [7] all attempt to identify topics thatexplain the links in document networks. A promising line of workuses such ideas to model social and citation networks [8, 33, 34].However, these methods have trouble scaling to large networks,while Sceptre scales to corpora with millions of documents (prod-ucts) and hundreds of millions of links.
Last, a related branch of work aims to enhance e-commerce us-ing browsing data. For example, [12] aims to forecast commercialintent based on query logs; and in [26] the authors use query datato identify attributes that are important to users in order to surfacerecommendations. While different in terms of the data and problemsetting, such works are similar in that they uncover relationshipsfrom large sources of weakly-structured data.
3. THE SCEPTRE MODELIn the following we build Sceptre gradually, but in such a way
that at each step we are specifying a usable model. We highlight thedifferences between successive iterations of our model in blue. Wedo this to emphasize the fact that while Sceptre makes use of sev-eral interacting components, each of these components brings anadditional modeling aspect into the framework. Table 1 describesthe notation we use throughout the paper.
3.1 High-level OverviewWe first present a high-level, conceptual view of Sceptre, to ex-
plain the intuition behind the model before we fully specify it.
Topic Models. We use topic models [4] to discover topics fromproduct reviews and other sources of text. Conceptually, this meansthat the text from millions of products can be clustered into a smallnumber of dimensions, so that each product i (and its text) can berepresented by a topic vector θi encoding the extent to which re-views/descriptions of a given product discuss each of the topics.
Link Prediction. Topic models allow us to represent each producti by a vector θi. On top of this we can have a statistical modelto predict properties about products. In our case, we use logis-tic regression to make predictions about pairs of items, using fea-tures that combine the topics of two products θi and θj simulta-neously. The classification task we are interested in is: does a re-lationship exist between i and j? Using pairwise features of theproducts, e.g. ψ(i, j) = θj − θi, we build logistic classifiers suchthat 〈β, ψ(i, j)〉 takes a positive value if i and j are connected by anedge. We further develop this model so that predicting the presenceof an edge and the direction of an edge are treated as two separatetasks, to account for asymmetries and to help with interpretability.
Importantly, it should be noted that we do not train topic mod-els and then perform link prediction, but rather we define a joint

objective such that we discover topics that are informative for ourlink prediction task. In this way our model uncovers topics that aregood at ‘explaining’ the relationships between products.
Micro-Categories. An additional goal of Sceptre is to be able todiscover micro-categories of closely related products. We achievethis by using sparse representations of very high dimensional topicvectors for each product. We make use of explicit product hier-archies (such as the category tree available from Amazon), whereeach node of the hierarchy has a small number of topics associ-ated with it. The hierarchical nature of the category tree means thattopics associated with top-level nodes are general and broad, whiletopics associated with leaf categories focus on differentiating be-tween subtle product features, which can be interpreted as micro-categories (e.g. different styles of running shoes).
Product graph. Finally, we have a supervised learning frameworkto predict relationships between products. Discovering substitutesand complements then depends on the choices of graph we useto train the model, for which we collect several graphs of relatedproducts from Amazon. For example, a co-purchasing graph suchas ‘users frequently purchased a and b together’ encodes some no-tion of complements, whereas a graph such as ‘users who viewed aeventually purchased b’ captures the notion of substitutes. Thus, forevery product, we predict a list of complementary and substitutableproducts and collect them into a giant network of related products.
3.2 Detailed Technical Description
3.2.1 Background: Latent Dirichlet AllocationLatent Dirichlet Allocation (LDA, [4]) uncovers latent structure
in document corpora. For the moment, ‘documents’ shall be theset of reviews associated with a particular product. LDA associateseach document in a corpus d ∈ T with a K-dimensional topic dis-tribution θd (a stochastic vector, i.e.,
∑k θd,k = 1), which encodes
the fraction of words in d that discuss each of theK topics. That is,words in the document d discuss topic k with probability θd,k.
Each topic k also has an associated word distribution, φk, whichencodes the probability that a particular word is used for that topic.Finally, the topic distributions themselves (θd) are assumed to bedrawn from a Dirichlet prior.
The final model includes word distributions for each topic φk,topic distributions for each document θd, and topic assignmentsfor each word zd,j . Parameters Φ = {θ, φ} and topic assignmentsz are traditionally updated via sampling [4]. The likelihood of aparticular text corpus T (given the word distribution φ, topics θ,and topic assignments for each word z) is then
p(T |θ, φ, z) =∏d∈T
Nd∏j=1
θzd,j · φzd,j ,wd,j , (1)
where we are multiplying over all documents in the corpus, and allwords in each document. The two terms in the product are the like-lihood of seeing these particular topics (θzd,j ), and the likelihoodof seeing these particular words for this topic (φzd,j ,wd,j ).
3.2.2 Link Prediction with Topic Models‘Supervised Topic Models’ [3] allow topics to be discovered that
are predictive of an output variable associated with each document.We propose a variant of a supervised topic model that identifiestopics that are useful as features for link prediction. We choose anapproach based on logistic regression because (1) It can be scaled tomillions of documents/products by hundreds of millions of edges,and (2) It can be adapted to incorporate both latent features (top-
Symbol Description
di document associated with an item (product) iT document corpusK number of topicsθi K-dimensional topic distribution for item iφk word distribution for topic kwd,j j th word of document dzd,j topic of the j th word document dNd number of words in document dF (x) logistic (sigmoid) function, 1/(1 + e−x)Eg observed edges in graph gψ(i, j) pairwise (undirected) features for items i and jϕ(i, j) pairwise (directed) features for items i and jβ logistic weights associated with ψ(i, j)η logistic weights associated with ϕ(i, j)
Table 1: Notation.
ics) and manifest features (such as brand, price, and rating infor-mation), as well as arbitrary transformations and combinations ofthese features. Our goal here is to predict links, that is labels at thelevel of pairs of products. In particular, we want to train logisticclassifiers that for each pair of products (i, j) predicts whether theyare related (yi,j = 1) or not (yi,j = 0). For now we will considerthe case where we are predicting just a single type of relationshipand we will later generalize the model to predict multiple types ofrelationships (substitutes and complements) simultaneously.
We want the topics associated with each product to be ‘useful’for logistic regression in the sense that we are able to learn a logisticregressor parametrized by β that predicts yi,j , using the topics θiand θj as features. That is, we want the logistic function
Fβ(θd) = σ(〈β, ψθ(i, j)〉) (2)
to match yi,j as closely as possible, where ψθ(i, j) is a pairwisefeature vector describing the two products. We then aim to designfeatures that encode the similarity between the two products (doc-uments). The specific choice we adopt is
ψθ(i, j) = (1, θi,1 · θj,1, θi,2 · θj,2, . . . , θi,K · θj,K). (3)
Intuitively, by defining our features to be the elementwise productbetween θi and θj , we are saying that products with similar topicvectors are likely to be linked. The logistic vector β then determineswhich topic memberships should should be similar (or dissimilar)in order for the products to be related.
Our goal then is to simultaneously optimize both topic distribu-tions θd and logistic parameters β to maximize the joint likelihoodof topic memberships and relationships in the product graph:
L(y, T |β, θ, φ, z) =
corpus likelihood︷ ︸︸ ︷∏d∈T
Nd∏j=1
θzd,jφzd,j ,wd,j∏(i,j)∈E
Fβ(ψθ(i, j))∏
(i,j)∈E
(1− Fβ(ψθ(i, j)))
︸ ︷︷ ︸logistic likelihood of the observed graph
. (4)
This expression says that the review corpus should have high like-lihood according to a topic model, but also that those topics shouldbe useful as predictors in a logistic regressor that uses their similar-ity as features. In this way, we will intuitively discover topics thatcorrespond to some concept of document ‘relatedness’.

This idea of jointly training topic and regression models is closelyrelated to the model of [22], where topics were discovered thatare useful as parameters in a latent-factor recommender system.Roughly, in the model of [22], a user would give a high rating to aproduct if their latent user parameters were similar to the topics dis-covered from reviews of that item; topics were then identified thatwere good at predicting users’ ratings of items. The basic model of(eq. 4) is similar in the sense that we are coupling parameters θ andβ in a joint likelihood in order to predict the output variable y.
Directed vs. Undirected Graphs. So far we have shown how totrain topic models to predict links between products. However, thefeature vector of (eq. 3) is symmetric (ψθ(i, j) = ψθ(j, i)), mean-ing that it is only useful for predicting undirected relationships.However, none of the relationships we want to predict are neces-sarily symmetric. For example y may be a good substitute for x ify is a similar product that is cheaper and better rated, but in this casex would be a poor substitute for y. Or, while a replacement batterymay be a good complement for a laptop, recommending a laptopto a user already purchasing a battery makes little sense. Thus weought to account for such asymmetries in our model.
We model such asymmetries by first predicting whether two prod-ucts are related, and then predicting in which direction the relationflows. That is, we predict
p(a has an edge toward b) =
p(a is related to b)×p(edge flows from a to b | a is related to b),
which we denote
p((a, b) ∈ E) = p(a↔ b)︸ ︷︷ ︸‘are they related?’
‘does the edge flow in this direction?’︷ ︸︸ ︷p(a→ b|a↔ b), (5)
where relations (a, b) ∈ E are now ordered pairs (that may existin both directions). We model relations in this way since we ex-pect different types of language or features to be useful for the twotasks—relatedness is a function of what two products have in com-mon, whereas the direction the link flows is a function of how theproducts differ. Indeed, in practice we find that the second predic-tor p(a → b|a ↔ b) tends to pick up qualitative language thatexplains why one product is ‘better than’ another, while the firsttends to focus on high-level category specific topics. Our objectivenow becomes
L(y, T |β, η, θ, φ, z) =
positive relations (F↔) and their direction of flow (F→)︷ ︸︸ ︷∏(i,j)∈E
F↔β (ψθ(i, j))F→η (ϕθ(i, j))(1− F→η (ϕθ(j, i)))
∏(i,j)∈E
(1− F↔β (ψθ(i, j)))
︸ ︷︷ ︸non-relations
∏d∈T
Nd∏j=1
θzd,jφzd,j ,wd,j︸ ︷︷ ︸corpus likelihood
. (6)
Here F↔ is the same as in the previous section, though we haveadded F→η (ϕθ(i, j)) to predict edge directedness; this includes anadditional logistic parameter vector η, as well as an additional fea-ture vector ϕθ(i, j). The specific feature vector we use is
ϕθ(i, j) = (1, θj,1 − θi,1, . . . , θj,K − θi,K), (7)
i.e. the direction in which an edge flows between two items is afunction of the difference between their topic vectors.
Incorporating Other Types of Features. We can easily incorpo-rate manifest features into our logistic regressors, which simply be-come additional dimensions in ϕθ(i, j). We include the differencein price, difference in average (star-) rating, and an indicator thattakes the value 1 if the items were manufactured by different com-panies, allowing the model to capture the fact that users may nav-igate towards (or away from) cheaper products, better rated prod-ucts, or products from a certain brand.
Our entire model ultimately captures the following simple intu-ition: (1) Users navigate between related products, which shouldhave similar topics (“what do a and b have in common?”), and (2)The direction in which users navigate should be related to the dif-ference between topics (“what does b have that a doesn’t?”). Ulti-mately, all of the above machinery has been designed to discovertopics and predictors that capture this intuition.
Learning Multiple Graphs. Next we must generalize our approachto simultaneously learn multiple types of relationships. In our casewe wish to discover a graph of products that users might purchaseinstead (substitute products), as well as a graph of products usersmight purchase in addition (complementary products). Naturally,one could train models independently for each type of relationship.But then one would have two sets of topics, and two predictors thatcould be used to predict links in each graph.
Instead we decide to extend the model from the previous sectionso that it can predict multiple types of relations simultaneously. Wedo this by discovering a single set of topics that work well with mul-tiple logistic predictors. This is a small change from the previousmodel of (eq. 6):
L(y, T |β, η, θ, φ, z) =
corpus likelihood︷ ︸︸ ︷∏d∈T
Nd∏j=1
θzd,jφzd,j ,wd,j
∏g∈G
{ ∏(i,j)∈Eg
F↔βg (ψθ(i, j))F→ηg (ϕθ(i, j))(1− F→ηg (ϕθ(j, i)))
∏(i,j)∈Eg
(1− F↔βg (ψθ(i, j)))
}.
︸ ︷︷ ︸accuracy of the predictors βg and ηg for the graph g
(8)
where each graph g ∈ G contains all relations of a particular type.Note that we learn separate predictors βg and ηg for each graph
g, but we learn a single set of topics (θ) and features (ψ and ϕ)that work well for all graphs simultaneously. We adopt this ap-proach because it provides a larger training set that is more robust tooverfitting compared to training two models separately. Moreoverit means that both logistic regressors operate in the same featurespace; this means that by carefully constructing our labeled train-ing set (to be described in the following section), we can train themodel not only to predict substitute and complementary relation-ships, but also to differentiate between the two, by training it toidentify substitutes as non-complements and vice versa.
3.2.3 Sparse Topics via Product HierarchiesOur goal is to learn topic models on corpora with millions of
products and hundreds of topics. However, training models withhundreds of topics per product is not practical, nor is it realisticfrom a modeling perspective. Rather, each product should drawfrom a small number of topics, which can be encoded using a sparserepresentation [13]. To achieve this we enforce sparsity through aspecific type of hierarchical topic representation that makes use of
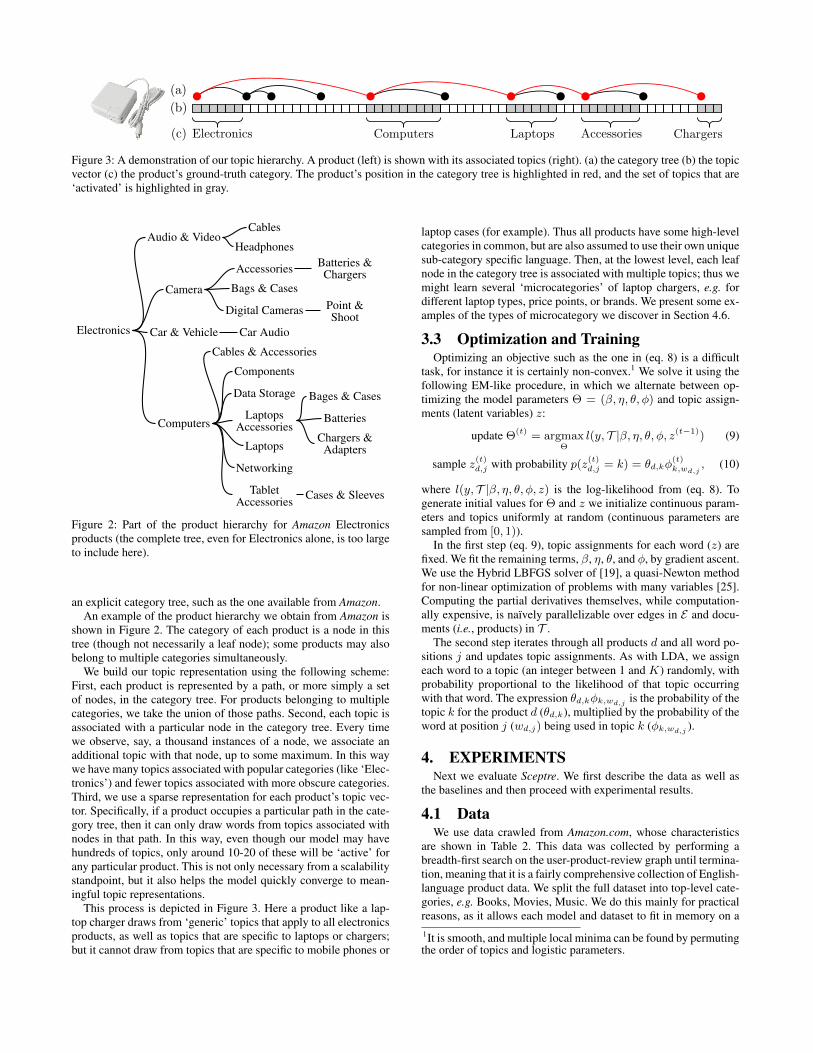
Figure 3: A demonstration of our topic hierarchy. A product (left) is shown with its associated topics (right). (a) the category tree (b) the topicvector (c) the product’s ground-truth category. The product’s position in the category tree is highlighted in red, and the set of topics that are‘activated’ is highlighted in gray.
Electronics
Audio & VideoCables
Headphones
Camera
Accessories Batteries &Chargers
Bags & Cases
Digital Cameras Point &Shoot
Car & Vehicle Car Audio
Computers
Cables & Accessories
Components
Data Storage
LaptopsAccessories
Bages & Cases
Batteries
Chargers &AdaptersLaptops
Networking
TabletAccessories Cases & Sleeves
Figure 2: Part of the product hierarchy for Amazon Electronicsproducts (the complete tree, even for Electronics alone, is too largeto include here).
an explicit category tree, such as the one available from Amazon.An example of the product hierarchy we obtain from Amazon is
shown in Figure 2. The category of each product is a node in thistree (though not necessarily a leaf node); some products may alsobelong to multiple categories simultaneously.
We build our topic representation using the following scheme:First, each product is represented by a path, or more simply a setof nodes, in the category tree. For products belonging to multiplecategories, we take the union of those paths. Second, each topic isassociated with a particular node in the category tree. Every timewe observe, say, a thousand instances of a node, we associate anadditional topic with that node, up to some maximum. In this waywe have many topics associated with popular categories (like ‘Elec-tronics’) and fewer topics associated with more obscure categories.Third, we use a sparse representation for each product’s topic vec-tor. Specifically, if a product occupies a particular path in the cate-gory tree, then it can only draw words from topics associated withnodes in that path. In this way, even though our model may havehundreds of topics, only around 10-20 of these will be ‘active’ forany particular product. This is not only necessary from a scalabilitystandpoint, but it also helps the model quickly converge to mean-ingful topic representations.
This process is depicted in Figure 3. Here a product like a lap-top charger draws from ‘generic’ topics that apply to all electronicsproducts, as well as topics that are specific to laptops or chargers;but it cannot draw from topics that are specific to mobile phones or
laptop cases (for example). Thus all products have some high-levelcategories in common, but are also assumed to use their own uniquesub-category specific language. Then, at the lowest level, each leafnode in the category tree is associated with multiple topics; thus wemight learn several ‘microcategories’ of laptop chargers, e.g. fordifferent laptop types, price points, or brands. We present some ex-amples of the types of microcategory we discover in Section 4.6.
3.3 Optimization and TrainingOptimizing an objective such as the one in (eq. 8) is a difficult
task, for instance it is certainly non-convex.1 We solve it using thefollowing EM-like procedure, in which we alternate between op-timizing the model parameters Θ = (β, η, θ, φ) and topic assign-ments (latent variables) z:
update Θ(t) = argmaxΘ
l(y, T |β, η, θ, φ, z(t−1)) (9)
sample z(t)d,j with probability p(z(t)
d,j = k) = θd,kφ(t)k,wd,j
, (10)
where l(y, T |β, η, θ, φ, z) is the log-likelihood from (eq. 8). Togenerate initial values for Θ and z we initialize continuous param-eters and topics uniformly at random (continuous parameters aresampled from [0, 1)).
In the first step (eq. 9), topic assignments for each word (z) arefixed. We fit the remaining terms, β, η, θ, and φ, by gradient ascent.We use the Hybrid LBFGS solver of [19], a quasi-Newton methodfor non-linear optimization of problems with many variables [25].Computing the partial derivatives themselves, while computation-ally expensive, is naïvely parallelizable over edges in E and docu-ments (i.e., products) in T .
The second step iterates through all products d and all word po-sitions j and updates topic assignments. As with LDA, we assigneach word to a topic (an integer between 1 and K) randomly, withprobability proportional to the likelihood of that topic occurringwith that word. The expression θd,kφk,wd,j is the probability of thetopic k for the product d (θd,k), multiplied by the probability of theword at position j (wd,j) being used in topic k (φk,wd,j ).
4. EXPERIMENTSNext we evaluate Sceptre. We first describe the data as well as
the baselines and then proceed with experimental results.
4.1 DataWe use data crawled from Amazon.com, whose characteristics
are shown in Table 2. This data was collected by performing abreadth-first search on the user-product-review graph until termina-tion, meaning that it is a fairly comprehensive collection of English-language product data. We split the full dataset into top-level cate-gories, e.g. Books, Movies, Music. We do this mainly for practicalreasons, as it allows each model and dataset to fit in memory on a1It is smooth, and multiple local minima can be found by permutingthe order of topics and logistic parameters.

Category Users Items Reviews Edges
Men’s Clothing 1.25M 371K 8.20M 8.22MWomen’s Clothing 1.82M 838K 14.5M 17.5MMusic 1.13M 557K 6.40M 7.98MMovies 2.11M 208K 6.17M 4.96MElectronics 4.25M 498K 11.4M 7.87MBooks 8.20M 2.37M 25.9M 50.0M
All 21.0M 9.35M 144M 237M
Table 2: Dataset statistics for a selection of categories on Amazon.
single machine (requiring around 64GB RAM and 2-3 days to runour largest experiment). Note that splitting the data in this way haslittle impact on performance, as there are few links that cross top-level categories, and the hierarchical nature of our model meansthat few parameters are shared across categories.
To obtain ground-truth for pairs of substitutable and complemen-tary products we also crawl graphs of four types from Amazon:
1. ‘Users who viewed x also viewed y’; 91M edges.2. ‘Users who viewed x eventually bought y’; 8.18M edges.3. ‘Users who bought x also bought y’; 133M edges.4. ‘Users frequently bought x and y together’; 4.6M edges.
We refer to edges of type 1 and 2 as substitutes and edges of type3 or 4 as complements, though we focus on ‘also viewed’ and ‘alsobought’ links in our experiments, since these form the vast major-ity of the dataset. Note the minor differences between certain edgetypes, e.g. edges of type 4 indicate that two items were purchasedas part of a single basket, rather than across sessions.
4.2 Experimental SettingWe split our training data (E and E) into 80% training, 10% val-
idation, 10% test, discarding products with fewer than 20 reviews.In all cases we report the error on the test set. The iterative fittingprocess described in (eqs. 9 and 10) continues until no further im-provement is gained on the validation set.
Sampling Non-Edges. Since it is impractical to train on all pairsof non-links, we start by building a balanced dataset by samplingas many non-links as there are links (i.e., |E| = |E |).
However, we must be careful about how non-links (i.e., negativeexamples) are sampled. Sampling random pairs of unrelated prod-ucts makes negative examples very ‘easy’ to classify; rather, sincewe want the model to be able to differentiate between edge types,we treat substitute links as negative examples of complementaryedges and vice versa. Thus, we explicitly train the model to iden-tify substitutes as non-complements and vice versa (in addition to arandom sample of non-edges). This does not make prediction ‘eas-ier’, but it helps the model to learn a better separation between thetwo edge types, by explicitly training it to learn distinct notions ofthe two concepts.
In the following, we consider both link prediction and rankingtasks: (1) to estimate for a pair of products whether they are related,and (2) for a given query, rank those items that are most likely tobe related. We first describe the baselines we compare against.
4.3 BaselinesRandom. Link probabilities Fβ and Fη are replaced with randomnumbers between 0 and 1. Note that since both predictors have to‘fire’ to predict a relation, random classification identifies 75% ofdirected edges as non-links; imbalance in the number of positivevs. negative relations of each type (due to our sampling procedure
described above) explains why the performance of random classi-fication is slightly different across experiments.
LDA + logistic regression (LDA). Rather than training topic mod-els and logistic parameters simultaneously, this baseline first trainsa topic model and then trains logistic classifiers on the pre-trainedtopics. This baseline assesses our claim that Sceptre learns topicsthat are ‘good as’ features for edge prediction, by comparing it to amodel whose topics were not trained specifically for this purpose.We used Vowpal Wabbit to pre-train the topic model, and fit modelswith K = 100 topics for each Amazon category.
We also experimented with a baseline in which features were de-fined over words rather than topics. That is, topics θi for each prod-uct are replaced by TF-IDF scores for words in its reviews [20].Logistic parameters β and η are then trained to determine whichtf-idf-weighted words are good at predicting the presence or ab-sence of edges. This baseline was uniformly weaker than our otherbaselines, so we shall not discuss its performance further.
Category-Tree (CT). Since we make use of Amazon’s categorytree when building our model, it is worth questioning the extent towhich the performance of our model owes to our decision to usethis source of data. For this baseline, we compute the co-counts be-tween categories c1 → c2 that are observed in our training data.Then we predict that an edge exists if it is among the 50th per-centile of most commonly co-occurring categories. In other wordsthis baseline ‘lifts’ links to the level of categories rather than indi-vidual products.2
Item-to-Item Collaborative Filtering (CF). In 2003 Amazon re-ported that their own recommendation solution was a collaborative-filtering approach, that identified items that had been browsed orpurchased by similar sets of users [17]. This baseline follows thesame procedure, though in lieu of actual browsing or purchasingdata we consider sets of users who have reviewed each item. Wethen proceed by computing for each pair of products a and b the co-sine similarity between the set of users who reviewed a and the setof users who reviewed b. Sorting by similarity generates a rankedlist of recommendations for each product. Since this method is notprobabilistic we only report its performance at ranking tasks.
4.4 Link Prediction and RankingLink Prediction. Our first goal is to predict for a given pair ofproducts (a, b), and a graph type g, whether there is a link from ato b in Eg . We optimize exactly the objective in (eq. 8). Note that aprediction is correct when• for each test edge (in each graph): a→ b,F↔θ (ψ(a, b), β) > 0 and F→θ (ϕ(a, b), η) > 0• for each non-edge a 6→ b,F↔θ (ψ(a, b), β) ≤ 0 or F→θ (ϕ(a, b), η) ≤ 0,
in other words the model must correctly predict both that the linkexists and its direction.
Results are shown in Table 3 for each of the datasets in Table2. We also show results from ‘Baby’ clothes, to demonstrate thatperformance does not degrade significantly on a (relatively) smallerdataset (43k products). ‘Substitute’ links were unavailable for thevast majority of products from Music and Movies in our crawl, soresults are not shown. We summarize the main findings from thistable as follows:
1. Sceptre is able to accurately predict both substitute and com-plement links across all product categories, with performance
2We experimented with several variations on this theme, and thisapproach yielded the best performance.

being especially accurate for clothing and electronics prod-ucts. Accuracy is between 85.57-96.76% for the binary pre-diction tasks we considered.
2. Prediction of ‘substitute’ links is uniformly more accuratethan ‘complement’ links for all methods, both in absolute(left two columns) and relative (right two columns) terms.This matches our intuition that substitute links should be‘easier’ to predict, as they essentially correspond to some no-tion of similarity, whereas the semantics of complements aremore subtle.
3. The performance of the baselines is variable. For substitutelinks, our LDA baseline obtains reasonable performance onBooks and Electronics, whereas the Category Tree (CT) base-line is better for Clothing. In fact, the CT baseline performssurprisingly well at predicting substitute links, for the simplereason that substitutable products often belong to the samecategory as each other.
4. None of the baselines yield satisfactory performance whenpredicting complement links. Thus we conclude that neitherthe topics uncovered by a regular topic model, nor the cate-gory tree alone are capable of capturing the subtle notions ofwhat makes items complementary.
Ultimately we conclude that each of the parts of Sceptre contributeto its accurate performance. Category information is helpful, butalone is not useful to predict complements; and simultaneous train-ing of topic models and link prediction is necessary to learn usefultopic representations.
Ranking. In many applications distinguishing links from non-linksis not enough as for each product we would like to recommend alimited number of substitutes and complements. Thus, it is impor-tant that relevant items (i.e., relevant relations) are ranked higherthan irrelevant ones, regardless of the likelihood that the model as-signs to each recommendation.
A standard measure to evaluate ranking methods is the preci-sion@k. Given a set of recommended relations of a given type rec,and a set of known-relevant products rel (i.e., ground-truth links)the precision is defined as
precision = |rel ∩ rec|/|rec|, (11)
i.e., the fraction of recommended relations that were relevant. Theprecision@k is then the precision obtained given a fixed budget,i.e., when |rec| = k. This is relevant when only a small number ofrecommendations can be surfaced to the user, where it is importantthat relevant products appear amongst the first few suggestions.
Figure 4 reports the precision@k on Men’s and Women’s cloth-ing. Note that we naturally discard candidate links that appearedduring training. This leaves only a small number of relevant prod-ucts for each query item in the corpus—the random baseline (whichup to noise should be flat) has precision around 5× 10⁻⁵, indicat-ing that only around 5 in 100,000 products are labeled as ‘relevant’in this experiment. This, in addition to the fact that many relevantitems may not be labeled as such (there are presumably thousandsof pairs of substitutable pants in our corpus, but only 30 or so arerecommended for each product) highlights the incredible difficultyof obtaining high precision scores for this task.
Overall, collaborative filtering is one to two orders-of-magnitudemore accurate than random rankings, while Sceptre is an order ofmagnitude more accurate again (our LDA and TF-IDF baselineswere less accurate than collaborative filtering and are not shown).3
3Note that collaborative filtering is done here at the level of re-viewed products, which is naturally much sparser than the purchaseand browsing data used to produce the ground-truth.
Accuracy Error reductionvs. random
Category Method Subst. Compl. Subst. Compl.
Men’sClothing
Random 60.27% 57.70% 0.0% 0.0%LDA 70.62% 65.95% 26.05% 19.50%
CT 78.69% 61.06% 46.38% 7.946%Sceptre 96.69% 94.06% 91.67% 85.97%
Women’sClothing
Random 60.35% 56.67% 0.0% 0.0%LDA 70.70% 64.80% 26.11% 18.75%
CT 81.05% 69.08% 52.21% 28.63%Sceptre 95.87% 94.14% 89.59% 86.47%
Music
Random - 50.18% - 0.0%LDA - 52.39% - 4.428%
CT - 57.02% - 13.71%Sceptre - 90.43% - 80.78%
Movies
Random - 51.22% - 0.0%LDA - 54.26% - 6.235%
CT - 66.34% - 30.99%Sceptre - 85.57% - 70.42%
Electronics
Random 69.98% 55.67% 0.0% 0.0%LDA 89.90% 61.90% 66.35% 14.06%
CT 87.26% 60.18% 57.57% 10.17%Sceptre 95.70% 88.80% 85.69% 74.74%
Books
Random 69.93% 55.35% 0.0% 0.0%LDA 89.91% 60.59% 66.47% 11.75%
CT 87.80% 66.28% 59.42% 24.49%Sceptre 93.76% 89.86% 79.25% 77.29%
BabyClothes
random 62.93% 52.47% 0.0% 0.0%LDA 75.86% 54.73% 34.89% 4.75%
CT 79.31% 64.56% 44.18% 25.43%Sceptre 92.18% 93.65% 78.91% 86.65%
Average Sceptre 94.83% 90.23% 85.02% 80.33%
Table 3: Link prediction accuracy for substitute and complementlinks (the former are not available for the majority of Music/Moviesproducts in our dataset). Absolute performance is shown at left,reduction in error vs. random classification at right.
Examples of recommendations generated by Sceptre are shownin Figure 6.
4.5 Cold-Start Prediction without ReviewsAlthough it is promising that we are able to recommend substi-
tutes and complements from the text of product reviews, an obviousquestion remains as to what can be done for new products, that donot yet have any reviews associated with them, known as the ‘cold-start’ problem in recommender systems [16, 24, 27, 30, 36]. Toaddress this problem, we note that Sceptre merely requires that wehave some source of text associated with each linked item in orderto learn a model of which products are likely to be related.
To evaluate the possibility of using sources of text other than re-views, we collected descriptive text about each item in our AmazonBooks catalog, including blurbs, ‘about the author’ snippets, andeditorial reviews. We also collected manufacturer’s descriptions fora subset of our Electronics data. Training on these sources of data,Sceptre obtained accuracies between 91.28% and 93.67% at pre-dicting substitutes and complements (see Table 4). This result im-plies that training is possible on diverse sources of text beyond just

Accuracy Error reductionvs. random
Category Subst. Compl. Subst. Compl.
Electronics, cold-start 91.28% 93.22% 70.95% 84.71%Books, cold-start 96.76% 93.67% 89.22% 85.81%
Table 4: Link prediction accuracy using cold-start data (manufac-turer’s and editorial descriptions).
0 200 400 600 800 1000
k
10−5
10−4
10−3
10−2
10−1
100
prec
isio
n@
k
Women’s (Substitutes)SceptreCollab. Filteringrandom
0 200 400 600 800 1000
k
10−5
10−4
10−3
10−2
10−1
100
prec
isio
n@
k
Women’s (Complements)SceptreCollab. Filteringrandom
0 200 400 600 800 1000
k
10−5
10−4
10−3
10−2
10−1
100
prec
isio
n@
k
Men’s (Substitutes)SceptreCollab. Filteringrandom
0 200 400 600 800 1000
k
10−5
10−4
10−3
10−2
10−1
100
prec
isio
n@
k
Men’s (Complements)SceptreCollab. Filteringrandom
Figure 4: Precision@k for Women’s and Men’s clothing.
product reviews, and that Sceptre can be applied in cold-start set-tings, even when no reviews are available.4
4.6 Topic AnalysisNext we analyze the types of topics discovered by Sceptre. As
we recall from Section 3.2.3, each topic is associated with a nodein Amazon’s category tree. But, just as a high-level category suchas clothing can naturally be separated into finer-grained categorieslike socks, shoes, hats, pants, dresses (etc.), we hope that Sceptrewill discover even subtler groupings of products that are not imme-diately obvious from the hand-labeled category hierarchy.
Table 5 shows some of the topics discovered by Sceptre, on twoAmazon categories: Electronics and Men’s Clothing. We prunedour dictionary by using adjectives, nouns, and adjective-noun pairs(as determined by WordNet [9]), as well as any words appearing inthe ‘brand’ field of our crawled data. For visualization we computethe 10 highest-weight words from all topics, after first subtracting a‘background’ topic containing the average weight across all topics.That is for each topic k we report the 10 highest values of
φk −1
K
∑k′
φk′ .︸ ︷︷ ︸background word distribution
(12)
By doing so, stopwords and other language common to all topicsappears only in the background distribution.4Note that this is not directly comparable to review-based resultssince different subsets of our corpus have reviews vs. descriptions.
latex suckstop-1 top-5
0
1
frac.
oftim
esse
lect
ed substitutes
top-1 top-5
complements
amazonSceptre
Figure 5: Results of our user study. Users were asked to selectwhich recommendations (ours or Amazon’s) were preferable sub-stitutes/complements (users could also select neither or both).
The topics we obtain are closely aligned with categories fromAmazon (e.g. electronics topic e111, or clothing topic c110), thoughthis is to be expected since our topic model is built on top of an ex-plicit hierarchy as in Figure 3. However, we note that finer-grained‘microcategories’ are discovered that are not explicitly present inthe hierarchy, e.g. high-end headphones are distinguished from che-aper models (e89 and e99), and running shoes are distinguishedbased on distinct running styles (c133, c134, and c156).
We also note that brand words predominate in several topics,e.g. high-end headphones can be identified by words like ‘Sennhei-ser’, ‘AKG’ etc. (e89), and high-end t-shirts can be identified bywords like ‘Ralph Lauren’ and ‘Geoffrey Beene’ (c52). At the ex-treme end, a single product may have its own topic, e.g. the popular‘three-wolf moon’ shirt (c49), whose reviews have already inspiredacademic discussion [29]. Here the product’s high popularity andunique word distribution means that dedicating it an entire topicsubstantially increases the corpus likelihood in (eq. 8). Note thatwe only show a fraction of the full set of topics discovered by ourmodel; other common camera brands (etc.) are covered among thelarge range of topics not shown here.
Finally, while some topics are highly specific, like those referringto individual products or brands, others are more generic, such asclothing topics c9 and c24. Such topics tend to appear toward thetop of the category hierarchy (see Fig. 3), for example the topic c9is associated with the ‘Clothing’ node, whereas c24 is associatedwith its child, ‘Clothing: Men’, of which all other topics in Table5 are descendants. Intuitively, these are much like ‘background’distributions, containing words that are relevant to the majority ofclothing products, like durability, fit, warmth, color, packaging, etc.
4.7 User StudyFinally we perform a user study to evaluate the quality of the rec-
ommendations produced by Sceptre. Naturally we would not expectthat a fully-supervised algorithm would produce predictions thatwere somehow ‘better’ than the ground-truth used to train it. How-ever, we hope Sceptre may correct for some noise in the ground-truth, since while users may often buy multiple pairs of jeans to-gether (for example) we are explicitly training the system to iden-tify complementary items that would not be substitutable.
We used Mechanical Turk to compare Sceptre’s recommenda-tions to Amazon’s ‘also viewed’ and ‘also bought’ suggestions, fora random sample of 200 Clothing items. Human judges identifiedwhich recommendations they felt were acceptable substitutes andcomplements (surfaced in a random order without labels; a screen-shot is shown in Fig. 6d). Judges evaluated the top recommenda-tion, and top-5 recommendations separately, yielding results shownin Figure 5.
We see here that Amazon’s ‘also viewed’ links generate prefer-able substitutes, indicating that large volumes of browsing datayield acceptable substitute relationships with relatively little noise.On the other hand, Sceptre’s complement links are overwhelmingly

Electronicse111 e92 e75 e79 e78 e50 e69 e85 e96 e89 e99
cameras portable speakers cases Samsungcases
heavy-dutycases
styli batteries portable radios car radios high-endheadphones
budgetheadphones
camera little speaker leather Galaxy Otterbox pen batteries radio radio bass basszoom bose case elastic Defender tip battery weather Pioneer Sennheiser Skullcandy
pictures portable speaker soft magnets protection Bamboo charged crank factory Bose soundKodak small speaker Roocase Samsung bulky Wacom rechargeable solar Metra Shure budCanon sound velcro leather kids styli oem Eton Ford Beats outside noiseflash iHome closed closed shell gloves Sanyo Baofeng dash Koss another pair
digital bass material auto Survivor Friendly Swede Lenmar radio reception Honda Akg comfortableoptical wireless speaker snug closing protected pencil alkaline miles Jeep music gymtaken great speaker protection elastic strap safe capacitive Energizer fm wiring classical Beats
picture mini speaker standing cover protective precise full charge alert deck Klipsch head
Men’s clothingc44 c107 c75 c49 c52 c110 c156 c134 c133 c24 c9
dress shirts dress shoes dress pants three-wolfshirt
polo shirts boots minimalistrunning
athleticrunning sports shoes generic
clothinggenericclothing
sleeves leather expandable wolf Polo Bates running Balance court dry samearms sole expandable waist moon Lauren Red Wing trail New play cold durableneck dress Dockers three Ralph leather barefoot wide Nike working store
shoulders brown iron power Beene good boot Altra running running shoe short differentdress shirt dress shoe khaki trailer nice shirt casual boot running shoe series running hot two
dress polish stretch waist hair Geoffrey dress boot minimalist feet games weather brandjacket brown pair hidden man great shirt right boot zero drop usa light shoe tight comfort
long sleeve toe ironed short-sleeve quality shirt motorcycle road cross training great shoe cool fineiron looking shoe dress pant magic white shirt Wings glove athletic shoe support down tight
tucked formal elastic waist powerful fitted shirt Rangers run cross miles regular another pair
Table 5: A selection of topics from Electronics and Men’s Clothing along with our labels for each topic. Top 10 words/bigrams from eachtopic are shown after subtracting the background distribution. Capital letters denote brand names (Bamboo, Wacom, Red Wing, etc.).
preferred, suggesting that our decision to model complements asnon-substitutes qualitatively improves performance.
5. BUILDING THE PRODUCT GRAPHHaving produced ranked lists of recommended relationships, our
final task is to surface these recommendations to a potential user ofour system in a meaningful way.
While conceptually simple, comparing all products against allothers quickly becomes impractical in a corpus with millions ofproducts. Our goal here is to rank all links, and surface those whichhave the highest likelihood under the model. That is, for each graphtype g we would like to recommend
recg(i) = argmaxS∈(T \{i})R
∑j∈S
F↔βg (ψθ(i, j))F→ηg (ϕθ(i, j)), (13)
where S ∈ (T \ {i})R is a set of R products other than i itself.While computing the score for a single candidate edge is very
fast (O(K) operations), on a dataset with millions of products thisalready results in an unacceptable delay when ranking all possiblerecommendations. Similar to [17] we implemented two modifica-tions that make this enumeration procedure feasible (on the order ofa few milliseconds). The first is to ignore obscure products by limit-ing the search space by some popularity threshold; we consider thehundred-thousand most popular products per-category when gener-ating new recommendations. The second is to cull the search spaceusing the category tree explicitly; e.g. when browsing for runningshoes we can ignore, say, camera equipment and limit our search toclothing and shoes. Specifically, we only consider items belongingto the same category, its parent category, its child categories, andits sibling categories (in other words, its ‘immediate family’). It isvery rare that the top-ranked recommendations belong to distantcategories, so this has minimal impact on performance.
Another issue is that of adding new products to the system. Nat-urally, it is not feasible to re-train the system every time a newproduct is added. However, this is thankfully not necessary, as theintroduction of a small number of products will not fundamentallychange the word distribution φ. Thus it is simply a matter of esti-mating the product’s topic distribution under the existing model, ascan be done using LDA [4].
When assembling our user interface (see Figs. 1 and 6) we usethe discovered topics from Section 4.6 to ‘explain’ recommenda-tions to users, by selecting sentences whose language best explainswhy the recommended product was predicted. Specifically, we high-light sentences whose words yield the largest response to F→ηg .
Reproducing Sceptre. All data and code used in this paper, as wellas the interface from Figure 6 is available on the first author’s web-page: http://cseweb.ucsd.edu/~jmcauley/.
6. CONCLUSIONA useful recommender system must produce recommendations
that not only match our preferences, but which are also relevant toour current topic of interest. For a user browsing a particular prod-uct, two useful notions of relevant recommendations include sub-stitutes and complements: products that can be purchased instead ofeach other, and products that can be purchased in addition to eachother. In this paper, our goal has been to learn these concepts fromproduct features, especially from the text of their reviews.
We have presented Sceptre, a model for predicting and under-standing relationships between linked products. We have appliedthis to the problem of identifying substitutable and complementaryproducts on a large collection of Amazon data, including 144 mil-lion reviews and 237 million ground-truth relationships based onbrowsing and co-purchasing logs.

(a) Men’s clothing (b) Women’s clothing (c) Electronics (d) mturk interface
Figure 6: (a,b,c) Examples of recommendations produced by Sceptre; the top of each subfigure shows the query product, the left columnshows substitutes recommended by Sceptre, and the right column shows complements. (d) Interface used to evaluate Sceptre on MechanicalTurk; Turkers are shown lists of items suggested by Amazon (i.e., the ground-truth) and Sceptre and must identify which lists they prefer.
References[1] R. Balasubramanyan and W. Cohen. Block-LDA: Jointly modeling
entity-annotated text and entity-entity links. In SDM, 2011.[2] J. Bennett and S. Lanning. The Netflix prize. In KDD Cup and Work-
shop, 2007.[3] D. Blei and J. McAuliffe. Supervised topic models. In NIPS, 2007.[4] D. Blei, A. Ng, and M. Jordan. Latent Dirichlet allocation. JMLR,
2003.[5] D. M. Blei, T. Griffiths, M. Jordan, and J. Tenenbaum. Hierarchi-
cal topic models and the nested Chinese restaurant process. In NIPS,2003.
[6] S. Brody and N. Elhadad. An unsupervised aspect-sentiment modelfor online reviews. In ACL, 2010.
[7] J. Chang and D. Blei. Relational topic models for document networks.In AIStats, 2009.
[8] J. Chang, J. Boyd-Graber, and D. Blei. Connections between the lines:augmenting social networks with text. In KDD, 2009.
[9] C. Fellbaum. WordNet: An Electronic Lexical Database. BradfordBooks, 1998.
[10] M. Gamon, A. Aue, S. Corston-Oliver, and E. Ringger. Pulse: Miningcustomer opinions from free text. In IDA, 2005.
[11] G. Ganu, N. Elhadad, and A. Marian. Beyond the stars: Improvingrating predictions using review text content. In WebDB, 2009.
[12] S. Jagabathula, N. Mishra, and S. Gollapudi. Shopping for productsyou don’t know you need. In WSDM, 2011.
[13] B. Kanagal, A. Ahmed, S. Pandey, V. Josifovski, J. Yuan, andL. Garcia-Pueyo. Supercharging recommender systems using tax-onomies for learning user purchase behavior. VLDB, 2012.
[14] Y. Koren and R. Bell. Advances in collaborative filtering. In Recom-mender Systems Handbook. Springer, 2011.
[15] Y. Koren, R. Bell, and C. Volinsky. Matrix factorization techniquesfor recommender systems. Computer, 2009.
[16] A. Levi, O. Mokryn, C. Diot, and N. Taft. Finding a needle in ahaystack of reviews: cold start context-based hotel recommender sys-tem. In RecSys, 2012.
[17] G. Linden, B. Smith, and J. York. Amazon.com recommendations:Item-to-item collaborative filtering. IEEE Internet Computing, 2003.
[18] Y. Liu, A. Niculescu-Mizil, and W. Gryc. Topic-link LDA: joint mod-
els of topic and author community. In ICML, 2009.[19] Y. Liu, W. Wang, B. Lévy, F. Sun, D.-M. Yan, L. Lu, and C. Yang. On
centroidal Voronoi tessellation – energy smoothness and fast compu-tation. ACM Trans. on Graphics, 2009.
[20] C. D. Manning, P. Raghavan, and H. Schütze. Introduction to Infor-mation Retrieval. Cambridge University Press, 2008.
[21] A. Mas-Colell, M. Whinston, and J. Green. Microeconomic Theory.Oxford University Press, 1995.
[22] J. McAuley and J. Leskovec. Hidden factors and hidden topics: un-derstanding rating dimensions with review text. In RecSys, 2013.
[23] S. Moghaddam and M. Ester. On the design of LDA models foraspect-based opinion mining. In CIKM, 2012.
[24] S. Moghaddam and M. Ester. The FLDA model for aspect-based opin-ion mining: Addressing the cold start problem. In WWW, 2013.
[25] J. Nocedal. Updating quasi-newton matrices with limited storage.Mathematics of Computation, 1980.
[26] D. Panigrahi and S. Gollapudi. Result enrichment in commerce searchusing browse trails. In WSDM, 2011.
[27] S.-T. Park and W. Chu. Pairwise preference regression for cold-startrecommendation. In RecSys, 2009.
[28] A. Popescu and O. Etzioni. Extracting product features and opinionsfrom reviews. In HLT, 2005.
[29] A. Reyes and P. Rosso. Mining subjective knowledge from customerreviews: A specific case of irony detection. In HLT, 2011.
[30] A. Schein, A. Popescul, L. Ungar, and D. Pennock. Methods andmetrics for cold-start recommendations. In SIGIR, 2002.
[31] I. Titov and R. McDonald. A joint model of text and aspect ratings forsentiment summarization. In ACL, 2008.
[32] I. Titov and R. McDonald. Modeling online reviews with multi-graintopic models. In WWW, 2008.
[33] D. Vu, A. Asuncion, D. Hunter, and P. Smyth. Dynamic egocentricmodels for citation networks. In ICML, 2011.
[34] C. Wang and D. Blei. Collaborative topic modeling for recommendingscientific articles. In KDD, 2011.
[35] J. Zheng, X. Wu, J. Niu, and A. Bolivar. Substitutes or complements:another step forward in recommendations. In EC, 2009.
[36] K. Zhou, S.-H. Yang, and H. Zha. Functional matrix factorizations forcold-start recommendation. In SIGIR, 2011.


![Inferring Complementary Products from Baskets and Browsing … · 2018. 9. 27. · (increase conversion rate), do cross-selling, improve users loyalty and retention [22]. These effects](https://static.fdocuments.net/doc/165x107/601d00aa71478324c50941a9/inferring-complementary-products-from-baskets-and-browsing-2018-9-27-increase.jpg)


![Inferring Networks of Substitutable and Complementary Products · interest in products to provide personalized recommendations [14, 30, 34, 36], another important problem is to understand](https://static.fdocuments.net/doc/165x107/5eda62aeb3745412b571415d/inferring-networks-of-substitutable-and-complementary-products-interest-in-products.jpg)