Inference for Proportions One Sample. Confidence Intervals One Sample Proportions.
63
Inference for Inference for Proportions Proportions One Sample One Sample
-
Upload
doreen-stevenson -
Category
Documents
-
view
240 -
download
8
Transcript of Inference for Proportions One Sample. Confidence Intervals One Sample Proportions.
Inference for Proportions Inference for Proportions One Sample One Sample
Confidence Intervals
One Sample Proportions

Rate your confidenceRate your confidence0 - 1000 - 100
• Name my age within 10 years?• within 5 years?• within 1 year?
• Shooting a basketball at a wading pool, will make basket?
• Shooting the ball at a large trash can, will make basket?
• Shooting the ball at a carnival, will make basket?
What happens to your confidence as the interval gets smaller?
The larger your confidence, the wider the interval.

Point Estimate
• Use a singlesingle statistic based on sample data to estimate a population parameter
• Simplest approach
• But not always very precise due to variationvariation in the sampling distribution

Confidence intervalsConfidence intervals
• Are used to estimate the unknown population parameter
• Formula:
estimate + margin of error
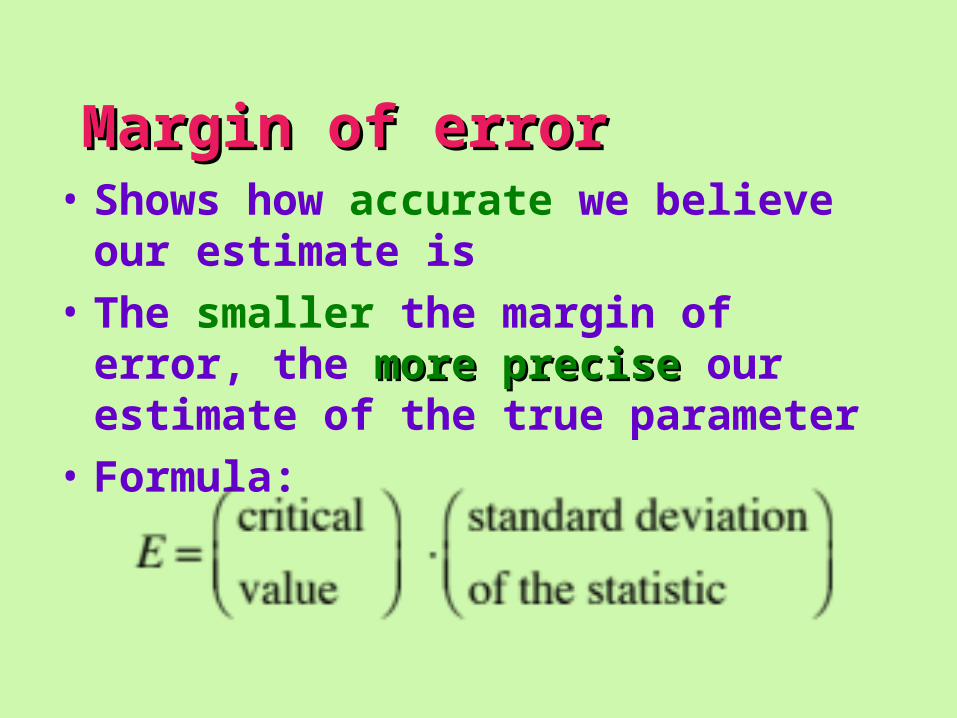
Margin of errorMargin of error• Shows how accurate we believe our estimate
is
• The smaller the margin of error, the more more preciseprecise our estimate of the true parameter
• Formula:
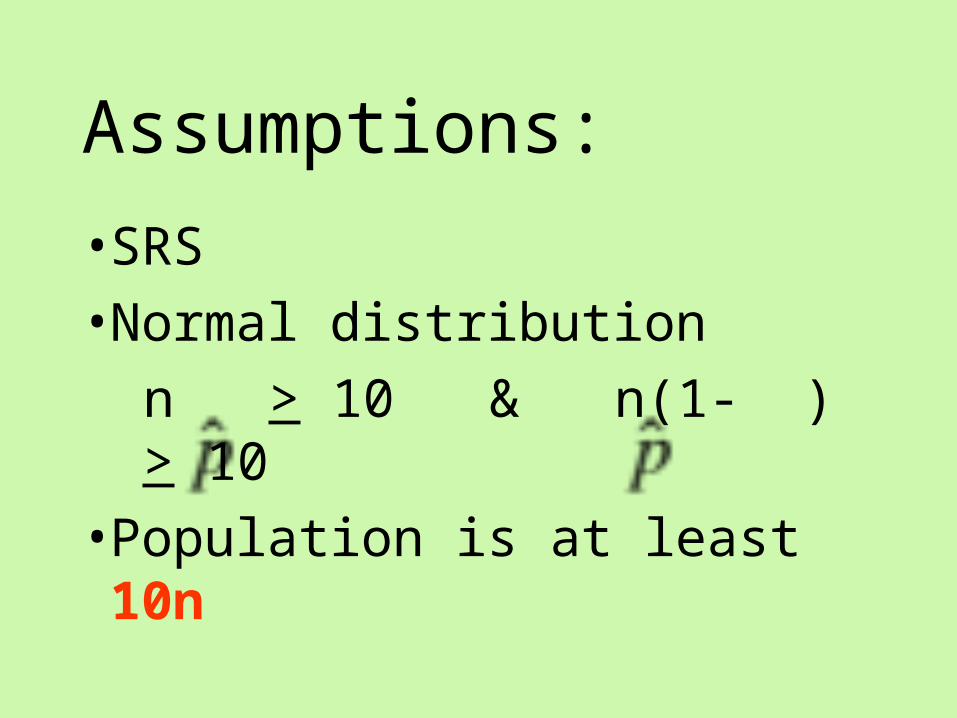
Assumptions:
• SRS
• Normal distribution
n > 10 & n(1- ) > 10
• Population is at least 10n
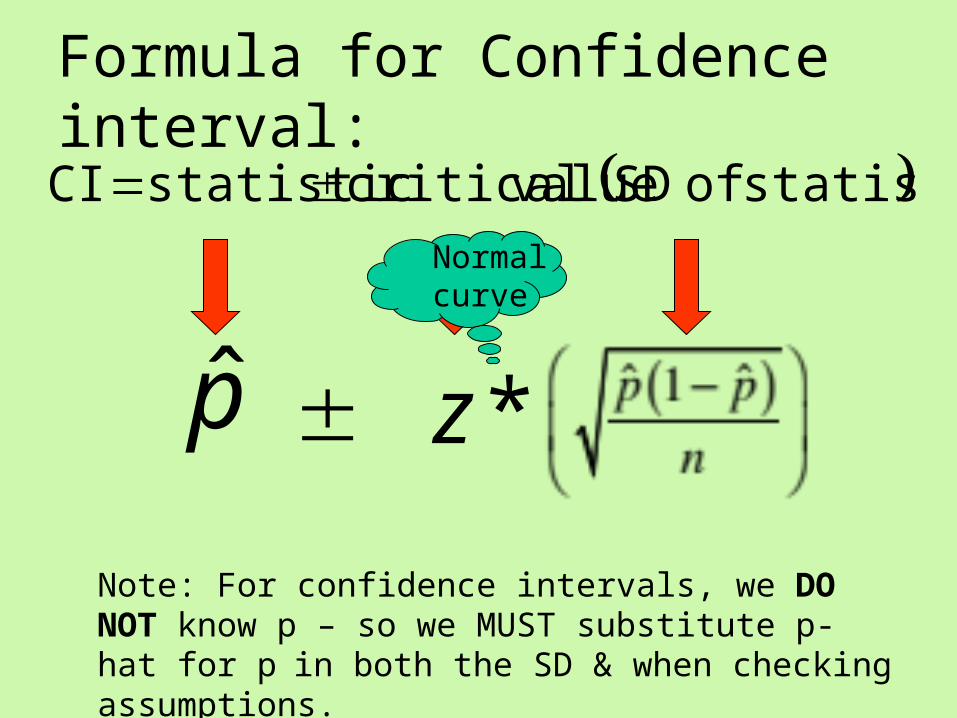
Formula for Confidence interval:
statistic of SD valuecritical statisticCI
p̂ *z
Normal curve
Note: For confidence intervals, we DO NOT know p – so we MUST substitute p-hat for pin both the SD & when checking assumptions.
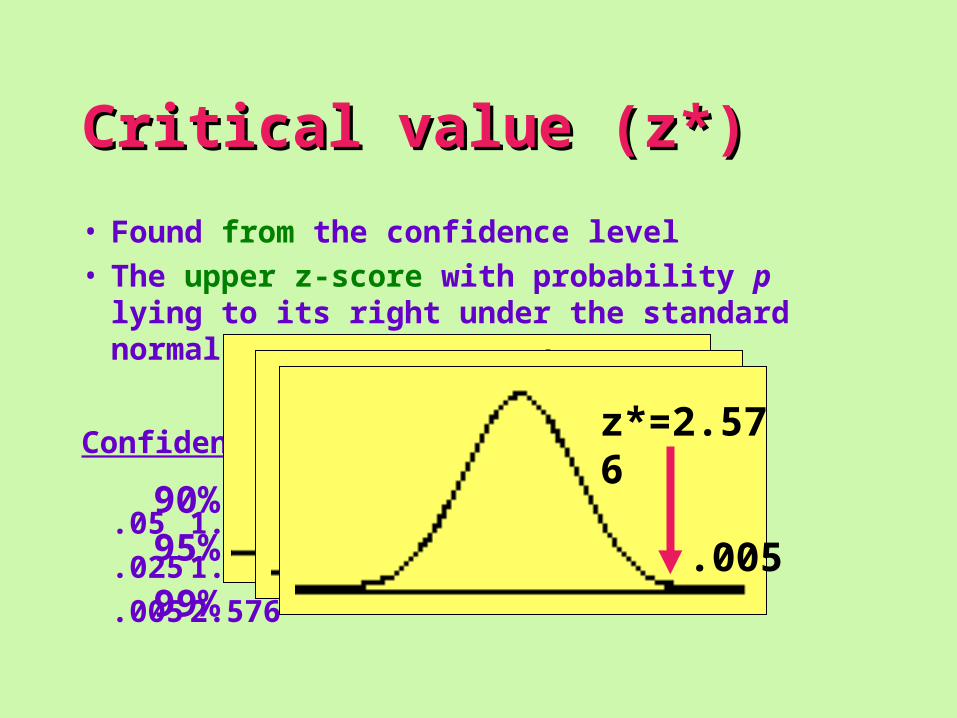
• Found from the confidence level• The upper z-score with probability p lying to its
right under the standard normal curve
Confidence level Tail Area Z*
.05 1.645
.025 1.96
.005 2.576
Critical value (z*)Critical value (z*)
.05
z*=1.645
.025
z*=1.96
.005
z*=2.576
90%95%
99%

Confidence levelConfidence level
• Is the success rate of the method used to construct the interval
• Using this method, ____% of the time the intervals constructed will contain the true population parameter
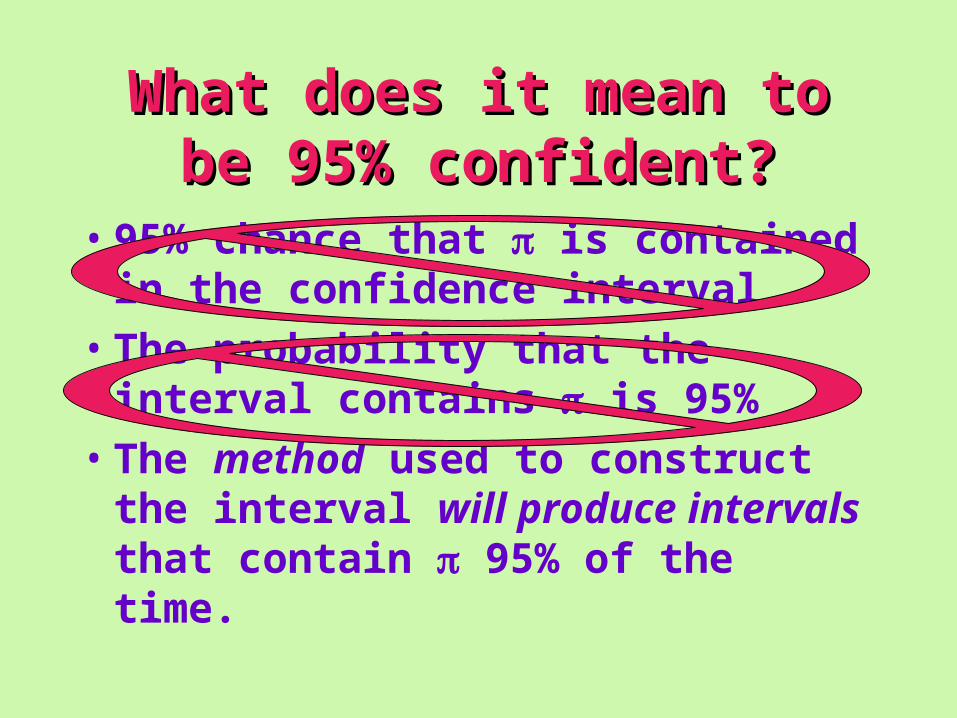
What does it mean to be 95% What does it mean to be 95% confident?confident?
• 95% chance that is contained in the confidence interval
• The probability that the interval contains is 95%
• The method used to construct the interval will produce intervals that contain 95% of the time.
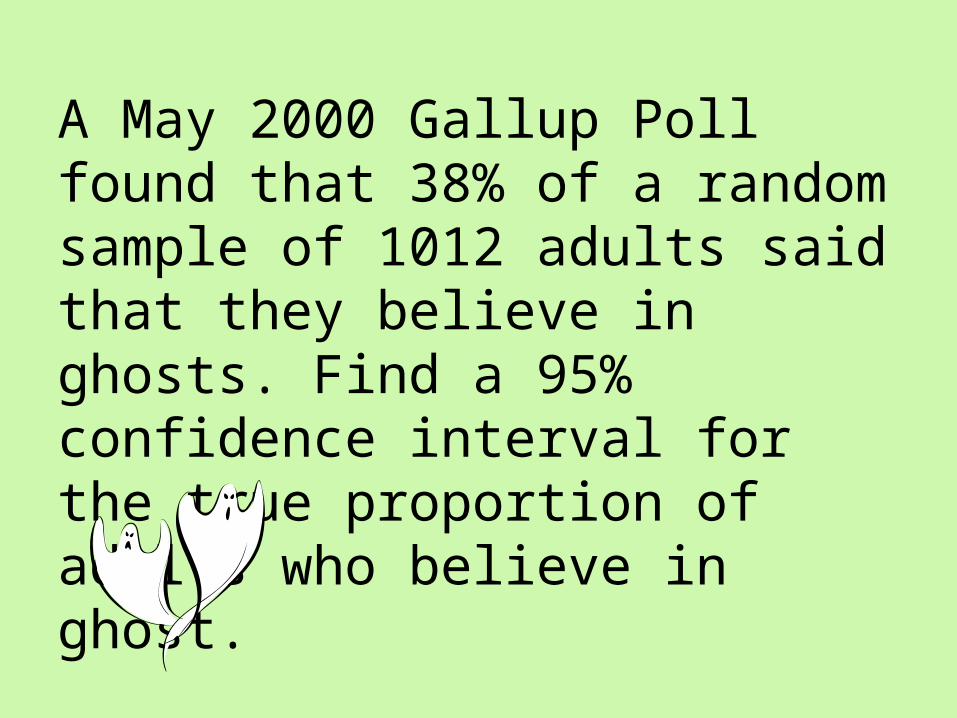
A May 2000 Gallup Poll found that 38% of a random sample of 1012 adults said that they believe in ghosts. Find a 95% confidence interval for the true proportion of adults who believe in ghost.
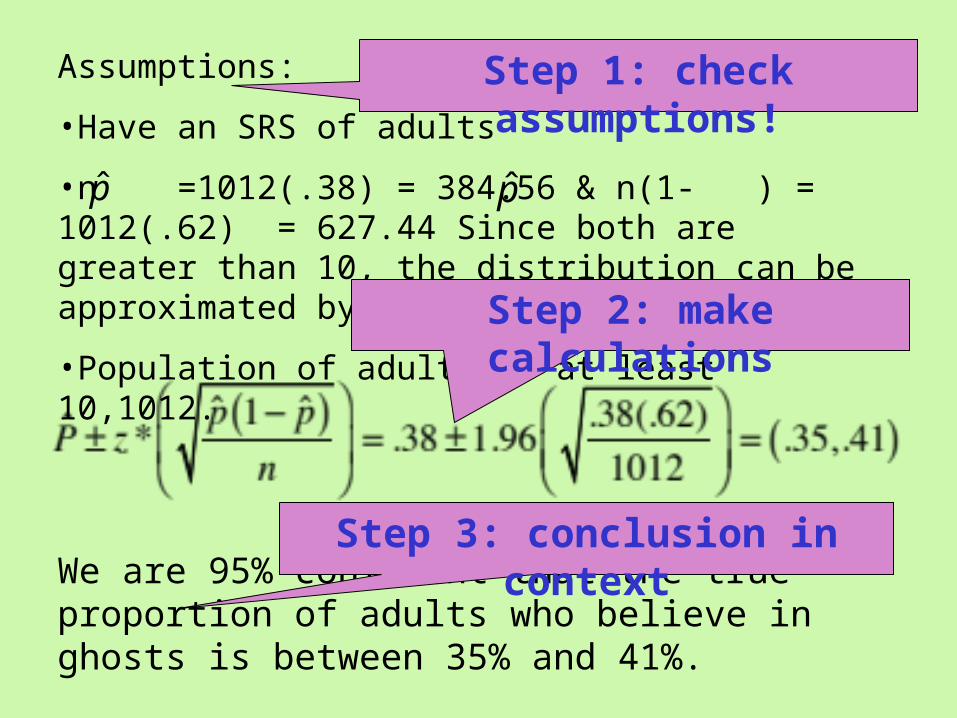
Assumptions:
•Have an SRS of adults
•n =1012(.38) = 384.56 & n(1- ) = 1012(.62) = 627.44 Since both are greater than 10, the distribution can be approximated by a normal curve
•Population of adults is at least 10,1012.
We are 95% confident that the true proportion of adults who believe in ghosts is between 35% and 41%.
Step 1: check assumptions!
Step 2: make calculations
Step 3: conclusion in context
p̂p̂
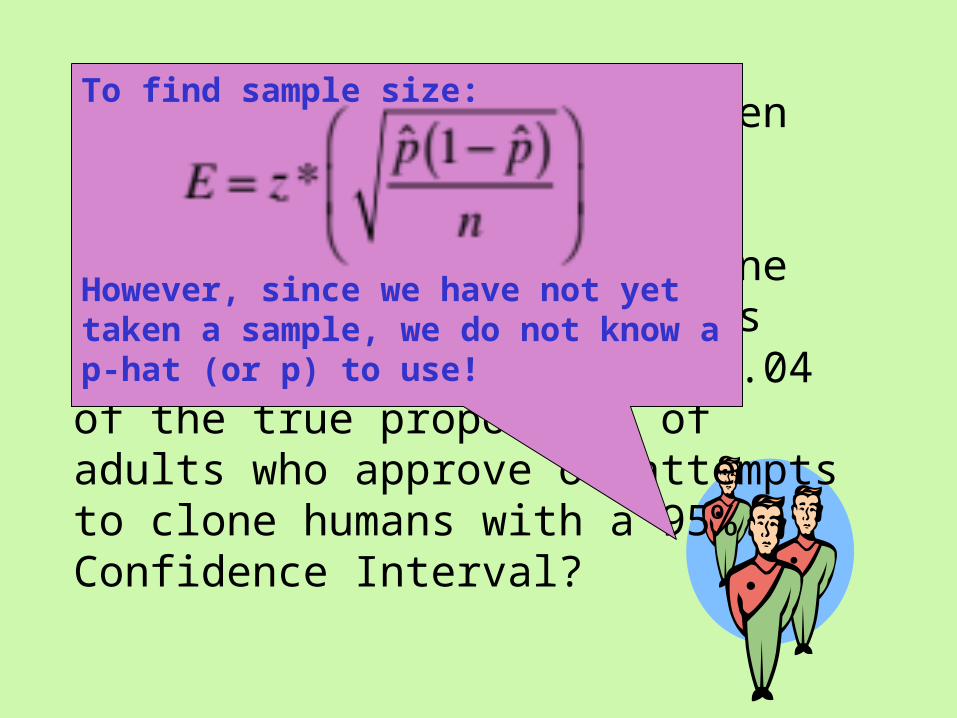
Another Gallop Poll is taken in order to measure the proportion of adults who approve of attempts to clone humans. What sample size is necessary to be within + 0.04 of the true proportion of adults who approve of attempts to clone humans with a 95% Confidence Interval?
To find sample size:
However, since we have not yet taken a sample, we do not know a p-hat (or p) to use!

What p-hat (p) do you use when trying to find the sample size for a given margin of error?
.1(.9) = .09
.2(.8) = .16
.3(.7) = .21
.4(.6) = .24
.5(.5) = .25
By using .5 for p-hat, we are using the worst-case scenario and using the largest SD in our calculations.
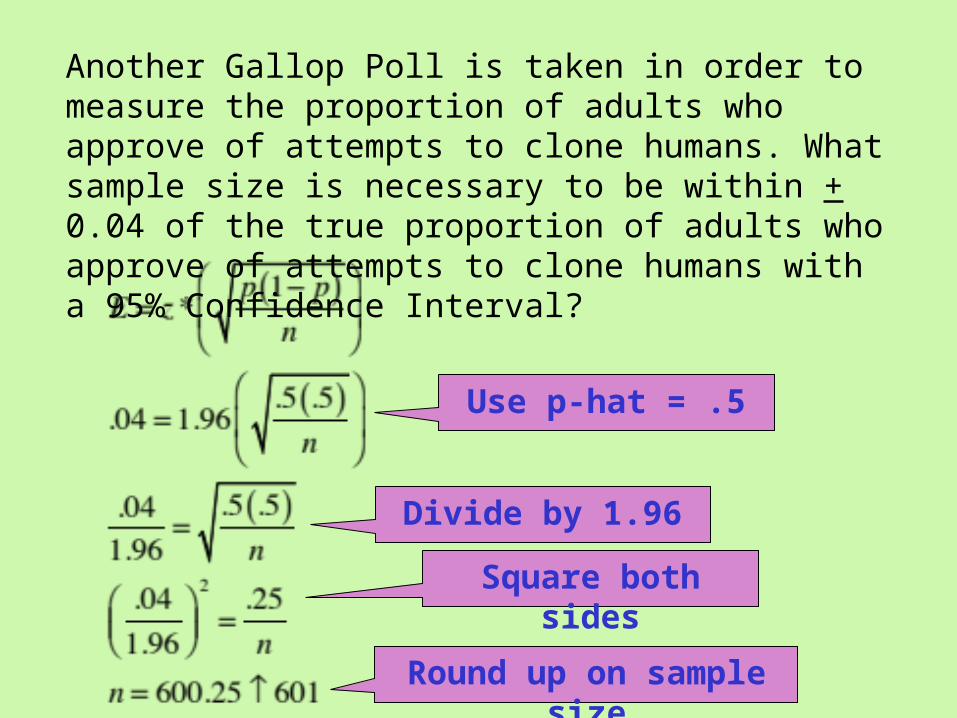
Another Gallop Poll is taken in order to measure the proportion of adults who approve of attempts to clone humans. What sample size is necessary to be within + 0.04 of the true proportion of adults who approve of attempts to clone humans with a 95% Confidence Interval?
Use p-hat = .5
Divide by 1.96
Square both sides
Round up on sample size
Hypothesis TestsHypothesis Tests
One Sample Proportions

Example 1: Julie and Megan wonder if head and tails are equally likely if a penny is spun. They spin pennies 40 times and get 17 heads. Should they reject the standard that pennies land heads 50% of the time?
How can I tell if pennies really land heads 50% of
the time?
What is their sample proportion?But how do I know if this is
one that I expectexpect to happen or is it one that is unlikelyunlikely to
happen?
Hypothesis test will help me decide!
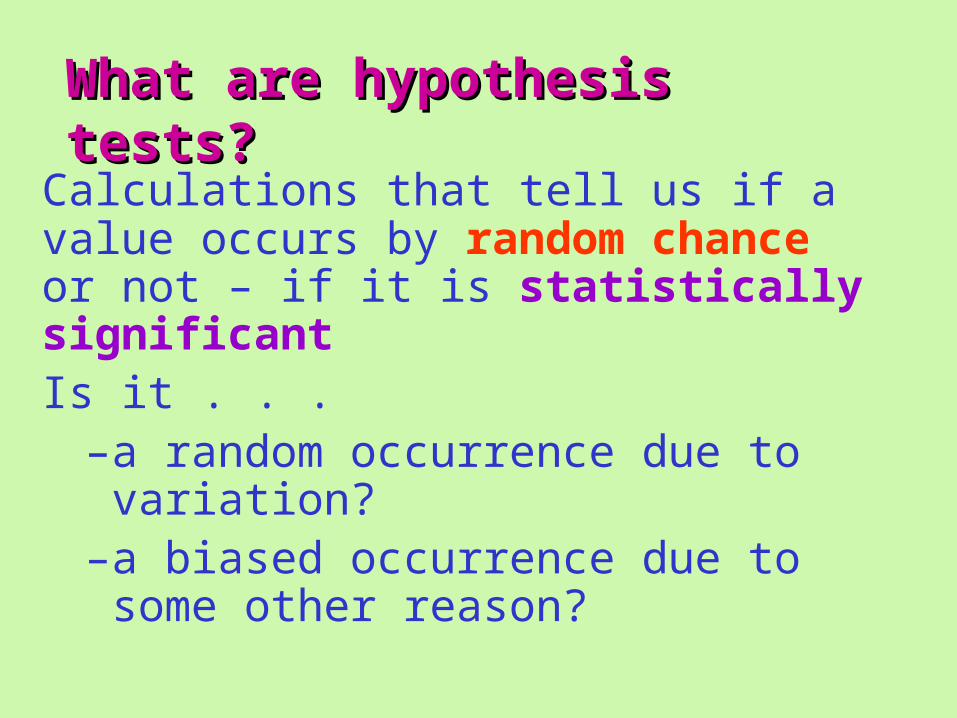
What are hypothesis What are hypothesis tests?tests?
Calculations that tell us if a value occurs by random chance or not – if it is statistically significantIs it . . .
–a random occurrence due to variation?
–a biased occurrence due to some other reason?
Nature of hypothesis tests Nature of hypothesis tests --•First begin by supposing the
“effect” is NOT present•Next, see if data provides
evidence against the supposition
Example: murder trial
How does a murder trial work?
First - assume that the person is innocentThen – mustmust have
sufficient evidence to prove guilty
Steps:Steps:
1) Assumptions2) Hypothesis statements &
define parameters3) Calculations4) Conclusion, in context
Notice the steps are the same except we add
hypothesis statements – which you will learn
today
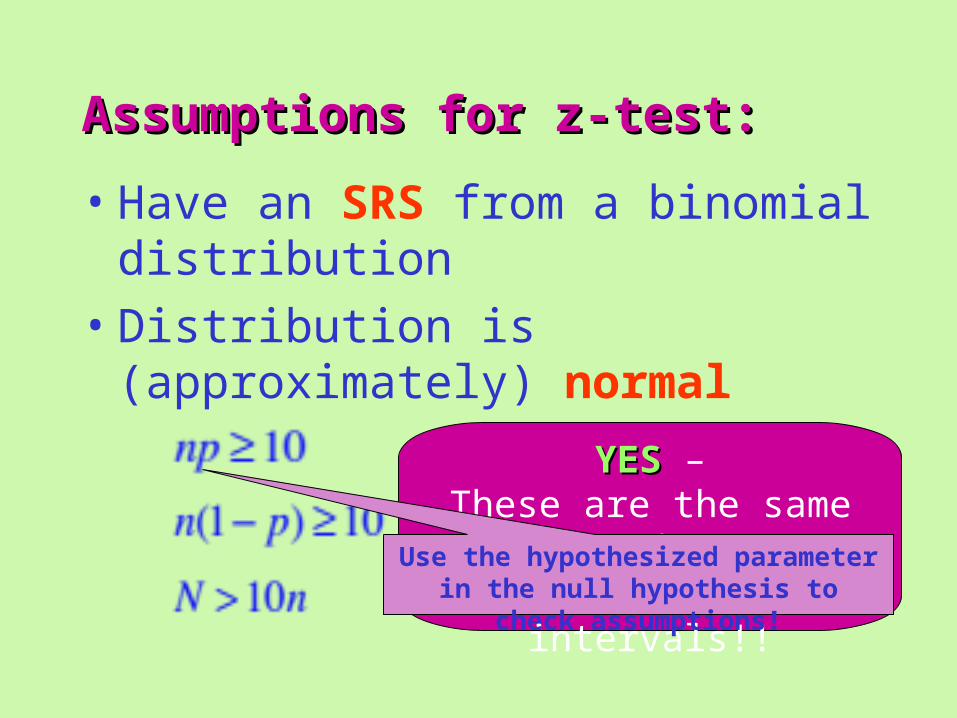
Assumptions for z-test:Assumptions for z-test:
• Have an SRS from a binomial distribution
• Distribution is (approximately) normal
YES YES –These are the same
assumptions as confidence intervals!!
Use the hypothesized parameter in the null hypothesis to check assumptions!
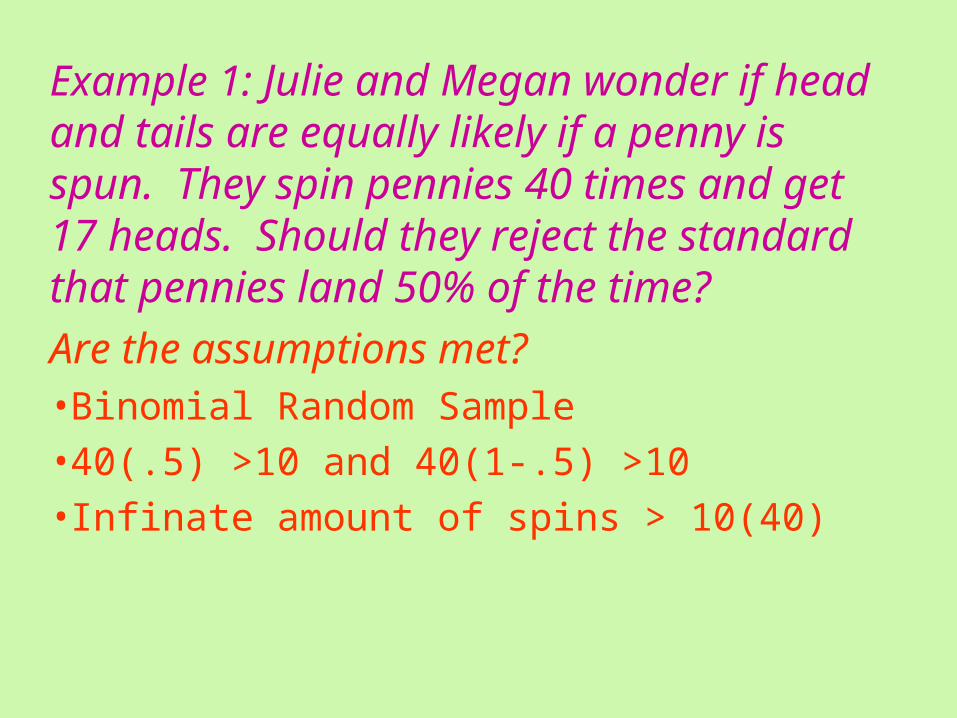
Example 1: Julie and Megan wonder if head and tails are equally likely if a penny is spun. They spin pennies 40 times and get 17 heads. Should they reject the standard that pennies land 50% of the time? Are the assumptions met?•Binomial Random Sample •40(.5) >10 and 40(1-.5) >10•Infinate amount of spins > 10(40)
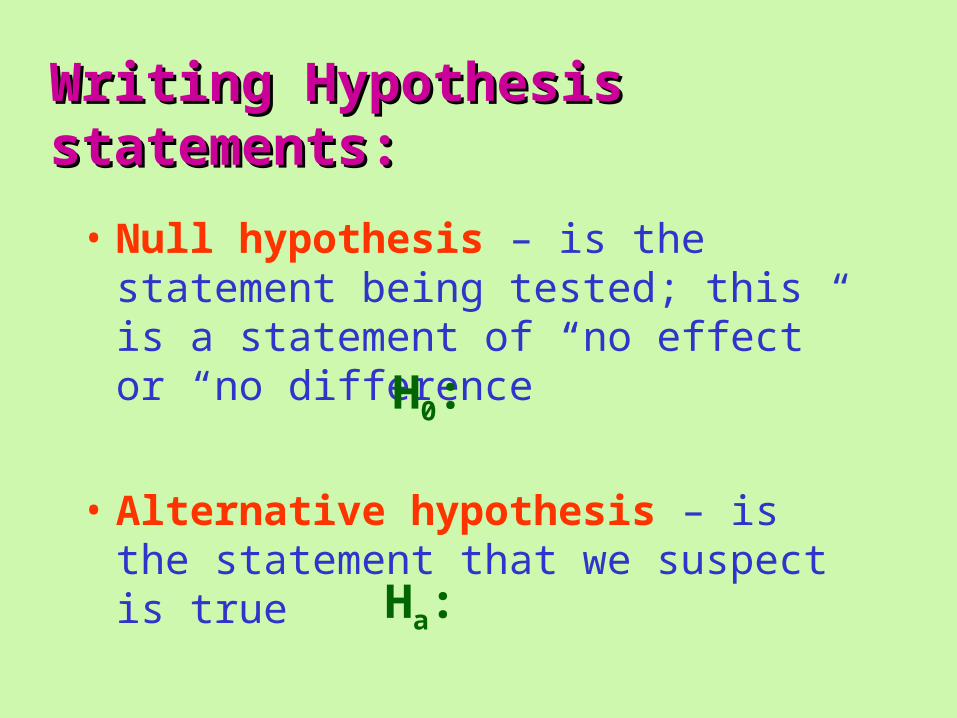
Writing Hypothesis Writing Hypothesis statements:statements:
• Null hypothesis – is the statement being tested; this is a statement of “no effect” or “no difference”
• Alternative hypothesis – is the statement that we suspect is true
H0:
Ha:

The form:The form:Null hypothesisH0: parameter = hypothesized value
Alternative hypothesisHa: parameter = hypothesized value
Ha: parameter > hypothesized value
Ha: parameter < hypothesized value

Example 1 Contd.: Julie and Megan wonder if head and tails are equally likely if a penny is spun. They spin pennies 40 times and get 17 heads. Should they reject the standard that pennies land 50% of the time?
State the hypotheses :Where p is the true proportion of heads
H0: = .5
Ha: ≠ .5

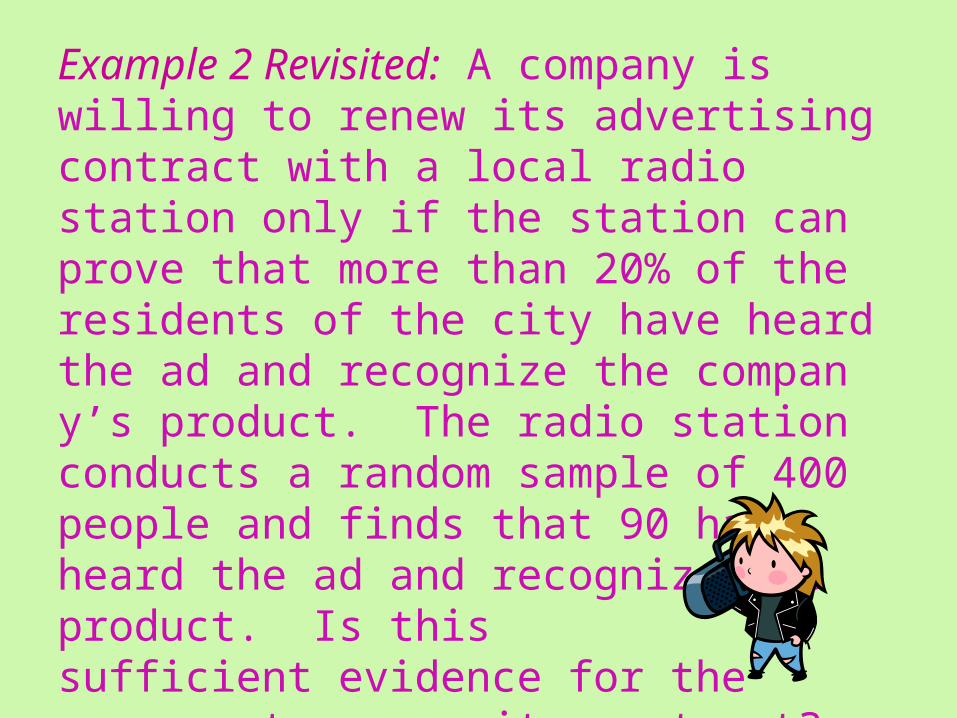
Example 2: A company is willing to renew its advertising contract with a local radio station only if the station can prove that more than 20% of the residents of the city have heard the ad and recognize the company’s product. The radio station conducts a random sample of 400 people and finds that 90 have heard the ad and recognize the product. Is this sufficient evidence for the company to renew its
contract? State the hypotheses :Where is the true proportion that heard the ad.
H0: = .2
Ha: > .2

Formula for hypothesis test:
statistic of SD
parameter - statisticstatisticTest
z n
pp
pp
1
ˆ
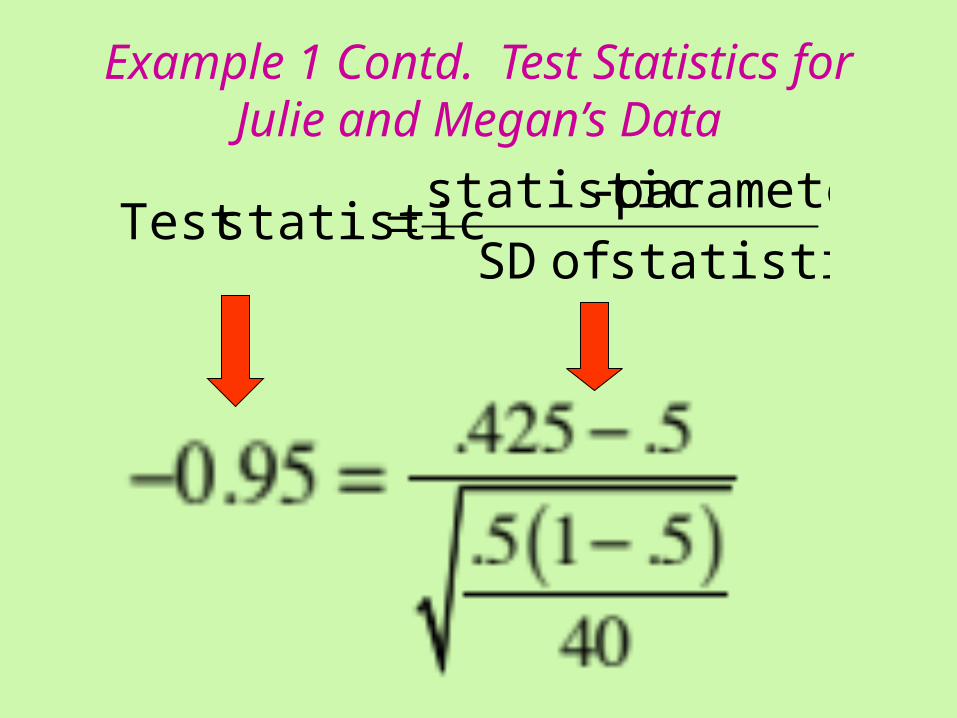
Example 1 Contd. Test Statistics for Julie and Megan’s Data
statistic of SD
parameter - statisticstatisticTest
P-values -P-values -
•The probability that the test statistic would have a value as extreme or more than what is actually observed

Level of significance -Level of significance - • Is the amount of evidence
necessary before we begin to doubt that the null hypothesis is true
• Is the probability that we will reject the null hypothesis, assuming that it is true
• Denoted by α– Can be any value– Usual values: 0.1, 0.05, 0.01– Most common is 0.05
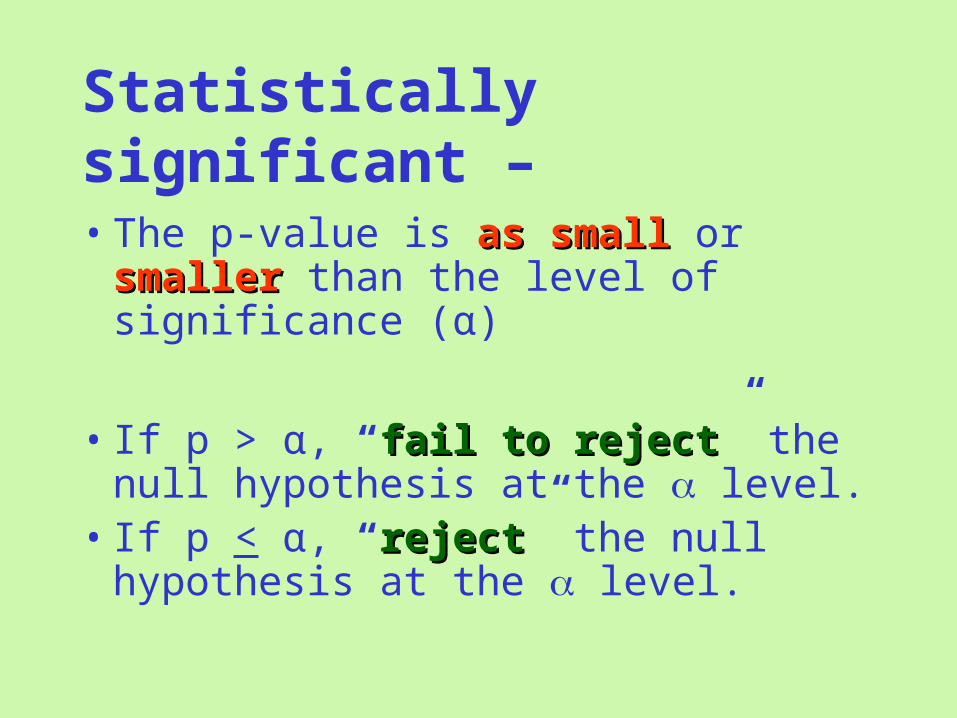
Statistically significant –• The p-value is as smallas small or
smaller smaller than the level of significance (α)
• If p > α, “fail to rejectfail to reject” the null hypothesis at the level.
• If p < α, “rejectreject” the null hypothesis at the level.
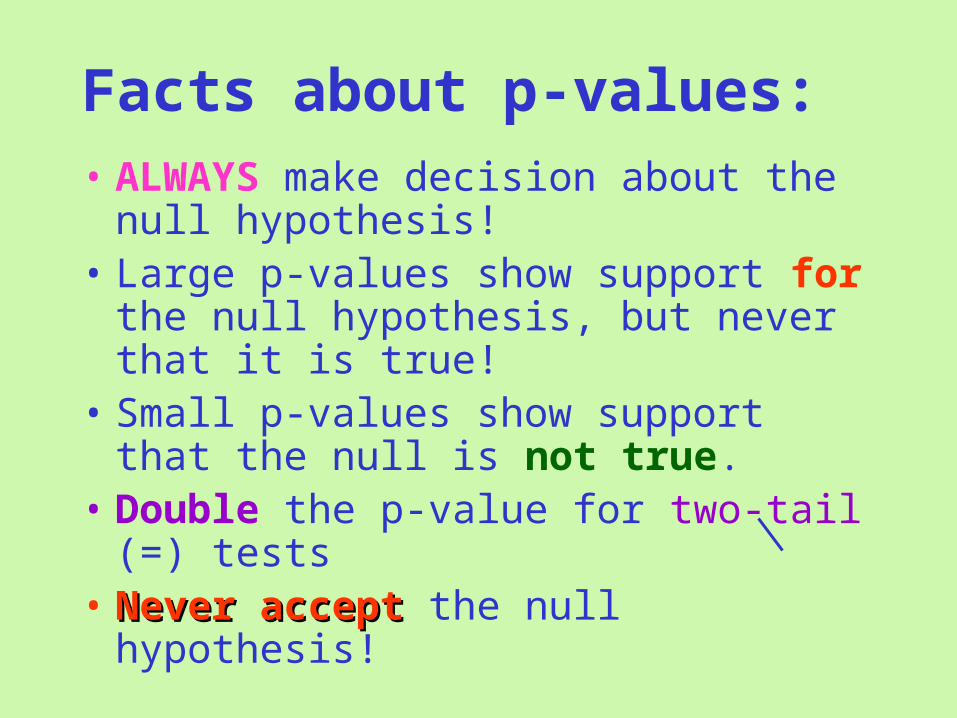
Facts about p-values:• ALWAYS make decision about the
null hypothesis!• Large p-values show support for
the null hypothesis, but never that it is true!
• Small p-values show support that the null is not true.
• Double the p-value for two-tail (=) tests
• Never acceptNever accept the null hypothesis!

Never “accept” the null hypothesis!
Never “accept” the null hypothesis!
Never “accept” the null hypothesis!

At an αlevel of .05, would you reject or fail to reject H0
for the given p-values?
a) .03b) .15c) .45d) .023
Reject
Reject
Fail to reject
Fail to reject
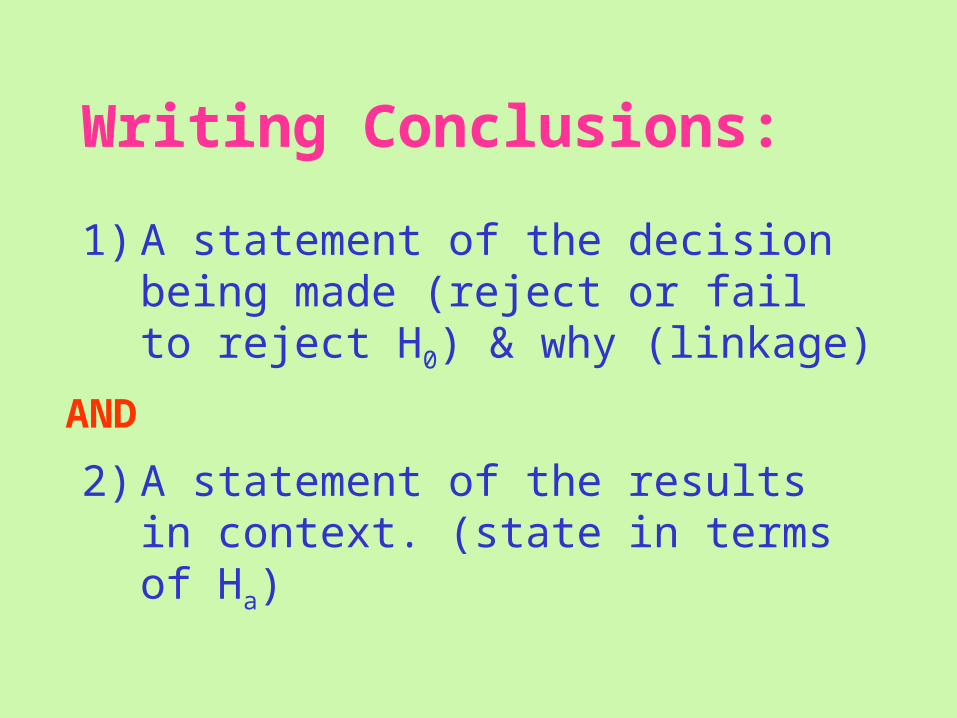
Writing Conclusions:
1) A statement of the decision being made (reject or fail to reject H0) & why (linkage)
2) A statement of the results in context. (state in terms of Ha)
AND
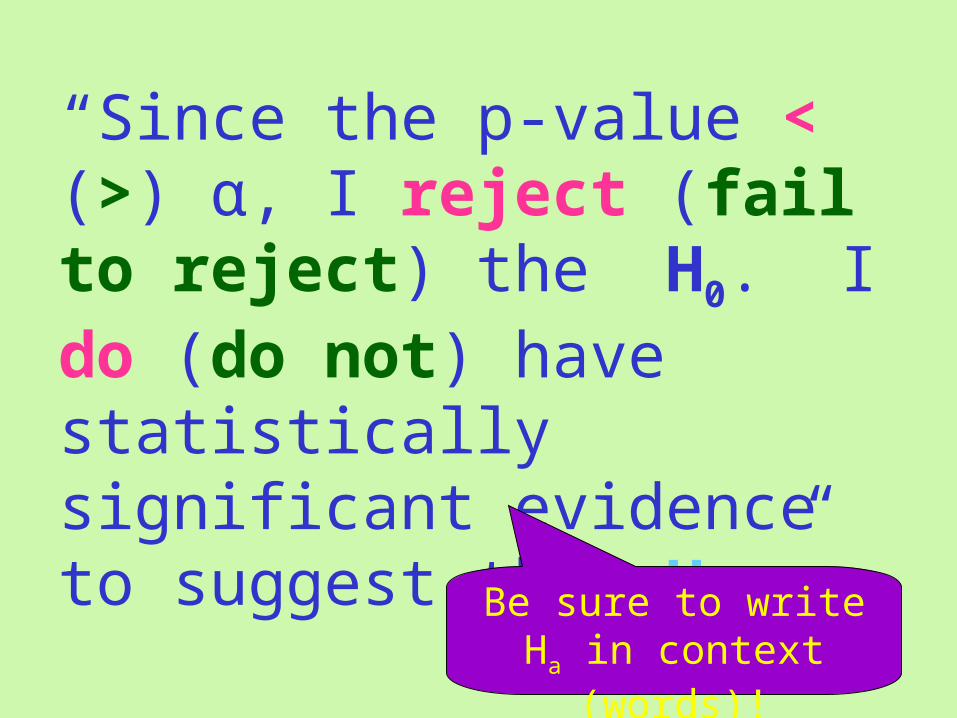
“Since the p-value < (>) α, I reject (fail to reject) the H0. I do (do not) have statistically significant evidence to suggest that Ha.”
Be sure to write Ha in context (words)!
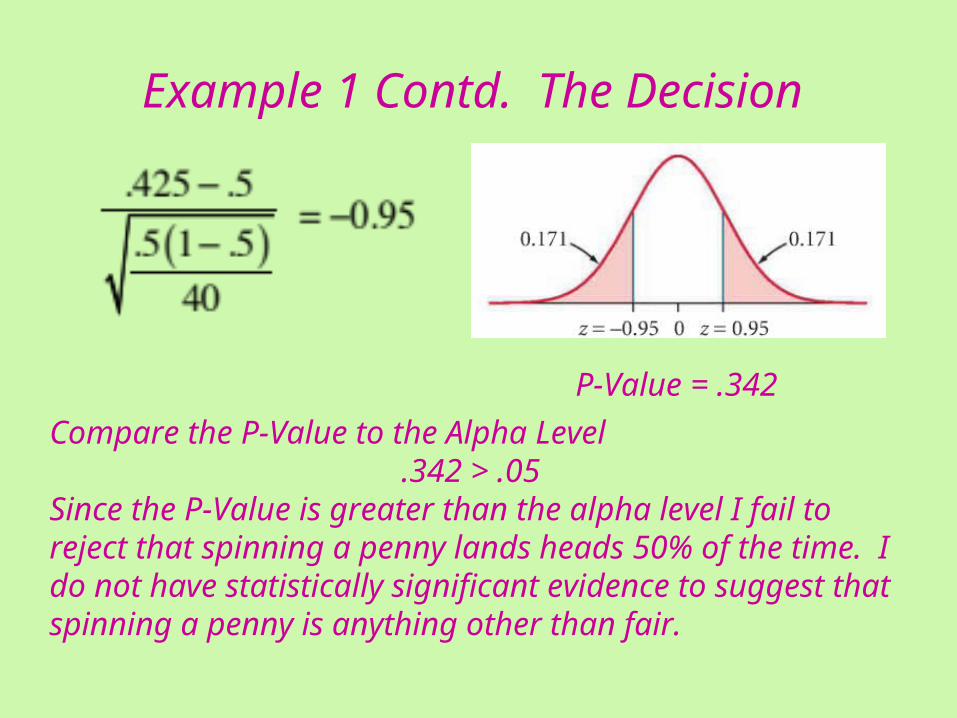
Example 1 Contd. The Decision
P-Value = .342
Compare the P-Value to the Alpha Level .342 > .05
Since the P-Value is greater than the alpha level I fail to reject that spinning a penny lands heads 50% of the time. I do not have statistically significant evidence to suggest that spinning a penny is anything other than fair.

What? You and Jeff Spun your pennies and got 10 heads out of 40 spins? Well that not
what Meg and I got. So what now?
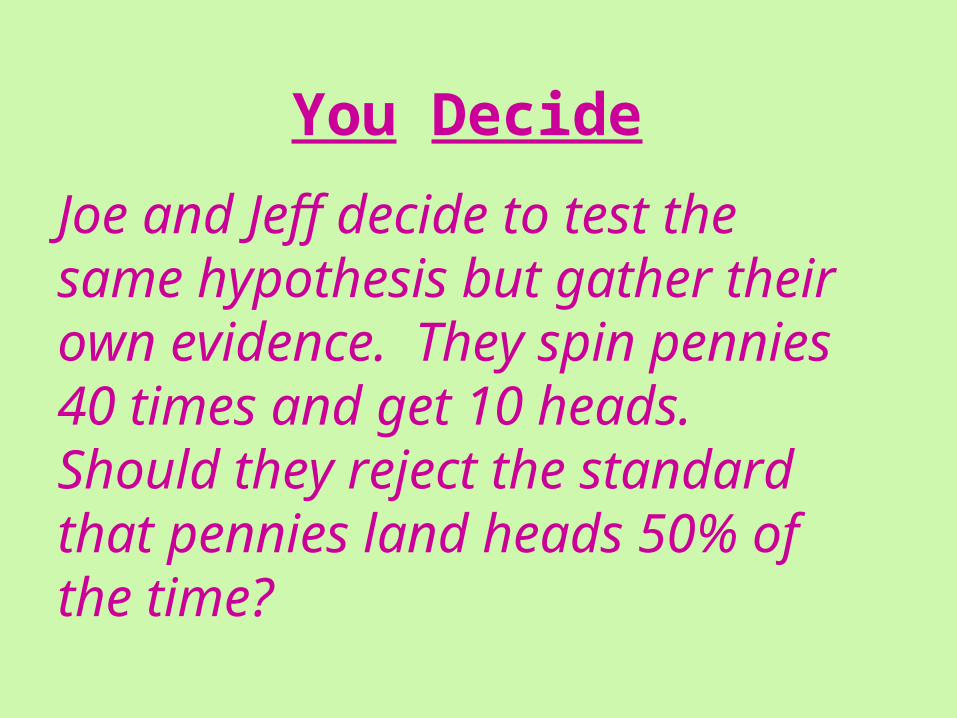
You Decide
Joe and Jeff decide to test the same hypothesis but gather their own evidence. They spin pennies 40 times and get 10 heads. Should they reject the standard that pennies land heads 50% of the time?
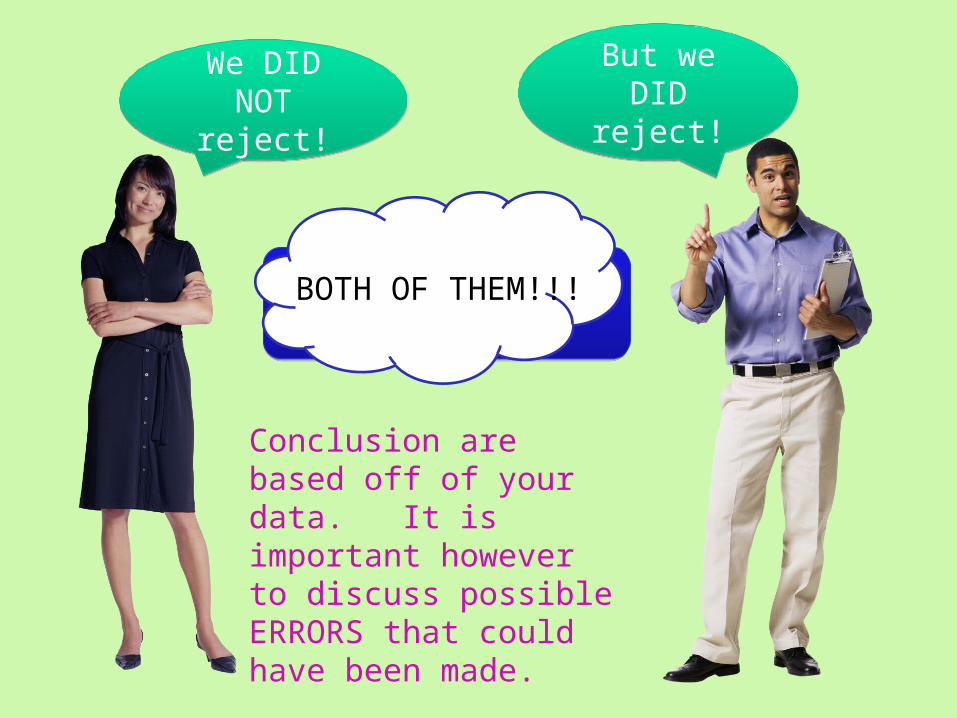
But we DID reject!
But we DID reject!
We DID NOT reject!
We DID NOT reject!
Who is Correct?Who is Correct?BOTH OF THEM!!!
Conclusion are based off of your data. It is important however to discuss possible ERRORS that could have been made.

Errors in Hypothesis Tests
Every time you make a decision there is a possibility that an error occurred.

Ho is True Ho is False
Reject Type I Error Correct
Fail to Reject Correct Type II
Error
ERRORS
Murder Trial Revisited
Actually Innocent
Actually Guilty
Decision Guilty Type I Error Correct
Decision Not Guilty Correct Type II
Error
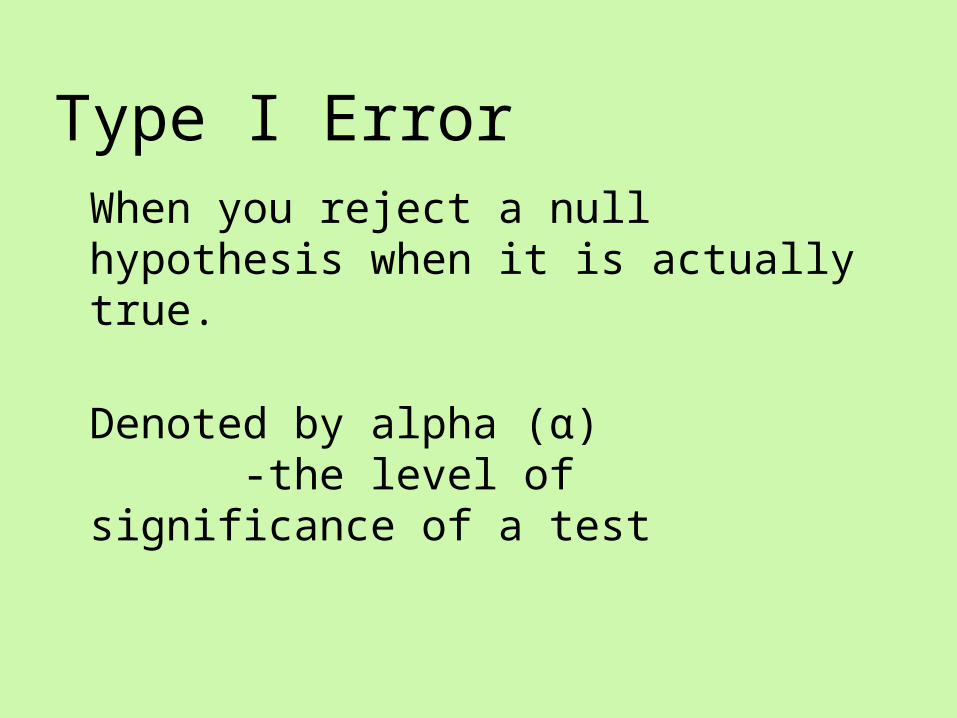
Type I ErrorWhen you reject a null hypothesis when it is actually true.
Denoted by alpha (α) -the level of significance of a test
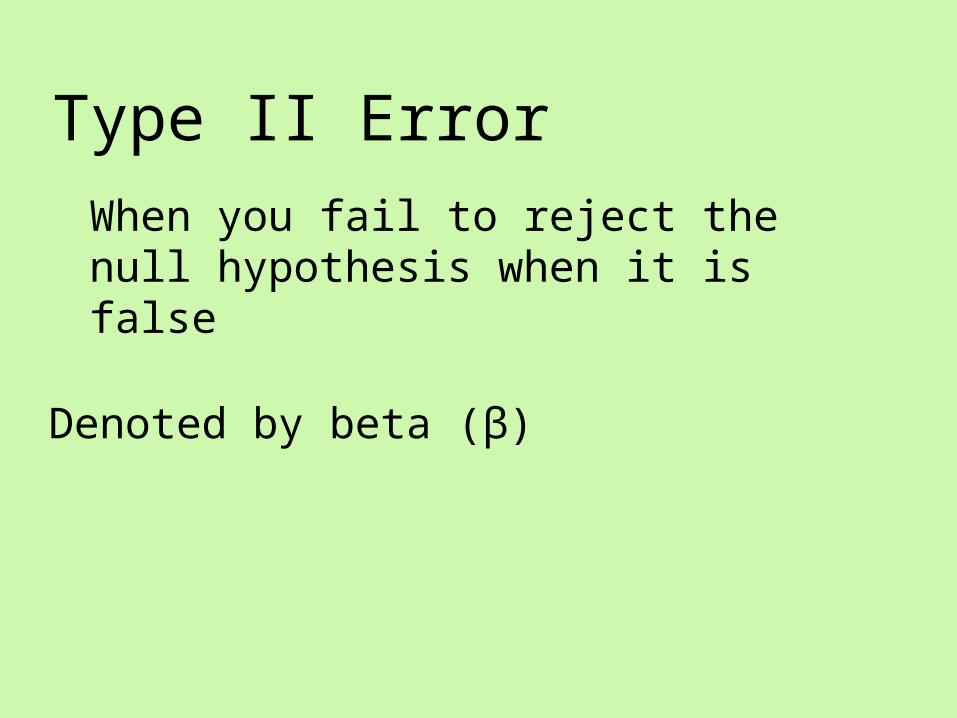
Type II ErrorWhen you fail to reject the null hypothesis when it is false
Denoted by beta (β)
Example 2 Revisited: A company is willing to renew its advertising contract with a local radio station only if the station can prove that more than 20% of the residents of the city have heard the ad and recognize the company’s product. The radio station conducts a random sample of 400 people and finds that 90 have heard the ad and recognize the product. Is this sufficient evidence for the company to renew its contract?
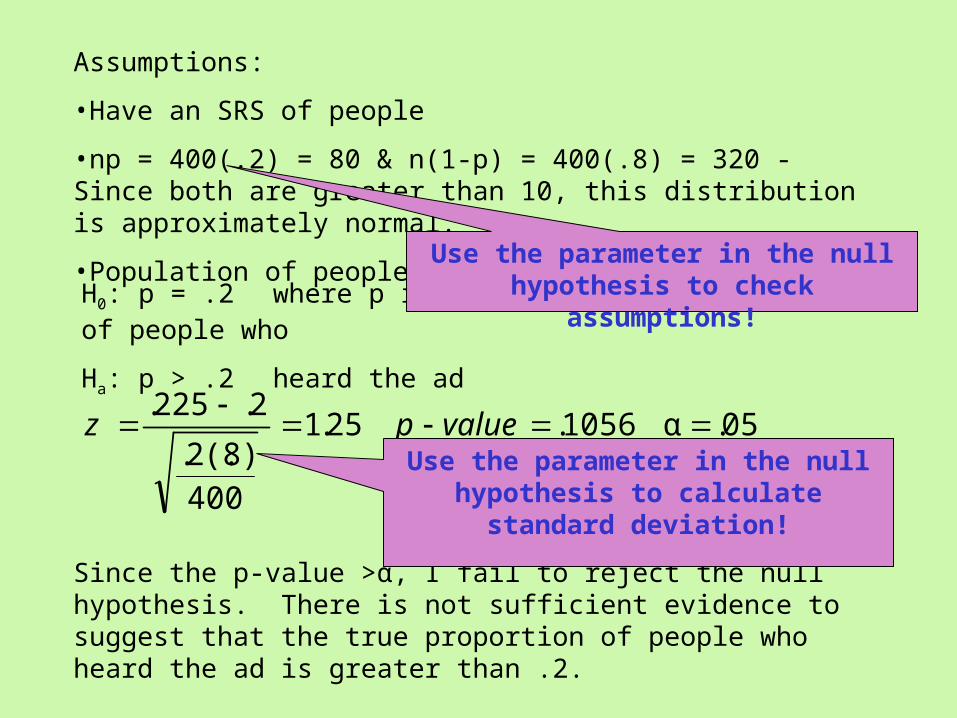
Assumptions:
•Have an SRS of people
•np = 400(.2) = 80 & n(1-p) = 400(.8) = 320 - Since both are greater than 10, this distribution is approximately normal.
•Population of people is at least 4000.
H0: p = .2 where p is the true proportion of people who
Ha: p > .2 heard the ad
05.α1056.25.1
400)8(.2.
2.225.
valuepz
Since the p-value >α, I fail to reject the null hypothesis. There is not sufficient evidence to suggest that the true proportion of people who heard the ad is greater than .2.
Use the parameter in the null hypothesis to check assumptions!
Use the parameter in the null hypothesis to calculate standard deviation!

What type of error could the radio station have made?
Type I Type IIOR
Two-Sample Two-Sample Proportions InferenceProportions Inference
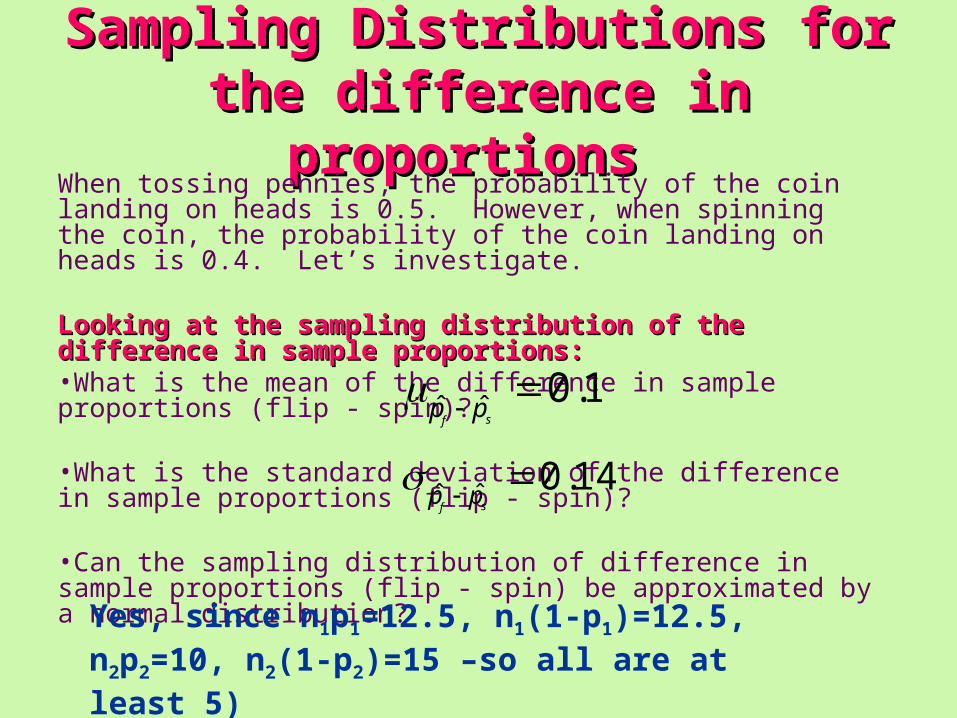
Sampling Distributions for Sampling Distributions for the difference in the difference in
proportionsproportions When tossing pennies, the probability of the coin landing on heads is 0.5. However, when spinning the coin, the probability of the coin landing on heads is 0.4. Let’s investigate.
Looking at the sampling distribution of the difference Looking at the sampling distribution of the difference in sample proportions:in sample proportions:•What is the mean of the difference in sample proportions (flip - spin)?
•What is the standard deviation of the difference in sample proportions (flip - spin)?
•Can the sampling distribution of difference in sample proportions (flip - spin) be approximated by a normal distribution?
1.0ˆˆ sfpp
14.0ˆˆ sfpp
Yes, since n1p1=12.5, n1(1-p1)=12.5, n2p2=10, n2(1-p2)=15 –so all are at least 5)
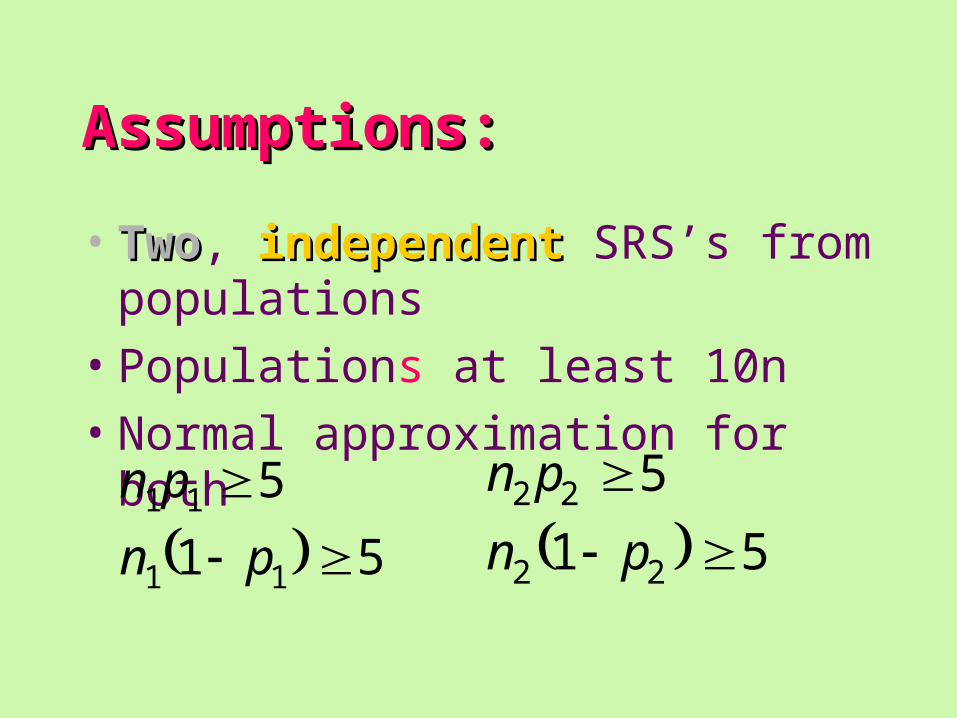
Assumptions:Assumptions:
• TwoTwo, independentindependent SRS’s from populations
• Populations at least 10n
• Normal approximation for both
51
5
11
11
pn
pn 51
5
22
22
pn
pn

Formula for confidence interval:Formula for confidence interval:
statistic of SD valuecritical statisticCI
21 ˆˆ pp *z 2
22
1
11 ˆ1ˆˆ1ˆ
npp
npp
Note: use p-hat when p is not known
Standard error!
Margin of error!
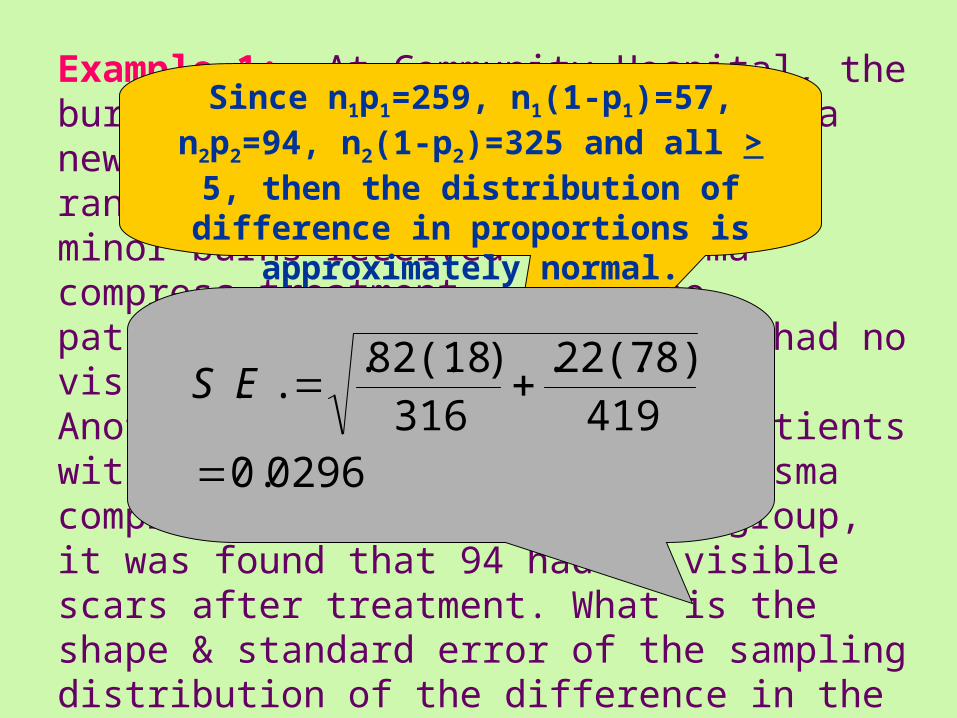
Example 1: At Community Hospital, the burn center is experimenting with a new plasma compress treatment. A random sample of 316 patients with minor burns received the plasma compress treatment. Of these patients, it was found that 259 had no visible scars after treatment. Another random sample of 419 patients with minor burns received no plasma compress treatment. For this group, it was found that 94 had no visible scars after treatment. What is the shape & standard error of the sampling distribution of the difference in the proportions of people with visible scars between the two groups?
Since n1p1=259, n1(1-p1)=57, n2p2=94, n2(1-p2)=325 and all > 5, then the distribution of difference in proportions is approximately
normal.
0296.0419
)78(.22.316
)18(.82...
ES
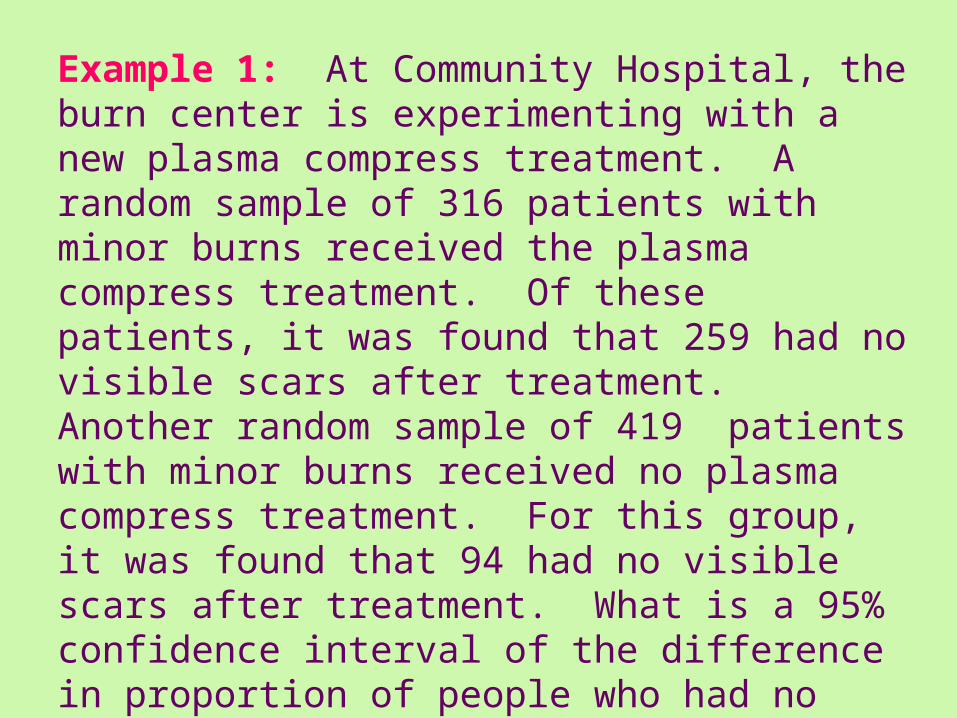
Example 1: At Community Hospital, the burn center is experimenting with a new plasma compress treatment. A random sample of 316 patients with minor burns received the plasma compress treatment. Of these patients, it was found that 259 had no visible scars after treatment. Another random sample of 419 patients with minor burns received no plasma compress treatment. For this group, it was found that 94 had no visible scars after treatment. What is a 95% confidence interval of the difference in proportion of people who had no visible scars between the plasma compress treatment & control group?
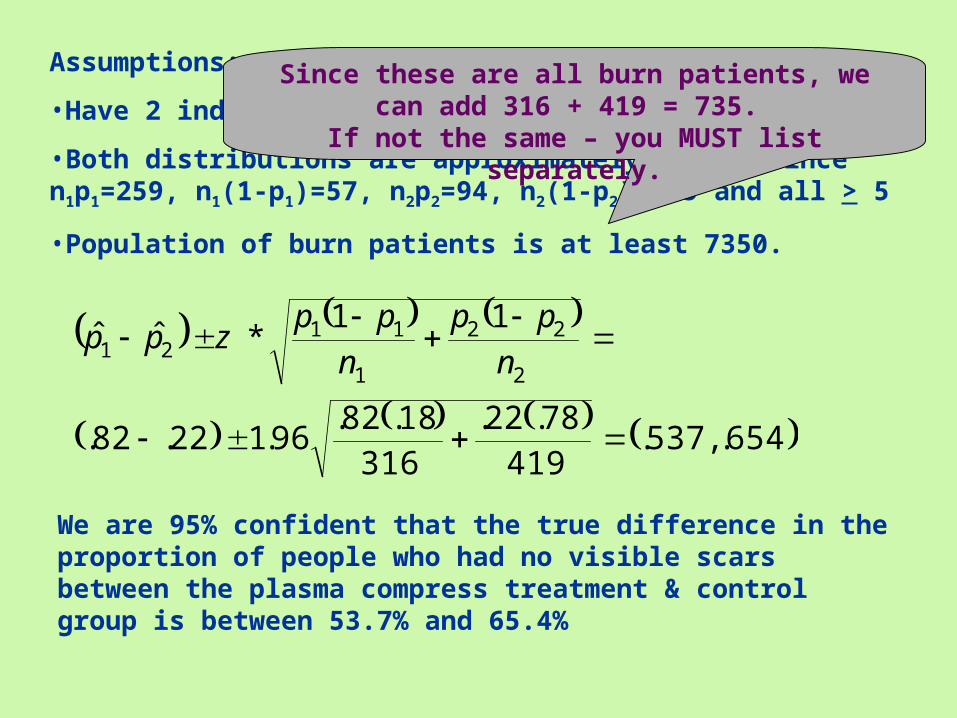
Assumptions:
•Have 2 independent SRS of burn patients
•Both distributions are approximately normal since n1p1=259, n1(1-p1)=57, n2p2=94, n2(1-p2)=325 and all > 5
•Population of burn patients is at least 7350.
Since these are all burn patients, we can add 316 + 419 = 735.
If not the same – you MUST list separately.
654.,537.419
78.22.316
18.82.96.122.82.
11*ˆˆ
2
22
1
1121
n
ppn
ppzpp
We are 95% confident that the true difference in the proportion of people who had no visible scars between the plasma compress treatment & control group is between 53.7% and 65.4%

Example 2: Suppose that researchers want to estimate the difference in proportions of people who are against the death penalty in Texas & in California. If the two sample sizes are the same, what size sample is needed to be within 2% of the true difference at 90% confidence?
nn)5(.5.)5(.5.
645.102. n25.25.
645.102.
Since both n’s are the same size, you have common denominators – so
add!
n = 3383

Example 3: Researchers comparing the effectiveness of two pain medications randomly selected a group of patients who had been complaining of a certain kind of joint pain. They randomly divided these people into two groups, and then administered the painkillers. Of the 112 people in the group who received medication A, 84 said this pain reliever was effective. Of the 108 people in the other group, 66 reported that pain reliever B was effective. (BVD, p. 435)a) Construct separate 95% confidence intervals for the proportion of people who reported that the pain reliever was effective. Based on these intervals how do the proportions of people who reported pain relieve with medication A or medication B compare?b) Construct a 95% confidence interval for the difference in the proportions of people who may find these medications effective.
CIA = (.67, .83)CIB =(.52, .70)
Since the intervals overlap, it appears that there is no difference in the proportion of
people who reported pain relieve between the two medicines.
CI = (0.017, 0.261)Since zero is not in the interval, there is a difference in the proportion of people who
reported pain relieve between the two medicines.
SO – which is correct?
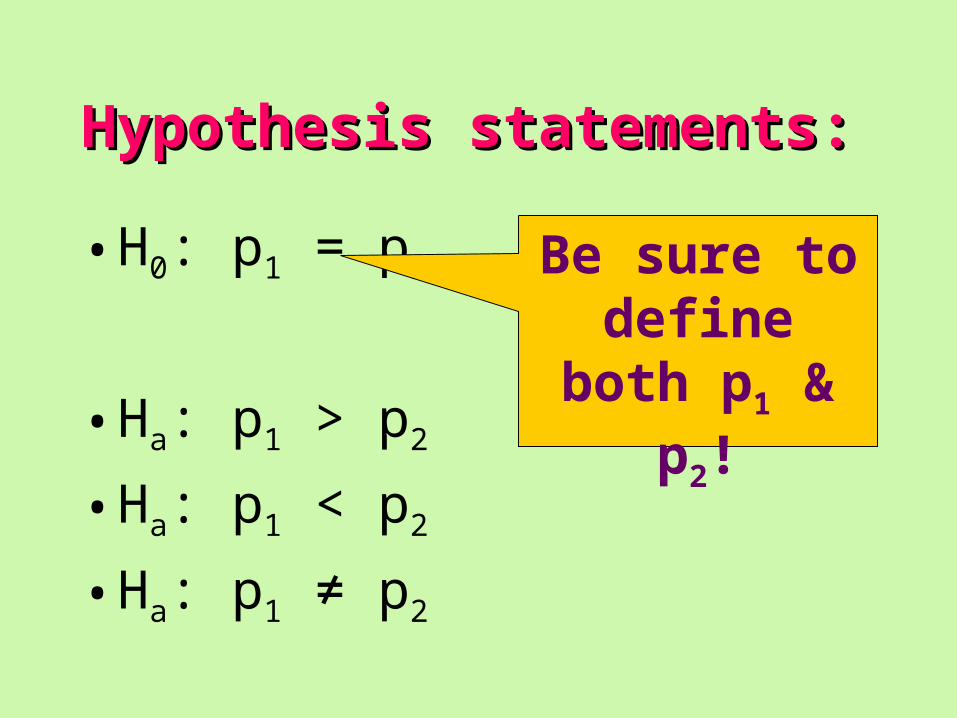
Hypothesis statements:Hypothesis statements:
• H0: p1 = p2
• Ha: p1 > p2
• Ha: p1 < p2
• Ha: p1 ≠ p2
Be sure to define both p1
& p2!
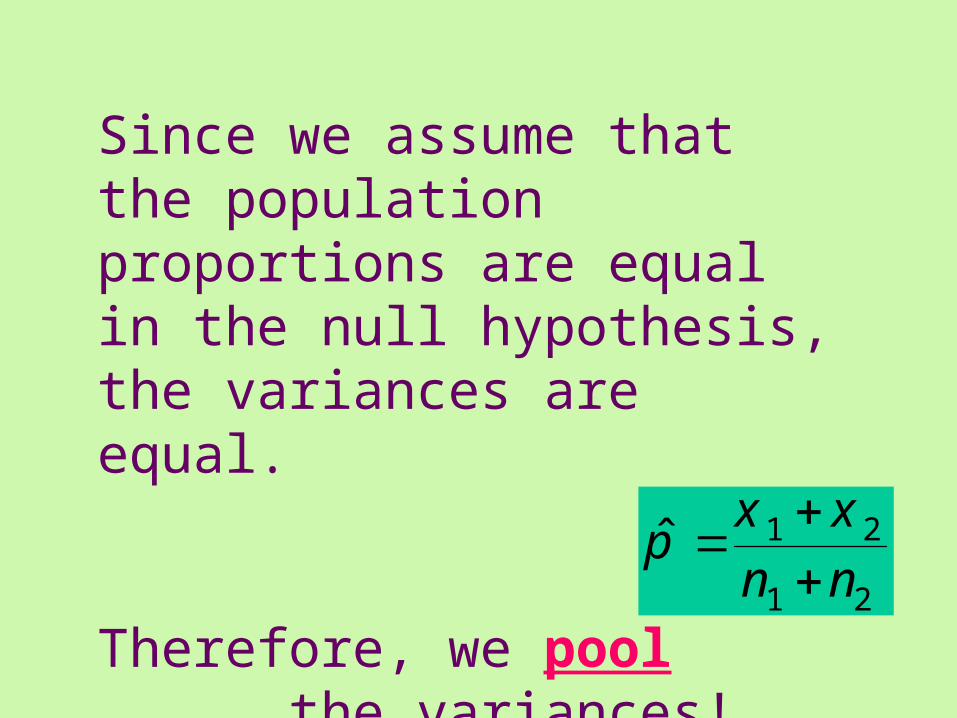
Since we assume that the population proportions are equal in the null hypothesis, the variances are equal.
Therefore, we pool the variances! 21
21ˆnnxx
p
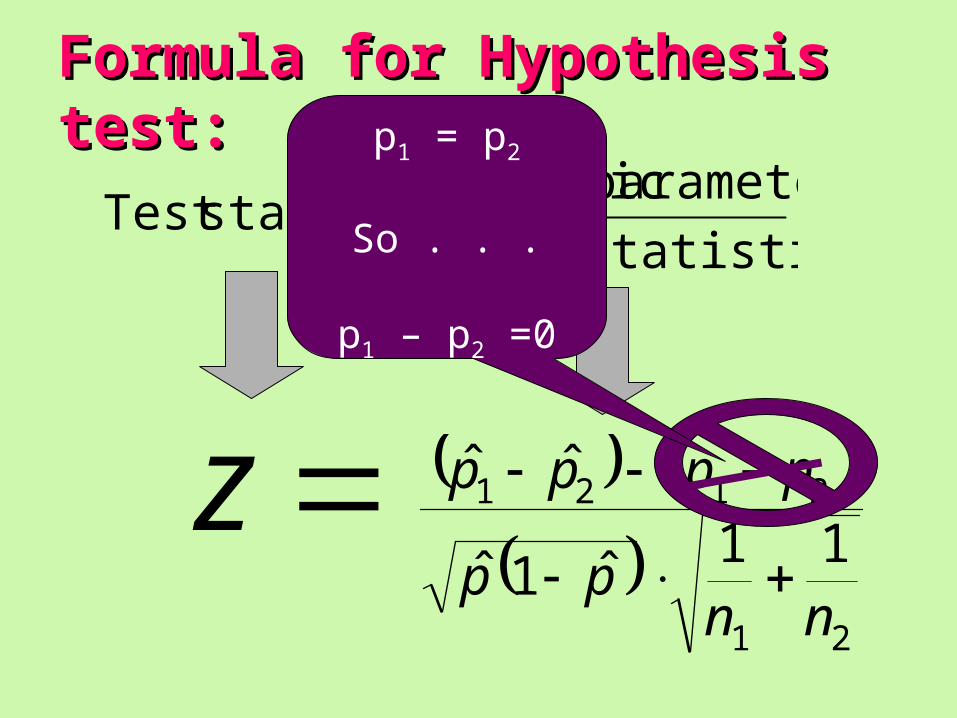
Formula for Hypothesis test:Formula for Hypothesis test:
statistic of SD
parameter - statisticstatisticTest
z
21
2121
11ˆ1ˆ
ˆˆ
nnpp
pppp
p1 = p2
So . . .
p1 – p2 =0

Example 4: A forest in Oregon has an infestation of spruce moths. In an effort to control the moth, one area has been regularly sprayed from airplanes. In this area, a random sample of 495 spruce trees showed that 81 had been killed by moths. A second nearby area receives no treatment. In this area, a random sample of 518 spruce trees showed that 92 had been killed by the moth. Do these data indicate that the proportion of spruce trees killed by the moth is different for these areas?
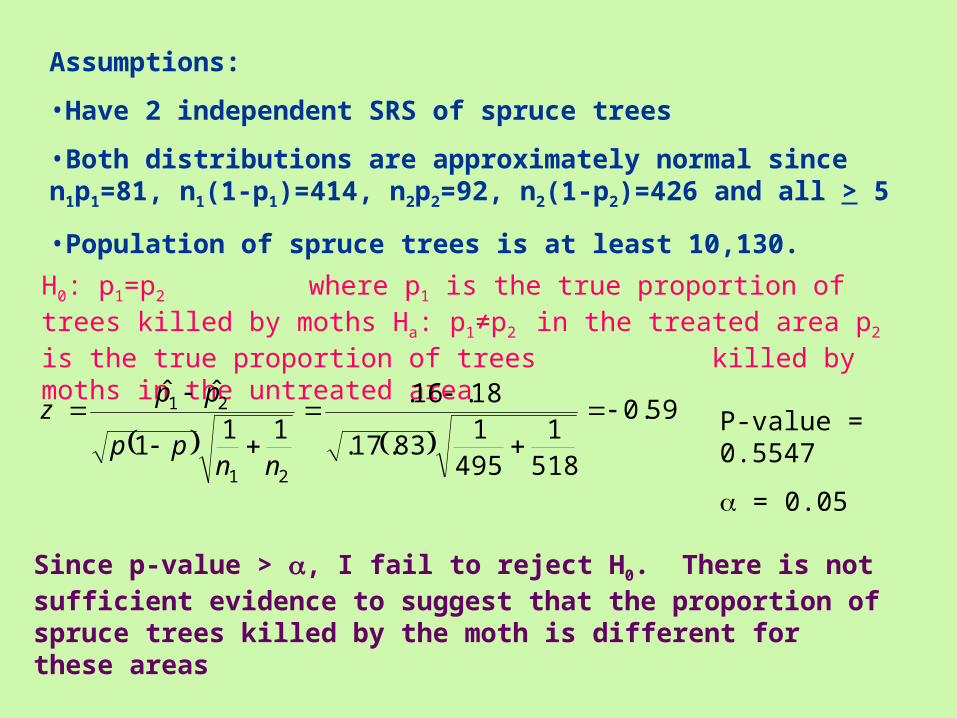
Assumptions:
•Have 2 independent SRS of spruce trees
•Both distributions are approximately normal since n1p1=81, n1(1-p1)=414, n2p2=92, n2(1-p2)=426 and all > 5
•Population of spruce trees is at least 10,130.
H0: p1=p2 where p1 is the true proportion of trees killed by moths Ha: p1≠p2 in the treated area p2 is the true proportion of trees killed by moths in the untreated area
59.0
5181
4951
83.17.
18.16.11
1
ˆˆ
21
21
nnpp
ppz P-value = 0.5547
= 0.05
Since p-value > , I fail to reject H0. There is not sufficient evidence to suggest that the proportion of spruce trees killed by the moth is different for these areas