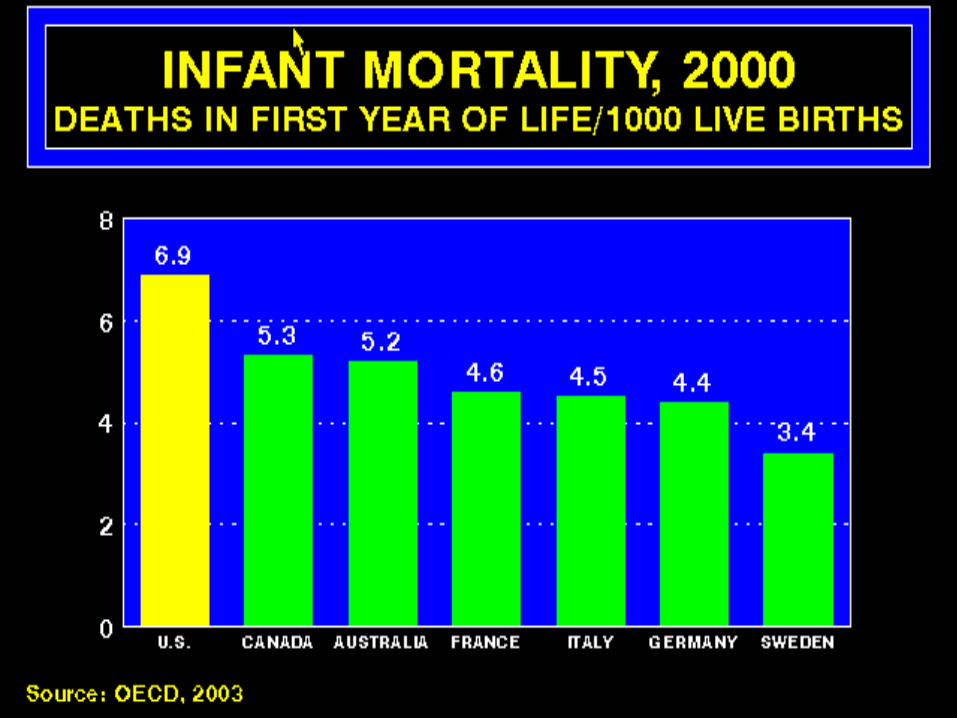
Infant Mortality, 1997 Deaths In First Year Of Life/1000 Live Births Source: OECD, 1999 & NCHS »6.0...
52
Infant Mortality, 1997 Deaths In First Year Of Life/1000 Live Births Source: OECD, 1999 & NCHS »6.0 »5.8 »5.3 »4.8 »4.8 »4.0 »7.2 »0 »1 »2 »3 »4 »5 »6 »7 »8 » U.S. » CANADA » ITALY » AUSTRALIA » GERMANY » FRANCE » SWEDEN
-
date post
21-Dec-2015 -
Category
Documents
-
view
214 -
download
0
Transcript of Infant Mortality, 1997 Deaths In First Year Of Life/1000 Live Births Source: OECD, 1999 & NCHS »6.0...

Infant Mortality, 1997Deaths In First Year Of Life/1000 Live
Births
Source: OECD, 1999 & NCHS
»6.0 »5.8»5.3
»4.8 »4.8»4.0
»7.2
»0
»1
»2
»3
»4
»5
»6
»7
»8
»U.S.
»CANADA
»ITALY
»AUSTRALIA
»GERMANY
»FRANCE
»SWEDEN

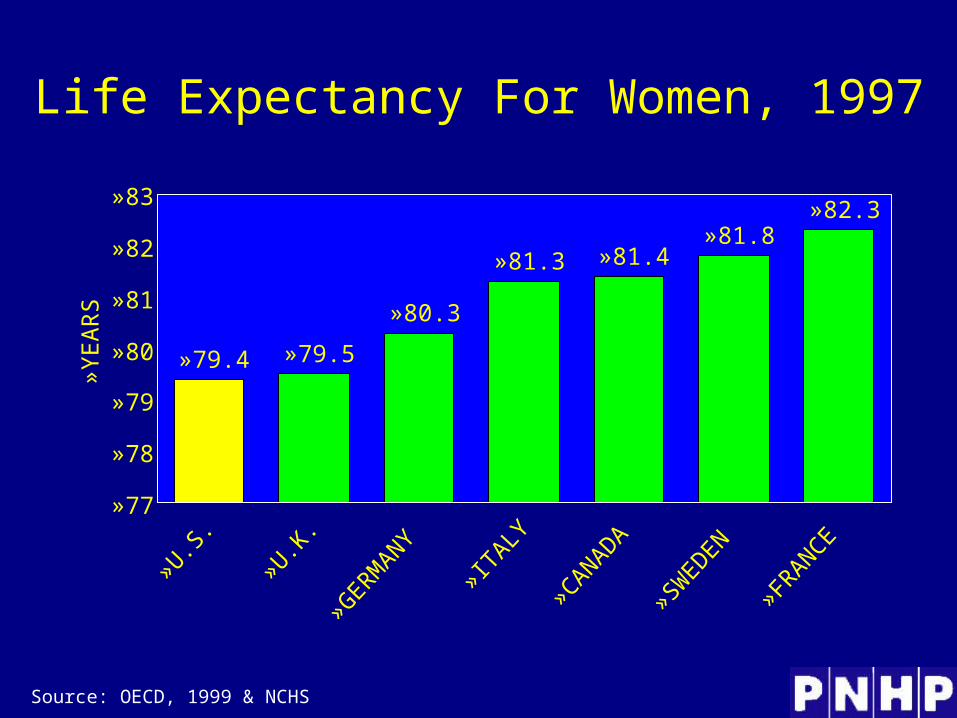
Life Expectancy For Women, 1997
Source: OECD, 1999 & NCHS
»81.8
»80.3
»82.3
»79.5
»81.3 »81.4
»79.4
»77
»78
»79
»80
»81
»82
»83
»U.S.
»U.K.
»GERM
ANY
»ITALY
»CANADA»SW
EDEN
»FRANCE
» YE
AR
S
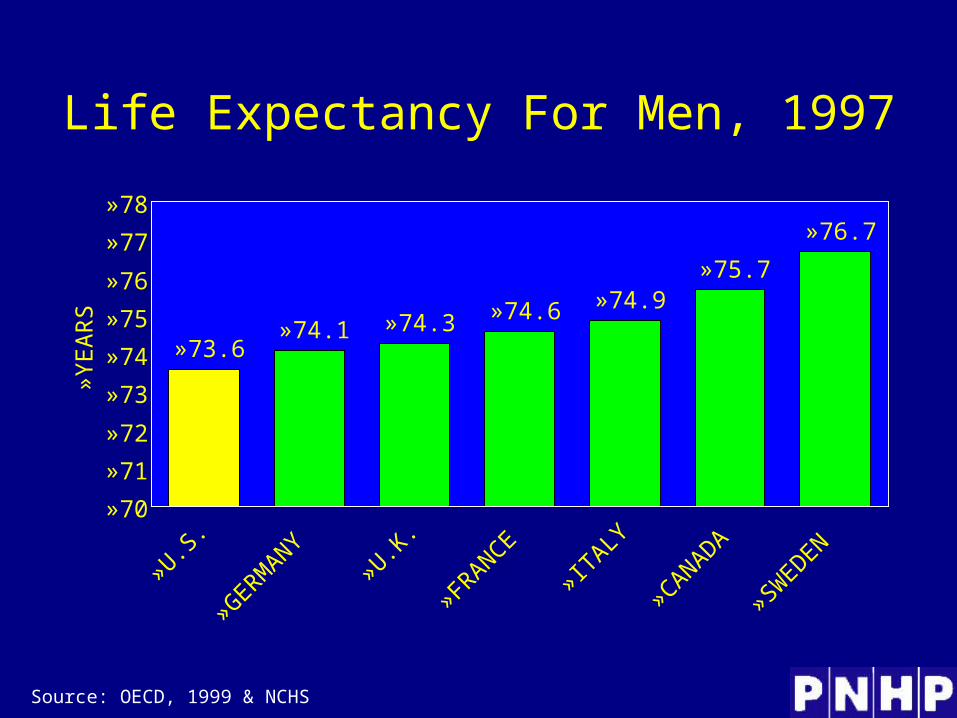
Life Expectancy For Men, 1997
Source: OECD, 1999 & NCHS
»74.1 »74.3 »74.6 »74.9»75.7
»76.7
»73.6
»70
»71
»72
»73
»74
»75
»76
»77
»78
»U.S.
»GERMANY
»U.K.
»FRANCE
»ITALY
»CANADA
»SWEDEN
» YE
AR
S

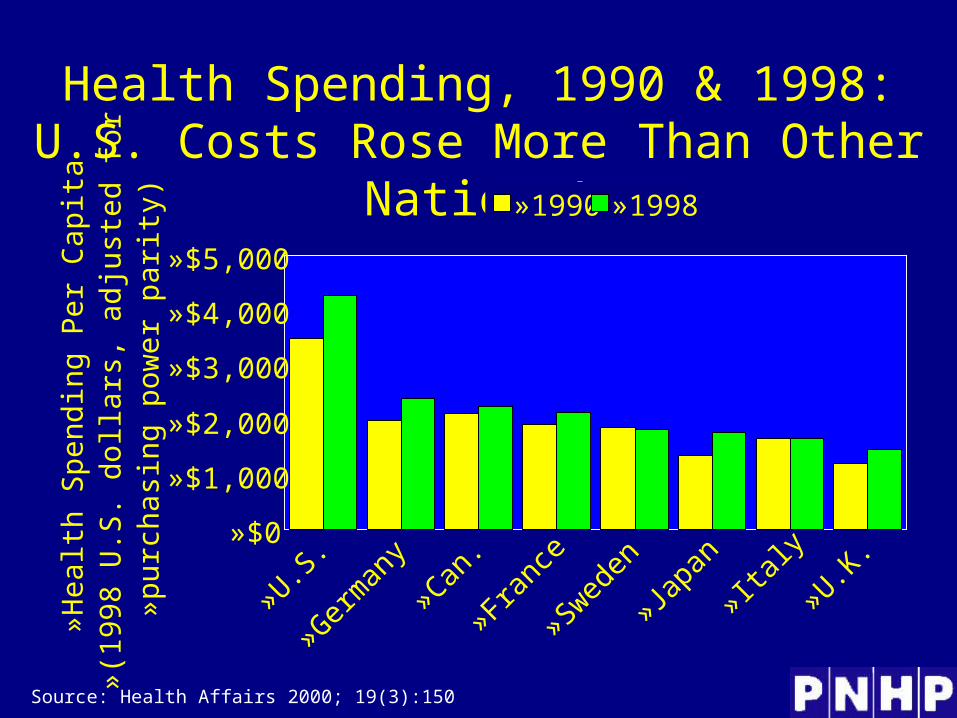
Health Spending, 1990 & 1998:U.S. Costs Rose More Than Other Nations’
Source: Health Affairs 2000; 19(3):150
»$0
»$1,000
»$2,000
»$3,000
»$4,000
»$5,000
»U.S.
»Germ
any
»Can.
»Franc
e
»Sweden
»Japa
n»Ita
ly
»U.K.
» Hea
lth S
pend
ing
Per
Cap
ita» (
1998
U.S
. dol
lars
, adj
uste
d fo
r » p
urch
asin
g po
wer
par
ity)
»1990 »1998
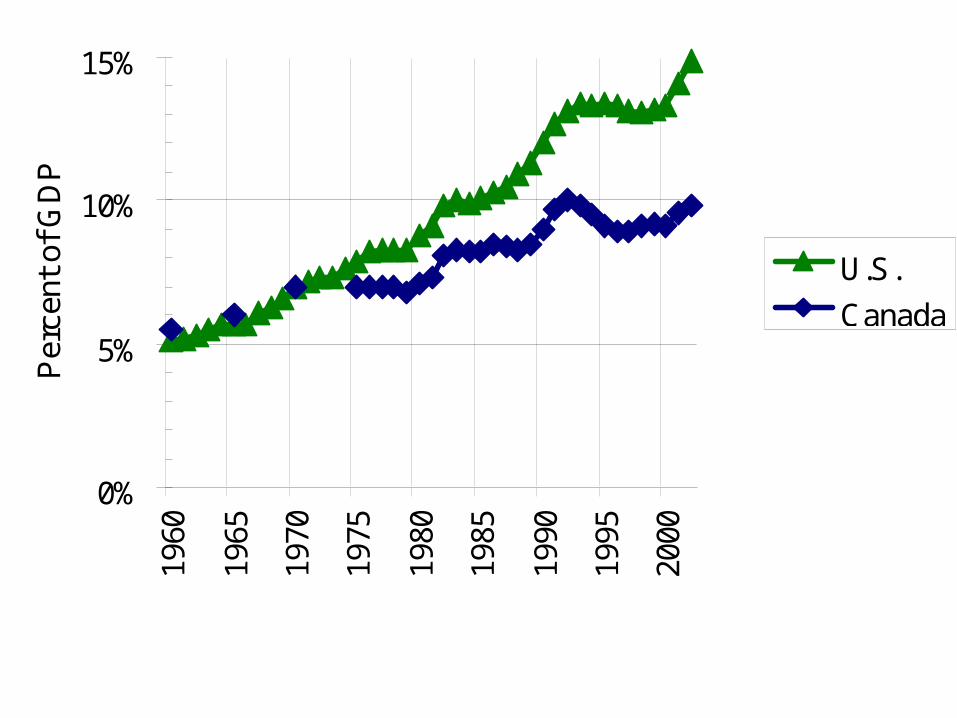
0%
5%
10%
15%
1960
1965
1970
1975
1980
1985
1990
1995
2000
Per
cent
of
GD
P
U.S.
Canada
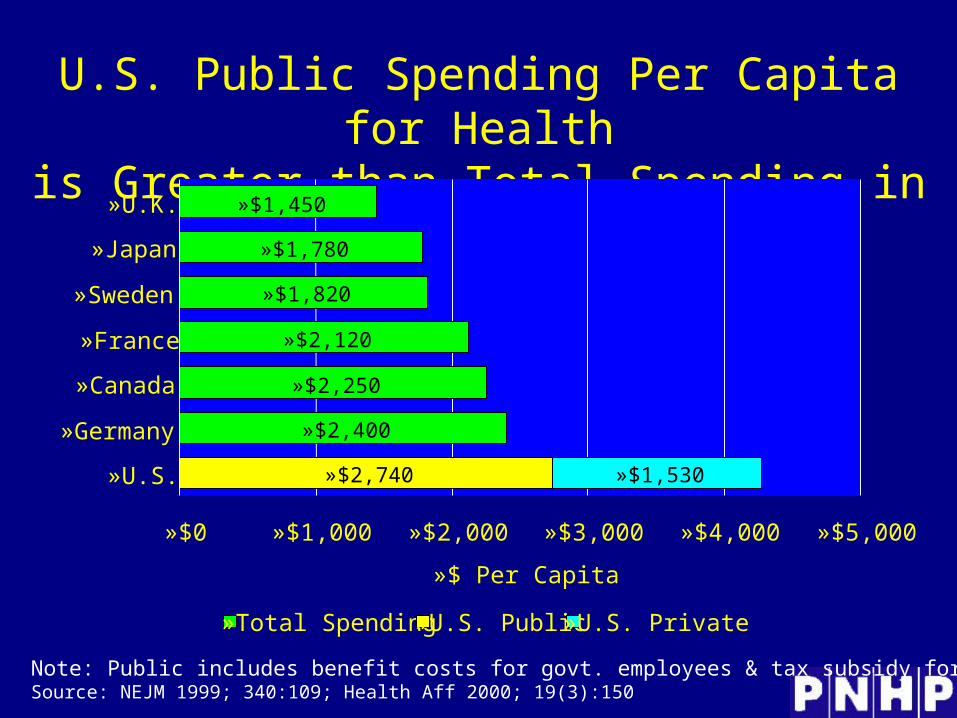
U.S. Public Spending Per Capita for Healthis Greater than Total Spending in Other
Nations
Note: Public includes benefit costs for govt. employees & tax subsidy for private insuranceSource: NEJM 1999; 340:109; Health Aff 2000; 19(3):150
»$1,450
»$1,780
»$1,820
»$2,120
»$2,250
»$2,400
»$1,530»$2,740
»$0 »$1,000 »$2,000 »$3,000 »$4,000 »$5,000
»U.K.
»Japan
»Sweden
»France
»Canada
»Germany
»U.S.
»$ Per Capita
»Total Spending »U.S. Public »U.S. Private
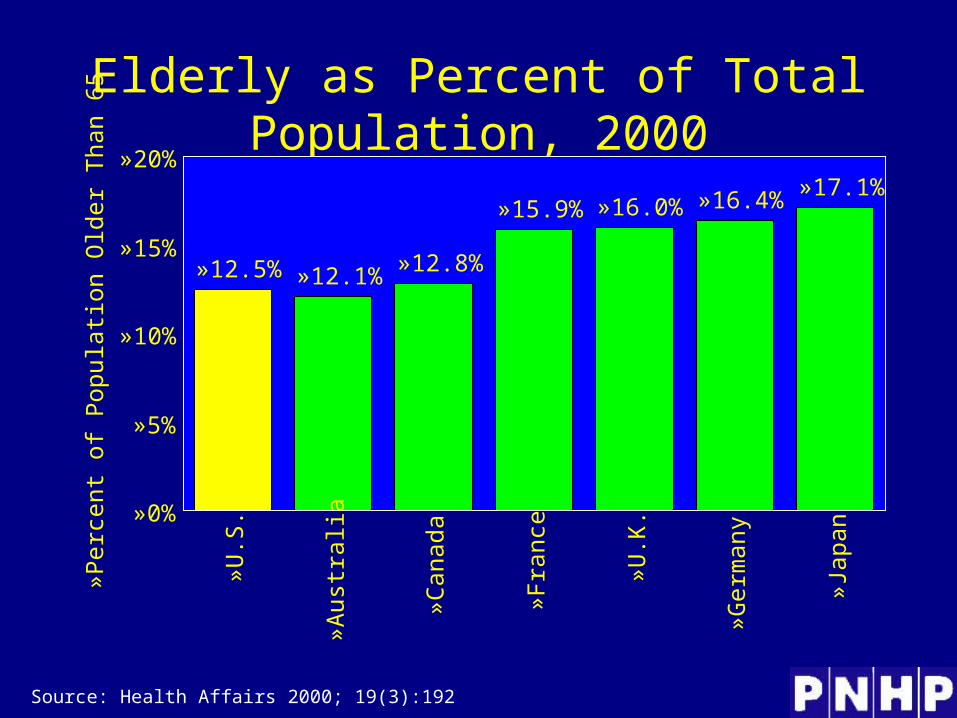
Elderly as Percent of Total Population, 2000
Source: Health Affairs 2000; 19(3):192
»12.1%»12.8%
»15.9% »16.0% »16.4%»17.1%
»12.5%
»0%
»5%
»10%
»15%
»20%
»U.S
.
» Aus
tral
ia
» Can
ada
» Fra
nce
» U.K
.
» Ger
man
y
» Jap
an» Per
cent
of
Pop
ulat
ion
Old
er T
han
65

Americans Lead the World in Hours Worked
Source: International Labor Organization, 1999
»1399
»1560
»1656
»1731
»1889
»1883
»1966
»0 »250 »500 »750 »1000 »1250 »1500 »1750 »2000
»Norway
»Germany
»France
»U.K.
»Japan
»U.S. (1980)
»U.S. (1997)
»Hours/worker-year - 1997
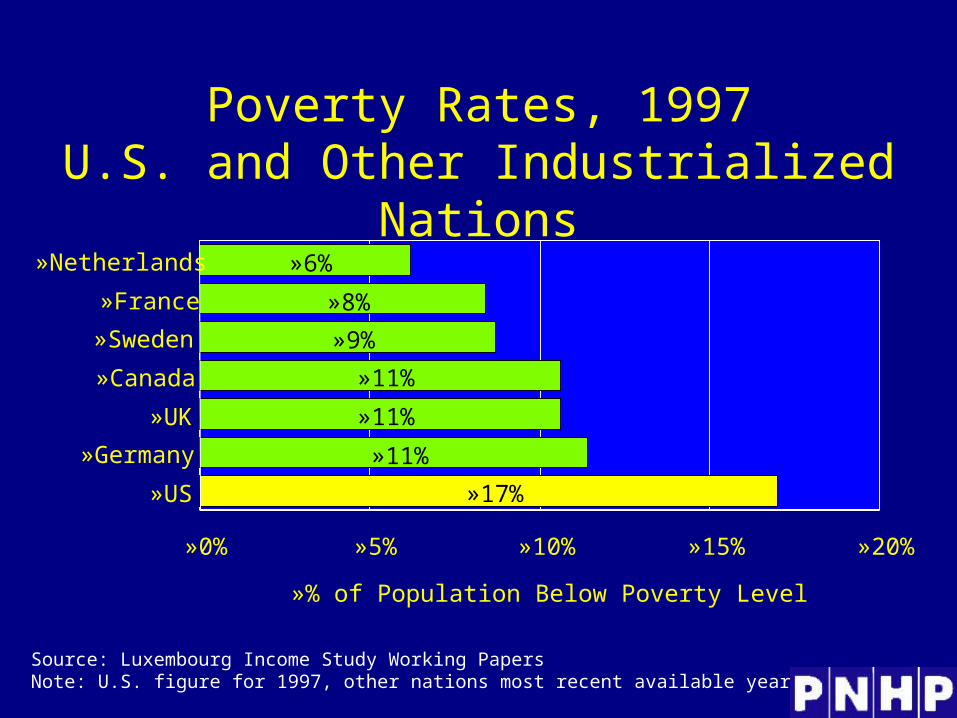
Poverty Rates, 1997U.S. and Other Industrialized Nations
Source: Luxembourg Income Study Working PapersNote: U.S. figure for 1997, other nations most recent available year
»6%
»8%
»9%
»11%
»11%
»11%
»17%
»0% »5% »10% »15% »20%
»Netherlands
»France
»Sweden
»Canada
»UK
»Germany
»US
»% of Population Below Poverty Level
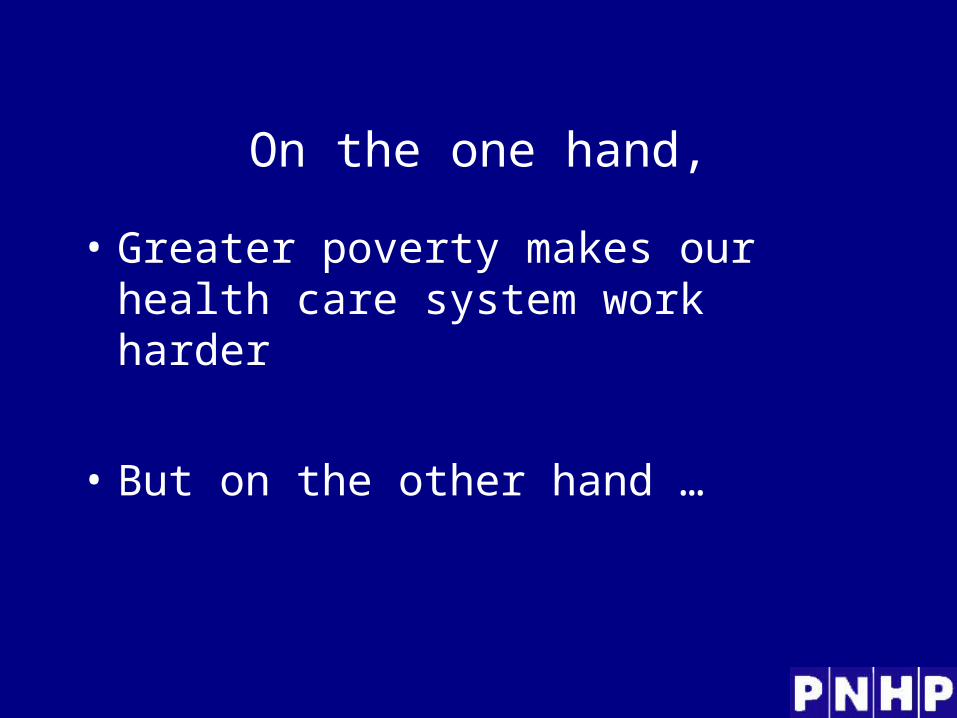
On the one hand,
• Greater poverty makes our health care system work harder
• But on the other hand …

Poverty-related illness is partly an effect of our health care system
• Our system for health care financing exacerbates the effect of poverty on health
• by making the opportunity cost high for the poor to obtain health care

Percent of Population withGovernment-Assured Insurance, 1997
Note: Germany does not require coverage for high-income persons, but virtually all buy coverageSource: OECD, 1999
»92%»100% »100% »100% »100% »100%
»45%
»0%
»20%
»40%
»60%
»80%
»100%
»U.S. »Germany »France »Canada »Australia »Japan »U.K.

Source: Oxford Rev Econ Pol 1989;5(1):89
Who Pays For Health Care?Regressivity Of U.S. Health Financing
»3
»1.75
»1.31 »1.27 »1.23 »1.15 »1.1 »1.07 »0.99
»0.64
»0
»0.5
»1
»1.5
»2
»2.5
»3
»3.5
»POOREST »RICHEST»INCOME DECILE
» Sha
re o
f H
ealth
Pay
men
ts/S
hare
of
» Inc
ome

Source: Premier's Common Future Of Health, Excludes Out-of-Pocket Costs
Who Pays For Canada's NHP?Province Of Alberta
»0.74 »0.77»0.85
»1
»1.2»1.3 »1.3
»0
»0.5
»1
»1.5
»2
»15,000 »25,000 »35,000 »50,000 »75,000 »100 K »125 K
»FAMILY INCOME
»Sha
re o
f H
ealth
Pay
men
ts/S
hare
» o
f In
com
e
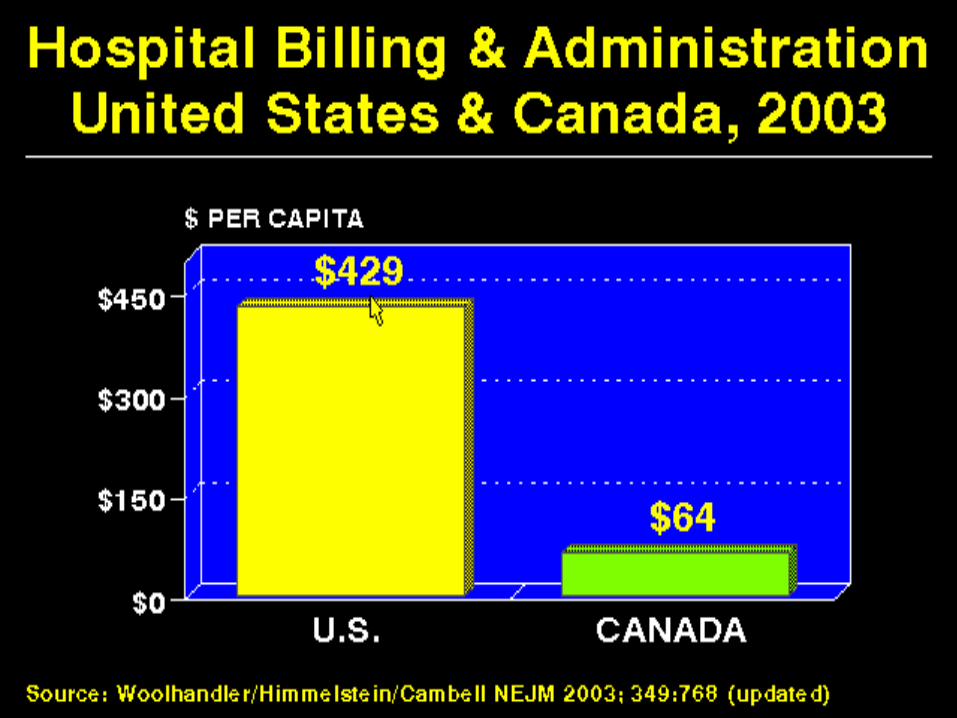

Why are hospital administrative costs less in Canada?
• Global budgets
– Operating budget
– Capital investment budget
• Negotiated with Province
• No bills.
• No need to track and bill for individual services and goods

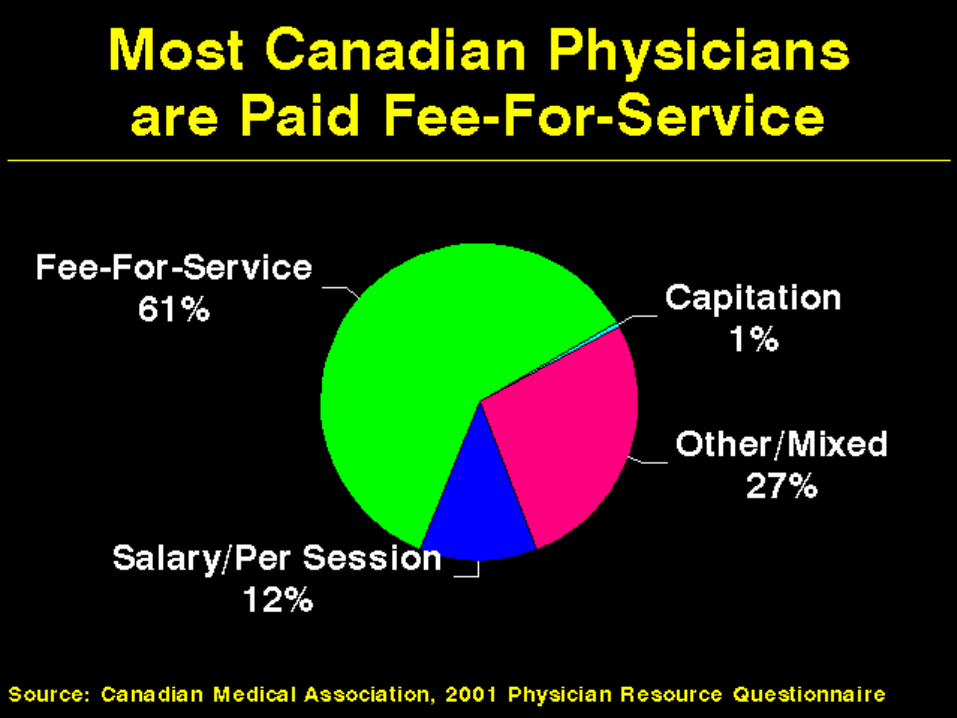
Why are physicians’ administrative costs lower in Canada?
• Single payer
• One place to send bills
• One set of rules
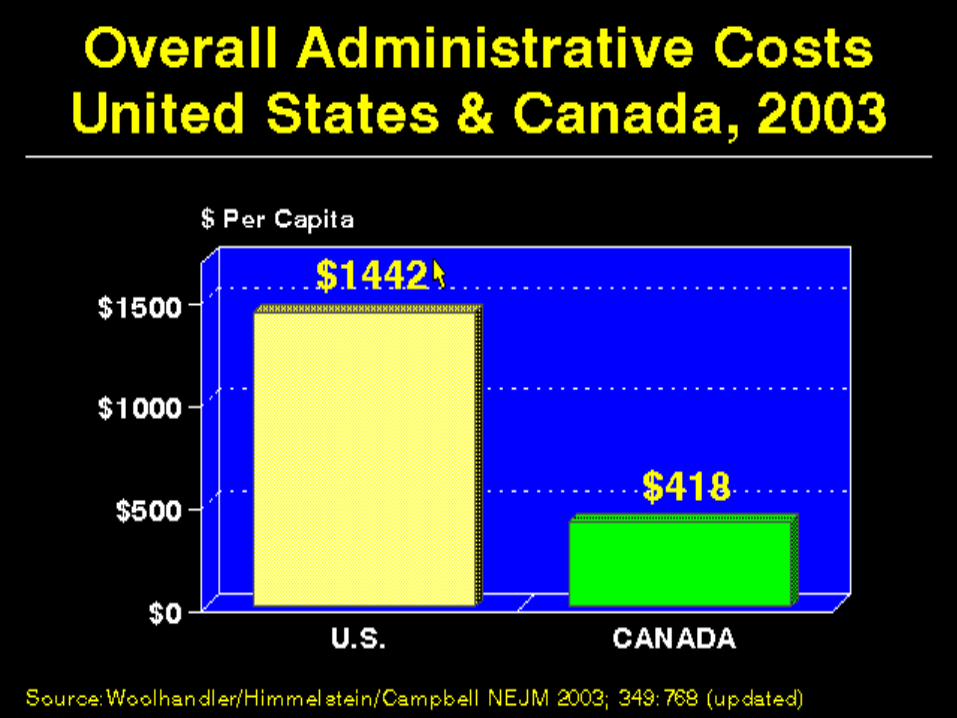

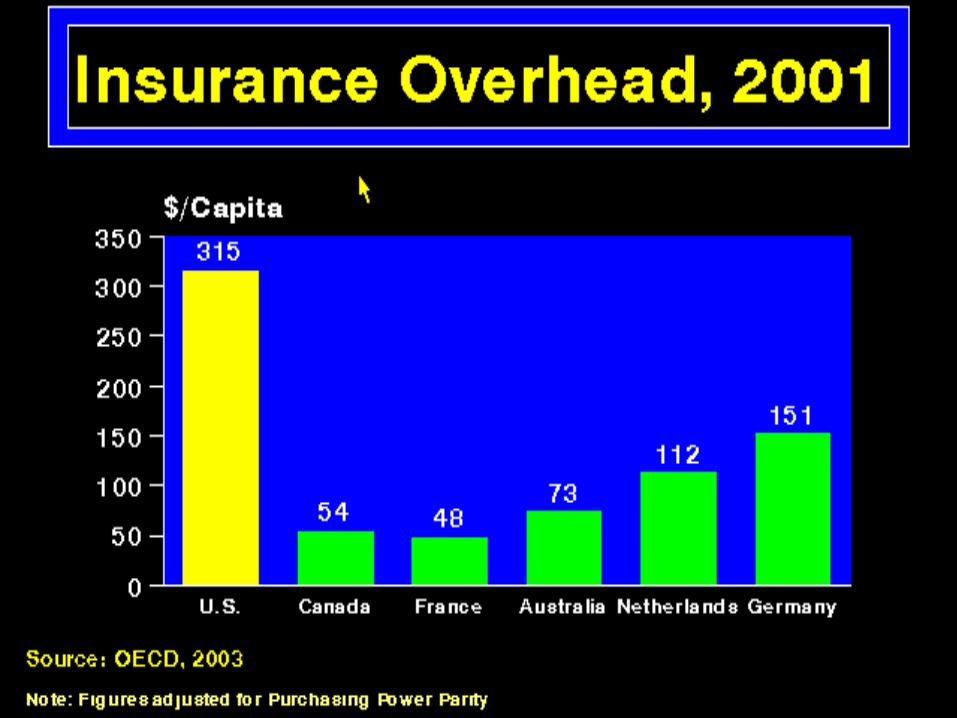
Why are Canada’s system administrative costs lower?
• No need to determine who is eligible for what– Canada’s overall administrative %
close to Medicare (before Medicare + Choice), less than Medicaid
• No marketing of insurance• No billing or collecting insurance
premiums

Number of Insurance Products
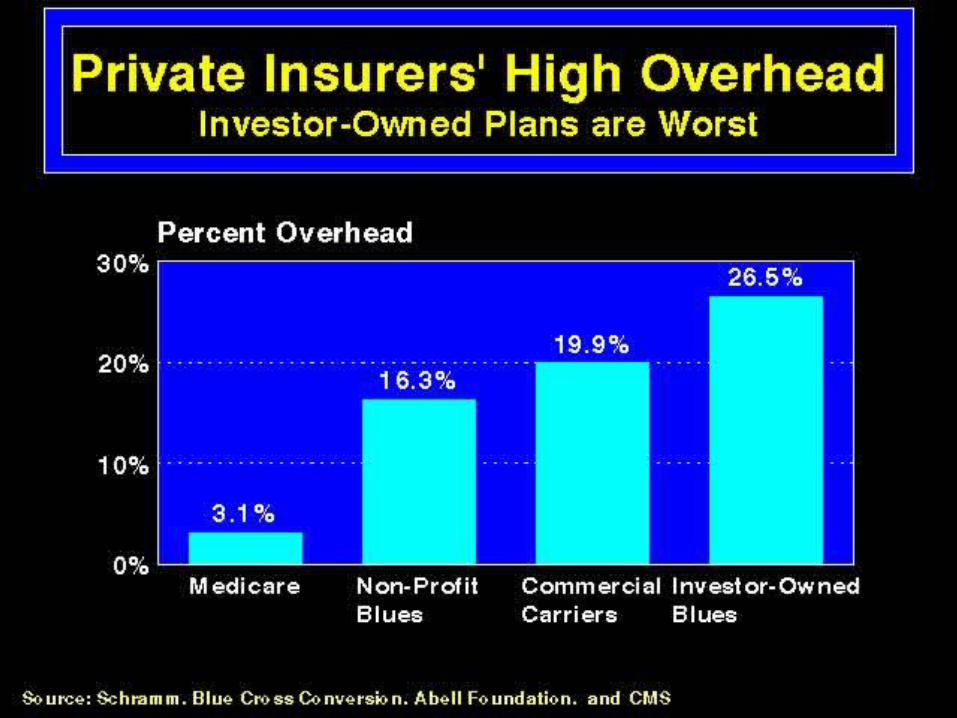
Private insurers’ High Overhead


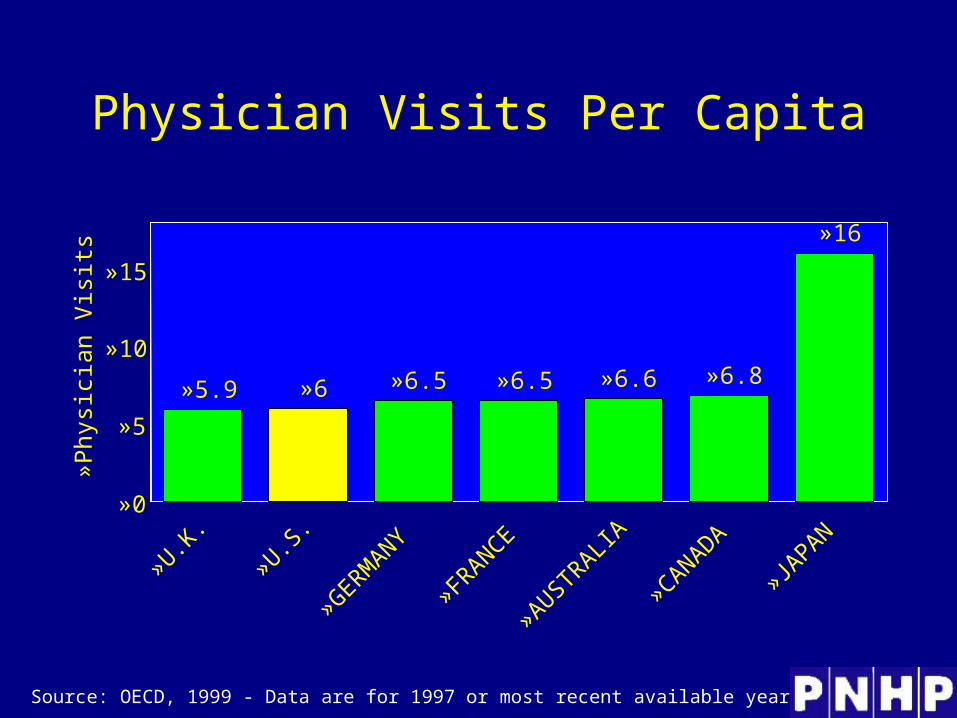
Physician Visits Per Capita
Source: OECD, 1999 - Data are for 1997 or most recent available year
»5.9 »6.5 »6.5 »6.6 »6.8
»16
»6
»0
»5
»10
»15
»U.K.
»U.S.
»GERMANY
»FRANCE
»AUSTRALIA
»CANADA
»JAPAN
» Phy
sici
an V
isits
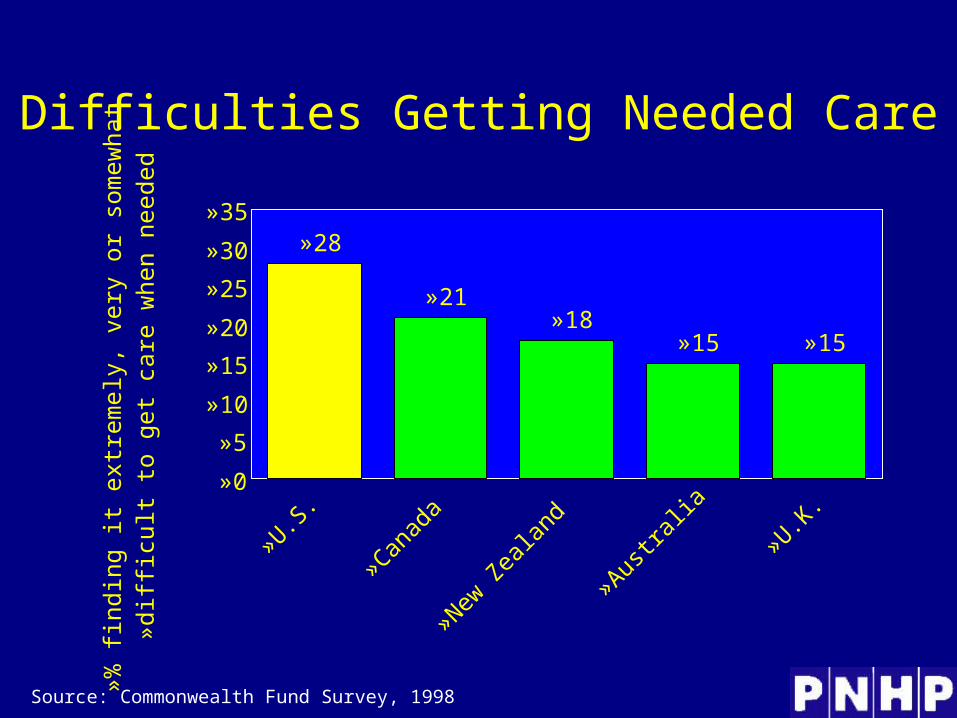
Difficulties Getting Needed Care
Source: Commonwealth Fund Survey, 1998
»21»18
»15 »15
»28
»0
»5
»10
»15
»20
»25
»30
»35
»U.S.
»Canad
a
»New Z
ealan
d
»Austra
lia»U.K
.
» % f
indi
ng it
ext
rem
ely,
ver
y or
som
ewha
t » d
iffic
ult
to g
et c
are
whe
n ne
eded
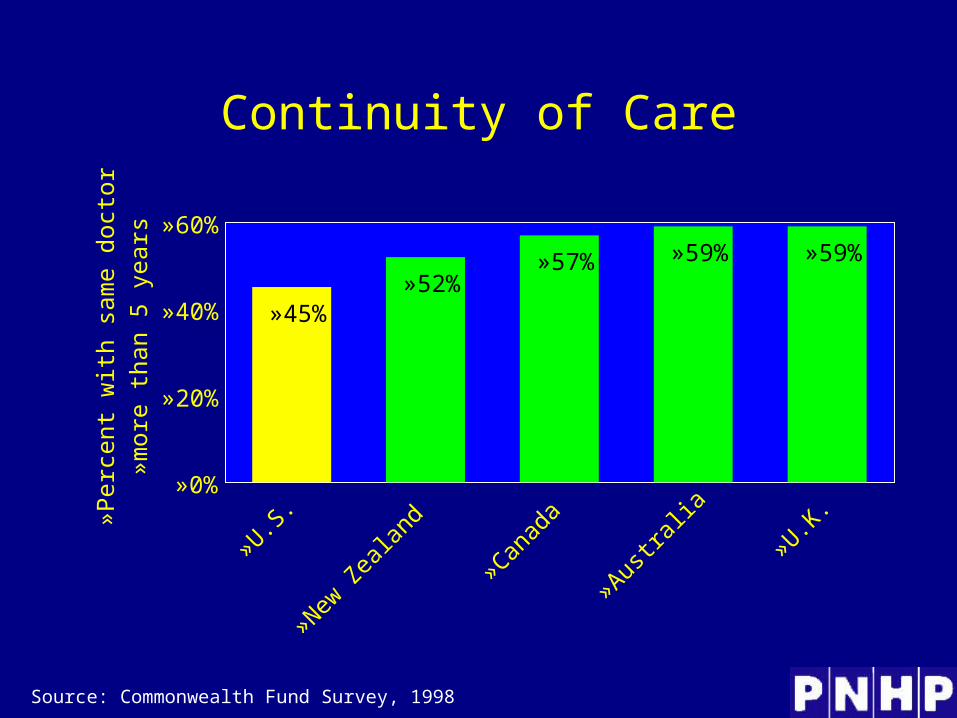
Continuity of Care
Source: Commonwealth Fund Survey, 1998
»52%»57% »59% »59%
»45%
»0%
»20%
»40%
»60%
»U.S.
»New Z
ealan
d
»Canad
a
»Austra
lia»U.K
.
» Per
cent
with
sam
e do
ctor
» mor
e th
an 5
yea
rs


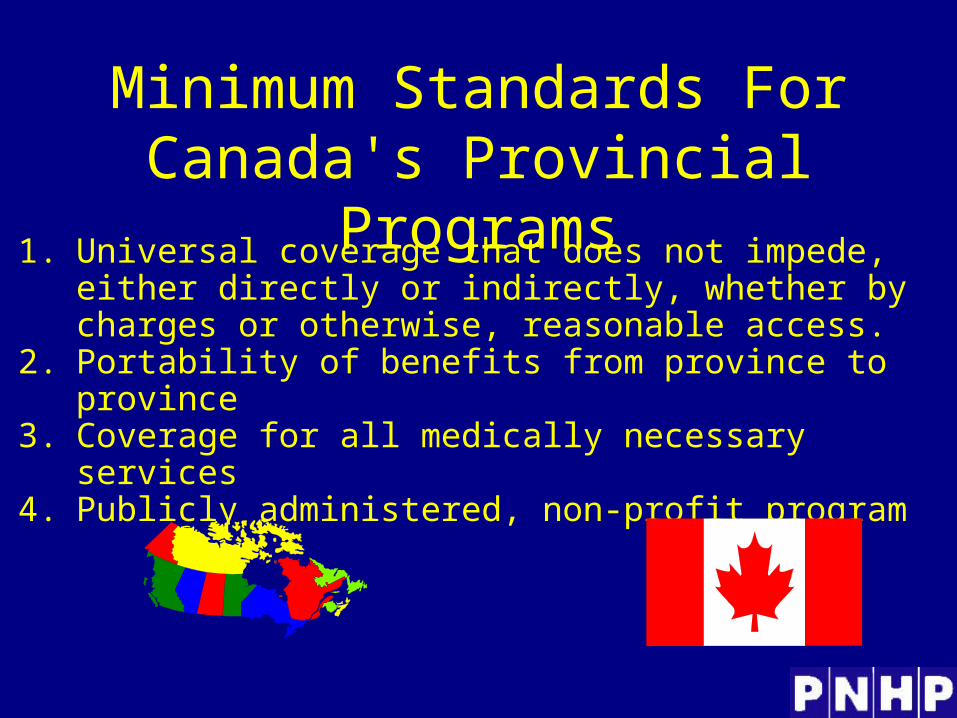
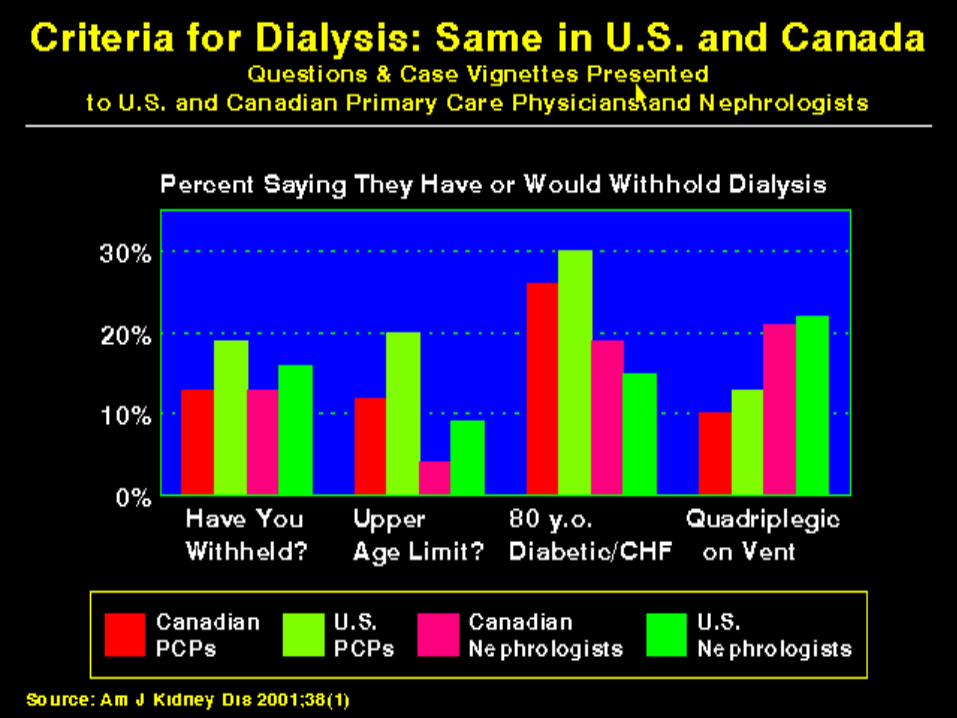
1. Universal coverage that does not impede, either directly or indirectly, whether by charges or otherwise, reasonable access.
2. Portability of benefits from province to province3. Coverage for all medically necessary services4. Publicly administered, non-profit program
Minimum Standards For Canada's Provincial Programs
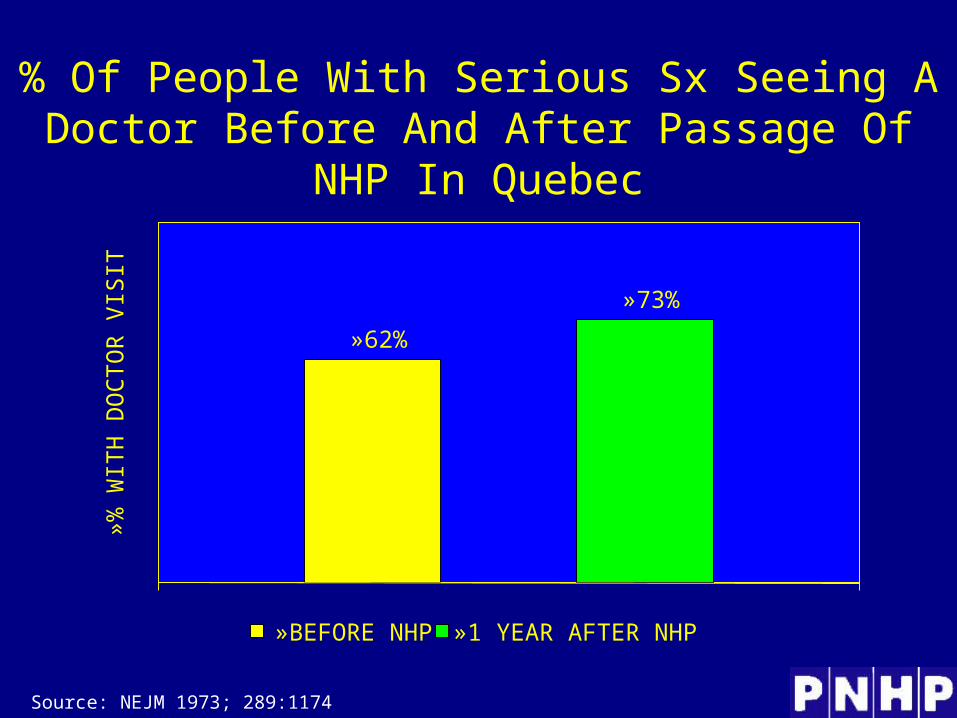
Source: NEJM 1973; 289:1174
% Of People With Serious Sx Seeing A Doctor Before And After Passage Of NHP In Quebec
»62%
»73%
»% W
ITH
DO
CT
OR
VIS
IT
»BEFORE NHP »1 YEAR AFTER NHP

Infant MortalityU.S. & Canada, 1955-1996
Source: OECD 1999, Statistics Canada & CDF
CANADA
U.S.FIRST PROVINCE IMPLEMENTS NHP
»0
»10
»20
»30
»40
» 195
5
» 196
0
» 196
5
» 197
0
» 197
5
» 198
0
» 198
5
» 199
0
» 199
5
» Dea
ths/
1000
Liv
e B
irths
»CANADA»U.S.

Infant Deaths by Income, Canada 1996Even the Poor Do Better than U.S. Average
3.94.7 5.1 5.2
6.5
7.8
0123456789
Wealthiest20%
Middle20%
Poorest20%
U.S.Average
Infa
nt
Mo
rtali
ty
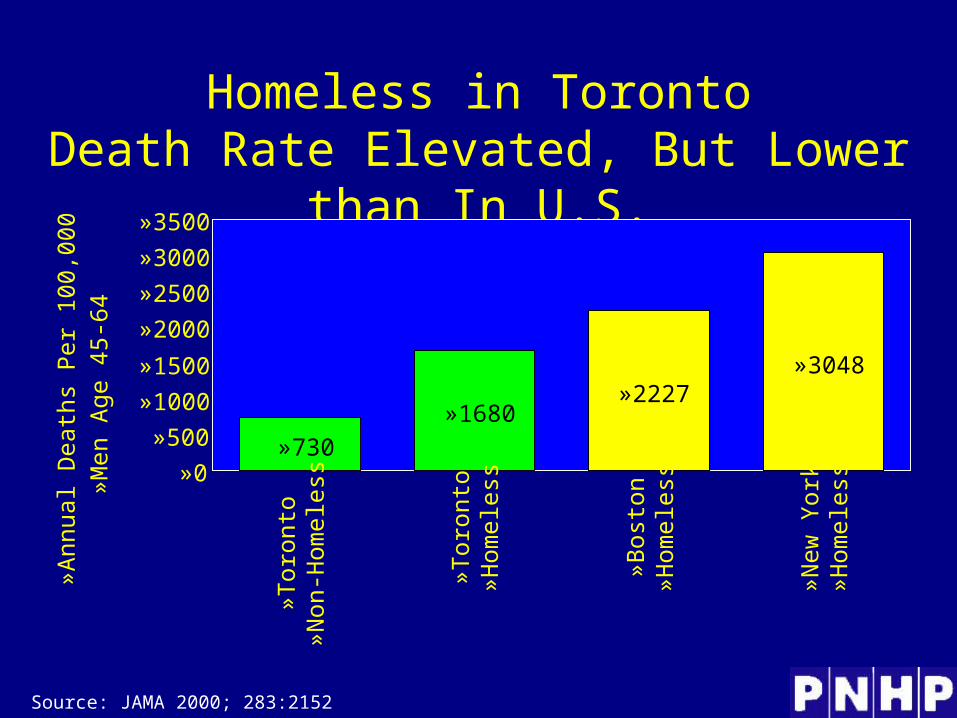
Homeless in TorontoDeath Rate Elevated, But Lower than In
U.S.
Source: JAMA 2000; 283:2152
»730
»1680»2227
»3048
»0
»500
»1000
»1500
»2000
»2500
»3000
»3500
» Tor
onto
» Non
-Hom
eles
s
» Tor
onto
» Hom
eles
s
» Bos
ton
» Hom
eles
s
» New
Yor
k» H
omel
ess
» Ann
ual D
eath
s P
er 1
00,0
00
» Men
Age
45-
64
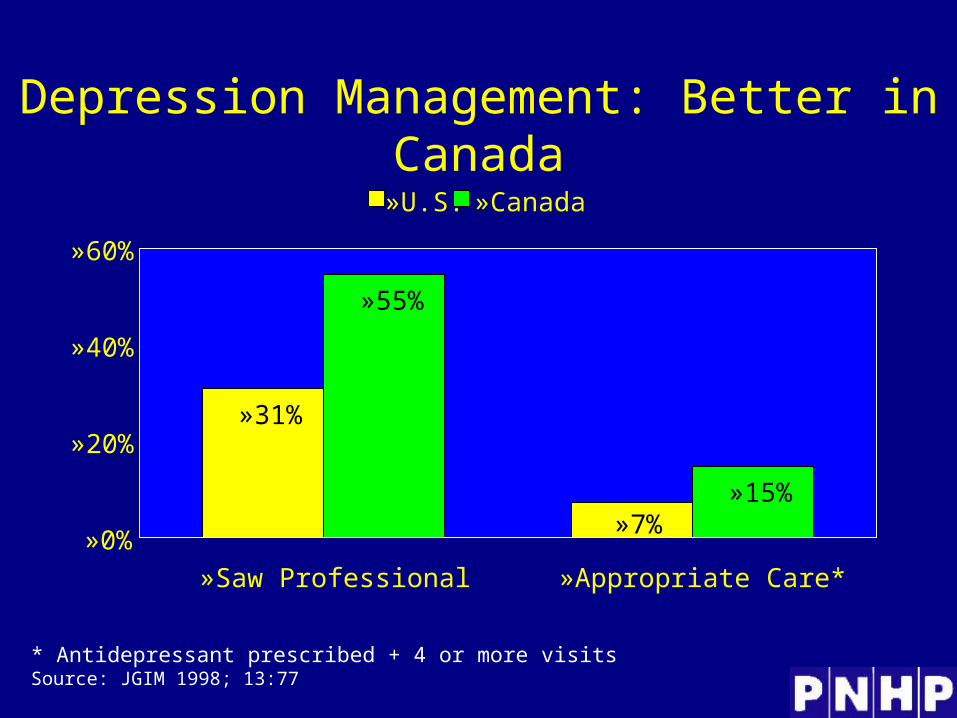
Depression Management: Better in Canada
* Antidepressant prescribed + 4 or more visitsSource: JGIM 1998; 13:77
»31%
»55%
»15%»7%»0%
»20%
»40%
»60%
»Saw Professional »Appropriate Care*
»U.S. »Canada

Physician Services For The Elderly: Canadians Get More of Most Kinds of Care
Source: JAMA 1996; 275:1410
»1.17
»1.44
»0.75
»1.18
»0
»0.5
»1
»1.5
»2
»All Services »Evaluation/»Management
»Procedures »Tests
» Can
adia
n R
ate/
U.S
. R
ate


Few Canadian Physicians Emigrate
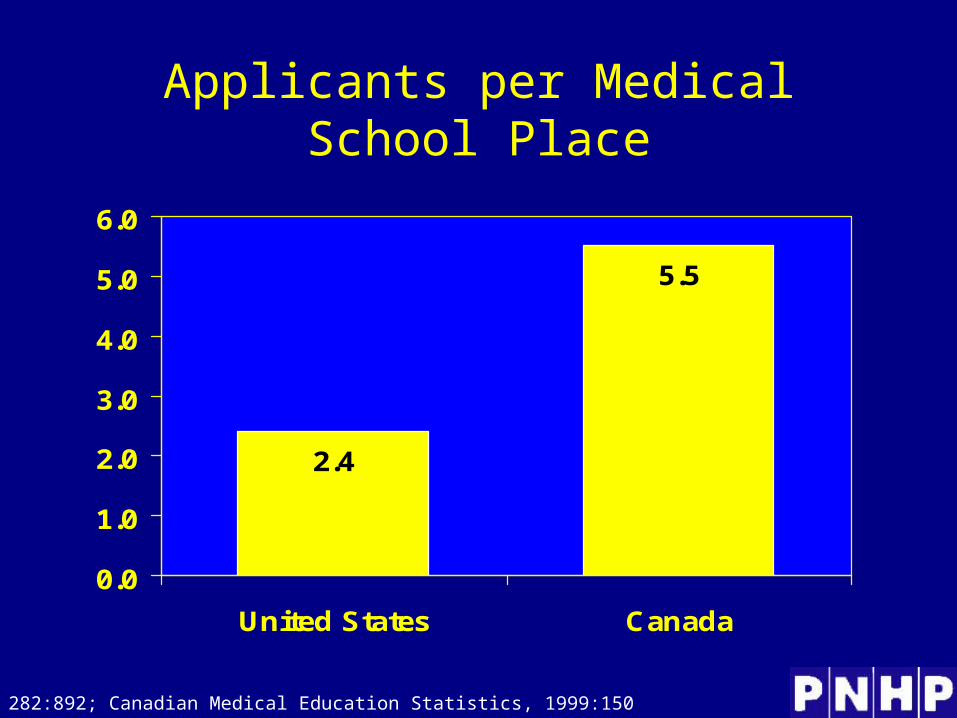
Applicants per Medical School Place
2.4
5.5
0.0
1.0
2.0
3.0
4.0
5.0
6.0
United States Canada
Source: JAMA; 282:892; Canadian Medical Education Statistics, 1999:150
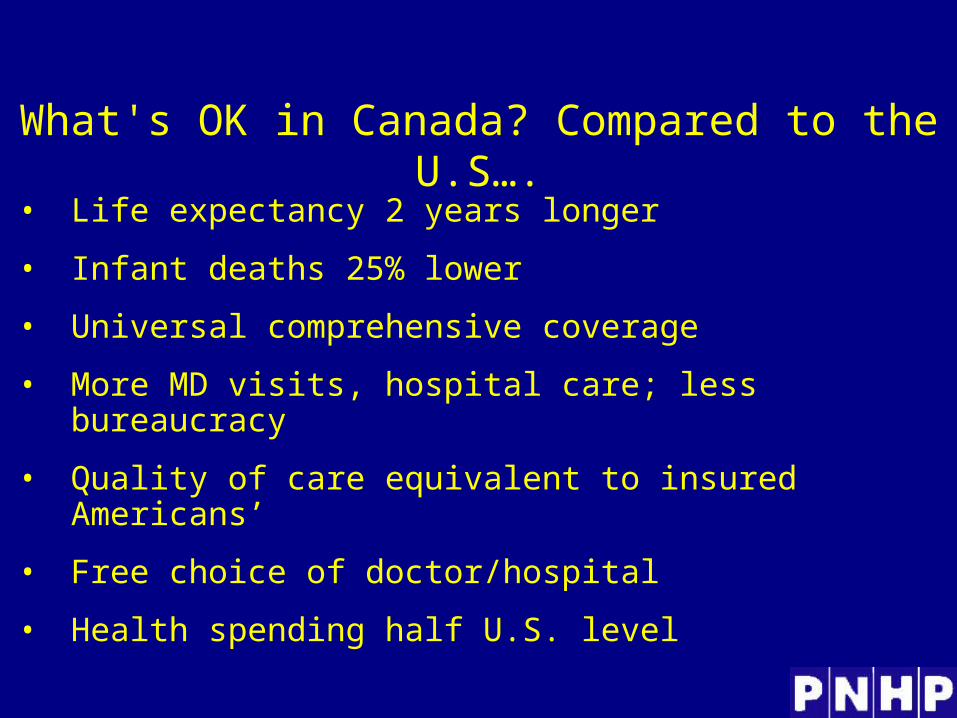
What's OK in Canada? Compared to the U.S….
• Life expectancy 2 years longer
• Infant deaths 25% lower
• Universal comprehensive coverage
• More MD visits, hospital care; less bureaucracy
• Quality of care equivalent to insured Americans’
• Free choice of doctor/hospital
• Health spending half U.S. level

What's the Matter in Canada?
• The wealthy lobby for private funding and tax cuts; they resent subsidizing care for others
• Result: government funding cuts (e.g. 30% of hospital beds closed during 90s) causingdissatisfaction
• U.S. and Canadian firms seek profit opportunities in health care privatization
• Conrad Black, foe of public services, owns 2/3 of Canadian newspapers
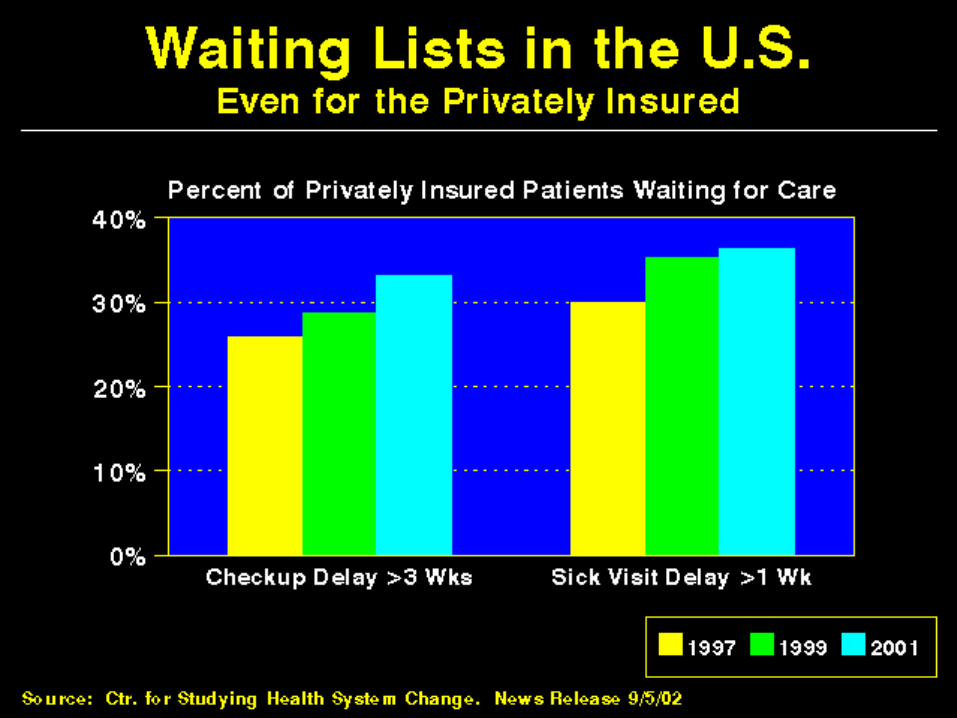
• Misleading waiting list surveys by right wing group
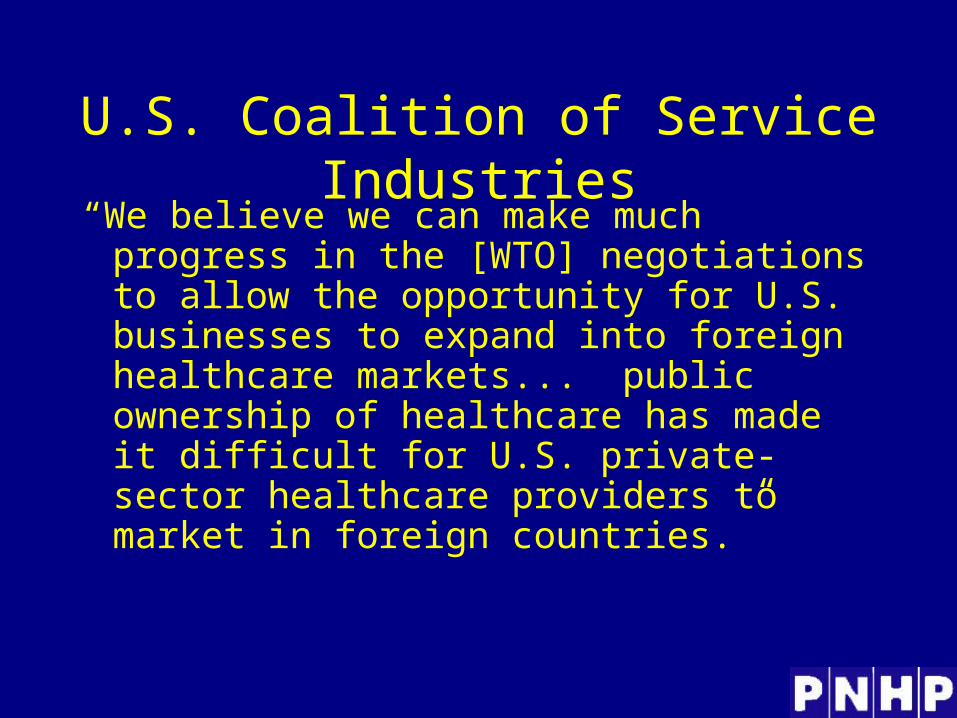
“We believe we can make much progress in the [WTO] negotiations to allow the opportunity for U.S. businesses to expand into foreign healthcare markets... public ownership of healthcare has made it difficult for U.S. private-sector healthcare providers to market in foreign countries.”
U.S. Coalition of Service Industries