Inertia: Basic Concept s and Impact s on the ERCOT Grid · Figure 4: Correlation between Wind...
25
ERCOT Public Paper © 2018 ERCOT All rights reserved. Inertia: Basic Concepts and Impacts on the ERCOT Grid
Transcript of Inertia: Basic Concept s and Impact s on the ERCOT Grid · Figure 4: Correlation between Wind...
ERCOT Public Paper
© 2018 ERCOT All rights reserved.
Inertia: Basic Concepts and Impacts on the ERCOT Grid

Inertia: Basic Concepts and Impacts on the ERCOT Grid ERCOT Public
2
DOCUMENT REVISIONS
VER. DESCRIPTION REVISION DATE
0 Initial version of inertia whitepaper 4/4/2018

Inertia: Basic Concepts and Impacts on the ERCOT Grid ERCOT Public
3
1 Abstract Power system inertia is defined as the ability of a power system to oppose changes in system frequency due to resistance provided by rotating masses. The level of inertia present in a system at any time is dependent on the amount of kinetic energy stored in rotating masses of synchronously-interconnected machines, including various types of generators as well as synchronously operating motor loads. As penetration levels of non-synchronous, inverter-based generation resources (e.g., wind, solar, batteries) increase in the ERCOT generation mix, the system’s synchronous inertia will inevitably decline, especially during low load conditions. System inertia determines the initial rate of frequency decline after a sudden loss of generation. As system inertia declines, the Rate of Change of Frequency (RoCoF) after an event increases. Events with very high RoCoF may leave insufficient time for various frequency response mechanisms to deploy and arrest frequency decay above the system’s under-frequency load shed set points. This, in turn, may result in involuntarily load disconnection.
This white paper describes ERCOT staff’s initiatives to track the trends of historical inertia on the ERCOT system and to develop tools and methods to mitigate negative impacts of low inertia conditions that could arise in the future.
The paper is structured as follows: Section 3 describes the basics of synchronous inertia and provides information about typical inertia contribution from various resource types in the ERCOT generation fleet. Section 4 discusses factors influencing generator commitment patterns and, consequently, affecting system inertia in ERCOT. Section 5 illustrates historic inertia trends in ERCOT between 2013 and 2017.
Section 6 presents a methodology for determining critical inertia (i.e., the minimum level of system inertia at or above which the ERCOT system can be operated reliably with current frequency control practices). Section 7 summarizes current practices for control room monitoring and maintaining of inertia equal to or greater than the critical inertia level.
Section 8 presents analysis of future base-level inertia (i.e., inertia that is expected based on specific resources’ characteristics and protocol requirements). The section also attempts to estimate additional generation that will be needed to serve future load and its inertia contribution.
Section 9 shows how various frequency control parameter changes influence critical inertia levels. Section 10 provides an international review of inertia related challenges and mitigation measures in power systems of similar size and renewable penetration levels as those of ERCOT. Section 11 presents a summary and conclusions.
Inertia: Basic Concepts and Impacts on the ERCOT Grid ERCOT Public
4
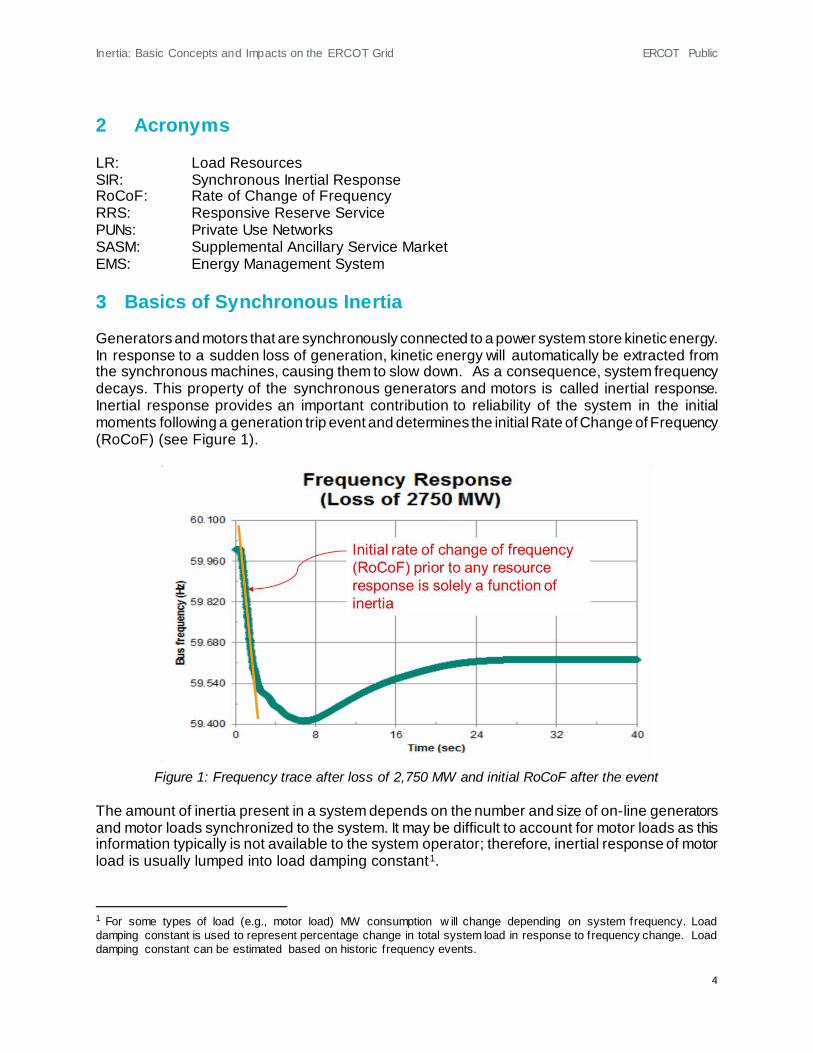
2 Acronyms LR: Load Resources SIR: Synchronous Inertial Response RoCoF: Rate of Change of Frequency RRS: Responsive Reserve Service PUNs: Private Use Networks SASM: Supplemental Ancillary Service Market EMS: Energy Management System 3 Basics of Synchronous Inertia Generators and motors that are synchronously connected to a power system store kinetic energy. In response to a sudden loss of generation, kinetic energy will automatically be extracted from the synchronous machines, causing them to slow down. As a consequence, system frequency decays. This property of the synchronous generators and motors is called inertial response. Inertial response provides an important contribution to reliability of the system in the initial moments following a generation trip event and determines the initial Rate of Change of Frequency (RoCoF) (see Figure 1).
Figure 1: Frequency trace after loss of 2,750 MW and initial RoCoF after the event
The amount of inertia present in a system depends on the number and size of on-line generators and motor loads synchronized to the system. It may be difficult to account for motor loads as this information typically is not available to the system operator; therefore, inertial response of motor load is usually lumped into load damping constant1.
1 For some types of load (e.g., motor load) MW consumption w ill change depending on system frequency. Load damping constant is used to represent percentage change in total system load in response to frequency change. Load damping constant can be estimated based on historic frequency events.

Inertia: Basic Concepts and Impacts on the ERCOT Grid ERCOT Public
5
For any hour, synchronous inertial response (SIR) from generators (Msys) is calculated as follows:
𝑀𝑀𝑠𝑠𝑠𝑠𝑠𝑠 = ∑ 𝐻𝐻𝑖𝑖 ∗𝑀𝑀𝑀𝑀𝑀𝑀𝑖𝑖𝑖𝑖∈𝐼𝐼
where I is the set of on-line synchronous generators or condensers; MVAi is MVA base of on-line synchronous generator or synchronous condenser I; and Hi is the inertia constant for an on-line generator or synchronous condenser i in a system (in seconds on machine MVA base, MVAi)2. Table 1 shows the range of inertia constants for different generation types in ERCOT. It indicates that Hydro, Simple Cycle Combustion Turbine, Gas Steam, and Coal have smaller inertia constant than Nuclear and Combined Cycle; while non-synchronous, inverter-based, resources like wind and solar generation do not contribute to synchronous inertia. Table 1: Inertia constant, MVA base3, and inertial response contribution ranges by Resource type in
ERCOT
MVA base range Inertia constant range. H ( in
seconds) using corresponding generator MVA base
Inertial response contribution range,
H* MVA base (in MW*s)
Nuclear 1410-1504 3.8-4.34 5344-6530
Coal 194-1120 2.9-4.5 863-3158 Combustion
Turbine 7-235 1-12.5 22-1288
Gas Steam 14-887 1-5.4 13-2216 Combined
Cycle 25-1433 1.1-9 97-8765
Hydro 9-36 2-3 19-1133 Reciprocating
Engine 10-70 1.1-2.1 13-97
Wind - 0 0
Solar PV - 0 0
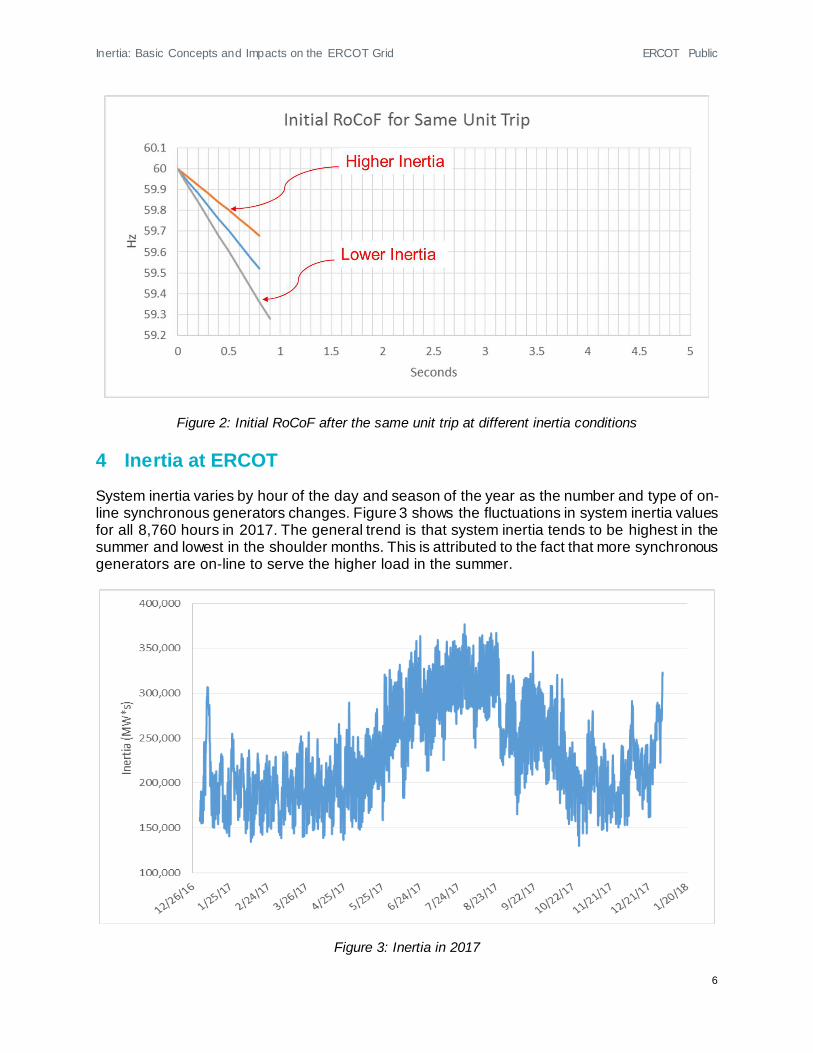
System inertia determines the RoCoF after an event, which may be a generation trip or, potentially, a step-change increase in load. If system inertia is low, the RoCoF after an event is higher (see Figure 2). At very high RoCoF, there may be insufficient time for various frequency response mechanisms to deploy and arrest frequency decay above under-frequency load shed set points. This, in turn, may result in involuntarily load disconnection.
2 The kinetic energy of a synchronous machine rotating at its rated speed can be normalized (divided) by an arbitrary MVA base, typically set equal to the machine nameplate rating. The normalized value is referred to as inertia constant H in seconds. Conversely, by multiplying H by the MVA base w e obtain the kinetic energy of the synchronous machine rotating at its nominal speed. 3 MVA base is used to normalize kinetic energy (in MW*s) of a synchronous machine rotating at rated speed. Kinetic energy normalized by MVA base is called inertia constant H. MVA base is typically assumed equal to machine nameplate rating.
Inertia: Basic Concepts and Impacts on the ERCOT Grid ERCOT Public
6
Figure 2: Initial RoCoF after the same unit trip at different inertia conditions 4 Inertia at ERCOT System inertia varies by hour of the day and season of the year as the number and type of on-line synchronous generators changes. Figure 3 shows the fluctuations in system inertia values for all 8,760 hours in 2017. The general trend is that system inertia tends to be highest in the summer and lowest in the shoulder months. This is attributed to the fact that more synchronous generators are on-line to serve the higher load in the summer.
Figure 3: Inertia in 2017
Inertia: Basic Concepts and Impacts on the ERCOT Grid ERCOT Public
7
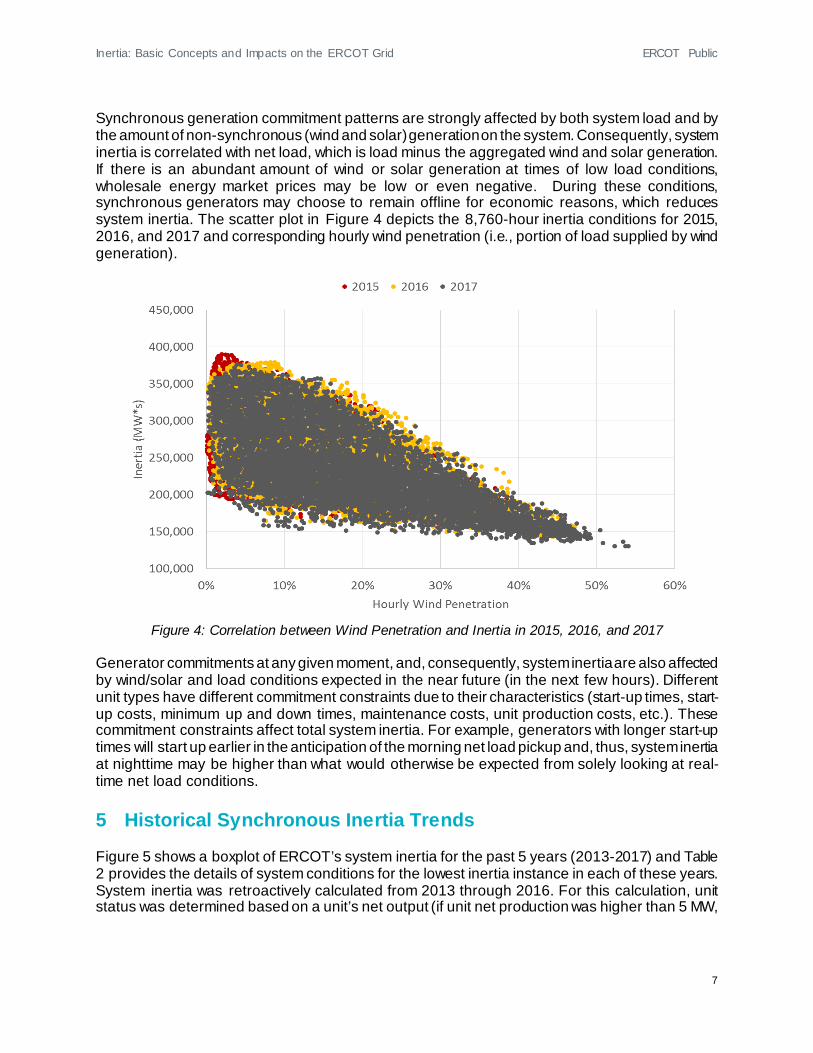
Synchronous generation commitment patterns are strongly affected by both system load and by the amount of non-synchronous (wind and solar) generation on the system. Consequently, system inertia is correlated with net load, which is load minus the aggregated wind and solar generation. If there is an abundant amount of wind or solar generation at times of low load conditions, wholesale energy market prices may be low or even negative. During these conditions, synchronous generators may choose to remain offline for economic reasons, which reduces system inertia. The scatter plot in Figure 4 depicts the 8,760-hour inertia conditions for 2015, 2016, and 2017 and corresponding hourly wind penetration (i.e., portion of load supplied by wind generation).
Figure 4: Correlation between Wind Penetration and Inertia in 2015, 2016, and 2017
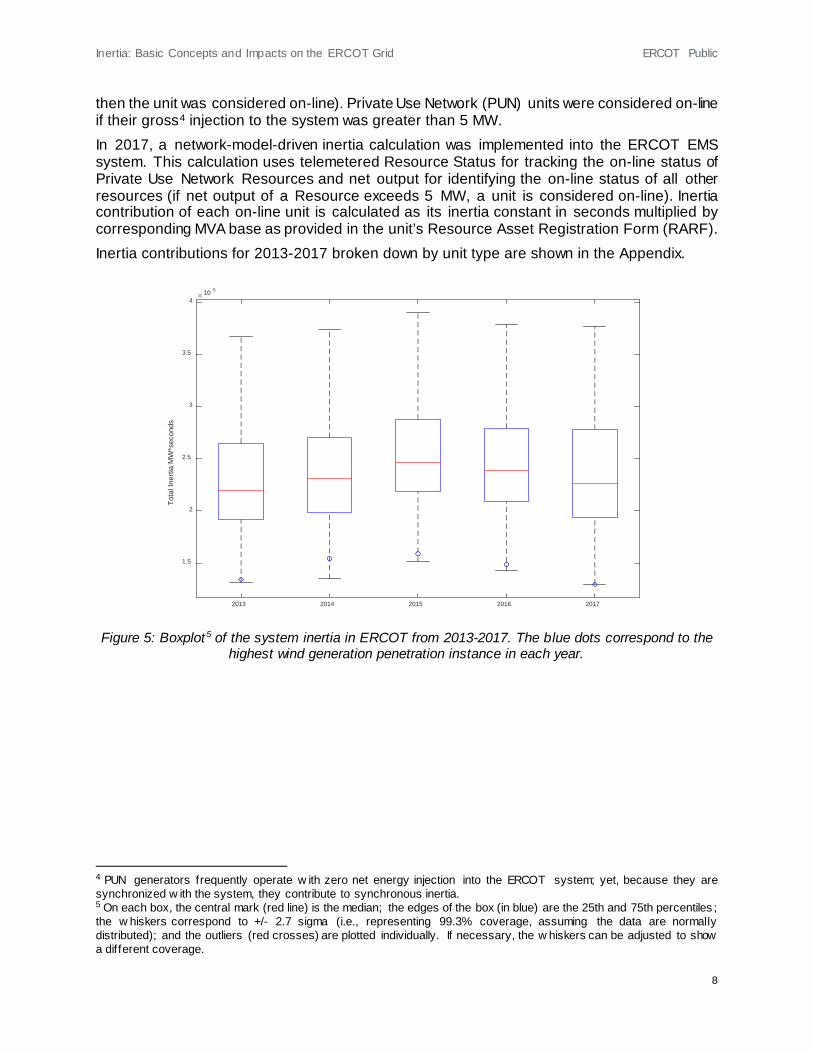
Generator commitments at any given moment, and, consequently, system inertia are also affected by wind/solar and load conditions expected in the near future (in the next few hours). Different unit types have different commitment constraints due to their characteristics (start-up times, start-up costs, minimum up and down times, maintenance costs, unit production costs, etc.). These commitment constraints affect total system inertia. For example, generators with longer start-up times will start up earlier in the anticipation of the morning net load pickup and, thus, system inertia at nighttime may be higher than what would otherwise be expected from solely looking at real-time net load conditions. 5 Historical Synchronous Inertia Trends Figure 5 shows a boxplot of ERCOT’s system inertia for the past 5 years (2013-2017) and Table 2 provides the details of system conditions for the lowest inertia instance in each of these years. System inertia was retroactively calculated from 2013 through 2016. For this calculation, unit status was determined based on a unit’s net output (if unit net production was higher than 5 MW,
Inertia: Basic Concepts and Impacts on the ERCOT Grid ERCOT Public
8
then the unit was considered on-line). Private Use Network (PUN) units were considered on-line if their gross4 injection to the system was greater than 5 MW. In 2017, a network-model-driven inertia calculation was implemented into the ERCOT EMS system. This calculation uses telemetered Resource Status for tracking the on-line status of Private Use Network Resources and net output for identifying the on-line status of all other resources (if net output of a Resource exceeds 5 MW, a unit is considered on-line). Inertia contribution of each on-line unit is calculated as its inertia constant in seconds multiplied by corresponding MVA base as provided in the unit’s Resource Asset Registration Form (RARF). Inertia contributions for 2013-2017 broken down by unit type are shown in the Appendix.
Figure 5: Boxplot5 of the system inertia in ERCOT from 2013-2017. The blue dots correspond to the highest wind generation penetration instance in each year.
4 PUN generators frequently operate w ith zero net energy injection into the ERCOT system; yet, because they are synchronized w ith the system, they contribute to synchronous inertia. 5 On each box, the central mark (red line) is the median; the edges of the box (in blue) are the 25th and 75th percentiles ; the w hiskers correspond to +/- 2.7 sigma (i.e., representing 99.3% coverage, assuming the data are normally distributed); and the outliers (red crosses) are plotted individually. If necessary, the w hiskers can be adjusted to show a different coverage.
2013 2014 2015 2016 2017
Tota
l Ine
rtia
MW
*sec
onds
10 5
1.5
2
2.5
3
3.5
4

Inertia: Basic Concepts and Impacts on the ERCOT Grid ERCOT Public
9
Table 2: Lowest inertia in different year (GW*s)6
Date and Time 2013
3/10/13 3:00 AM
2014 3/30/14
3:00 AM
2015 11/25/15 2:00 AM
2016 4/10/16 2:00 AM
2017 10/27/17 4:00 AM
Min synch. Inertia (GW*s) 132 135 152 143 130
System load at minimum synch.
Inertia (MW) 24,726 24,540 27,190 27,831 28,425
non-synchronous gen. in % of system load 31 34 42 47 54
As shown in Figure 5, in 2014 and 2015, even though the installed capacity of wind generation was increasing, ERCOT’s minimum as well as median system inertia increased. This upward trend is attributed to changes in unit commitment patterns in the 2014-2015 timeframe, as lower natural gas prices resulted in a higher percentage of energy coming from Combined Cycle Gas Turbines and a lower percentage from coal units. A breakdown of generation and inertia at the annual minimum system inertia hours from 2013 to 2017 is shown in Figure 6, and similar trends are observed. As the inertia contribution from coal units diminished, it was offset by a corresponding increase in the inertia contribution from combined cycle and simple cycle natural gas units. At the hours when system inertia was at a minimum, PUNs were exporting between 1,200 and 6,300 MW, and their inertia contribution increased from 38 GW*s in 2013 to 48 GW*s in 2017.
Figure 6: Breakdown of inertia contribution by resource type at lowest inertia hours in 2013-2017
6 MW*s (or converted to GW*s) is an industry standard w ay of expressing the amount of stored kinetic energy on a system. Inertia constant H multiplied by the machine’s MVA base is the machine’s inertial response in energy terms. For example, a 200 MVA generation unit w ith an inertia constant of 3 seconds w ould use up all of its kinetic energy in 3 seconds if producing at full output.

Inertia: Basic Concepts and Impacts on the ERCOT Grid ERCOT Public
10
6 Determining Critical Inertia
Note that Critical Inertia is not a defined term in ERCOT Nodal Protocols; rather, it is being defined and referenced for the purposes of this paper.
Following a resource trip the initial RoCoF immediately after the event is a function of the inertia of the synchronous machines that are on-line and the magnitude of generation loss. Load Resources with high-set under-frequency relays (UFRs) providing Responsive Reserve Service (RRS) respond in about 0.416 seconds (or 25 cycles) after the frequency drops below their frequency set point.7 ERCOT has defined Critical Inertia as the minimum inertia level at which a system can be reliably operated with current frequency control practices. If the system inertia is below the Critical Inertia level, frequency response from Load Resources may not have sufficient time to deploy and aid in arresting system frequency decay before it reaches the first-stage Under-Frequency Load Shed (UFLS) trigger level, which is 59.3 Hz in ERCOT. Thus, for ERCOT, Critical Inertia is the inertia level at which, for a generation loss of 2,750 MW (the two largest units in the system), frequency would take 0.416 seconds to decline from 59.7 Hz to 59.3 Hz. Figure 7 below illustrates the concept by showing a frequency response after the loss of 2,750 MW during a period of particularly low system inertia. In this case, it takes less than 0.416 seconds, denoted as Tf , for system frequency to decrease from 59.7 Hz to 59.3 Hz; thus, UFLS would be triggered before any frequency response mechanism has time to trigger.
Figure 7: Frequency Response after loss of 2,750 MW and time it takes for frequency to reach 59.3 Hz
7 Pursuant to ERCOT Nodal Operating Guides Section 2.3.1.2 (6), Load Resources’ under-frequency relays must be set no low er than 59.7 Hz. Some RRS participants choose higher thresholds.
Critical Inertia is the minimum level of system inertia that is necessary to ensure ERCOT’s fast frequency responsive resources can be effectively deployed before frequency drops below 59.3 Hz following the simultaneous loss of 2750 MW.

Inertia: Basic Concepts and Impacts on the ERCOT Grid ERCOT Public
11
ERCOT has conducted a series of dynamic simulations for the cases with inertia conditions ranging from 108 GW*s to 376 GW*s to investigate the time the frequency takes to decrease from 59.7 Hz to 59.3 Hz when there is 1,150 MW of primary frequency response from generation and no response from Load Resources. Figure 8 shows the corresponding frequency response in each of these studies. Figure 9 summarizes the observed time for frequency to decrease from 59.7 Hz to 59.3 Hz in each of these simulations.
Figure 8: Frequency Response after loss of 2,750 MW for 13 cases with different inertia levels

Inertia: Basic Concepts and Impacts on the ERCOT Grid ERCOT Public
12
Figure 9: Time for the frequency to decrease from 59.7 Hz to 59.3 Hz from 13 inertia cases and trend line A regression curve approximation 𝑇𝑇𝑓𝑓 = 3 ∙ 10−5 ∙ 𝐼𝐼𝐼𝐼𝐼𝐼𝐼𝐼𝐼𝐼𝐼𝐼𝐼𝐼2+ 0.0016 ∙ 𝐼𝐼𝐼𝐼𝐼𝐼𝐼𝐼𝐼𝐼𝐼𝐼𝐼𝐼+ 0.0048 can be used to estimate the relationship between the time for the frequency to decrease from 59.7 Hz to 59.3 Hz and inertia. Using the relationship, Critical Inertia was found to be 94 GW*s when Tf is 0.416 sec.
Based on this analysis, and with a safety margin, ERCOT has identified its Critical Inertia to be 100 GW*s. Operating the grid reliably below this inertia level would require changes to ERCOT’s current operating practices. The lowest inertia experienced in ERCOT to date is 130 GW*s on October 27, 2017. Section 7 provides insights into the approach ERCOT will use to maintain Critical Inertia in Real-Time operations and Section 9 discusses approaches that can be utilized to reduce ERCOT’s Critical Inertia System Operating Limit. 7 Monitoring and Maintaining Critical Inertia Continuous growth of non-synchronous generation as well as retirements of traditional thermal generation resources bring more uncertainties to grid operations and a greater need to monitor system inertia in real-time. Monitoring synchronous inertia and frequency deviation after the largest category C (N‐2) event (2750 MW in ERCOT) was recommended Measures from NERC Essential Reliability Services Working Group (ERSWG)8. These Measures have been passed on
8 The ERSWG has a multi-faceted purpose that includes developing a technical foundation of ERS; educating and informing industry, regulators, and the public about ERS; developing an approach for tracking and trending ERS; formulating recommendations to ensure the complete suite of ERS is provided and available. The ERSWG reconciled a collection of analytical approaches and Measures for understanding potential reliability impacts as a result of increasing variable resources and how those impacts can affect system configuration, composition, operation and the need for increased ERS.
Inertia: Basic Concepts and Impacts on the ERCOT Grid ERCOT Public
13
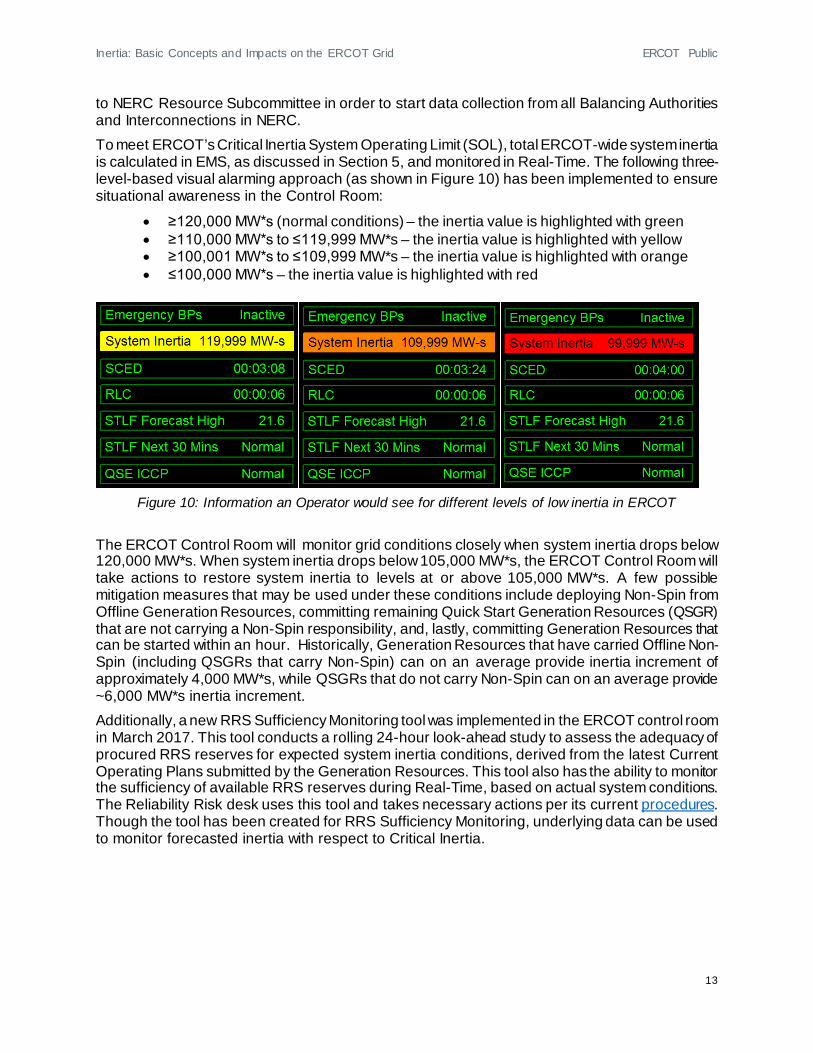
to NERC Resource Subcommittee in order to start data collection from all Balancing Authorities and Interconnections in NERC. To meet ERCOT’s Critical Inertia System Operating Limit (SOL), total ERCOT-wide system inertia is calculated in EMS, as discussed in Section 5, and monitored in Real-Time. The following three-level-based visual alarming approach (as shown in Figure 10) has been implemented to ensure situational awareness in the Control Room:
• ≥120,000 MW*s (normal conditions) – the inertia value is highlighted with green • ≥110,000 MW*s to ≤119,999 MW*s – the inertia value is highlighted with yellow • ≥100,001 MW*s to ≤109,999 MW*s – the inertia value is highlighted with orange • ≤100,000 MW*s – the inertia value is highlighted with red
Figure 10: Information an Operator would see for different levels of low inertia in ERCOT
The ERCOT Control Room will monitor grid conditions closely when system inertia drops below 120,000 MW*s. When system inertia drops below 105,000 MW*s, the ERCOT Control Room will take actions to restore system inertia to levels at or above 105,000 MW*s. A few possible mitigation measures that may be used under these conditions include deploying Non-Spin from Offline Generation Resources, committing remaining Quick Start Generation Resources (QSGR) that are not carrying a Non-Spin responsibility, and, lastly, committing Generation Resources that can be started within an hour. Historically, Generation Resources that have carried Offline Non-Spin (including QSGRs that carry Non-Spin) can on an average provide inertia increment of approximately 4,000 MW*s, while QSGRs that do not carry Non-Spin can on an average provide ~6,000 MW*s inertia increment. Additionally, a new RRS Sufficiency Monitoring tool was implemented in the ERCOT control room in March 2017. This tool conducts a rolling 24-hour look-ahead study to assess the adequacy of procured RRS reserves for expected system inertia conditions, derived from the latest Current Operating Plans submitted by the Generation Resources. This tool also has the ability to monitor the sufficiency of available RRS reserves during Real-Time, based on actual system conditions. The Reliability Risk desk uses this tool and takes necessary actions per its current procedures. Though the tool has been created for RRS Sufficiency Monitoring, underlying data can be used to monitor forecasted inertia with respect to Critical Inertia.

Inertia: Basic Concepts and Impacts on the ERCOT Grid ERCOT Public
14
8 Analysis of Future Base-Level System Inertia ERCOT has conducted an assessment of system inertia that can be expected in the future under conditions where the absolute minimal amount of conventional generation is considered on-line. For this assessment, the following baseline assumptions were used based on historic data from 2013 through 2017, as illustrated in Figure 11:
• At least two nuclear units are on-line at all times with 12 GW*s of inertia. • There is a minimum requirement for Responsive Reserve Service from generation. The
minimum inertia of generation units providing RRS in the past five years was 24 GW*s. Considering only the five lowest inertia instances, this number was 32 GW*s, as seen in Table 3.
• The minimum inertia from generation at Private Use Networks was 32 GW*s in the past five years. Using the five lowest inertia instances, this number was 40 GW*s, as seen in Table 4.
• About 300 MW was also reserved for Regulation (based on 2017 Regulation requirements at night time between January and April). However, it is possible that Regulation is carried by the same units that carry RRS and, therefore, Regulation requirements may not result in additional generation being committed.
The above considerations lead to a minimum inertia that is always on-line of about 12+24+32=68 GW*s. Assuming that trends from the five low inertia instances prevail, the minimum inertia that is always on-line could be slightly higher: 12+32+40=84 GW*s.
Figure 11: Base-level inertia based on historic data 2013-2017
Table 3: Inertia contribution from resources carrying RRSs during lowest inertia days in 2013-
2017 Date of inertia min Inertia of all units carrying RRS Inertia of non-PUN units carrying RRS
10/27/17 4:00 48,341 41,042 2/10/17 2:00 53,533 42,364 4/10/16 2:00 46,596 43,438
11/25/15 2:00 57,837 50,335 3/30/14 3:00 51,318 43,495 3/10/13 3:00 42,837 31,928

Inertia: Basic Concepts and Impacts on the ERCOT Grid ERCOT Public
15
Table 4: Inertia contribution from PUNs during lowest inertia days in 2013-2017
Date of inertia min Total PUN inertia % of total system inertia 10/27/17 4:00 39,920 31% 2/10/17 2:00 43,650 32% 4/10/16 2:00 42,690 30%
11/25/15 2:00 48,521 32% 3/30/14 3:00 40,779 30% 3/10/13 3:00 40,347 30%
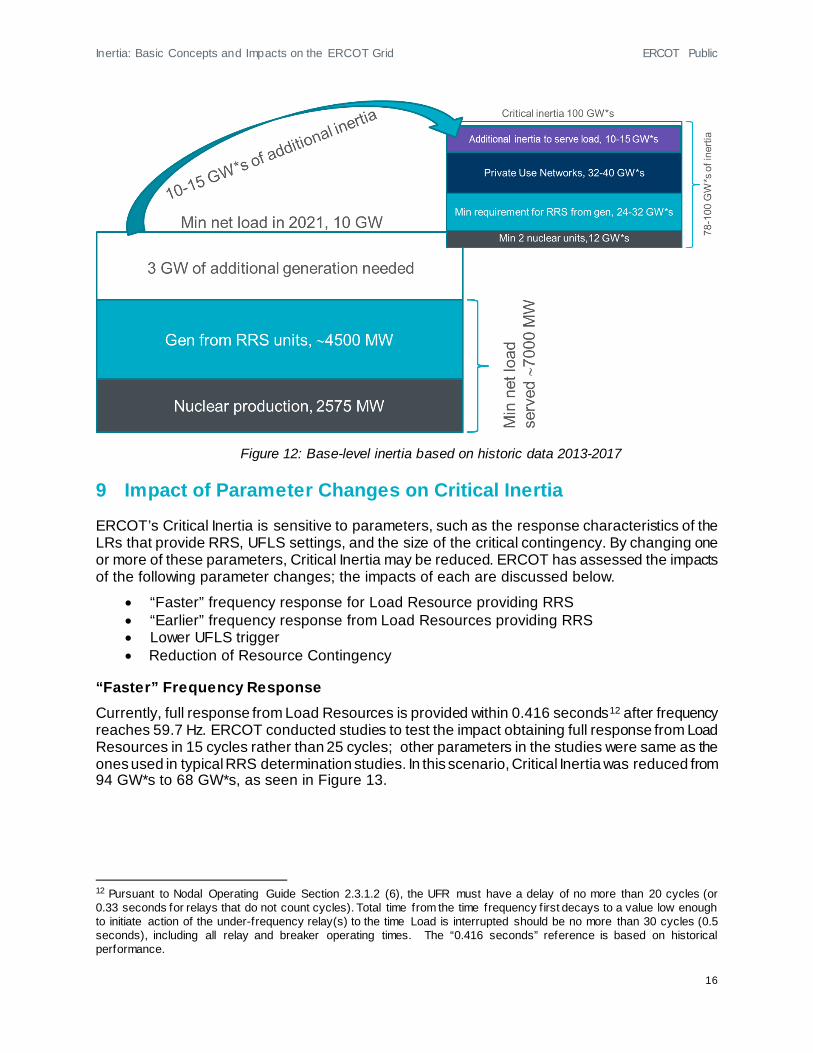
Next step is to understand how much load can be supplied by generation that is always on-line. Currently, 1,400 MW of RRS is required to be provided by conventional generation (based on 2017 RRS requirements at night time during the months of January through April)9. On average about 200 MW10 of this is provided by hydro units. Non-hydro resources cannot offer more than 20% of their generator capacity towards RRS. Due to this limitation, 1,200 MW of RRS will be distributed over a number of on-line units with a total capacity of at least 1,200/0.2=6,000 MW. With 1,200 MW reserved for RRS and 300 MW reserved for Regulation, this on-line generation can potentially serve 4,500 MW of load. With two nuclear units producing 2,575 MW combined, about 7,000 MW of net load can be supplied by generation that is already on-line for the provision of RRS and Regulation, as well as nuclear generation. Any additional net load above 7,000 MW will require additional conventional generation to be committed. ERCOT currently estimates there will be about 24 GW11 of installed wind capacity by the end of 2020. Based on this projection, future wind profiles, and the long-term load forecast, the minimum net load in 2021 is estimated to be around 10.5 GW. Net load is evaluated only for the days in shoulder seasons, when wind generation is consistently high throughout the day and produces above 50% of installed capacity all day long. During these days, it is likely there will be low system inertia at night. This net load of 10.5 GW would require at least additional 3 GW of conventional generation to be brought on-line.
If this additional load was served entirely by Combined Cycle (CC) units, the additional inertia from the units would be about 15 GW*s. If the load was served by coal units, the additional inertia would instead be around 10 GW*s, as shown in Figure 12. However, coal units are not as flexible as CCs and require longer start-up times; therefore, an excess of coal units would likely need to be committed and on-line during overnight hours to be able to serve the morning net load ramp. Summarizing the analysis above, with 24 GW of installed wind generation by the end of 2020, ERCOT can expect synchronous inertia to be from 78 GW*s (68+10=78) to 100 (85+15=100) GW*s during high wind and low load conditions. It should be noted that this analysis is based on conservative assumptions and is subject to uncertainties such as changes in PUN behavior or changes in the mix of Resources providing RRS. ERCOT therefore will continue detailed inertia trending and analysis in the future.
9 RRS portion provided by generation may change in the future with implementation of Nodal Protocols Revision Request 815 (NPRR815) that increased Load Resource participation l imit up to 60% of total RRS requirement (previously the l imit was 50%). 10 Based on 2016 data. 11 Based on ERCOT’s Generation Interconnection Summary (GIS) for June 2017.
Inertia: Basic Concepts and Impacts on the ERCOT Grid ERCOT Public
16
Figure 12: Base-level inertia based on historic data 2013-2017
9 Impact of Parameter Changes on Critical Inertia ERCOT’s Critical Inertia is sensitive to parameters, such as the response characteristics of the LRs that provide RRS, UFLS settings, and the size of the critical contingency. By changing one or more of these parameters, Critical Inertia may be reduced. ERCOT has assessed the impacts of the following parameter changes; the impacts of each are discussed below.
• “Faster” frequency response for Load Resource providing RRS • “Earlier” frequency response from Load Resources providing RRS • Lower UFLS trigger • Reduction of Resource Contingency
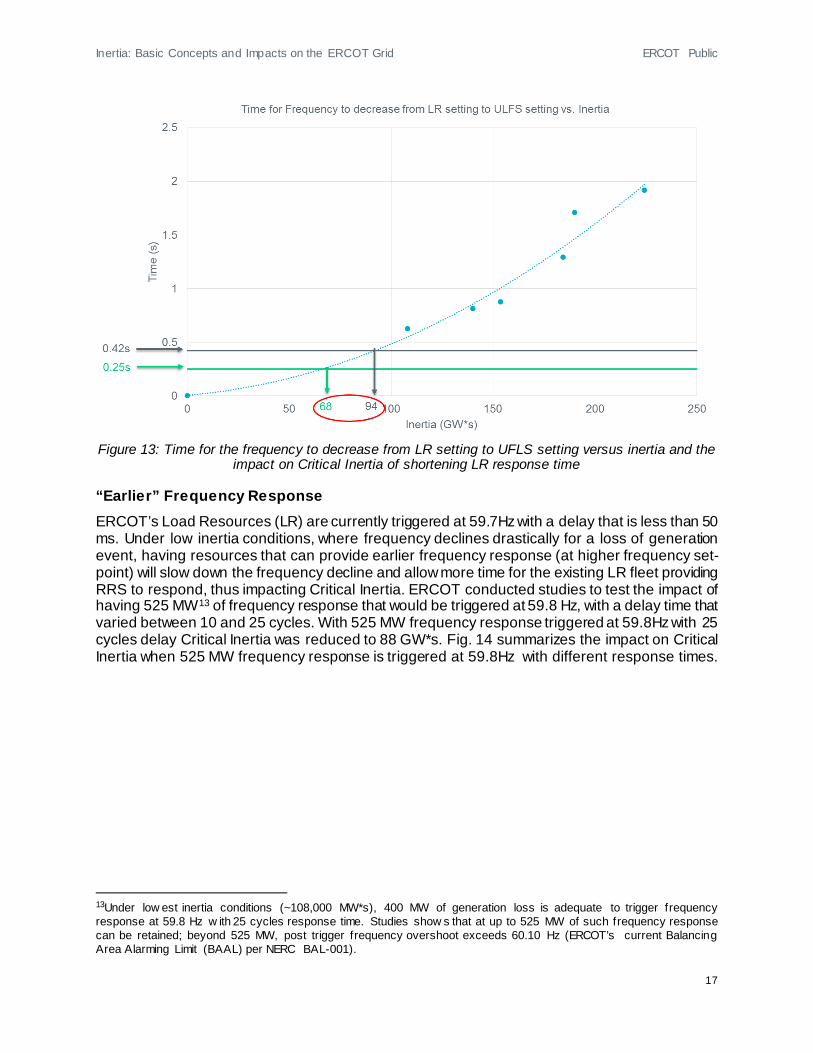
“Faster” Frequency Response Currently, full response from Load Resources is provided within 0.416 seconds12 after frequency reaches 59.7 Hz. ERCOT conducted studies to test the impact obtaining full response from Load Resources in 15 cycles rather than 25 cycles; other parameters in the studies were same as the ones used in typical RRS determination studies. In this scenario, Critical Inertia was reduced from 94 GW*s to 68 GW*s, as seen in Figure 13.
12 Pursuant to Nodal Operating Guide Section 2.3.1.2 (6), the UFR must have a delay of no more than 20 cycles (or 0.33 seconds for relays that do not count cycles). Total time from the time frequency f irst decays to a value low enough to initiate action of the under-frequency relay(s) to the time Load is interrupted should be no more than 30 cycles (0.5 seconds), including all relay and breaker operating times. The “0.416 seconds” reference is based on historical performance.
Inertia: Basic Concepts and Impacts on the ERCOT Grid ERCOT Public
17
Figure 13: Time for the frequency to decrease from LR setting to UFLS setting versus inertia and the
impact on Critical Inertia of shortening LR response time
“Earlier” Frequency Response ERCOT’s Load Resources (LR) are currently triggered at 59.7Hz with a delay that is less than 50 ms. Under low inertia conditions, where frequency declines drastically for a loss of generation event, having resources that can provide earlier frequency response (at higher frequency set-point) will slow down the frequency decline and allow more time for the existing LR fleet providing RRS to respond, thus impacting Critical Inertia. ERCOT conducted studies to test the impact of having 525 MW13 of frequency response that would be triggered at 59.8 Hz, with a delay time that varied between 10 and 25 cycles. With 525 MW frequency response triggered at 59.8Hz with 25 cycles delay Critical Inertia was reduced to 88 GW*s. Fig. 14 summarizes the impact on Critical Inertia when 525 MW frequency response is triggered at 59.8Hz with different response times.
13Under low est inertia conditions (~108,000 MW*s), 400 MW of generation loss is adequate to trigger frequency response at 59.8 Hz w ith 25 cycles response time. Studies show s that at up to 525 MW of such frequency response can be retained; beyond 525 MW, post trigger frequency overshoot exceeds 60.10 Hz (ERCOT’s current Balancing Area Alarming Limit (BAAL) per NERC BAL-001).

Inertia: Basic Concepts and Impacts on the ERCOT Grid ERCOT Public
18
Figure 14: Critical Inertia w/ FFR (different response time)
Lower UFLS Settings ERCOT Nodal Operating Guides Section 2.6.1 prescribes Transmission Service Providers’ responsibilities for providing ERCOT’s UFLS. Under current rules, 5% of the Load on the ERCOT System would be shed if frequency reaches 59.3 Hz; an additional 10% of the System would shed at 58.9 Hz; and an additional 10% would be shed at 58.5 Hz. ERCOT conducted studies to investigate the impact from changing the first stage of UFLS from 59.3 Hz to 59.1 Hz. In this scenario, as can be seen in Figure 15, Critical Inertia reduces from 94 GW*s to 71 GW*s.
Figure 15: Time for the frequency to decrease from LR setting to UFLS setting vs Inertia and impact on
Critical Inertia from lowering UFLS trigger from 59.3 Hz to 59.1 Hz

Inertia: Basic Concepts and Impacts on the ERCOT Grid ERCOT Public
19
Table 5 summarizes the impacts of lowering the UFLS trigger and/or shortening the response time for Load Resources providing RRS on Critical Inertia.
Table 5: Impact on Critical Inertia from lowering UFLS trigger and/or shortening response times for LR
UFLS @59.3Hz UFLS @59.1Hz
0.42s LR Response Time 94 GW*s 71 GW*s
0.25s LR Response Time 68 GW*s 52 GW*s
Reduction of largest possible loss of generation The Resource Contingency Criteria (RCC) for ERCOT, as defined in the NERC BAL-003 standard, is the simultaneous loss of the two largest units on the system, currently the two South Texas Nuclear Project units totaling 2,750 MW.
ERCOT has conducted sensitivity studies to assess the impact of changing the RCC on Critical Inertia. Figure 16 illustrates the function of Critical Inertia as under various generation loss scenarios. It is recognized that further discussions will be needed to assess the feasibility of modifying the Resource Contingency Criteria.
Figure 16: Critical Inertia at Resource Contingencies of different sizes from 2,000 to 2,750 MW

Inertia: Basic Concepts and Impacts on the ERCOT Grid ERCOT Public
20
10 International Review of Inertia Related Challenges and Mitigation Measures
Other bulk power systems in the world are experiencing challenges associated with changes in their resource mix that are similar to ERCOT’s. Table 6 lists some relevant parameters of the systems currently facing low inertia issues. Note that the Hydro Quebec and Nordic (Sweden, Norway, Finland, and part of Denmark) systems do not have particularly high capacity from non-synchronous generation (wind and solar). However, these systems are notable for having large amounts of hydroelectric generation, which means that inertia is relatively low (see Table 1) and primary frequency response is relatively slow. The size of the system’s RCC with respect to the system size (i.e., minimum inertia level) is also an important factor, which indicates that the South Australia system is at the forefront of this problem at the moment.
Table 6: Countries experiencing low inertia challenges System Ireland UK Nordic Quebec South
Australia Peak Demand, GW
6.4 53 70 39 3
Capacity from Wind and Solar
4 GW >26 GW 10% 7% 35%
Minimum Inertia, GW*s
20 135 125 60 2
Resource Contingency Criteria, MW
500 1000 1450 1700 650
Issues
Lack of synchronizing torque, at RoCoF ≥0.5 Hz/s significant amounts of non-synchronous generation will trip14
At RoCoF of 0.125 Hz/s some non-synchronous generation will trip; at 1 Hz/s all non-synchronous generation will trip
Slow PFR (hydro), time to UFLS is a concern
Low inertia (hydro), high RCC, slow PFR (hydro), time to UFLS is a concern
High (1-3 Hz/s) RoCoF after RCC, at which synchronous generation may trip and UFLS may malfunction
14 Early on the UK and Ireland enforced the use of loss of mains protection at non-synchronous generation plants in their distribution netw orks. The protection w ould trip w ind or solar generation once a particular RoCoF w as detected (0.125 Hz/s in the UK and 0.5 Hz/s in Ireland). This is because high RoCoF w as historically used as an indication of an island forming in the distribution grid. As these systems saw more non-synchronous generation installed, system inertia declined and system-w ide RoCoF increased after a large generation loss to a point w here 0.125 Hz/s (or 0.5 Hz/s in Ireland) RoCoF w as no longer exclusively an indicator of an island in a distribution system. With RoCoF protection still in place at non-synchronous generation plants, this may potentially trip large amounts of non-synchronous generation, further w orsening the conditions on already perturbed system. The UK system has increased the trigger on loss of mains protection from 0.125 Hz/s to 1 Hz/s for all resources installed after April 2014.

Inertia: Basic Concepts and Impacts on the ERCOT Grid ERCOT Public
21
Table 7 lists different measures used by these systems to reduce Critical Inertia and/or keep inertia above critical levels. All of the systems monitor both inertia and the largest possible contingency in Real-Time. Ireland and the UK additionally forecast inertia from the Day-Ahead into Real-Time, similarly to ERCOT, as described in Section 7 above.
Table 7: Mitigation measures to reduce Critical Inertia and to keep inertia above critical level Ireland UK Nordic Quebec South Australia ERCOT Monitor inertia & possible contingencies in Real-Time
✓ ✓ ✓ ✓ ✓ ✓
Forecasts Inertia from DA into Real-Time ✓ ✓ ✓ Dynamic Assessment of Reserves based on inertia conditions and largest resource contingency
✓ ✓
Limit RCC based on inertia conditions ✓ ✓ ✓ ✓
Synchronous Condensers (for inertia)
✓ ✓ ✓ (particularly looking at high
inertia SCs)
Enforce minimum inertia limit ✓ ✓ ✓ (for minimum
inertia req.) ✓
Inertia market/auction/service inertia
✓ ✓ (for above
minimum inertia levels)
Faster Responding Reserves
FFR
Enhanced Frequency Response
Service
Synthetic inertia
from wind
“Contingency” FFR (frequency
trigger) and “Emergency”
FFR (direct event detection)
Load Resources providing RRS
Note: Planned mitigation measures are shown in blue, while already-existing mitigation measures are shown in black.

Inertia: Basic Concepts and Impacts on the ERCOT Grid ERCOT Public
22
Synthetic inertia provision from wind generation, listed in Table 7 under fast-responding reserves for Hydro Quebec, is a capability that is enabled on Type 3 and Type 4 wind generation resources15. In this construct, when a wind turbine plant controller senses a drop in system frequency, it extracts kinetic energy from the rotating mass of the wind turbine — hence the term “synthetic inertia” — which is seen from the grid as an increase in active power injection. Following initial active power injections, there is a recovery phase in which active power production from a wind turbine may decrease to below pre-disturbance level. In some scenarios the recovery phase may have an adverse impact on system frequency recovery. The effectiveness of the response and the recovery of the wind generation resource to its pre-disturbance state depends on the operating conditions of a wind generation resource. Therefore, this type of fast frequency response requires careful, centralized coordination to ensure reliable system operation. While synthetic inertial response capability is already included as a part of interconnection requirements in Hydro Quebec, this technique has not yet been commercially implemented at a large scale. 11 Conclusions and Summary This paper presents basic concepts about synchronous inertia, examines the impacts of diminishing inertia on the ERCOT grid, and tracks historic trends, current monitoring tools, and options for maintaining inertia above the critical level. The intent is to demonstrate how changes to various frequency control parameters — such as shortening the time allowed for frequency response, raising the frequency response trigger point, lowering UFLS settings, and decreasing the size of largest contingency — can lower and thus improve the critical inertia level. The international review has shown that some of these measures are being implemented in other systems with characteristics similar to the ERCOT grid. Other systems are beginning to address low inertia challenges through emerging technologies, including the use of synthetic inertia capability from wind generation resources and installing high inertia synchronous condensers. Each of these mitigation measures is likely to have its own pros and cons, which will be analyzed in future studies and analyses along with exploring ideas of creating a market for inertial response, possibly similar to the 2015 proposed outline. ERCOT will continue working with its stakeholders to develop reliable, efficient, and, where possible, market-based solutions to address low inertia issues. 12 References Eto, Joseph H. "Use of frequency response metrics to assess the planning and operating requirements for reliable integration of variable renewable generation." Lawrence Berkeley National Laboratory (2011). Essential Reliability Services Task Force (ERSTF) and Essential Reliability Services Working Group, NERC, 2014-2016. Prabha Kundur, Power Systems Stability and Control, McGraw Hill, 1993. ENSTO-E Report, “Future System Inertia”, project report by Nordic Transmission System Operators.
15 Type 3 refers to variable speed w ind generator w ith partial-scale frequency converter. Type 4 refers to variable speed w ind generator w ith full-scale frequency converter. For additional information about various w ind turbine types see for example http://w w w .site.uottaw a.ca/~rhabash/ELG4126WindGenerators.pdf
Inertia: Basic Concepts and Impacts on the ERCOT Grid ERCOT Public
23
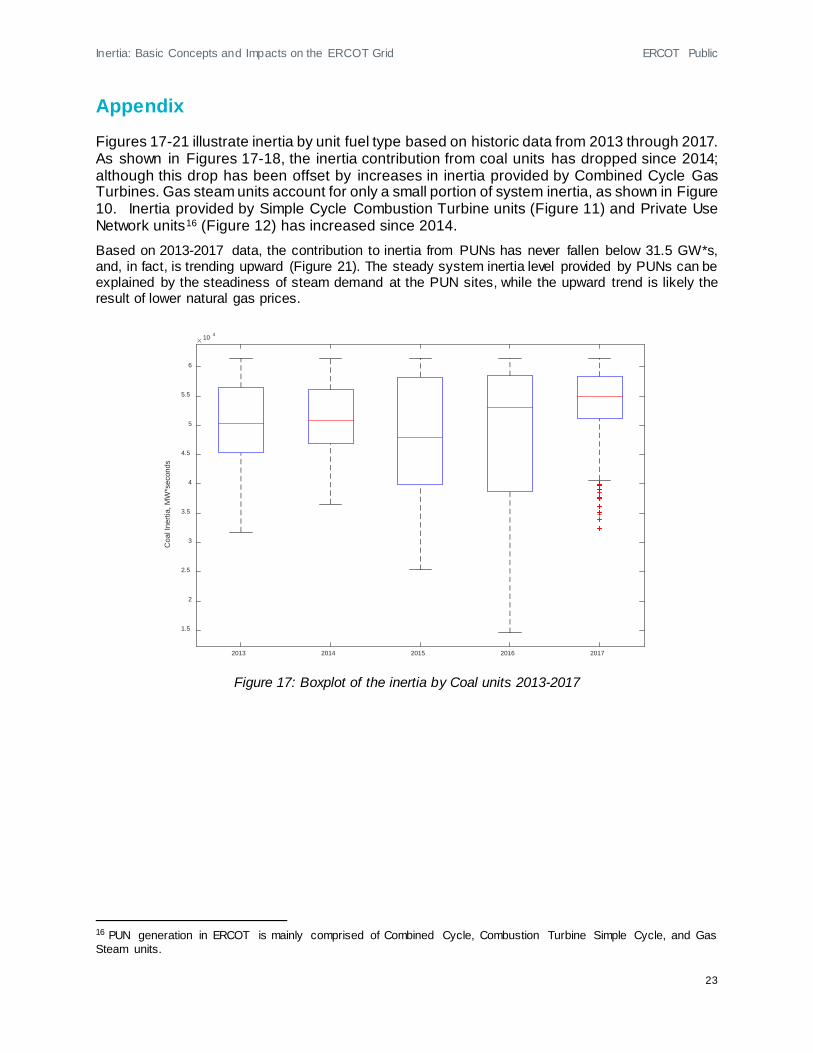
Appendix Figures 17-21 illustrate inertia by unit fuel type based on historic data from 2013 through 2017. As shown in Figures 17-18, the inertia contribution from coal units has dropped since 2014; although this drop has been offset by increases in inertia provided by Combined Cycle Gas Turbines. Gas steam units account for only a small portion of system inertia, as shown in Figure 10. Inertia provided by Simple Cycle Combustion Turbine units (Figure 11) and Private Use Network units16 (Figure 12) has increased since 2014. Based on 2013-2017 data, the contribution to inertia from PUNs has never fallen below 31.5 GW*s, and, in fact, is trending upward (Figure 21). The steady system inertia level provided by PUNs can be explained by the steadiness of steam demand at the PUN sites, while the upward trend is likely the result of lower natural gas prices.
Figure 17: Boxplot of the inertia by Coal units 2013-2017
16 PUN generation in ERCOT is mainly comprised of Combined Cycle, Combustion Turbine Simple Cycle, and Gas Steam units.
2013 2014 2015 2016 2017
Coa
l Ine
rtia,
MW
*sec
onds
10 4
1.5
2
2.5
3
3.5
4
4.5
5
5.5
6

Inertia: Basic Concepts and Impacts on the ERCOT Grid ERCOT Public
24
Figure 18: Boxplot of the inertia by Combined Cycle units 2013-2017
Figure 19: Boxplot of the inertia by Gas Steam units 2013-2017
2013 2014 2015 2016 2017
Com
bine
d C
ycle
Iner
tia, M
W*s
econ
ds
10 5
0.4
0.6
0.8
1
1.2
1.4
1.6
1.8
2
2.2
2.4
2013 2014 2015 2016 2017
Gas
Ste
am In
ertia
, MW
*sec
onds
10 4
0
0.5
1
1.5
2
2.5
3
3.5
4
4.5

Inertia: Basic Concepts and Impacts on the ERCOT Grid ERCOT Public
25
Figure 20: Boxplot of the inertia by Combustion Turbines (Simple Cycle) 2013-2017
Figure 21: Boxplot of the inertia from PUNs 2013-2017
2013 2014 2015 2016 2017
Com
bust
ion
Turb
ine
Iner
tia
10 4
1
1.5
2
2.5
3
3.5
4
4.5
2013 2014 2015 2016 2017
PU
N In
ertia
, MW
*sec
onds
10 4
3.5
4
4.5
5
5.5