Inequality in Africa 4 - World Bankdocuments.worldbank.org/curated/en/... · INEQUALITY IN AFRICA...
29
117 4 Inequality in Africa I nequality in Africa is complex. Of the 10 most unequal countries in the world, 7 are in Africa. But African countries other than these seven do not have higher inequal- ity than developing countries elsewhere in the world. For the region as a whole, however, inequality is high, because of the wide varia- tion in income across countries. As a comple- ment to the description of poverty, freedoms, and capabilities in the previous two chapters, this chapter profiles inequality in Africa, describing it in terms of consumption inequal- ity (including from the perspective of extreme wealth) as well as inequality of opportunity. An important distinction is between inequality of outcomes (such as income, consumption, and wealth) and inequality of opportunity. In the case of the latter, in many settings, circumstances over which a per- son has little control—mother’s education, father’s occupation, birth in a rural area or into a particular ethnic group—may largely dictate one’s future. Being born poor often means being the beneficiary of less invest- ment in human development, which deter- mines future living standards. Being born poor can also influence one’s aspirations. Hoff (2012) describes how aspirations can be affected if inequality is entrenched. The expectation of having no chance of obtaining wealth or the feeling that the cards are stacked against one can yield precisely these outcomes, for example. This lack of a level playing field—the structural or ex ante component of inequality—is usually perceived to be unfair. Cultures around the world value fairness—so much that in some cases people make seemingly irrational deci- sions (that is, decisions that do not serve their self-interest) to punish others who behave unfairly (World Bank 2005). Inequality in outcomes—the gap between the poorest and the richest—depends not only on opportunities but also on effort and the degree to which individuals take risks. Rewarding people for effort or risk taking can incentivize and motivate them. From this perspective, not all aspects of inequal- ity are necessarily bad, although high levels of inequality can impose large socioeconomic costs on society. Inequality can influence the ability of communities to coordinate and provide social services and public goods. 1 It can also induce conflict, although the empirical evidence that substantial inequality leads to conflict or is the source of most conflict is mixed (Cramer 2005; Lichbach 1989). 2 Inequality influences how economic growth translates into poverty reduction, This chapter was written with Camila Galindo-Pardo.
Transcript of Inequality in Africa 4 - World Bankdocuments.worldbank.org/curated/en/... · INEQUALITY IN AFRICA...

117
4Inequality in Africa
Inequality in Africa is complex. Of the 10 most unequal countries in the world, 7 are in Africa. But African countries other
than these seven do not have higher inequal-ity than developing countries elsewhere in the world. For the region as a whole, however, inequality is high, because of the wide varia-tion in income across countries. As a comple-ment to the description of poverty, freedoms, and capabilities in the previous two chapters, this chapter profiles inequality in Africa, describing it in terms of consumption inequal-ity (including from the perspective of extreme wealth) as well as inequality of opportunity.
An important distinction is between inequality of outcomes (such as income, consumption, and wealth) and inequality of opportunity. In the case of the latter, in many settings, circumstances over which a per-son has little control—mother’s education, father’s occupation, birth in a rural area or into a particular ethnic group—may largely dictate one’s future. Being born poor often means being the beneficiary of less invest-ment in human development, which deter-mines future living standards.
Being born poor can also influence one’s aspirations. Hoff (2012) describes how aspirations can be affected if inequality is
entrenched. The expectation of having no chance of obtaining wealth or the feeling that the cards are stacked against one can yield precisely these outcomes, for example. This lack of a level playing field—the structural or ex ante component of inequality—is usually perceived to be unfair. Cultures around the world value fairness—so much that in some cases people make seemingly irrational deci-sions (that is, decisions that do not serve their self-interest) to punish others who behave unfairly (World Bank 2005).
Inequality in outcomes—the gap between the poorest and the richest—depends not only on opportunities but also on effort and the degree to which individuals take risks. Rewarding people for effort or risk taking can incentivize and motivate them. From this perspective, not all aspects of inequal-ity are necessarily bad, although high levels of inequality can impose large socioeconomic costs on society.
Inequality can influence the ability of communities to coordinate and provide social services and public goods.1 It can also induce conflict, although the empirical evidence that substantial inequality leads to conflict or is the source of most conflict is mixed (Cramer 2005; Lichbach 1989).2
Inequality influences how economic growth translates into poverty reduction, This chapter was written with Camila Galindo-Pardo.

118 P O V E R T Y I N A R I S I N G A F R I C A
and it may affect growth prospects. With respect to poverty reduction, when ini-tial inequality is higher, a larger share of poor households will have incomes farther below the poverty line, so that growth (the increase in income) will result in less pov-erty reduction (Bourguignon 2004; Klasen 2004; Ravallion 2001). Tentative evidence also suggests that inequality leads to lower and less durable sustainable growth pro-cesses and thus less poverty reduction (Berg, Ostry, and Zettelmeyer 2012; OECD 2015) if, for example, wealth is used to engage in rent seeking and other distortionary eco-nomic behaviors (Stiglitz 2012). The path-way by which inequality evolves thus matters for growth. Marrero and Rodriguez (2013) find a robust negative relationship between growth and inequality of opportunity in the United States. Ferreira and others (2014) find suggestive evidence of a negative association between inequality and growth but conclude that the data do not show a robust negative association between inequality of opportu-nity and growth. Other studies conclude that as countries reach higher levels of develop-ment, greater emphasis should be given to reducing inequality over spurring growth to reduce poverty (Olinto, Lara Ibarra, and Saavedra-Chanduvi 2014). For high- inequality, low-income countries, then, there is tension between a focus on growth and an emphasis on addressing inequality
On the basis of the growing body of lit-erature on the effects of initial and chang-ing inequality on growth and poverty, some observers argue that reducing inequality should be an explicit development goal (Shep-herd and others 2014). For the few African countries for which there is evidence, this notion seems to resonate with policy mak-ers. In its survey of 15 developing countries (in Africa, this included Cameroon, Malawi, Nigeria, and South Africa), the United Nations Development Programme (UNDP 2014) finds that 77 percent of policy mak-ers perceive the current level of inequality as a threat to long-term national development. Only 10 percent consider inequality condu-cive to long-term development.
Perceptions of Inequality
Several survey efforts capture the perceptions and attitudes of citizens toward inequality. The picture that emerges is not clear, in part because the survey questions differ.3
The World Values Survey asks respon-dents if more or less inequality is needed in their country. Its results reveal polarization: in some countries, more than 20 percent of respondents indicate that more inequality is needed and more than 20 percent indi-cate that less inequality is needed. Figure 4.1 shows the results for four countries; the results are similar for the seven other African countries covered by the World Values Sur-vey, and the pattern does not change mark-edly between country survey rounds. These results are consistent with the point made in World Development Report 2006: Equity and Development (World Bank 2005) that, contrary to preconceived notions, citizens do not by and large view inequality negatively. The share of the population in the African countries that indicated that income should be more equal was just 21 percent—lower than the 28 percent for all countries included in the World Value Survey.
Afrobarometer surveys find that among a list of more than 30 possible responses, respondents rarely cite inequality as one of the most important problems facing their countries. In these surveys, poverty and employment are the primary concerns of respondents in most countries. In the major-ity of the 30 African countries surveyed in the Gallup Poll (2013), most respondents report that individuals can get ahead by working hard.
In contrast, in the Pew Global Attitudes Survey, 70–81 percent of respondents in the six African countries covered agreed that inequality is a major problem in their coun-try (Pew Research Center 2013). Similarly, Afrobarometer surveys show that most Afri-cans respond that their government is doing quite or very badly at narrowing the income gap between the rich and poor. These sen-timents do not correlate with the level of inequality in the country (figure 4.2).

I N E Q U A L I T Y I N A F R I C A 119
FIGURE 4.1 Views on inequality differ within and across countries
Source: World Values Surveys of Ghana (2012), Nigeria (2011), Rwanda (2012), and Zimbabwe (2012). Note: 1 = “Incomes should be made more equal,” 10 = “We need larger income differences as incentives for individual effort.”
0
5
10
15
20
25 a. Ghana
0
5
10
15
20
25 b. Nigeria
0
5
10
15
20
25 c. Rwanda
0
5
10
15
20
25 d. Zimbabwe
Needmoreequality
Needless
equality
Needmoreequality
Needless
equality
Needmoreequality
Needless
equality
Needmoreequality
Needless
equality
1 2 3 4 5 6 7 8 9 101 2 3 4 5 6 7 8 9 10
1 2 3 4 5 6 7 8 9 101 2 3 4 5 6 7 8 9 10
Perc
ent o
f res
pon
dent
sPe
rcen
t of r
esp
onde
nts
Perc
ent o
f res
pon
dent
sPe
rcen
t of r
esp
onde
nts
FIGURE 4.2 Survey respondents’ perceptions of the adequacy of their government’s efforts to narrow the income gap differ across countries
0
0.1
0.2
0.3
0.4
0.5
0.6
0.7
0.8
0.9
1.0
Malawi
Botswana
Lesoth
o
Sierra Leone
Mozambique
Cabo Verde
Zambia
Mauritius
Ghana
Burkina Faso
South Afri
ca
Swaziland
Guinea
Cameroon
Zimbabwe
Niger
SenegalMali
Benin
Namibia
Burundi
Togo
Côte d’Ivoire
Liberia
Uganda
Tanzania
Madagascar
Kenya
Nigeria
Gin
i ind
ex
0
10
20
30
40
50
60
70
80
90
100
Perc
ent o
f res
pond
ents
Sources: Survey responses: Afrobarometer, Round 5 (2011–13). Gini index: World Bank Africa Poverty database. Note: Blue bars show the share of the population that perceives that the government is not doing enough to narrow the income gap (right axis). Orange diamonds are Gini indexes (left axis).

120 P O V E R T Y I N A R I S I N G A F R I C A
Measurement of Inequality
Like the poverty analysis in chapter 2, the analysis of inequality in this chapter is based on data on consumption from nationally representative household surveys. With few exceptions, the factors that make measuring poverty a challenge also complicate the mea-surement of inequality.4 Changes in the ques-tionnaire or the seasonal timing of fieldwork can distort apparent trends in inequality. To prevent this problem, the analysis presented in this chapter excludes surveys that are not comparable (as defined in chapter 1).5
Surveys in Africa measure inequal-ity based on consumption. Cross-regional comparisons typically ignore the differ-ence between income and consumption measures of inequality (as noted in the next section), but it is an important dis-tinction because consumption inequality is
typically lower than other monetary inequality measures.
This chapter focuses on inequality as mea-sured by the Gini index (box 4.1) in consump-tion per capita, the same metric used to assess poverty in chapter 2. Consumption is gener-ally regarded as easier to measure than income in low-income economies (Deaton and Zaidi 2002). Current consumption generally does not reveal the full extent of economic inequal-ity, however, because consumption does not capture savings and wealth.
Income and wealth inequality are alter-natives to consumption-based measures. In most economies, income-based measures of inequality are higher than consumption-based measures (Blundell, Pistaferri, and Preston 2008; Krueger and others 2010; Santaeulàlia-Llopis and Zheng 2015), and wealth inequality is typically higher than income inequality (Davies and others 2011;
The Gini index can be explained using the Lorenz curve, which plots the cumulative share of total con-sumption on the vertical axis against the cumulative proportion of the population on the horizontal axis, starting with the poorest individual or household (figure B4.1.1). If there is perfect equality, the bot-tom X percent of the population accounts for X per-cent of consumption (or earns X percent of income), and the Lorenz curve coincides with the diagonal. If there is some degree of inequality, the bottom X percent of the population accounts for less than X percent of consumption. The Lorenz curve bows outward; the farther it is from the diagonal line, the higher the degree of inequality. In the extreme case of perfect inequality, all consumption is con-centrated in the hands of the richest individual, and the Lorenz curve coincides with the line from 0 to X to Y. The Gini index reflects the area between the line of perfect equality (the diagonal) and the Lorenz curve (A), relative to the maximum area that would be attained under perfect inequality (A + B).
An alternative measure of inequality is the mean log deviation (MLD), also called Theil’s L index,
which is part of the generalized entropy class of inequality indexes (Cowell 2000). As in the Gini index, higher values of the MLD represent higher levels of inequality, but unlike the Gini index, the MLD is not bound by 1. The MLD shows the per-
BOX 4.1 A Primer on the Gini Index
FIGURE B4.1.1 The Lorenz curve illustrates the Gini measure of inequality
Line of equality(45 degree)
Lorenz curveof consumption(or income)
A
B
Y100%
Cumulative share of thepopulation, from poorest to richest
100%0
Cum
ulat
ive
shar
e of
cons
ump
tion
(or i
ncom
e)
X
(Box continues next page)

I N E Q U A L I T Y I N A F R I C A 121
Diaz-Gimenez, Glover, and Rios-Rull 2011; Piketty 2014; Rama and others 2015; for Africa, see de Magalhães and Santaeulàlia-Llopis 2015). Consumption and income are flow measures that relate to a specific period (for example, one year); wealth is a stock measure that reflects assets accumulated over a lifetime (through savings) and across gen-erations (through bequests).
Most household surveys in Africa lack detailed data on the value of household wealth. Taking advantage of the select few that include partial wealth data, de
Magalhães and Santaeulàlia-Llopis (2015) compare inequality in consumption, income, and wealth in Malawi, Tanzania, and Uganda. Their measure of wealth includes land, housing, livestock, agricultural equip-ment, and household durable goods, net of any debt (their data exclude housing in Tan-zania and debt in Uganda). Because finan-cial assets are not included, total wealth is understated, particularly among urban households.
Their results show the pattern observed in other regions. In Malawi wealth inequality
centage difference between the consumption of a randomly selected individual and the population’s average consumption. One attractive feature of the MLD is that it is sensitive to inequality among the poor. Another is that, unlike the Gini index, the MLD is decomposable: the contribution of inequal-ity across different groups and the contribution of the inequality within these groups can be calculated. Doing so helps unpack the nature of inequality, as done later in this chapter.
A third, more recent inequality measure is the Palma ratio, the ratio of the consumption share of the richest 10 percent of the population to the share of the poorest 40 percent of the distribution (Palma 2006, 2011). In its original formulation, the index
was expressed in terms of gross national income. It is an intuitive measure of inequality that highlights the large gaps in consumption often found between the rich and the poor.
Each of these measures has different properties and can produce different results. But cross-country rankings of inequality in Africa are not strongly affected by the measure of inequality used. Figure B4.1.2 plots country inequality rankings according to the MLD (panel a) and Palma (panel b) against the ranking based on the Gini index. In most cases, countries line up on the diagonal, which means that their rank position is unaffected by the measure used. These findings are similar to the finding by Cobham and Sumner (2013).
BOX 4.1 A Primer on the Gini Index (continued)
FIGURE B4.1.2 Different inequality measures reveal a similar story
0
0
10
10
20
20
30
30
40
40
50
50
0
10
20
30
40
50
Gin
i ind
ex ra
nk
Gin
i ind
ex ra
nk
0 10 20 30 40 50Palma ratio rankMean log derivation (MLD) rank
a. Rank of countries by Gini and mean log derivation (MLD)
b. Rank of countries by Gini and Palma
122 P O V E R T Y I N A R I S I N G A F R I C A
is almost twice as large as consumption inequality. In rural areas, the wealth Gini is 0.60, compared with 0.54 for income and 0.39 for consumption. In urban areas, these estimates are 0.84 for wealth, 0.71 for income, and 0.44 for consumption. A similar picture emerges in Tanzania and Uganda.
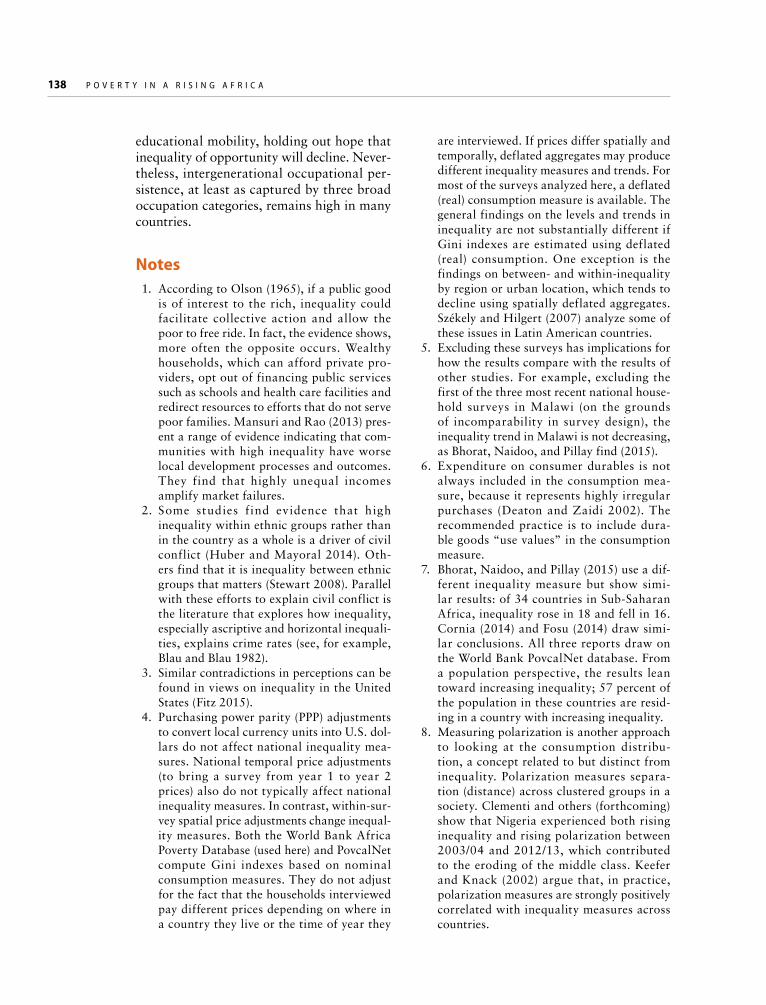
A second concern with consumption inequality is that, in practice, consump-tion inequality measures will be biased downward if the set of goods in the con-sumption measure does not include items consumed by the rich (luxury goods such as vacations as well as irregularly purchased consumer durable purchases such as cars). These goods are sometimes not included in surveys or are excluded from the measure of consumption if they are.6 Consump-tion surveys also struggle to include hard-to-survey populations, including both the extreme poor (who may live in remote areas or informal settlements) and the extreme rich (who may refuse to participate in sur-veys). Applying imputation methods for mismeasured income data and accounting for expatriates not included in surveys in Côte d’Ivoire and Madagascar significantly increase measured inequality, according to Guénard and Mesplé-Somps (2010). The net effect of missing these households is ambiguous in terms of the bias in inequal-ity, contingent on which household groups are excluded from the survey. However, if top income earners or the very poor are sys-tematically excluded, inequality measures will be understimated.
Methods have been proposed to address some of these problems (see Korinek, Misti-aen, and Ravallion 2006). One approach is to compare top incomes in household surveys with tax records (Atkinson, Piketty, and Saez 2011; Banerjee and Piketty 2005). Studies adopting this approach typically conclude that surveys underestimate top incomes. The evidence on South Africa is ambiguous, because most surveys provide estimates of top income shares that are close to the tax data (Morival 2011). Many developing coun-tries lack administrative tax data with which to assess the level of underreporting in house-hold surveys (see, for example, the discussion
on the Middle East in Alvaredo and Piketty 2015). One study that attempts to assess the extent of the underestimation (the study of Egypt by Hlasny and Verme 2013) shows, perhaps surprisingly, that it is not large.
Another approach for gauging underes-timation at the top of the distribution is to compare consumption from household sur-veys with private consumption in national accounts. Although there are conceptual differences between these two measures of consumption, the growing gap between national accounts and survey consumption in countries such as China and India is often interpreted as an indicator that surveys miss out on a growing share of private expendi-tures (Deaton 2005). This problem appears to be less important in Africa, where house-hold surveys and national accounts have not been observed to be diverging, as discussed in chapter 1.
To study inequality in the distribution of consumption, the Gini index across coun-tries is compared. The Gini index is a widely used measure of inequality (box 4.1). It ranges between 0 (every individual enjoys the same level of consumption per capita, perfect equality) and 1 (a single individual accounts for all consumption). A Gini index of 0.4 means that the expected difference in consumption between any two people cho-sen from the population at random will be 80 percent (two times the Gini). This chap-ter focuses on Gini indexes as derived from household surveys, rather than efforts to impute a Gini from other sources (box 4.2)
Inequality Patterns and TrendsThis section explores both national and regional aspects of inequality and then describes core household traits that explain inequality across groups in countries.
Inequality across African Countries
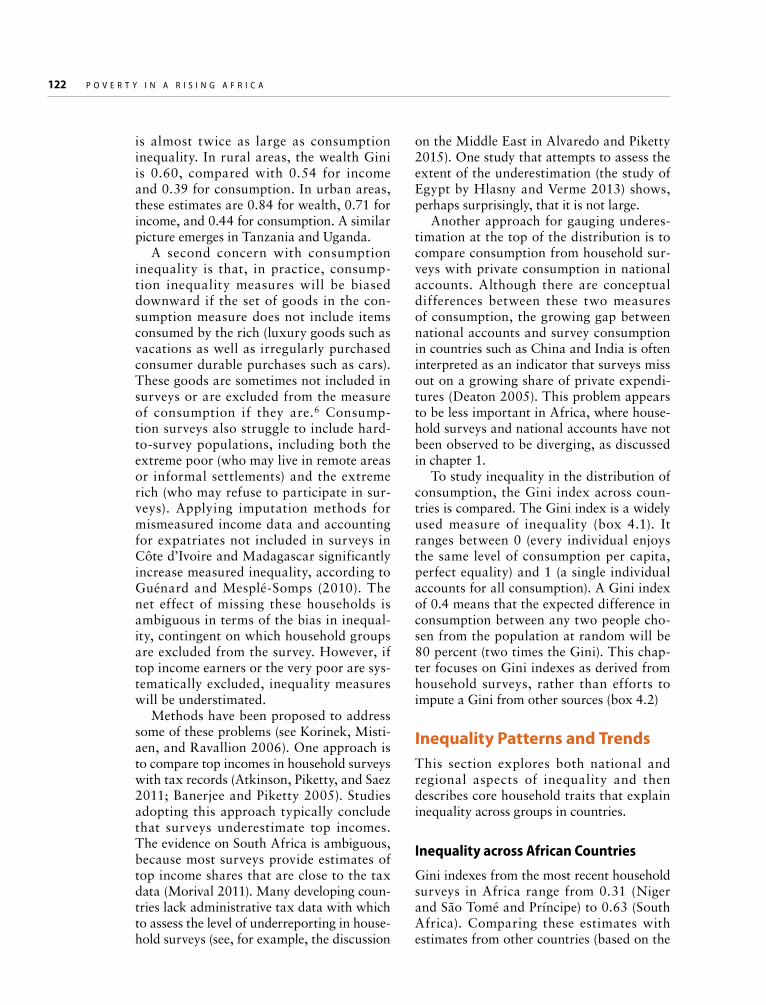
Gini indexes from the most recent household surveys in Africa range from 0.31 (Niger and São Tomé and Príncipe) to 0.63 (South Africa). Comparing these estimates with estimates from other countries (based on the

I N E Q U A L I T Y I N A F R I C A 123
Issues of comparability and data availability hamper studies of inequality in Africa. For the Gini results in this chapter, only nine countries have more than three data points, and seven countries have just a single data point.
Can this dearth of data be circumvented by esti-mating the Gini? The Standardized World Income Inequality Database (SWIID) takes this approach, seeking to maximize the comparability and coverage of Gini estimates worldwide (Solt forthcoming a). This effort works best in countries with better and more data, but it is still subject to critique (see Jenkins 2014 and the response to his critique in Solt forthcoming b).
Using a missing-data algorithm and drawing on information from proximate years within a country and various data collection efforts (such as the World Bank’s PovcalNet, the UNU-WIDER database, and country statistical reports), SWIID produces Gini estimates for 45 countries in Africa. For 1991–2012, SWIID has 16 or more annual estimates of the Gini for more than half these countries. Because of the lack of survey data in developing countries, the
SWIID imputations show substantial variability in the region, as Solt (forthcoming a) notes (figure B4.2.1). Most of the estimates computed directly from the surveys are within the SWIID confidence interval, but that interval is wide.
The two sources are highly correlated (with a correlation of 0.83 between the survey estimate and the average SWIID estimate from 100 imputations). The correlation is higher (0.91) if the comparison is limited to surveys deemed comparable within the country. The correlation is low (only 0.15) among the nine countries in Central Africa.
The direction of the changes in the Gini in the SWIID does not match well with the trends revealed by the surveys (as in figure 4.4). In only 11 of 20 countries with a trend in both sources does the direction of change match. There is a high degree of uncertainty in the SWIID estimates. In only 1 of the 20 countries studied is the change in the Gini statis-tically significant. Until better and more surveys are conducted in the region, imputing inequality mea-sures is fraught with serious concerns.
BOX 4.2 Can the Gini index be estimated without a survey?
b. Mozambique
d. Zambiac. Uganda
a. Côte d’Ivoire
0.3
0.4
0.5
0.6
0.3
0.4
0.5
0.6
Gin
i ind
ex
0.3
0.4
0.5
0.6
Gin
i ind
ex
0.3
0.4
0.5
0.6
Gin
i ind
ex
Gin
i ind
ex
2000 2005 20101990 2000 2005 20101990
2000 2005 201019902000 2005 20101990
19951995
19951995
FIGURE B4.2.1 Standardized World Income Inequality Database (SWIID) estimates of the Gini index show great variability
Source: World Bank Africa Poverty database and Solt forthcoming a. Note: Orange lines show the 95 percent confidence intervals on the SWIID Gini imputations. Blue dots are the survey-based Gini estimates from the World Bank Africa Poverty database.

124 P O V E R T Y I N A R I S I N G A F R I C A
PovcalNet database) reveals that 7 of the 10 most unequal countries in the world are in Africa (figure 4.3). All but two of the seven countries (South Africa and Zambia) have populations of less than 5 million.
The levels of inequality in Africa appear even more remarkable if one considers that many countries outside Africa—particularly advanced economies and countries in Latin America—use income rather than consump-tion per capita to measure inequality. Relative to consumption data, income data generally produce higher levels of inequality.
The heterogeneity in inequality across Africa is substantial and shows a geographi-cal pattern (map 4.1). Inequality is higher in Southern Africa (Botswana, Lesotho, Namibia, South Africa, Swaziland, and Zam-bia), where Gini indexes are above 0.5, as well as in Central African Republic and the Comoros. West African countries exhibit lower levels of inequality, and countries in East Africa are mixed. These findings are robust to other measures of inequality (box 4.1).
Some researchers have argued that these patterns in inequality have historical roots. In particular, the high levels of inequality in Southern Africa are legacies of the land dis-possession and racially discriminatory poli-cies of the colonial period. There are notable differences in the history of communal land tenure systems in West and Central Africa compared with white settler economies (char-acterized by privately owned small family plots, large estates, and plantations) in East and Southern Africa (Cornia 2014).
There are few other discernable patterns in terms of country traits and inequality. Inequality levels do not differ statistically between coastal and landlocked, fragile and nonfragile, or resource-rich and resource-poor countries, controlling for the four sub-regions. Bhorat, Naidoo, and Pillay (2015) also conclude that the average level of inequal-ity is not different between resource-rich and other economies, but they note that a number of resource-rich economies have high levels of inequality. If the eight most unequal coun-tries in the region (South Africa, Zambia, and six small economies) are excluded and one
FIGURE 4.3 The world’s most unequal countries are in Africa
Source: PovcalNet for countries outside Africa; World Bank Africa Poverty database. Note: Orange bars are African countries (based on consumption); light blue bars are other countries using consumption surveys; dark blue bars are other countries using income surveys.
0 0.1 0.2 0.3 0.4 0.5 0.6 0.7Gini index
South Africa
São Tomé and PríncipeNiger
Mali
EthiopiaBurundi
GuineaSierra Leone
SudanGuinea-Bissau
Mauritius
Liberia
Burkina Faso
Botswana
Comoros
Lesotho
RwandaSwaziland
Kenya
Cabo VerdeGambia, The
MalawiTogo
Benin
Mozambique
Ghana
Gabon
Madagascar
Seychelles
Côte de Ivoire
Tanzania
Congo, Rep.
Congo, Dem. Rep.
Senegal
Angola
Nigeria
Namibia
Central African Republic
Cameroon
Uganda
Mauritania
Zambia
Chad

I N E Q U A L I T Y I N A F R I C A 125
MAP 4.1 Inequality in Africa shows a geographical pattern
Source: World Bank Africa Poverty database.
controls for country-level income, Africa has inequality levels comparable to developing countries in other parts of the world (Bho-rat, Naidoo, and Pillay 2015 draw the same conclusion).
Are African countries becoming more unequal? Analysis of 23 countries for which there are two comparable surveys to measure inequality reveals that about half the coun-tries experienced a decline in inequality while the other half saw an increase (figure 4.4).7 No clear patterns based on resource status,
income status, or initial level of inequality in the first survey are evident.
The picture is the same if one looks at the longest available time period for which comparable data are available. Cornia (2014) describes this pattern as “inequality trend bifurcation.”8 Within-country trends in inequality in Africa differ from trends in both Asia, where inequality is on the rise, and Latin America, where inequality has been declining since the early 2000s (see Ferreira and others 2013 for Latin America;
IBRD 41869SEPTEMBER 2015
MauritiusMadagascar
Seychelles
Comoros
LesothoSouthAfrica
Swaziland
BotswanaNamibia
ZimbabweMozambique
MalawiZambia
Angola
Dem. Rep. ofCongo
Rwanda
Burundi
Tanzania
KenyaUganda
Somalia
Ethiopia
GabonRep. ofCongo
Central AfricanRepublic
Cameroon
Sudan
South Sudan
EritreaChad
NigerMali
Burkina FasoBenin
Nigeria
TogoEquatorial Guinea
São Tomé and Princípe
GhanaCôte
d’IvoireLiberia
Sierra Leone
GuineaGuinea-Bissau
Senegal
Mauritania
The Gambia
CaboVerde
0.60–0.63
0.50–0.59
0.46–0.49
0.41–0.45
0.36–0.40
0.31–0.35
No data
Gini index

126 P O V E R T Y I N A R I S I N G A F R I C A
Asian Development Bank 2014 and Rama and others 2015 for Asia).
Should one expect a more systematic increase in inequality given Africa’s double decade of growth? One of the long-standing debates in economics is about the trends in inequality during periods of economic growth. In the 1950s, Simon Kuznets for-mulated the hypothesis that inequality first increases and then declines as GDP per capita rises (Kuznets 1955). Because most countries in Africa still have low levels of GDP, the Kuznets hypothesis suggests that inequality should increase with rising GDP per capita.
Empirical studies have not produced robust support for the Kuznets hypoth-esis (Bruno, Ravallion, and Squire 1998; Deininger and Squire 1996; Milanovic 2011). The African data also fail to provide strong evidence for a Kuznets-type trajectory.
Panel a of figure 4.5 compares the level of inequality (measured by the Gini) with GDP per capita. Although there is a sig-nificant positive relationship between the level of GDP and inequality, it is driven almost entirely by the upper-middle-income
countries in Southern Africa (Botswana, Namibia, and South Africa), which differ in many ways (in addition to GDP per capita) from the rest of Africa. A more appropriate test of the Kuznets hypothesis is to compare changes in inequality with changes in GDP per capita using multiple observations per country (panel b of figure 4.5). If the Kuznets hypothesis holds, the data should trace out an inverted U-pattern or at least—given that most of the countries in the sample are poor and hence likely to be shifting along the ris-ing portion of the U—an upward slope to show inequality rising as GDP increases. This is not the case: inequality is not moving in a clear direction and does not appear to be systematically related to changes in GDP per capita. Other researchers have reached similar conclusions based on examination of recent data (Bhorat, Naidoo, and Pillay 2015) and growth spells in the 1990s (Fields 2000).
All else constant, a reduction in inequal-ity is associated with a decline in poverty (Bourguignon 2004; Klasen 2004). Many countries in figure 4.6 are in quadrant 4, where both inequality and poverty declined.
–4
–3
–2
–1
0
1
2
3
Burkina Faso
Sierra Leone
Tanzania
Uganda
Botswana
Namib
ia
Congo, Dem
. Rep.
Moza
mbique
South A
frica
Swaziland
Rwanda
Maurit
ius
Camero
on
Zambia
Senegal
Côte d’Iv
oire
Madagasc
ar
Ghana
NigeriaChad
Togo
Ethiopia
Malawi
Ann
ualiz
ed p
erce
ntag
e ch
ange
in G
ini i
ndex
Source: World Bank Africa Poverty database. Note: Annualized percentage change in the Gini index is based on the two most recent and comparable surveys available.
FIGURE 4.4 Inequality rose in about half of the countries and fell in the other half

I N E Q U A L I T Y I N A F R I C A 127
However, in a number of countries poverty fell despite increasing inequality (quadrant 1 in figure 4.6). In these countries, the growth in mean consumption was large enough to offset the rise in inequality.
Inequality in Africa as a Whole
Combining survey data across countries enables the study of the Africa-wide dis-tribution of consumption.9 For this exer-cise, surveys are grouped into benchmark years (1993, 1998, 2003, and 2008).10 The data cover 81 percent of regional GDP and 72 percent of the population, indicating that richer countries are more likely to be included.11 Given this coverage, the results probably represent a lower bound on Afri-can inequality.
The African Gini index is 0.52–0.56 across the benchmark years, much higher than individual-country inequality measures (table 4.1). Only four countries (Botswana, the Central African Republic, Namibia, and South Africa) have Gini indexes that are higher than the African Gini in 2008. As discussed earlier, by and large, African countries have levels of inequality that are similar to other developing countries if mea-sured in terms of average country inequality.
Ethiopia
Nigeria
Rwanda
Senegal
Zambia
Mauritania
South Africa
Swaziland
Namibia Botswana
Mauritius
0.3
0.4
0.5
0.6
0.7
Gin
i ind
ex
0 5,000 10,000 15,000 20,000GDP per capita
Ethiopia
Nigeria
Rwanda
Zambia
Mauritania
0.30
0.35
0.40
0.45
0.50
0.55
Gin
i ind
ex
0 1,000 2,000 3,000 4,000 5,000GDP per capita
b. Changes in Gini index and GDP per capitaa. Correlation between Gini index and GDP per capita
FIGURE 4.5 There is no systematic relationship between growth and inequality in Africa
Sources: World Bank Africa Poverty database (subset of countries with comparable surveys); World Development Indicators database. Note: Panel a is based on the most recent survey. Panel b excludes the five highest-income countries in panel a.
But Africa as a whole has the highest level of inequality of any region in the world.12 The African Gini index rose by almost 9 percent between 1993 and 2008. By contrast, the average country Gini fell by almost 5 percent, and no change is observed if countries are weighted by their population.
Survey mean increased
Annualized percentage change in poverty rate
Quadrant 1
Quadrant 4
Annu
aliz
ed p
erce
ntag
e ch
ange
in G
ini i
ndex
Survey mean decreased
Burkina Faso
BotswanaDem. Rep. Congo
Ethiopia 99-04
Ethiopia 04-10
Ghana 91-98Ghana 98-05 Mozambique 96-02
Mozambique 02-09MauritaniaMauritius
Malawi
Namibia
NigeriaRwanda 00-05
Rwanda 05-10 Senegal
Sierra Leone
Swaziland
ChadTogo
TanzaniaUganda 02-05
Uganda 05-09
Uganda 09-12
South Africa
Côte d’IvoireCameroon
Madagascar 01-05
Madagascar 05-10
Zambia 98-04
Zambia 04-06
–4
–2
0
2
–10 –5 0 5
FIGURE 4.6 Declining inequality is often associated with declining poverty
Source: Countries in World Bank Africa Poverty database with comparable surveys.Note: Ethiopia 1995–99, an outlier, is excluded. Survey years are indicated for countries with more than one pair of comparable surveys.

128 P O V E R T Y I N A R I S I N G A F R I C A
The level of inequality in Africa is largely driven by within-country inequality, which explains considerably more than half of the inequality measured by the mean log deriva-tion (MLD). However, the increase in African inequality was driven by a widening between countries, as opposed to within-country changes in inequality. Over time, a greater share of African inequality is explained by gaps across countries. These results stand in sharp contrast to global inequality, where within-country inequality increased both in the level of inequality and as a share of total inequality (even though between-country differences remain the dominant source of global inequality).
Does country GDP explain African inequality? To some extent, it does. Figure 4.7 divides the African distribution of con-sumption in 2008 into 20 ventiles, from poor to rich, each representing 5 percent of the African population. For each ventile, the figure shows the share of the population in low-, lower-middle-, and upper-middle-/high-income countries. In 2008, 54 percent of the population in the top 5 percent of the African distribution were living in upper-middle-/high-income countries, 36 percent in lower-middle-income countries, and 10 percent in low-income countries. The share of the African population in upper-middle-/high-income countries rises as one moves up the distribution, while the share of the popu-lation in lower-income countries declines. However, there is much overlap across these country classifications, meaning there are very rich households in poor countries and vice versa.
Between-Group Inequality
This section explores the extent to which con-sumption levels differ across groups in an econ-omy based on some socioeconomic or other household trait. Between-group (or horizontal) inequality is measured by decomposing over-all inequality into two parts: inequality attrib-uted to between-group (horizontal) differences and inequality within groups. Horizontal inequalities can come at a high cost to society. Between-group inequalities can perpetuate intergenerational persistence in poverty, and social exclusion and can limit socioeconomic
0
10
20
30
40
50
60
70
80
90
100
Upper-middle and high-income countriesLow-middle-income countriesLow-income countries
Poorest 5%
Richest
5%
Perc
ent
FIGURE 4.7 The richest households in Africa live mostly in the richer countries
Source: Jirasavetakul and Lakner 2015.
TABLE 4.1 Inequality in Africa, 1993–2008
Indicator
Percentage change
1993–20081993 1998 2003 2008
Gini index for Africa 0.52 0.52 0.54 0.56 8.6Average country Gini index 0.47 0.45 0.45 0.45 3.8Average country Gini index, population weighted 0.44 0.44 0.43 0.44 −0.5African mean log deviation 0.47 0.47 0.51 0.57 20.0Within-country contribution to African mean log deviation (percent) 73.4 71.3 64.3 59.7
Source: Jirasavetakul and Lakner 2015.
Benchmark year

I N E Q U A L I T Y I N A F R I C A 129
mobility. They have been linked to violent con-flict and social unrest and are therefore partic-ularly detrimental for economic development and poverty reduction (Cramer 2005; Langer and Stewart 2015). In a similar vein, ethnic fractionalization has been associated with poor outcomes in the provision of local public goods (Miguel and Gugerty 2005) and lower levels of overall economic growth in Africa (Easterly and Levine 1997).
To explore between-group inequality in Africa, seven groups are defined based on the consensus in the literature and the availabil-ity of information in the household surveys to define groups.13 Of the seven groups exam-ined, geographical location, education, and demographics are the most important drivers of inequality (figure 4.8).14
Spatial inequalities are important for both the urban-rural group and the regional group
Perc
ent o
f ine
qual
ity e
xpla
ined
Low inequality High inequality
f. Gender
Perc
ent i
nequ
ality
exp
lain
edLow inequality High inequality
c. Education
40
30
20
10
0
40
30
20
10
0
40
30
20
10
0
40
30
20
10
0
Perc
ent o
f ine
qual
ity e
xpla
ined
Low inequality High inequality
b. Urban
Perc
ent o
f ine
qual
ity e
xpla
ined
Low inequality High inequality
e. Employment
Perc
ent o
f ine
qual
ity e
xpla
ined
Low inequality High inequality
d. Demographics
Perc
ent i
nequ
ality
exp
lain
ed
Low inequality High inequality
a. Region
40
30
20
10
0
40
30
20
10
0
40
30
20
10
0
Perc
ent o
f ine
qual
ity e
xpla
ined
Low inequality High inequality
g. Age group
FIGURE 4.8 Location, education, and demographics are the most important drivers of inequality
Source: World Bank Africa Poverty database.Note: Figure shows the percent of total inequality explained by differences in mean consumption between the groups indicated for 26 countries in Africa. For employment, the num-ber of countries included is 17 because of missing data on employment status or industry. Inequality is measured by the mean log deviation. Countries are sorted by the overall level of inequality, from low to high (left to right).

130 P O V E R T Y I N A R I S I N G A F R I C A
classifications.15 In Senegal one-third of total inequality is attributed to gaps between households in urban and rural areas. On the lower end of the spectrum are some of the small island states (the Comoros, São Tomé and Príncipe), where urban-rural gaps are virtually nonexistent. A similar picture holds for inequality between regions (first-tier administration units). The two between-group components (urban-rural and regions) are correlated (0.73); countries with large urban-rural gaps in living standards also tend to have significant gaps across regions. Spa-tial inequalities may be even higher than cap-tured by household consumption, because of the spatial aspects of public service provision (the fact that the value of public services, such as health services and schools, may be higher in urban areas).
Another way to view the extent of regional inequality is to compare mean con-sumption per capita across areas. The gap (as measured by the ratio between the rich-est and the poorest regions) often shows that the richest regions have twice the mean con-sumption of the poorest. The gap for first-tier administration units is 2.1 in Ethiopia (regions), 3.4 in the Democratic Republic of Congo (provinces), and more than 4.0 in Nigeria (states).16 Inequality associated with geographical income segregation may be more politically destabilizing than inequal-ity in which the poor and rich are equally dispersed geographically (Milanovic 2011), especially if geographical inequalities coin-cide with ethnicity or religion, as in northern and southern Nigeria.
In most household surveys, the samples are too small to estimate inequality for geo-graphical areas smaller than regions. Such estimates can be made by combining house-hold surveys with census data to yield poverty maps (also known as small area poverty esti-mates). The poverty map of Zambia shows that of the more than 1,400 constituencies in the country, about one in seven has a poverty rate of less than half the country mean (de la Fuente, Murr, and Rascón 2015). At the other extreme, 20 percent of constituencies
have poverty rates that are more than 25 per-cent higher than the national average.
Educational attainment of the household head is an even more important driver of gaps in consumption across households. In three countries (Rwanda, South Africa, and Zambia), educational attainment explains about 40 percent of overall inequality. Higher inequality is associated with greater inequal-ity between education categories, an associa-tion that is not observed among most of the other socioeconomic groupings. Education tends to explain a greater share of inequality than the broad economic activity category of the household head, an important driver of inequality in some countries.
The demographic composition of the household also explains a large share of inequality, up to 30 percent of overall inequal-ity in Senegal and 32 percent in Botswana. This finding is consistent with the fact that larger households in Africa, especially house-holds with many children, show significantly lower levels of consumption and higher levels of poverty than smaller households.
Some demographic characteristics—for example, the gender of the household head—do not explain a substantial share of total inequality. This finding is not surpris-ing, given that in many African countries, consumption per capita levels of male- and female-headed households do not differ widely. A shortcoming of this method of decomposing inequality is that the decom-position reveals nothing about the direction of bias (that is, whether the disadvantage lies with female- or male-headed households). Moreover, because consumption is measured at the household level, the decomposition does not provide any information about how consumption is distributed between men and women within households (box 4.3).
For many countries, horizontal inequali-ties can be measured for more than one point in time. The main drivers of horizon-tal inequalities (geography, education, and demographics) did not change during the period for which survey data are available (from the early 1990s to the present).

I N E Q U A L I T Y I N A F R I C A 131
Unequal OpportunitiesInequality across households is the product of many forces. The circumstances in which one is born—in a rural area, to uneducated parents—are one important force. Inequal-ity of opportunity is the extent to which such circumstances dictate the outcomes of indi-viduals in adulthood. In economics this con-cept has been articulated by Fleurbaey (2008) and Roemer (2000), among others. In the field of sociology, inequality of opportunity
is the concept of achieved versus ascribed sta-tus (Linton 1936) and ascriptive inequality. It can exacerbate overall inequality and violate principles of fairness and equal opportunity.
A growing body of literature in the past 15 years tries to assess the degree of inequality of opportunity and evaluate the opportunity-equalizing effects of public policies (see the recent surveys by Ferreira and Peragine 2015 and Roemer and Trannoy 2015)—efforts that face a number of challenges (Kanbur and Wagstaff 2014). Building on the previous
Little is known about interpersonal inequality in liv-ing standards within households, including between men and women, because consumption data are col-lected at the household level and standard measures of poverty and inequality are calculated assuming that resources are shared equally within the house-hold (even if there is some normalization for size and demographic composition).
The idea that individuals within a household do not always have the same living standards and that income is not shared equally is not new (see Strauss, Beegle, and Mwabu 2000 and the ample evidence in World Bank 2011). Gender and age are arguably the most prominent individual attributes along which differentiation takes place within the household.
The household structure in Senegal (as well as in other West African countries) is unique in its complexity and offers opportunities to explore the extent of intrahousehold inequality. Households are structured like compounds. Within each house-hold are “cells” made up of a head and unaccom-panied dependent members, while married broth-ers and each wife of the head and her children form separate cells. Surveying and paying careful attention to the compound structure and con-sumption patterns among members reveals within- household consumption patterns (De Vreyer and others 2008). Food expenditures are compiled based on a detailed account of who shares which meal and how much money is used to prepare it. Individual
consumption data are then collected at the cell level. Finally, expenditures that are shared by several cells are collected and attributed equally to all household members. A measure of consumption per capita is then constructed at the cell level.
The results clearly show that not everyone in the household gets the same resources. The ratio between the consumption of the richest and poorest cells within a household can be as high as 23 (and is still above 4 after trimming off the 5 percent of most unequal households). In general, food expen-ditures are equitably distributed, a critical insight that underscores basic solidarity. In contrast, non-food expenditures are not divided equally. Over-all inequality is higher for cell-level consumption (Gini = 0.567) than for a household-level measure that assumes equal consumption across household members (Gini = 0.548).
These unique consumption data also reveal a siz-able gender gap. Cells headed by men have signifi-cantly higher consumption.
The poverty status of the household can hide poverty within the household. About 1 nonpoor household in 10 has a poor cell within it (De Vreyer and Lambert 2014). There are also nonpoor cells in poor households. Targeting poor households would miss 6–14 percent of poor children (depending on the poverty line), namely, children who reside in poor cells within nonpoor households.
BOX 4.3 Are resources within households shared equally? Evidence from Senegal

132 P O V E R T Y I N A R I S I N G A F R I C A
discussion of horizontal inequalities, which described the contribution of different indi-vidual characteristics to total inequality, this section presents evidence on inequality of eco-nomic opportunity and the intergenerational transmission of education and occupation.17
Inequality of Economic Opportunity
The approach to measuring inequality of economic opportunity entails unpack-ing how much of current consumption can be explained by a person’s circumstances in childhood and how much is explained by individual responsibility, luck, or effort (obtained as the residual).18 Such estimates of inequality of economic opportunity are available for many countries worldwide, but evidence for Africa has been limited to date.19 Drawing on surveys from 10 countries (the Comoros, Ghana, Guinea, Madagascar, Malawi, Niger, Nigeria, Rwanda, Tanzania, and Uganda), this section presents more com-prehensive evidence for countries in Africa.20
The circumstances used to measure inequal-ity of economic opportunity include ethnic-ity, parental education and occupation, and region of birth.21 The analysis focuses on individuals 15 years and older. Like other researchers in this field (see, for example, Fer-reira and Gignoux 2011), inequality is mea-sured using the MLD.22
The share of inequality that can be attrib-uted to inequality of opportunity ranges from 8 percent (Madagascar) to 20 percent (Malawi) (figure 4.9). The ranking of coun-tries changes considerably if one looks at inequality of opportunity rather than overall inequality (note that the countries in figure 4.9 are sorted by inequality): Countries with higher inequality in outcomes are not neces-sarily characterized by a larger share of the inequality attributed to inequality of opportu-nity. The Comoros, for instance, has the high-est overall level of inequality, but its share of inequality of opportunity is among the low-est. Furthermore, the magnitude of inequal-ity of opportunity is only partly correlated with the number of circumstances available in the data, suggesting that the differences observed across countries do not solely reflect differences in the availability of circumstance variables but say something meaningful about the structure of inequality (however, more circumstances are also typically expected to yield greater inequality of opportunity).
Estimates of inequality of opportunity calculated in this manner represent a lower bound, because many circumstance variables (family wealth, parenting time, the quality of education) are not observed in household surveys and hence cannot be considered in the estimation.23 This issue also complicates comparisons across countries, because the surveys differ in the number and granularity of the circumstance variables.
Intergenerational Persistence in Education and Occupation
Does the educational attainment of parents matter less today to a child’s schooling than
Source: Brunori, Palmisano, and Peragine 2015b. Note: The figure shows the share of total mean log deviation (MLD) that is attributed to inequality of economic opportunity. Countries are ordered by their level of inequality measured by the MLD, with the least unequal countries on the left and the most unequal on the right.
0
5
15
25
Niger
Madagascar
Tanza
nia
Nigeria
Ghana
Guinea
Uganda
Rwanda
Malawi
Comoros
Perc
ent o
f ine
qual
ity a
ttrib
uted
to
une
qual
opp
ortu
nitie
s
FIGURE 4.9 Unequal opportunities account for up to 20 percent of inequality in Africa

I N E Q U A L I T Y I N A F R I C A 133
it did 50 years ago? 24 Is the occupation of a farmer’s son less affected by his father’s occupation than it was a generation ago? Using data from several recent household surveys in Africa and drawing on a set of surveys with information on adult children and their fathers, the extent of intergenera-tional mobility in education and occupation is examined, as well as whether the extent of this mobility is changing among younger generations.25
To measure educational mobility from the perspective of intergenerational persis-tence, education is regressed on the edu-cational attainment of one’s parents. The coefficient from this simple regression, ß, measures education persistence (see Black and Devereux 2011 for a recent overview of approaches to this measurement). Another measure of mobility is the correlation coef-ficient between the outcomes of parents and their children (ρ), which is the intergenera-tional gradient (ß), multiplied by the ratio of the standard deviation across the two gen-erations.26 Three factors are explored—the intergenerational gradient, the correlation coefficient, and the ratio of standard devia-tions—for different cohorts to study inter-generational persistence in schooling across generations (figure 4.10).
The correlation coefficient on intergener-ational mobility (the blue line in figure 4.10) slightly increased in most countries. Con-versely, the intergenerational gradient, ß, is falling in most countries (the orange line in figure 4.10). An additional year of school-ing of one’s parent has a lower association with one’s own schooling than it used to. This reflects, however, that the ratio of the standard deviations (the red line in figure 4.10) is rising, which in turn is related to the low levels of schooling among parents in the oldest generation. For example, people born in 1949 in Rwanda have on average 1.5 years of schooling, while their parents have only 0.1 years. The Africa intergen-erational mobility trends are broadly com-parable to estimates in other developing
countries (Ferreira and others 2013; Hertz and others 2007). These changes may partly reflect the fact that since the 1990s, many countries have eliminated school fees at the primary level (Bhalotra, Harttgen, and Klasen 2015). In terms of level of mobility in general, Africa has greater intergenerational educational mobility than Latin America. However, mobility is lower than developed countries in Europe, the United States, and the former Eastern Bloc.
Like education, one’s occupation may be determined largely by the occupations of one’s parents. The limited literature on this issue in Africa focuses on intergenera-tional occupational persistence from farm to nonfarm occupations. Here this analysis is extended to look at three occupational classifications among men 20–65 (agricul-ture, services, and other occupations) and their fathers. The analysis is restricted to the occupation of fathers because fewer sur-veys have information on the occupation of mothers.
Intergenerational occupational persis-tence in farming has been falling rapidly in some countries (table 4.2). In the Comoros, the share of farmers’ sons working in other sectors is more than twice as large for the youngest cohort as it is for older cohorts. Guinea is the most rigid economy in terms of occupational shifting. There is substan-tial intergenerational mobility in work among people with fathers in services and other sectors; generally less than half of the youngest cohort are performing the same services or other sector work as their fathers. This change in intergenerational occupational persistence is consistent with the overall shifts in occupational structure in each country, specifically the falling employment shares of agriculture (World Bank 2014a).
To separate out economy-wide shifts, the share of job mobility associated with expansion in nonagricultural sectors is net-ted out (following the approach of Bossuroy and Cogneau 2013). Net mobility shows

134 P O V E R T Y I N A R I S I N G A F R I C A
Source: Azomahou and Yitbarek 2015. Data for other developing countries from Hertz and others (2007).
c. Ghana, 2013
i. Tanzania, 2009
e. Madagascar, 2005
1.5
1.0
0.5
0Pers
iste
nce,
SD
ratio
j. Uganda, 2005
1.5
1.0
0.5
0Pers
iste
nce,
SD
ratio
1.5
1.0
0.5
0Pers
iste
nce,
SD
ratio
k. Other developing countries
1.5
1.0
0.5
0Pers
iste
nce,
SD
ratio
1.5
1.0
0.5
0Pers
iste
nce,
SD
ratio
h. Rwanda, 20001.5
1.0
0.5
0Pers
iste
nce,
SD
ratio
b. Congo, Dem. Rep., 2011
1.5
1.0
0.5
0Pers
iste
nce,
SD
ratio
f. Malawi, 2010
1.5
1.0
0.5
0Pers
iste
nce,
SD
ratio
d. Guinea, 2003
1.5
1.0
0.5
0Pers
iste
nce,
SD
ratio
g. Nigeria, 20101.5
1.0
0.5
0Pers
iste
nce,
SD
ratio
a. Comoros, 2004
1.5
1.0
0.5
0Pers
iste
nce,
SD
ratio
1943 1953 1963 1973 1983 1951 1961 1971 1981 1991 1952 1962 1972 1982 1992
1950 1960 1970 1980 19901945 1955 1965 1975 19851942 1952 1962 1972 1982
1950 1960 1970 1980 1990
1945 1955 1965 1975 1985
1939 1949 1959 1969 1979
1940 1950 1960 1970 1980
1949 1959 1969 1979 1989
Correlation coe�cient
Intergenerational gradient
Standard deviation ratio (parents/children)
FIGURE 4.10 Intergenerational persistence in schooling is weaker among younger Africans than older Africans
that shifts in the structure of occupations in the economy (sometimes called struc-tural change) are not the only factor driving changes in intergenerational occupational
mobility (table 4.3). The Comoros, Rwanda, and Uganda exhibit the highest rates of intergenerational mobility that is not attrib-utable to structural change.

I N E Q U A L I T Y I N A F R I C A 135
Extreme Wealth and BillionnairesHousehold surveys are not suited for cap-turing very high levels of income or wealth. Missing information on extreme wealth leads to underestimation of the extent of economic inequality in a broader sense. Wealthy house-holds are often not surveyed and household surveys generally measure current consump-tion or income (a flow measure) rather than the stock of household assets. Surveys are also likely to fail to capture rare income events or income (and the wealth from it) that is obtained illegally (Africa Progress Panel 2013). Data on holders of extreme wealth are difficult to collect. The Forbes World’s Billionaires list, the World Top Incomes Database (currently covering South Africa and ongoing in 15 other African countries), and the Global Wealth Databook have made
inroads, but they still generally cover little of Africa compared with other regions.
South Africa was the first African coun-try to be represented on Forbes’ list, with two billionaires in the late 1990s, followed by Nigeria in 2008. By 2014 the region had 19 billionaires: 8 in South Africa, 7 in Nige-ria, and 1 each in Angola, Kenya, Tanzania, and Uganda.27 Countries such as India expe-rienced a much sharper rise during a simi-lar period. The number of billionaires there rose from 2 in the mid-1990s to 46 in 2012, according to Gandhi and Walton (2012).
Although there are fewer billionaires in Africa, their average aggregate net wealth in 2012 was higher ($5.2 billion per billionaire) than in India ($3.8 billion). Aggregate bil-lionaire wealth as a percent of GDP increased steadily in Nigeria and South Africa from,
TABLE 4.2 Likelihood of remaining in one’s father’s sector in selected African countries
Country
Sons of farmers stay in sector Sons of service sector
employees stay in sectorSons of other sector
employees stay in sector
1Oldest
2 3 4 5Youngest
1Oldest
2 3 4 5Youngest
1Oldest
2 3 4 5Youngest
Comoros 80 55 55 45 48 34 53 45 40 55 7 41 37 42 17Ghana 76 65 64 59 71 47 50 51 60 52 21 22 32 25 32Guinea 79 69 73 76 80 26 40 34 36 41 24 28 43 40 32Rwanda 86 83 84 77 78 32 18 22 28 31 0 34 12 22 8Uganda 78 72 66 60 72 33 39 40 37 27 32 28 34 43 33
Source: Azomahou and Yitbarek 2015.Note: Table shows the percent of each cohort with the same occupation as their father. 1–5 are 10-year birth cohorts. The table should be read as follows: Among the youngest cohort (cohort 5) in the Comoros, the son of a farmer has a 48 percent likelihood of also being a farmer. Members of the oldest cohort of farmers’ sons have a much higher chance of being farmers (80 percent).
TABLE 4.3 Gross and net occupational intergenerational mobility out of farming in selected African countries
Country
Gross mobility Net mobility
1Oldest
2 3 4 5Youngest
1Oldest
2 3 4 5Youngest
Comoros 29 47 49 56 57 15 24 24 29 28Ghana 31 42 43 45 36 12 13 7 7 7Guinea 30 38 34 35 30 16 19 11 8 8Rwanda 17 22 21 29 31 12 14 14 17 13Uganda 29 35 40 45 40 14 17 21 21 12
Source: Azomahou and Yitbarek 2015.Note: Table shows the percent of each cohort with the same occupation as their father. 1–5 are 10-year birth cohorts. The table should be read as follows: Among the youngest cohort (cohort 5) in the Comoros, for example, 57 percent of sons do not have the same occupations as their fathers. Net mobility is computed as gross mobility minus the share of mobility associated with structural change in employment.

136 P O V E R T Y I N A R I S I N G A F R I C A
0.3 and 1.6 percent in 2010 to 3.2 and 3.9 percent in 2013 (figure 4.11). The increase is partly explained by the rise in the number of billionaires in both countries over the period. Nigeria’s rapid climb also stems from the fact that, since 2011, it has been the home of the
richest African (Aliko Dangote), whose for-tune grew by a factor of 10 between 2010 and 2014.
The growth in extreme wealth in the region since 2010 can be decomposed into two components: the increase in the wealth of veteran billionaires and the addition of new billionaires. More than half of the growth in Nigeria’s extreme wealth is explained by the growth in the wealth of the veterans. The weight of newcomers in the growth in extreme wealth in South Africa rose from 40 percent in 2011 to 54 percent in 2013. Across the set of six countries, the contribution of newcomers to the growth in extreme wealth jumped from 37 percent in 2011 to 61 per-cent in 2013.
With a focus on billionaires, the Forbes list captures only the very top of extreme wealth. In 2013 Forbes reported on 50 Afri-cans worth at least $400 million. This list still leaves out lower levels of wealth that are high by any standard.
Knight Frank (2015) surveys private bank-ers and wealth advisors to collect data on ultra-high-net-worth individuals (individuals whose net worth exceeds $30 million) in 90 countries, of which 14 are in Africa. Across countries, the number of ultra-high-net-worth individuals increases with GDP per capita growth. The number tends to increase even where economies are in decline or stag-nating (in Zimbabwe, for example, the num-ber of ultra-high-net-worth individuals rose by 5.2 percent while GDP per capita declined by 0.12 percent). Africa’s trend (not shown) is very similar to the global trend (the gray dotted line in figure 4.12).
What do these data reveal about inequal-ity? Given the limited data on these extremely wealthy individuals, there is no straightfor-ward answer. Credit Suisse (2014) presents estimates of the distribution of wealth using the Forbes list and imputations based on cross-country relationships and consump-tion surveys. Using these data, Lakner (2015) finds that the 10 richest people in Africa pos-sess wealth equivalent to the wealth of the poorest half of the population. (His find-ings include North Africa, where 3 of the 10
Sources: Aggregate net wealth: Forbes’ “The World’s Billionaires.” GDP: World Development Indicators.
0
1
2
3
4
5
2006 2007 2008 2009 2010 2011 2012 2013
Agg
rega
te n
et w
ealth
as
perc
ent o
f GD
P(p
urch
asin
g po
wer
par
ity c
onst
ant 2
011
dolla
rs)
Angola Kenya Nigeria
Tanzania UgandaSouth Africa
Total
FIGURE 4.11 Billionaire wealth in Africa is growing
–5
0
5
10
15
20
–4 –2 0 2 4 6 8 10 12
Ann
ualiz
ed p
erce
ntag
e ch
ange
in
num
ber o
f ultr
a-hi
gh-n
et-w
orth
in
divi
dual
s 20
04–1
4
Annualized percentage change in GDP per capita 2004–13
African countriesnon-African countries
FIGURE 4.12 Extreme wealth increases with GDP in Africa and elsewhere
Sources: Data on number of ultra-high-net-worth individuals are adapted from World Bank 2014b, based on Knight Frank 2015. GDP data are from World Development Indicators.Note: GDP is measure in purchasing power parity constant 2011 dollars. Black dotted line shows the global trend (African and non-African countries).

I N E Q U A L I T Y I N A F R I C A 137
richest people reside.) Oxfam International (2015) estimates that globally 80 individuals possess as much wealth as half the world’s population (the regional and global results are not strictly comparable).28 Few detailed studies explore the level of extreme wealth of nationals at the country level. One excep-tion is the New World Wealth (2014) study of Kenya, which estimates that about 8,300 people own 62 percent of that country’s wealth.
Does the source of this wealth matter? Particularly in sectors where rent-seeking behavior is more likely, the role of political connections in the wealth-generating pro-cess could have implications for development and growth. Gandhi and Walton (2012) find that in India in 2012, 60 percent of total net wealth was derived from “rent-thick” sectors, such as real estate, infrastructure, construc-tion, mining, telecommunications, cement, and media, where the influence of political connections and the potential for rent extrac-tion are important (Rama and others 2015). In Africa the share of extreme wealth derived from extractives has been declining. During 2011–14, about 20 percent of African billion-aires derived their wealth mainly or partially from telecommunications, and the share of extreme wealth derived from services and the broad category of investment jumped from 1 percent to 13 percent.
Forbes classifies the majority of net wealth in Africa in 2014 as self-made as opposed to inherited. It estimates that self-made aggregate net wealth in the region represented 74 percent of total net wealth and that 81 percent of the billionaires in Africa reported being self-made. This clas-sification of self-made does not necessarily imply returns to successful entrepreneurship and innovation (as opposed to accumulating extreme wealth through political influence or corrupt business practices). Bagchi and Svejnar (2015) assess wealth accumulation through political connections by looking at evidence in news sources that suggests whether billionaires would have become billionaires in the absence of political con-nections. Among total billionaire wealth
in their sample, the fraction of politically connected billionaires in 1987, 1992, 1996, and 2002 ranges from 4 percent to 13 per-cent. They conclude that politically con-nected wealth accumulation has a negative effect on economic growth worldwide. In resource-rich countries in Africa, there is concern that the elites gain wealth from resources through political connections (see the examples and broad discussion in Burgis 2015).
Concluding RemarksThe latest evidence on inequality in Africa paints a complicated picture. The most unequal countries in the world are in Africa, mostly in the southern part of the conti-nent, but excluding the seven countries with extremely high inequality, inequality is not higher or lower than in other countries at similar income levels. In countries with com-parable surveys over time, inequality is fall-ing in half and rising in half, without a clear association with factors such as resource- richness, income level, or state fragility. A clearer pattern emerges for horizontal inequalities within countries, which continue to be dominated by unequal education levels and high urban-rural and regional income disparities.
From a regional perspective, inequal-ity among Africans is rising and is high compared with other regions. This pattern reflects the range in national income levels across countries and the fact that most of the poor in Africa reside in the poorest countries. The income gap between African countries is growing.
Another aspect of inequality—extreme wealth—is missed altogether by household surveys. Africa has seen a rise in billionaire wealth, at least in countries for which data are available.
A portion of inequality in Africa can be attributed to inequality of opportunity, cir-cumstances at birth that are major deter-minants of one’s poverty status as an adult. Fortunately, at least in some countries, there has been a rise in intergenerational
138 P O V E R T Y I N A R I S I N G A F R I C A
educational mobility, holding out hope that inequality of opportunity will decline. Never-theless, intergenerational occupational per-sistence, at least as captured by three broad occupation categories, remains high in many countries.
Notes 1. According to Olson (1965), if a public good
is of interest to the rich, inequality could facilitate collective action and allow the poor to free ride. In fact, the evidence shows, more often the opposite occurs. Wealthy households, which can afford private pro-viders, opt out of financing public services such as schools and health care facilities and redirect resources to efforts that do not serve poor families. Mansuri and Rao (2013) pres-ent a range of evidence indicating that com-munities with high inequality have worse local development processes and outcomes. They find that highly unequal incomes amplify market failures.
2. Some studies f ind evidence that high inequality within ethnic groups rather than in the country as a whole is a driver of civil conflict (Huber and Mayoral 2014). Oth-ers find that it is inequality between ethnic groups that matters (Stewart 2008). Parallel with these efforts to explain civil conflict is the literature that explores how inequality, especially ascriptive and horizontal inequali-ties, explains crime rates (see, for example, Blau and Blau 1982).
3. Similar contradictions in perceptions can be found in views on inequality in the United States (Fitz 2015).
4. Purchasing power parity (PPP) adjustments to convert local currency units into U.S. dol-lars do not affect national inequality mea-sures. National temporal price adjustments (to bring a survey from year 1 to year 2 prices) also do not typically affect national inequality measures. In contrast, within-sur-vey spatial price adjustments change inequal-ity measures. Both the World Bank Africa Poverty Database (used here) and PovcalNet compute Gini indexes based on nominal consumption measures. They do not adjust for the fact that the households interviewed pay different prices depending on where in a country they live or the time of year they
are interviewed. If prices differ spatially and temporally, deflated aggregates may produce different inequality measures and trends. For most of the surveys analyzed here, a deflated (real) consumption measure is available. The general findings on the levels and trends in inequality are not substantially different if Gini indexes are estimated using deflated (real) consumption. One exception is the findings on between- and within-inequality by region or urban location, which tends to decline using spatially deflated aggregates. Székely and Hilgert (2007) analyze some of these issues in Latin American countries.
5. Excluding these surveys has implications for how the results compare with the results of other studies. For example, excluding the first of the three most recent national house-hold surveys in Malawi (on the grounds of incomparability in survey design), the inequality trend in Malawi is not decreasing, as Bhorat, Naidoo, and Pillay find (2015).
6. Expenditure on consumer durables is not always included in the consumption mea-sure, because it represents highly irregular purchases (Deaton and Zaidi 2002). The recommended practice is to include dura-ble goods “use values” in the consumption measure.
7. Bhorat, Naidoo, and Pillay (2015) use a dif-ferent inequality measure but show simi-lar results: of 34 countries in Sub-Saharan Africa, inequality rose in 18 and fell in 16. Cornia (2014) and Fosu (2014) draw simi-lar conclusions. All three reports draw on the World Bank PovcalNet database. From a population perspective, the results lean toward increasing inequality; 57 percent of the population in these countries are resid-ing in a country with increasing inequality.
8. Measuring polarization is another approach to looking at the consumption distribu-tion, a concept related to but distinct from inequality. Polarization measures separa-tion (distance) across clustered groups in a society. Clementi and others (forthcoming) show that Nigeria experienced both rising inequality and rising polarization between 2003/04 and 2012/13, which contributed to the eroding of the middle class. Keefer and Knack (2002) argue that, in practice, polarization measures are strongly positively correlated with inequality measures across countries.

I N E Q U A L I T Y I N A F R I C A 139
9. For details on the calculations on African inequality, see Jirasavetakul and Lakner (2015). This idea has also been pursued globally, including in global inequality stud-ies by Anand and Segal (2015), Atkinson and Brandolini (2010), and Milanovic (2005). The analysis here draws heavily on Lakner and Milanovic (2015), who analyze the global income distribution in 1988–2008.
10. Because of the limited availability of house-hold surveys, the analysis cannot start before 1993, and there are not enough surveys for a benchmark year after 2008.
11. General coverage of Africa is good, but the coverage of fragile countries is low: on aver-age, the surveys cover only 28 percent of the population in fragile countries between 1993 and 2003. The rate improves markedly in 2008 with the inclusion of the Democratic Republic of Congo and Sudan.
12. Inequality in Africa as a whole is higher than in Latin America (0.528); Asia other than China (0.450) and China (0.427); mature economies (0.419); the Russian Federation, Central Asia, and Southeast Europe (0.419); and India (0.331) (Lakner and Milanovic 2015). Estimates by Pinkovskiy and Sala-i- Martín (2014) for Africa are even higher but show a decrease. However, their estimates are not drawn solely from a set of recent surveys in Africa but rather from a combi-nation of inequality measures from surveys, national accounts, mean and growth rates, and interpolations and extra polations for missing inequality data (including impu-tations of inequality measures from other countries if no survey is available for a country).
13. There are several main approaches to decom-posing inequality into within- and between-group inequality. The traditional version of the decomposition apportions total inequal-ity into a component explained by differ-ences in mean consumption between groups and a component that reflects inequality within each group. The between-group com-ponent measures the share of overall inequal-ity that would be obtained if every individual had the average consumption level of his or her group. However, as Elbers and oth-ers (2008) note, in this approach between-group inequality reaches a maximum if each individual constitutes a separate group—the yardstick against which between-group gaps
are evaluated. In addition, the between-group component mechanically increases with the number of categories used. Elbers and others propose an alternative decom-position that compares between-group dif-ferences with the maximum inequality that would be obtainable if the number and size of groups were fixed at their actual levels, while the ranking of the groups is preserved. For instance, urban-rural inequality would be evaluated against a benchmark in which all individuals living in rural areas appear at the lower end of the distribution and all indi-viduals living in urban areas appear at the upper end of the distribution, with the urban and rural population shares fixed at their actual levels. The decomposition thereby takes into consideration the existing config-uration of population groups. Only the tra-ditional results are reported here but broadly similar patterns result from the Elbers and others (2008) method (even though the esti-mated between-group shares are generally higher in the latter variant). For the analy-sis in this section, the mean log deviation is the measure of inequality. Unlike the Gini, it is additively decomposable, a mathematical property that is desirable in this context.
14. Region typically refers to the administrative region (for example, province) in which the household resides. Education denotes the highest level of education of the household head (none, incomplete primary, completed primary, completed lower secondary, uni-versity, other). Employment refers to the main economic activity of the household head (employee, employer/self-employed in agriculture, employer/self-employed outside agriculture, other). Gender and age refer to the household head. The demographic categories are one or two adults without children, one or two adults and fewer than three children, one or two adults and three children or more, three adults or more with-out children, three adults or more and up to three children, three adults or more, and four children or more.
15. The results for urban/rural and education are less pronounced than those in Belhaj Hassine (2015), who studies 12 countries in the Middle East and North Africa. She finds that gaps between regions account for a larger share of inequality than gaps within regions. Some of the inequality

140 P O V E R T Y I N A R I S I N G A F R I C A
across geographic areas reflects differences in the cost of living. Between-group inequal-ity for regions and for urban/rural areas is lower if a delated measure of consumption is used rather than a nominal measure. Across countries, it declines by about 15 percent on average for both regions and urban/rural.
16. If a deflated measure of consumption is used, these ratios fall to 1.3 (Ethiopia), 2.2 (Democratic Republic of Congo), and 3.9 (Nigeria).
17. The focus here is on inequality of opportu-nity from the perspective of economic out-comes in adulthood. A third domain is the human opportunity index, which captures the extent to which circumstances such as school attendance, immunizations, and household infrastructure, including access to sanitation and water, contribute to gaps in outcomes for children. Dabalen and oth-ers (2015) present detailed analysis of the human opportunity index for Africa across many countries and years. They find that greater coverage for all was more important than changes in equity for improvements in human opportunities.
18. This approach is described as the ex ante approach to measuring inequality of oppor-tunity, as opposed to the ex post approach (Checchi and Peragine 2010; Fleurbaey and Peragine 2013). In the ex post approach, there is no inequality of opportunity if peo-ple who exert the same effort end up with the same outcome. Inequality of opportunity in this approach is measured as inequality within responsibility classes (that is, within the set of individuals at the same effort level).
19. Exceptions are Cogneau and Mesplé-Somps (2008) for Côte d’Ivoire (1985–88), Ghana (1988 and 1998), Guinea (1994), Mada-gascar (1993), and Uganda (1992); Piraino (2015) for South Africa; and Brunori, Palmi-sano, and Peragine (2015a) for Uganda. Broader international comparisons of inequality of economic opportunity are pre-sented in Ferreira and Gignoux (2011) for Latin America and in Brunori, Ferreira, and Peragine (2013) for 41 countries.
20. This subsection draws on Brunori, Palmi-sano, and Peragine (2015b).
21. Another circumstance that is particularly relevant for countries in the region hard hit by HIV/AIDS is orphan status. The
empirical evidence on the consequences of being orphaned focuses on health indicators and education, with some studies showing a causal impact of orphanhood on schooling outcomes. Because orphanhood is not a ran-dom event (it is correlated with other house-hold measures, such as urban status and household education and wealth), the cor-relation does not imply that education levels are generally worse among orphans. Indeed, the most recent Demographic and Health surveys show that in half of the countries surveyed, orphans are no less likely than nonorphans to be enrolled in school. In Nigeria and Chad, orphans are more likely than other children to be in school.
22. There a re d i f ferent methodolog ica l approaches to measuring inequality of opportunity, including the choice of inequal-ity measure (Gini or MLD), the estimation approach (parametric or nonparametric), and the choice of circumstances to use if the set of circumstances differs across surveys. All circumstances available for each country are used. This choice is the best in analyz-ing a single country, but it poses some dif-ficulties in terms of comparability across countries. There is a trade-off between the robustness and usefulness of the analysis in each country and the demands of com-parability across countries. As the number of circumstances increases, the estimate of inequality of opportunity will also increase. The estimates reported here are based on a nonparametric estimation approach (Fer-reira and Gignoux 2011). The MLD is com-monly used as the measure of inequality in this literature, although some researchers propose using the Gini from a theoreti-cal point of view (van de Gaer and Ramos 2015) and an empirical perspective (Brunori, Palmisano, and Peragine 2015b).
23. If data on these unobserved circumstances were available, the share of inequality attrib-uted to circumstances would go up, as would the level and share of inequality of economic opportunity (though the extent of underes-timation also depends on the degree of cor-relation between unobserved and observed circumstances).
24. This subsection draws on Azomahou and Yitbarek (2015).
25. Related studies include the following: Bossuroy and Cogneau (2013) cover

I N E Q U A L I T Y I N A F R I C A 141
occupational mobility in Côte d’Ivoire in 1985–88 (four waves), Ghana in 1988–2006 (five waves), Guinea in 1995, Madagascar in 1994, and Uganda in 1993; Hertz and oth-ers (2007) examine educational mobility in Ethiopia in 1994, Ghana in 1998, and South Africa in 1998; and Lambert, Ravallion, and van de Walle (2014) analyze occupational mobility in Senegal.
26. These two measures of mobility—the inter-generational gradient and the correlation coefficient—can produce different findings in the same setting. The intergenerational gradient may decline over time (implying more mobility), but the correlation between the educational attainment of a child and parent can remain constant (implying no change in mobility) (Hertz and others 2007). This divergence may result from a reduc-tion in the inequality of schooling in the child’s generation (for example, achieving universal primary education) relative to the parents’ generation and a drop in the persis-tence effect—that is, education in the recent birth cohort has become less dependent on parental schooling than parental education was on the educational attainment of the grandparents.
27. All billionaires included in this analysis are both citizens and residents of the region. Nathan Kirsh, a citizen of Swaziland who resides in London, is thus excluded. Forbes also excludes family fortunes, such as the Chandaria family in Kenya and the Madh-vanis in Uganda, if the wealth is believed to have been dispersed among family members.
28. The Oxfam estimates also draw on the data from Credit Suisse (2014). Because infor-mation on assets and debts from household survey data is rarely available in African countries, estimates for the region are based largely on imputations from other low-income countries. In general, it is difficult to compare assets because the appropriate data are not available. For example, important assets held by the poor, such as landhold-ings, could be undervalued and assets held by the rich may be hidden.
ReferencesAfrica Progress Panel. 2013. Africa Prog-
ress Report 2013: Equity in Extractives;
Stewarding Africa’s Natural Resources for All. Geneva: Africa Progress Panel.
Alvaredo, Facundo, and Thomas Piketty. 2015. “Measuring Top Incomes and Inequality in the Middle East.” Paris School of Economics.
Anand, Sudhir, and Paul Segal. 2015. “The Global Distribution of Income.” In Handbook of Income Distribution, vol. 2, part A, edited by Anthony B. Atkinson and François Bour-guignon, 937–79. Amsterdam: North-Holland.
Asian Development Bank. 2014. Inequality in Asia and the Pacific: Trends, Drivers, and Policy Implications, edited by Ravi Kanbur, Changyong Rhee, and Juzhong Zhuang.
Atkinson, Anthony B., and Andrea Brandolini. 2010. “On Analyzing the World Distribution of Income.” World Bank Economic Review 24 (1): 1–37.
Atkinson, Anthony B., Thomas Piketty, and Emmanuel Saez. 2011. “Top Incomes in the Long Run of History.” Journal of Economic Literature 49 (1): 3–71.
Azomahou, Théophile, and Eleni A. Yitbarek. 2015. “Intergenerational Mobility in Africa: Has Progress Been Inclusive?” Working paper, Maastricht University, Maastricht, the Netherlands.
Bagchi, Sutirtha, and Jan Svejnar. 2015. “Does Wealth Inequality Matter for Growth? The Effect of Billionaire Wealth, Income Distribu-tion, and Poverty.” Journal of Comparative Economics 43 (3): 505–30.
Banerjee, Abhijit, and Thomas Piketty. 2005. “Top Indian Incomes, 1922–2000.” World Bank Economic Review 19 (1): 1–20.
Belhaj Hassine, Nadia, 2015. “Economic Inequal-ity in the Arab Region.” World Development 66: 532–56.
Berg, Andrew, Jonathan D. Ostry, and Jeromin Zettelmeyer. 2012. “What Makes Growth Sustained?” Journal of Development Econom-ics 98 (2): 149–66.
Bhalotra, Sonia, Kenneth Harttgen, and Stephan Klasen. 2015. “The Impact of School Fees on Schooling Outcomes and the Intergenerational Transmission of Education.” University of Bristol, United Kingdom.
Bhorat, Haroon, Karmen Naidoo, and Kavisha Pillay. 2015. “Growth, Poverty and Inequal-ity Interactions in Africa: An Overview of Key Issues.” University of Cape Town, South Africa.
Black, Sandra E., and Paul J. Devereux. 2011. “Recent Developments in Intergenerational

142 P O V E R T Y I N A R I S I N G A F R I C A
Mobility.” In Handbook of Labor Econom-ics, vol. 4, part B, edited by Orley Ashenfel-ter and David Card, 1487–541. San Diego: North-Holland.
Blau, Judith R., and Peter M. Blau. 1982. “The Cost of Inequality: Metropolitan Structure and Violent Crime.” American Sociological Review 47 (1): 114–29.
Blundell, Richard, Luigi Pistaferri, and Ian Pres-ton. 2008. “Consumption Inequality and Par-tial Insurance.” American Economic Review 98 (5): 1887–921.
Bossuroy, Thomas, and Denis Cogneau. 2013. “Social Mobility in Five African Coun-tries.” Review of Income and Wealth 59 (S1): S84–S110.
Bourguignon, François. 2004. “The Poverty-Growth-Inequality Triangle.” ICRIER Work-ing Paper 125, Indian Council for Research on International Economic Relations, New Delhi.
Bruno, Michael, Martin Ravallion, and Lyn Squire. 1998. “Equity and Growth in Devel-oping Countries: Old and New Perspectives on the Policy Issues.” In Income Distribution and High-Quality Growth, edited by Vito Tanzi and Ke-Young Chu, 117–46. Cambridge, MA: MIT Press.
Brunori, Paolo, Francisco H. G. Ferreira, and Vito Peragine. 2013. “Inequality of Opportunity, Income Inequality and Mobility: Some Inter-national Comparisons.” In Getting Devel-opment Right: Structural Transformation, Inclusion and Sustainability in the Post-Crisis Era, edited by Eva Paus, 85–116. Basingstoke, United Kingdom: Palgrave Macmillan.
Brunori, Paolo, Flaviana Palmisano, and Vito Per-agine. 2015a. “Inequality of Opportunity dur-ing the Great Recession in Uganda.” WIDER Working Paper 2015/039, United Nations Uni-versity–World Institute for Development Eco-nomics Research, Helsinki.
———. 2015b. “Inequality of Opportunity in Sub-Saharan Africa.” University of Bari, Italy.
Burgis, Tom. 2015. The Looting Machine. War-lords, Oligarchs, Corporations, Smugglers, and the Theft of Africa’s Wealth. New York: Public Affairs.
Checchi, Daniele, and Vito Peragine. 2010. “Inequality of Opportunity in Italy.” Journal of Economic Inequality 8 (4): 429–50.
Clementi, Fabio, Andrew Dabalen, Vasco Molini, and Francesco Schettino. Forthcoming. “When the Centre Cannot Hold: Patterns of Polarization in Nigeria.” Review of Income and Wealth.
Cobham, Alex, and Andy Sumner. 2013. “Is It All About the Tails? The Palma Measure of Income Inequality.” Center for Global Devel-opment Working Paper 343, Washington, DC.
Cogneau, Denis, and Sandrine Mesplé-Somps. 2008. “Inequality of Opportunity for Income in Five Countries of Africa.” Research on Eco-nomic Inequality 16: 99–128.
Cornia, Giovanni Andrea. 2014. “Income Inequality Levels, Trends and Determinants in Sub-Saharan Africa: An Overview of the Main Changes.” Università degli Studi di Firenze, Florence.
Cowell, Frank A. 2000. “Measurement of Inequality.” In Handbook of Income Distri-bution, vol. 1, edited by Anthony B. Atkinson and François Bourguignon, 87–166. Amster-dam: North-Holland.
Cramer, Christopher. 2005. “Inequality and Conflict: A Review of an Age-Old Concern.” United Nations Identities, Conflict and Cohe-sion Programme Paper 11, United Nations Research Institute for Social Development, Geneva.
Credit Suisse. 2014. Global Wealth Databook 2014. Zürich: Research Institute, Credit Suisse.
Dabalen, Andrew, Ambar Narayan, Jaime Saavedra-Chanduvi, and Alejandro Hoyos Suarez, with Ana Abras and Sailesh Tiwari. 2015. Do African Children Have an Equal Chance? A Human Opportunity Report for Sub-Saharan Africa. Directions in Develop-ment Series. Washington, DC: World Bank.
Davies, James B., Susanna Sandström, Anthony Shorrocks, and Edward N. Wolff. 2011. “The Level and Distribution of Global Household Wealth.” The Economic Journal 121 (551): 223–54.
de la Fuente, Alejandro, Andreas Murr, and Ericka Rascón. 2015. Mapping Subnational Poverty in Zambia. World Bank Group and Republic of Zambia Central Statistical Office.
de Magalhães, Leandro, and Raül Santaeulàlia-Llopis. 2015. “The Consumption, Income, and Wealth of the Poorest: Cross-Sectional Facts of Rural and Urban Sub-Saharan Africa for Macro economists.” Policy Research Working Paper 7337, World Bank, Washington, DC.
Deaton, Angus S. 2005. “Measuring Poverty in a Growing World (or Measuring Growth in a Poor World).” Review of Economics and Sta-tistics 87 (1): 1–19.
Deaton, Angus S., and Salman Zaidi. 2002. “Guidelines for Constructing Consumption

I N E Q U A L I T Y I N A F R I C A 143
Aggregates for Welfare Analysis.” Living Stan-dards Measurement Study Working Paper 135, World Bank, Washington, DC.
Deininger, Klaus, and Lyn Squire. 1996. “A New Data Set Measuring Income Inequality.” World Bank Economic Review 10 (3): 565–91.
De Vreyer, Philippe, and Sylvie Lambert. 2014. “Intra-household Inequalities and Poverty in Senegal.” Unpublished working paper, Paris School of Economics.
De Vreyer, Philippe, Sylvie Lambert, Abla Safir, and Momar B. Sylla. 2008. “Pauvreté et structure familiale: Pourquoi une nouvelle enquête?” Statéco 102.
Díaz-Giménez, Javier, Andy Glover, and José- Víctor Ríos-Rull. 2011. “Facts on the Distribu-tions of Earnings, Income, and Wealth in the United States: 2007 Update.” Federal Reserve Bank of Minneapolis Quarterly Review 34 (1): 2–31.
Easterly, William, and Ross Levine. 1997. “Africa’s Growth Tragedy: Policies and Ethnic Divi-sions.” Quarterly Journal of Economics 112 (4): 1203–50.
Elbers, Chris, Peter Lanjouw, Johan A. Misti-aen, and Berk Özler. 2008. “Reinterpreting Between-Group Inequality.” Journal of Eco-nomic Inequality 6 (3): 231–45.
Ferreira, Francisco H. G., and Jérémie Gignoux. 2011. “The Measurement of Inequality of Opportunity: Theory and an Application to Latin America.” Review of Income and Wealth 57 (4): 622–57.
Ferreira, Francisco H. G., Christoph Lakner, Maria Ana Lugo, and Berk Özler. 2014. “Inequality of Opportunity and Economic Growth: A Cross-Country Analysis.” Policy Research Working Paper 6915, World Bank, Washington, DC.
Ferreira, Francisco, H. G., Julian Messina, Jamele Rigolini, Luis-Felipe López-Calva, Maria Ana Lugo, and Renos Vakis. 2013. Economic Mobility and the Rise of the Latin American Middle Class. Washington, DC: World Bank.
Ferreira, Francisco H. G., and Vito Peragine. 2015. “Equality of Opportunity: Theory and Evidence.” In Handbook of Well Being and Public Policy, edited by Matthew D. Adler and Marc Fleurbaey. New York: Oxford University Press.
Fields, Gary. 2000. “The Dynamics of Poverty, Inequality and Economic Well-being: African Economic Growth in Comparative Perspec-tive.” Journal of African Economies 9 (Supple-ment): 45–78.
Fitz, Nicholas. 2015. “Economic Inequality: It’s Far Worse than You Think.” Scientific Ameri-can March 31.
Fleurbaey, Marc. 2008. Fairness, Responsibility, and Welfare. Oxford, UK: Oxford University Press.
Fleurbaey, Marc, and Vito Peragine. 2013. “Ex Ante versus Ex Post Equality of Opportunity.” Economica 80: 118–30.
Forbes Media. “The World’s Billionaires.” Jersey City, NJ. http://www.forbes.com/billionaires /list/41/#version:static.
Fosu, Augustin Kwasi. 2014. “Growth, Inequal-ity, and Poverty in Sub-Saharan Africa: Recent Progress in a Global Context.” Oxford Devel-opment Studies 43 (1): 44–59.
Gallup World Poll. 2013. http://www.gallup.com /poll/174263/belief-work-ethic-strong-across -africa.aspx.
Gandhi, Aditi, and Michael Walton. 2012. “Where Do India’s Billionaires Get Their Wealth?” Economic & Political Weekly 47 (40): 10–14.
Guénard, Charlotte, and Sandrine Mesplé-Somps. 2010. “Measuring Inequalities: Do Household Surveys Paint a Realistic Picture?” Review of Income and Wealth 56 (3): 519–38.
Hertz, Tom., Tamara Jayasundera, Patrizio Piraino, Sibel Selcuk, Nicole Smith, and Alina Verashchagina. 2007. “The Inheritance of Educational Inequality: International Com-parisons and Fifty-Year Trends.” B.E. Journal of Economic Analysis & Policy 7 (2): 1–46.
Hlasny, Vladimir, and Paolo Verme. 2013. “Top Incomes and the Measurement of Inequality in Egypt.” Policy Research Working Paper 6557, World Bank, Washington, DC.
Hoff, Karla. 2012. “The Effect of Inequality on Aspirations.” Background paper for Address-ing Inequality in South Asia, edited by Martín Rama, Tara Béteille, Yue Li, Pradeep K. Mitra, and John Lincoln Newman. Washington, DC: World Bank.
Huber, John D., and Laura Mayoral. 2014. “Inequality, Ethnicity and Civil Conflict.” Unpublished working paper, Columbia Uni-versity, New York.
Jenkins, Stephen P. 2014. “World Income Inequal-ity Databases: An Assessment of WIID and SWIID.” IZA Discussion Paper 8501, Institute for the Study of Labor, Bonn.
Jirasavetakul, La-Bhus, and Christoph Lakner. 2015. “The African Distribution of Consump-tion Expenditure.” Unpublished working paper, World Bank, Washington, DC.

144 P O V E R T Y I N A R I S I N G A F R I C A
Kanbur, Ravi, and Adam Wagstaff. 2014. “How Useful Is Inequality of Opportunity as a Policy Construct?” Policy Research Working Paper 6980, World Bank, Washington, DC.
Keefer, Philip, and Stephen Knack. 2002. “Polar-ization, Politics and Property Rights: Links between Inequality and Growth.” Public Choice 111: 127–54.
Klasen, Stephan. 2004. “In Search of the Holy Grail: How to Achieve Pro-Poor Growth.” In Toward Pro-Poor Policies: Aid, Institutions, and Globalization, edited by Bertil Tungod-den, Nicholas Stern, and Ivar Kolstad, 63–93. Washington, DC: World Bank.
Knight, Frank. 2015. The Wealth Report 2015: Global Perspectives on Prime Property and Wealth. London.
Korinek, Anton, Johan A. Mistiaen, and Martin Ravallion. 2006. “Survey Nonresponse and the Distribution of Income.” Journal of Eco-nomic Inequality 4 (1): 33–55.
Krueger, Dirk, Fabrizio Perri, Luigi Pistaferri, and Giovanni L. Violante. 2010. “Cross-Sectional Facts for Macroeconomists.” Review of Eco-nomic Dynamics 13 (1): 1–14.
Kuznets, Simon. 1955. “Economic Growth and Income Inequality.” American Economic Review 45 (1): 1–28.
Lakner, Christoph. 2015. “The Ten Richest Africans Own as Much as the Poorest Half of the Continent.” March 11, World Bank, Washington, DC. http://blogs.worldbank.org /developmenttalk/ten-richest-africans-own -much-poorest-half-continent.
Lakner, Christoph, and Branko Milanovic. 2015. “Global Income Distribution: From the Fall of the Berlin Wall to the Great Recession.” World Bank Economic Review. Advance Access pub-lished September 26, 2015.
Lambert, Sylvie, Martin Ravallion, and Domi-nique van de Walle. 2014. “Intergenerational Mobility and Interpersonal Inequality in an African Economy.” Journal of Development Economics 110: 327–44.
Langer, Arnim, and Frances Stewart. 2015. Regional Imbalances, Horizontal Inequali-ties, and Violent Conflicts: Insights from Four West African Countries. Fragility, Conflict, and Violence Group, World Bank, Washing-ton, DC.
Lichbach, Mark Irving. 1989. “An Evaluation of ‘Does Economic Inequality Breed Politi-cal Conflict?’ Studies.” World Politics 41 (4): 431–70.
Linton, Ralph. 1936. The Study of Man. New York: Appleton-Century.
Mansuri, Ghazala, and Vijayendra Rao. 2013. Localizing Development: Does Participation Work? Policy Research Report. Washington, DC: World Bank.
Marrero, Gustavo A., and Juan G. Rodrí-guez. 2013. “Inequality of Opportunity and Growth.” Journal of Development Economics 104: 107–22.
Miguel, Edward, and Mary Kay Gugerty. 2005. “Ethnic Diversity, Social Sanctions, and Public Goods in Kenya.” Journal of Public Econom-ics 89: 2325–68.
Milanovic, Branko. 2005. Worlds Apart: Mea-suring International and Global Inequality. Princeton, NJ: Princeton University Press.
———. 2011. The Haves and the Have-Nots: A Brief and Idiosyncratic History of Global Inequality. New York: Basic Books.
Morival, Elodie. 2011. “Top Incomes and Racial Inequality in South Africa: Evidence from Tax Statistics and Household Surveys, 1993–2008.” Master’s thesis, Paris School of Economics.
New World Wealth. 2014. Wealth in Kenya: The Future of Kenyan HNWIs. Johannesburg.
OECD (Organisation for Economic Co-operation and Development). 2015. In It Together: Why Less Inequality Benefits All. Paris.
Olinto, Pedro, Gabriel Lara Ibarra, and Jaime Saavedra-Chanduvi. 2014. “Accelerating Poverty Reduction in a Less Poor World: The Roles of Growth and Inequality.” Policy Research Working Paper 6855, World Bank, Washington, DC.
Olson, Mancur, Jr. 1965. The Logic of Collec-tive Action: Public Goods and the Theory of Groups. Cambridge, MA: Harvard University Press.
Oxfam International. 2015. “Wealth: Having It All and Wanting More.” Oxfam Issue Briefing (January), Oxford.
Palma, José Gabriel. 2006. “Globalizing Inequal-ity: ‘Centrifugal’ and ‘Centripetal’ Forces at Work.” Revue Tiers-Monde 186: (2): 249–80.
———. 2011. “Homogeneous Middles vs. Hetero-geneous Tails, and the End of the ‘Inverted U’: It’s All about the Share of the Rich.” Develop-ment and Change 42 (1): 87–153.
Paris School of Economics. World Top Incomes Database. http://topincomes.parisschoolof economics.eu/#Database.

I N E Q U A L I T Y I N A F R I C A 145
Pew Research Center. 2013. Despite Challenges, Africans Are Optimistic about the Future, Washington, DC. http://www.pewglobal.org/2013/11/08/despite-challenges-africans -are-optimistic-about-the-future/.
Piketty, Thomas 2014. Capital in the Twenty-First Century. Cambridge, MA: Belknap Press of Harvard University Press.
Pinkovskiy, Maxim, and Xavier Sala-i-Martín. 2014. “Africa Is on Time.” Journal of Eco-nomic Growth 19 (3): 311–38.
Piraino, Patrizio. 2015. “Intergenerational Earn-ings Mobility and Equality of Opportunity in South Africa.” World Development 67: 396–405.
Rama, Martín, Tara Béteille, Yue Li, Pradeep K. Mitra, and John Lincoln Newman. 2015. Addressing Inequality in South Asia. South Asia Development Matters Series. Washing-ton, DC: World Bank.
Ravallion, Martin. 2001. “Growth, Inequal-ity and Poverty: Looking Beyond Averages.” World Development 29 (11): 1803–15.
Roemer, John. 2000. Equality of Opportunity. Cambridge, MA: Harvard University Press.
Roemer, John, and Alain Trannoy. 2015. “Equal-ity of Opportunity” In Handbook of Income Distribution, vol. 2, edited by Anthony B. Atkinson and François Bourguignon, 217–300. Amsterdam: North-Holland.
Santaeulàlia-Llopis, Raül, and Yu Zheng 2015. “The Price of Growth: Consumption Insur-ance in China 1989-2009.” Unpublished work-ing paper, Washington University, St. Louis.
Shepherd, Andrew, Lucy Scott, Chiara Mari-otti, Flora Kessy, Raghav Gaiha, Lucia da Corta, Katharina Hanifnia, and others. 2014. Chronic Poverty Report 2014–2015: The Road to Zero Extreme Poverty. London: Chronic Poverty Advisory Network, Overseas Development Institute.
Solt, Frederick. Forthcoming a. “The Standard-ized World Income Inequality Database.” Social Science Quarterly.
———. Forthcoming b. “On the Assessment and Use of Cross-National Income Inequality Datasets.” Journal of Economic Inequality.
Stewart, Frances, ed. 2008. Horizontal Inequali-ties and Conflict: Understanding Group Vio-lence in Multiethnic Societies. Basingstoke, UK: Palgrave Macmillan.
Stiglitz, Joseph E. 2012. The Price of Inequality: How Today’s Divided Society Endangers Our Future. New York: W. W. Norton.
Strauss, John, Germano Mwabu, and Kathleen Beegle. 2000. “Intra-household Allocations: A Review of Theories and Empirical Evidence.” Journal of African Economies 9 (Supplement 1): 83–143.
Székely, Miguel, and Marianne Hilgert. 2007. “What’s behind the Inequality We Measure? An Investigation Using Latin American Data.” Oxford Development Studies 35 (2): 197–217.
UNDP (United Nations Development Pro-gramme). 2014. Humanity Divided: Con-fronting Inequality in Developing Countries. Bureau for Development Policy. New York: UNDP.
Van de Gaer, Dirk, and Xavier Ramos. 2015. “Measurement of Inequality of Opportunity Based on Counterfactuals.” Paper presented at the Sixth Meeting of the Society for the Study of Economic Inequality (ECINEQ), Luxem-bourg, July 13–15.
World Bank. 2005. World Development Report 2006: Equity and Development. Washington, DC: World Bank.
———. 2011. World Development Report 2012: Gender Equality and Development. Washing-ton, DC: World Bank.
———. 2014a. Africa’s Pulse, vol. 10 (October), Washington, DC: World Bank.
———. 2014b. Taking Stock: An Update on Vietnam’s Recent Economic Developments. Washington, DC: World Bank.