INEOS Bamble, Norway Rønningen Industrial Site INEOS Olefins ...

________________________________________________________________
INEOS GROUP HOLDINGS S.A.
Quarter ended September 30, 2013
________________________________________________________________

INEOS GROUP HOLDINGS INCOME STATEMENT (UNAUDITED)
1
Three-Month Period Ended September 30,
2013 2012 (€ in millions) Revenue ............................................................................................................... 4,049.6 4,394.1 Cost of sales ......................................................................................................... (3,608.5) (3,981.3) Gross profit ......................................................................................................... 441.1 412.8 Distribution costs ................................................................................................. (48.2) (49.6) Administrative expenses ...................................................................................... (80.7) (65.7) Operating profit ................................................................................................. 312.2 297.5 Share of profit of associates and jointly controlled entities using the equity accounting method ............................................................................................... 15.1 32.8 Loss on disposal of business ................................................................................ - (0.2) Profit before net finance costs ........................................................................... 327.3 330.1 Finance income ................................................................................................... 8.6 5.4 Finance costs ........................................................................................................ (104.0) (140.5) Profit before tax ................................................................................................. 231.9 195.0 Tax charge ........................................................................................................... (108.4) (55.8) Profit for the period ........................................................................................... 123.5 139.2

INEOS GROUP HOLDINGS INCOME STATEMENT (UNAUDITED)
2
Nine-Month Period Ended September 30,
2013 2012 (€ in millions)
Revenue ............................................................................................................... 12,767.8 13,491.1 Cost of sales ......................................................................................................... (11,504.0) (12,286.6) Gross profit ......................................................................................................... 1,263.8 1,204.5 Distribution costs ................................................................................................. (167.5) (181.0) Administrative expenses ...................................................................................... (207.6) (184.8) Operating profit ................................................................................................. 888.7 838.7 Share of (loss) / profit of associates and jointly controlled entities using the equity accounting method .................................................................................... 2.8 (25.6) Loss on disposal of business ................................................................................ - (0.2) Profit before net finance costs ........................................................................... 891.5 812.9 Finance income ................................................................................................... 28.0 19.9 Finance costs ....................................................................................................... (391.3) (490.8) Exceptional finance costs ..................................................................................... (121.1) - Profit before tax ................................................................................................. 407.1 342.0 Tax charge ........................................................................................................... (202.1) (128.7) Profit for the period ........................................................................................... 205.0 213.3
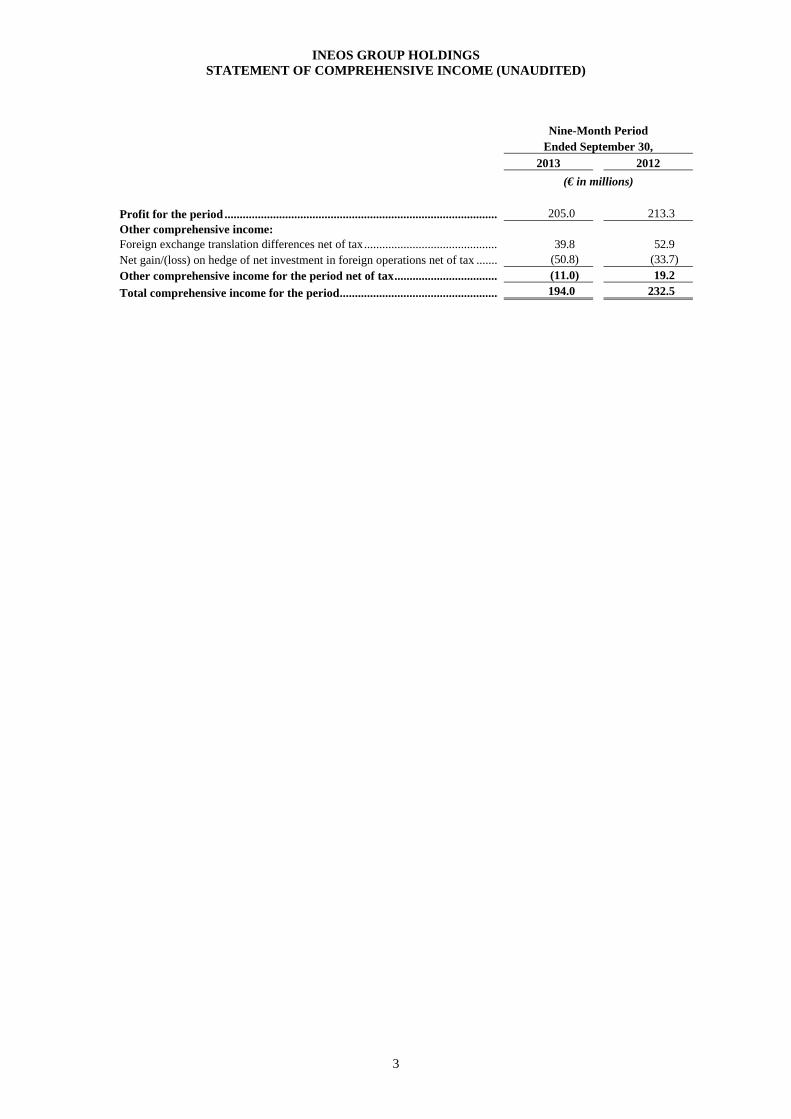
INEOS GROUP HOLDINGS STATEMENT OF COMPREHENSIVE INCOME (UNAUDITED)
3
Nine-Month Period Ended September 30,
2013 2012
(€ in millions) Profit for the period ........................................................................................... 205.0 213.3 Other comprehensive income: Foreign exchange translation differences net of tax ............................................. 39.8 52.9 Net gain/(loss) on hedge of net investment in foreign operations net of tax ........ (50.8) (33.7) Other comprehensive income for the period net of tax ................................... (11.0) 19.2 Total comprehensive income for the period ..................................................... 194.0 232.5

INEOS GROUP HOLDINGS CONSOLIDATED BALANCE SHEETS
4
September 30, 2013 December 31, 2012 (Unaudited) (€ in millions) Non-current assets Property, plant and equipment ............................................................. 3,172.9 3,093.8 Intangible assets ................................................................................... 632.5 673.2 Investments in equity-accounted investees .......................................... 425.6 423.2 Other investments ................................................................................ 181.7 175.9 Other financial assets ........................................................................... 52.1 51.0 Other receivables ................................................................................. 201.8 164.8 Deferred tax assets ............................................................................... 503.3 507.4 5,169.9 5,089.3 Current assets Inventories ........................................................................................... 1,396.8 1,392.2 Trade and other receivables ................................................................. 1,916.9 1,908.7 Other financial assets ........................................................................... - 0.5 Cash and cash equivalents .................................................................... 1,158.1 1,235.4 4,471.8 4,536.8 Total assets ......................................................................................... 9,641.7 9,626.1 Equity attributable to owners of the parent Share capital ......................................................................................... 0.9 0.9 Share premium ..................................................................................... 779.4 779.4 Other reserves ...................................................................................... (1,438.2) (1,427.2) Retained earnings ................................................................................. 93.9 (111.1) Total equity ......................................................................................... (564.0) (758.0) Non-current liabilities Interest-bearing loans and borrowings ................................................. 7,301.0 7,272.2 Trade and other payables ..................................................................... 96.0 120.3 Employee benefits ................................................................................ 692.3 702.5 Provisions ............................................................................................ 9.9 19.4 Deferred tax liabilities .......................................................................... 191.0 170.8 8,290.2 8,285.2 Current liabilities Interest-bearing loans and borrowings ................................................ 31.9 16.7 Trade and other payables ..................................................................... 1,735.5 1,909.0 Tax payable .......................................................................................... 119.4 157.4 Other financial liabilities ...................................................................... 4.3 0.3 Provisions ............................................................................................ 24.4 15.5 1,915.5 2,098.9 Total liabilities .................................................................................... 10,205.7 10,384.1 Total equity and liabilities ................................................................. 9,641.7 9,626.1

INEOS GROUP HOLDINGS CONSOLIDATED STATEMENT OF CHANGES IN EQUITY (UNAUDITED)
5
Share capital
Share premium
Other reserves
Retained earnings
Total equity
(€ in millions) Balance at 31 December 2012 ........ 0.9 779.4 (1,427.2) (111.1) (758.0) Profit for the period ........................ - - - 205.0 205.0 Other comprehensive income: Foreign exchange translation differences ....................................... - - 39.8 - 39.8 Net loss on hedge of net investment in foreign operations ..... - - (50.8) - (50.8) Balance at 30 September 2013 ...... 0.9 779.4 (1,438.2) 93.9 (564.0)
Share capital
Share premium
Other reserves
Retained earnings
Total equity
(€ in millions) Balance at 31 December 2011 ........ 0.9 779.4 (1,303.2) 200.4 (322.5) Profit for the period ........................ - - - 213.3 213.3 Other comprehensive income: Foreign exchange translation differences ....................................... - - 52.9 - 52.9 Net loss on hedge of net investment in foreign operations ..... - - (33.7) - (33.7) Balance at 30 September 2012 ...... 0.9 779.4 (1,284.0) 413.7 (90.0)

INEOS GROUP HOLDINGS STATEMENT OF CASH FLOWS (UNAUDITED)
6
Nine-Month Period
Ended September 30, 2013 2012 (€ in millions) Cash flows from operating activities Profit for the period .............................................................................. 205.0 213.3 Adjustments for: Depreciation and impairment ............................................................... 301.5 367.2 Net finance costs .................................................................................. 484.4 470.9 Share of (profits)/losses of equity-accounted investees ....................... (2.8) 25.6 Loss on disposal of business ................................................................ - 0.2 Tax charge/(credit) ............................................................................... 202.1 128.7 (Increase)/decrease in trade and other receivables ............................... 6.9 (87.2) (Increase)/decrease in inventories ........................................................ (18.6) (72.3) Increase/(decrease) in trade and other payables ................................... (224.9) (72.6) (Decrease)/increase in provisions and employee benefits .................... (25.0) (17.2) Tax received/(paid) .............................................................................. (208.5) (157.1) Net cash from operating activities .................................................... 720.1 799.5 Cash flows from investing activities Proceeds from sale of property, plant and equipment .......................... - - Interest and other finance income received .......................................... 7.8 7.7 Dividends received .............................................................................. 2.8 2.3 Disposal of businesses, net of cash disposed of ................................... 0.1 - Acquisition of subsidiaries, net of cash acquired ................................. - - Acquisition of property, plant and equipment ...................................... (378.9) (337.2) Acquisition of other investments ......................................................... (1.0) - Net cash used in investing activities .................................................. (369.2) (327.2) Cash flows from financing activities Securitisation Facility .......................................................................... - (150.5) Revolving Credit Facility ..................................................................... - (293.0) Proceeds from new Senior Secured Notes ........................................... 1,017.5 1,847.0 Proceeds from new Senior Secured Term Loans ................................. 838.5 2,291.1 Proceeds from Other Loans .................................................................. 14.3 - Redemption of Senior Facilities Agreement ........................................ - (2,863.5) Redemption of Senior Secured Notes .................................................. (735.1) - Redemption of Senior Notes ................................................................ (1,017.1) - Issue costs ............................................................................................ (17.2) (91.7) Interest paid ......................................................................................... (486.3) (575.3) Repayment of loans.............................................................................. (22.0) (12.1) Capital element of finance lease payment ............................................ (1.6) - Net cash used in financing activities ................................................. (409.0) 152.0 Net increase/(decrease) in cash and cash equivalents .......................... (58.1) 624.3 Cash and cash equivalents at 1 January ............................................... 1,235.4 582.4 Effect of exchange rate fluctuations on cash held ................................ (19.2) 11.9 Cash and cash equivalents at September 30 .................................... 1,158.1 1,218.6

INEOS GROUP HOLDINGS NOTES TO THE FINANCIAL STATEMENTS (UNAUDITED)
7
1. BASIS OF PREPARATION In January 2011 the obligations of INEOS Group Holdings plc as Issuer of the Senior Notes Due 2016 were transferred to INEOS Group Holdings S.A. (INEOS Group Holdings or the “Group”), a company registered in Luxembourg. INEOS Group Holdings S.A. is now the parent company for the Group. The Group has used accounting principles for entities under common control for this restructuring and accordingly the consolidated figures have been presented as if INEOS Group Holdings S.A. had always been the parent company for the current and prior periods. The consolidated financial statements include all subsidiaries of the Group. Intra-group transactions and balances have been eliminated on consolidation. The financial and operating results for any period less than a year are not necessarily indicative of the results that may be expected for a full year. The Group does not experience any significant seasonality in its operating results. The accompanying consolidated financial statements of the Group are unaudited. 2. PRINCIPAL ACCOUNTING POLICIES The financial information has been prepared and approved by the directors in accordance with International Financial Reporting Standards (“IFRSs”) as adopted by the European Union in response to the IAS regulation (EC 1606/2002) effective as of September 30, 2013. In compliance with IAS 34, the Company has opted for a condensed scope of reporting in the interim financial statements compared with the consolidated annual financial statements. The accounting policies are set out in the INEOS Group Holdings S.A. annual report for the year ended December 31, 2012.
INEOS GROUP HOLDINGS NOTES TO THE FINANCIAL STATEMENTS (UNAUDITED)
8
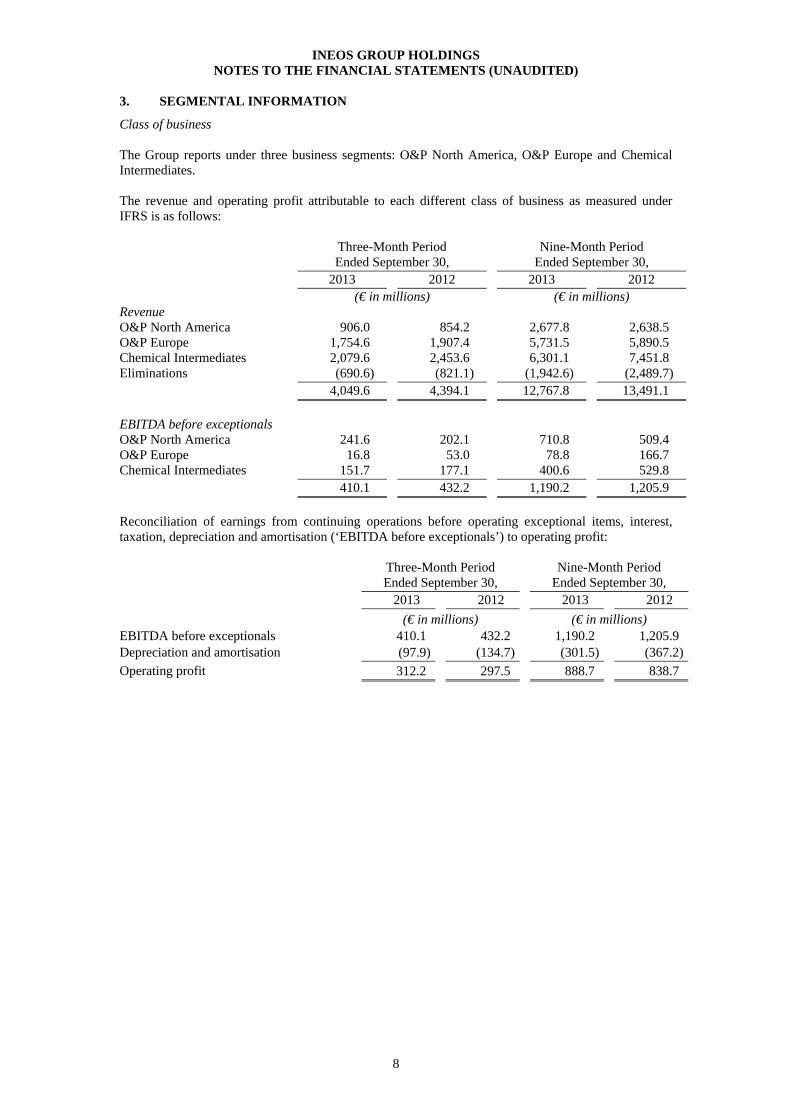
3. SEGMENTAL INFORMATION
Class of business The Group reports under three business segments: O&P North America, O&P Europe and Chemical Intermediates. The revenue and operating profit attributable to each different class of business as measured under IFRS is as follows:
Reconciliation of earnings from continuing operations before operating exceptional items, interest, taxation, depreciation and amortisation (‘EBITDA before exceptionals’) to operating profit:
Three-Month Period Ended September 30,
Nine-Month Period Ended September 30,
2013 2012 2013 2012 (€ in millions) (€ in millions)
EBITDA before exceptionals 410.1 432.2 1,190.2 1,205.9 Depreciation and amortisation (97.9) (134.7) (301.5) (367.2) Operating profit 312.2 297.5 888.7 838.7
Three-Month Period Ended September 30,
Nine-Month Period Ended September 30,
2013 2012 2013 2012 (€ in millions) (€ in millions)
Revenue O&P North America 906.0 854.2 2,677.8 2,638.5 O&P Europe 1,754.6 1,907.4 5,731.5 5,890.5 Chemical Intermediates 2,079.6 2,453.6 6,301.1 7,451.8 Eliminations (690.6) (821.1) (1,942.6) (2,489.7) 4,049.6 4,394.1 12,767.8 13,491.1 EBITDA before exceptionals O&P North America 241.6 202.1 710.8 509.4 O&P Europe 16.8 53.0 78.8 166.7 Chemical Intermediates 151.7 177.1 400.6 529.8 410.1 432.2 1,190.2 1,205.9
INEOS GROUP HOLDINGS NOTES TO THE FINANCIAL STATEMENTS (UNAUDITED)
9
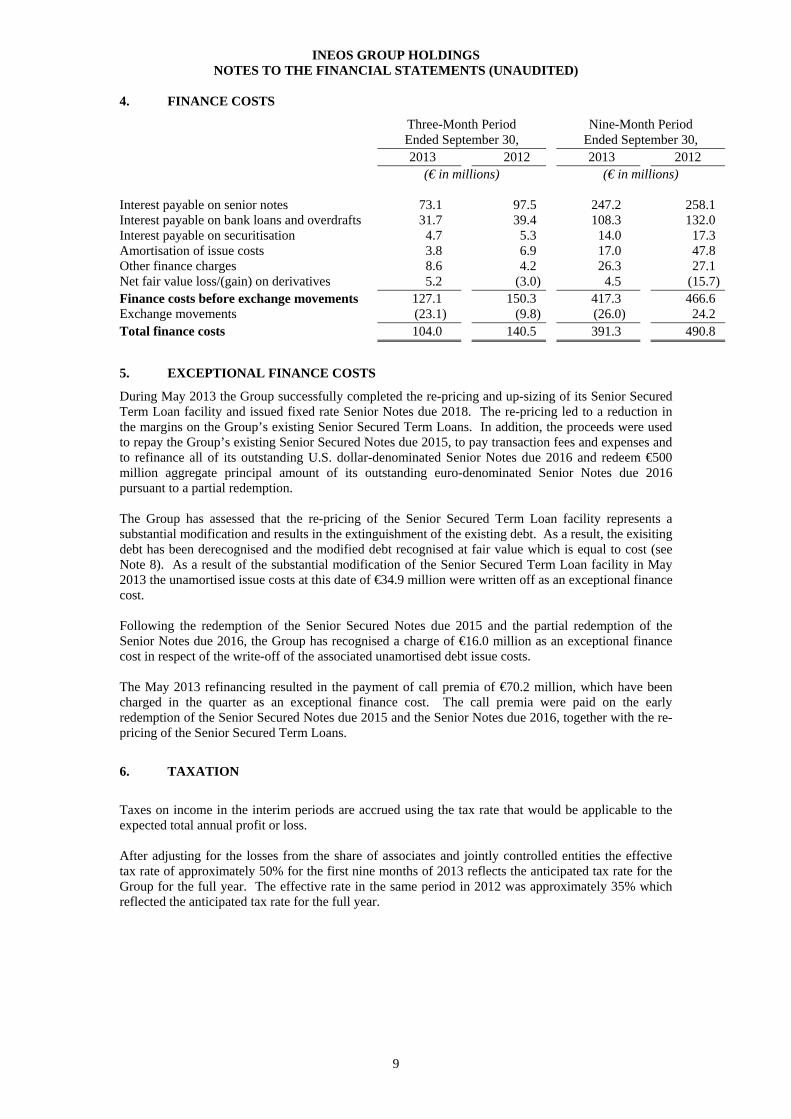
4. FINANCE COSTS
Three-Month Period Ended September 30,
Nine-Month Period Ended September 30,
2013 2012 2013 2012 (€ in millions) (€ in millions)
Interest payable on senior notes 73.1 97.5 247.2 258.1 Interest payable on bank loans and overdrafts 31.7 39.4 108.3 132.0 Interest payable on securitisation 4.7 5.3 14.0 17.3 Amortisation of issue costs 3.8 6.9 17.0 47.8 Other finance charges 8.6 4.2 26.3 27.1 Net fair value loss/(gain) on derivatives 5.2 (3.0) 4.5 (15.7) Finance costs before exchange movements 127.1 150.3 417.3 466.6 Exchange movements (23.1) (9.8) (26.0) 24.2 Total finance costs 104.0 140.5 391.3 490.8
5. EXCEPTIONAL FINANCE COSTS
During May 2013 the Group successfully completed the re-pricing and up-sizing of its Senior Secured Term Loan facility and issued fixed rate Senior Notes due 2018. The re-pricing led to a reduction in the margins on the Group’s existing Senior Secured Term Loans. In addition, the proceeds were used to repay the Group’s existing Senior Secured Notes due 2015, to pay transaction fees and expenses and to refinance all of its outstanding U.S. dollar-denominated Senior Notes due 2016 and redeem €500 million aggregate principal amount of its outstanding euro-denominated Senior Notes due 2016 pursuant to a partial redemption. The Group has assessed that the re-pricing of the Senior Secured Term Loan facility represents a substantial modification and results in the extinguishment of the existing debt. As a result, the exisiting debt has been derecognised and the modified debt recognised at fair value which is equal to cost (see Note 8). As a result of the substantial modification of the Senior Secured Term Loan facility in May 2013 the unamortised issue costs at this date of €34.9 million were written off as an exceptional finance cost. Following the redemption of the Senior Secured Notes due 2015 and the partial redemption of the Senior Notes due 2016, the Group has recognised a charge of €16.0 million as an exceptional finance cost in respect of the write-off of the associated unamortised debt issue costs. The May 2013 refinancing resulted in the payment of call premia of €70.2 million, which have been charged in the quarter as an exceptional finance cost. The call premia were paid on the early redemption of the Senior Secured Notes due 2015 and the Senior Notes due 2016, together with the re-pricing of the Senior Secured Term Loans.
6. TAXATION
Taxes on income in the interim periods are accrued using the tax rate that would be applicable to the expected total annual profit or loss. After adjusting for the losses from the share of associates and jointly controlled entities the effective tax rate of approximately 50% for the first nine months of 2013 reflects the anticipated tax rate for the Group for the full year. The effective rate in the same period in 2012 was approximately 35% which reflected the anticipated tax rate for the full year.

INEOS GROUP HOLDINGS NOTES TO THE FINANCIAL STATEMENTS (UNAUDITED)
10
7. INVENTORIES
September 30, 2013
December 31, 2012
(€ in millions) Raw materials and consumables 459.7 497.4 Work in progress 27.2 28.4 Finished products 909.9 866.4 1,396.8 1,392.2
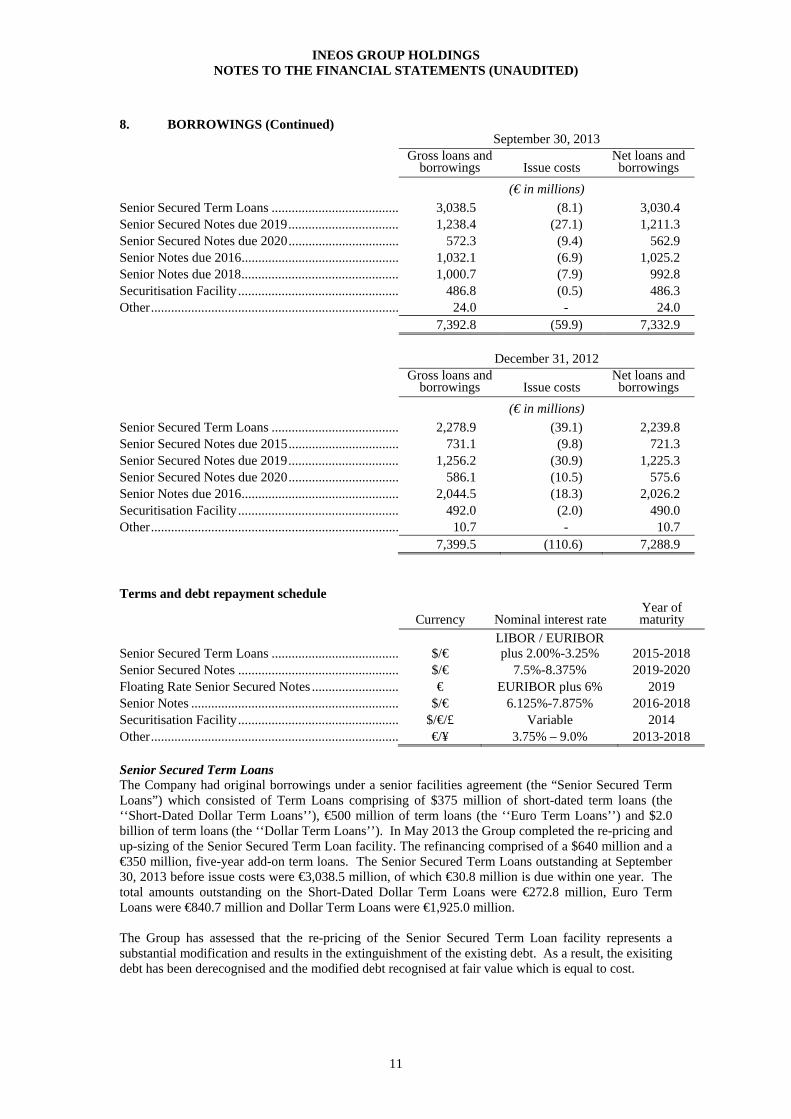
8. BORROWINGS
Borrowing obligations as of September 30, 2013 and December 31, 2012 are as follows:
September 30,
2013 December 31,
2012 (€ in millions) Non-current liabilities Senior Secured Term Loans .......................................................... 3,001.3 2,225.1 Senior Secured Notes due 2015 ..................................................... - 721.3 Senior Secured Notes due 2019 ..................................................... 1,211.3 1,225.3 Senior Secured Notes due 2020 ..................................................... 562.9 575.6 Senior Notes due 2016 ................................................................... 1,025.2 2,026.2 Senior Notes due 2018 ................................................................... 992.8 - Securitisation Facility .................................................................... 486.3 490.0 Finance lease liabilities .................................................................. 6.7 7.6 Other loans .................................................................................... 14.5 1.1 7,301.0 7,272.2
September 30, 2013
December 31, 2012
Current liabilities Current portion of borrowings under Senior Secured Term Loans ............................................................................................. 29.1 14.7 Other loans .................................................................................... 0.9 - Current portion of finance lease liabilities ..................................... 1.9 2.0 31.9 16.7
INEOS GROUP HOLDINGS NOTES TO THE FINANCIAL STATEMENTS (UNAUDITED)
11
8. BORROWINGS (Continued) September 30, 2013
Gross loans and
borrowings Issue costs Net loans and borrowings
(€ in millions) Senior Secured Term Loans ...................................... 3,038.5 (8.1) 3,030.4 Senior Secured Notes due 2019 ................................. 1,238.4 (27.1) 1,211.3 Senior Secured Notes due 2020 ................................. 572.3 (9.4) 562.9 Senior Notes due 2016 ............................................... 1,032.1 (6.9) 1,025.2 Senior Notes due 2018 ............................................... 1,000.7 (7.9) 992.8 Securitisation Facility ................................................ 486.8 (0.5) 486.3 Other .......................................................................... 24.0 - 24.0 7,392.8 (59.9) 7,332.9 December 31, 2012
Gross loans and
borrowings Issue costs Net loans and borrowings
(€ in millions) Senior Secured Term Loans ...................................... 2,278.9 (39.1) 2,239.8 Senior Secured Notes due 2015 ................................. 731.1 (9.8) 721.3 Senior Secured Notes due 2019 ................................. 1,256.2 (30.9) 1,225.3 Senior Secured Notes due 2020 ................................. 586.1 (10.5) 575.6 Senior Notes due 2016 ............................................... 2,044.5 (18.3) 2,026.2 Securitisation Facility ................................................ 492.0 (2.0) 490.0 Other .......................................................................... 10.7 - 10.7 7,399.5 (110.6) 7,288.9
Terms and debt repayment schedule
Currency Nominal interest rate Year of maturity
Senior Secured Term Loans ...................................... $/€ LIBOR / EURIBOR plus 2.00%-3.25% 2015-2018
Senior Secured Notes ................................................ $/€ 7.5%-8.375% 2019-2020 Floating Rate Senior Secured Notes .......................... € EURIBOR plus 6% 2019 Senior Notes .............................................................. $/€ 6.125%-7.875% 2016-2018 Securitisation Facility ................................................ $/€/£ Variable 2014 Other .......................................................................... €/¥ 3.75% – 9.0% 2013-2018 Senior Secured Term Loans The Company had original borrowings under a senior facilities agreement (the “Senior Secured Term Loans”) which consisted of Term Loans comprising of $375 million of short-dated term loans (the ‘‘Short-Dated Dollar Term Loans’’), €500 million of term loans (the ‘‘Euro Term Loans’’) and $2.0 billion of term loans (the ‘‘Dollar Term Loans’’). In May 2013 the Group completed the re-pricing and up-sizing of the Senior Secured Term Loan facility. The refinancing comprised of a $640 million and a €350 million, five-year add-on term loans. The Senior Secured Term Loans outstanding at September 30, 2013 before issue costs were €3,038.5 million, of which €30.8 million is due within one year. The total amounts outstanding on the Short-Dated Dollar Term Loans were €272.8 million, Euro Term Loans were €840.7 million and Dollar Term Loans were €1,925.0 million. The Group has assessed that the re-pricing of the Senior Secured Term Loan facility represents a substantial modification and results in the extinguishment of the existing debt. As a result, the exisiting debt has been derecognised and the modified debt recognised at fair value which is equal to cost.
INEOS GROUP HOLDINGS NOTES TO THE FINANCIAL STATEMENTS (UNAUDITED)
12
8. BORROWINGS (Continued) The Term Loans are to be repaid in equal quarterly installments, in aggregate annual amounts equal to 1% of the original principal amount of the Term Loans. The respective balances of the Euro Term Loans and Dollar Term Loans are payable, subject to certain exceptions, on the date that is nine years after the original Issue Date. The balances of the Short-Dated Dollar Term Loans are payable, subject to certain exceptions, on the date that is three years after the original Issue Date. The Short-Dated Dollar Term Loans mature in May 2015. The Euro Term Loans and the Dollar Term Loans mature in May 2018. The outstanding Euro Term Loans bear interest at a rate per annum equal to EURIBOR (subject to a floor of 1.00% per annum) plus the Applicable Margin and the outstanding Short-Dated Dollar Term Loans and Dollar Term Loans will bear interest a rate per annum equal to LIBOR (subject to a floor of 1.00% per annum) plus the Applicable Margin. The floor was reduced from 1.25% to 1.00% in May 2013. As at September 30, 2013 the Applicable Margin for the Euro Term Loans is 3.25%, the Short-Dated Dollar Term Loans is 2.00% and the Dollar Term Loans is 3.00%. The Applicable Margins were reduced as a result of the re-pricing in May 2013. The Senior Secured Term Loans rank pari passu with the the Senior Secured Notes due 2019 and the Senior Secured Notes due 2020 and are structurally senior to the Senior Notes due 2016 and Senior Notes due 2018. The notes are guaranteed by INEOS Group Holdings S.A., INEOS Holdings Limited and certain of their subsidiaries on a senior secured basis. The Term Loans and the guarantees are secured by first ranking liens on the same assets (subject to certain exceptions) that secure INEOS Holdings Limited’s obligations under the senior secured notes. The Term Loans have numerous customary operating and financial incurrence covenants including covenants relating to, among other things, limitations on indebtedness, ability to give guarantees, creation of security interests, making acquisitions and investments, disposing of assets and paying dividends. The Term Loans have no financial maintenance covenants. As a result of the substantial modification of the Senior Secured Term Loan facility in May 2013 the unamortised debt issue costs at this date of €34.9 million were written off as an exceptional finance cost (see Note 5). The new issue costs relating to the up-sizing of the facility have been capitalised, therefore the Term Loans are stated net of debt issue costs of €8.1 million (December 31, 2012: €39.1 million). These costs are allocated to the profit and loss account over the term of the Term Loans in accordance with IAS 39 – Financial Instruments: Recognition and Measurement. Senior Facilities Agreement The Company had borrowings under a facilities agreement (the “Senior Facilities Agreement”) which consisted of Term Loans (“Term Loan A”, “Term Loan B”, “Term Loan C” and “Term Loan D”), and a revolving credit facility (the “Revolving Credit Facility”). Term Loan A, Term Loan B, Term Loan C, Term Loan D and the Revolving Credit Facility are now fully repaid. In February 2012 the Group issued $1,000 million Senior Secured Notes due 2019 and €500 million Floating Rate Notes due 2019. The net proceeds from the notes were used to repay all of the Term Loan B and a proportion of Term Loan C. In May 2012 the Group issued $775 million Senior Secured Notes due 2020 and a new Senior Secured Term Loan totalling $3,025 million. The net proceeds from the notes and the term loan were used to repay all of the outstanding Term Loan C, Term Loan D and Revolving Credit Facility indebtedness under the Senior Facilities Agreement, including the associated PIK interest.

INEOS GROUP HOLDINGS NOTES TO THE FINANCIAL STATEMENTS (UNAUDITED)
13
8. BORROWINGS (Continued) Senior Secured Notes due 2015 In May 2013 the Senior Secured Notes due 2015 were fully redeemed from the proceeds of the additional Term Loans. The Senior Secured Notes due 2015 were listed on the Luxembourg Stock Exchange and comprised of €300.0 million (December 31, 2012: €300.0 million) Senior Secured Notes due 2015 (the “Secured Euro Notes”) and $570.0 million (December 31, 2012: $570.0 million) Senior Secured Notes due 2015 (the “Secured Dollar Notes”). The Senior Secured Notes due 2015 beared interest at 9.25% per annum for the Secured Euro Notes and 9.0% for the Secured Dollar Notes, payable semi-annually in arrears on May 15 and November 15 of each year. Following the redemption of the Senior Secured Notes due 2015, the Group has recognised a charge of €8.1 million as an exceptional finance cost in respect of the write-off of the associated unamortised debt issue costs (see Note 5). The debt issue costs at December 31, 2012 were €9.8 million. Senior Secured Notes due 2019 The Senior Secured Notes due 2019 are listed on the Luxembourg Stock Exchange and comprise €500.0 million Floating Rate Senior Secured Notes due 2019 (the “2019 Euro Floating Rate Notes”) and $1,000.0 million Senior Secured Notes due 2019 (the “2019 Dollar Fixed Rate Notes”). The 2019 Euro Floating Rate Notes bear interest at a rate per annum, reset quarterly, equal to the sum of (i) the greater of (x) three-month EURIBOR and (y) 1.25% per annum plus (ii) 6.0%. Interest on the 2019 Euro Floating Rate Notes is payable quarterly in arrears on February 15, May 15, August 15 and November 15 of each year, beginning May 15, 2012. The 2019 Dollar Fixed Rate Notes bear interest at a rate of 8.375% per annum. Interest on the 2019 Dollar Fixed Rate Notes is payable semi-annually in arrears on February 15 and August 15 of each year, beginning August 15, 2012. Unless previously redeemed as noted below, the Senior Secured Notes will be redeemed by the Group at their principal amount on February 15, 2019. The 2019 Euro Floating Rate Notes will be subject to redemption at any time on or after February 15, 2015, at the option of the 2019 Notes Issuer, in whole or in part, at the following redemption prices (expressed as percentages of the aggregate principal amount), if redeemed during the 12-month period beginning on February 15 of the year indicated below:
Year
2019 Euro Floating Rate
Notes Redemption
Price 2015 .................................................................................................................................. 102.000% 2016 .................................................................................................................................. 101.000% 2017 and thereafter ........................................................................................................... 100.000%
The 2019 Dollar Fixed Rate Notes will be subject to redemption at any time on or after February 15, 2015, at the option of the 2019 Notes Issuer, in whole or in part, at the following redemption prices (expressed as percentages of the aggregate principal amount), if redeemed during the 12-month period beginning on February 15 of the year indicated below:
Year
2019 Dollar Fixed Rate
Notes Redemption
Price 2015 .................................................................................................................................. 106.281% 2016 .................................................................................................................................. 104.188% 2017 .................................................................................................................................. 102.094% 2018 and thereafter ........................................................................................................... 100.000%
INEOS GROUP HOLDINGS NOTES TO THE FINANCIAL STATEMENTS (UNAUDITED)
14
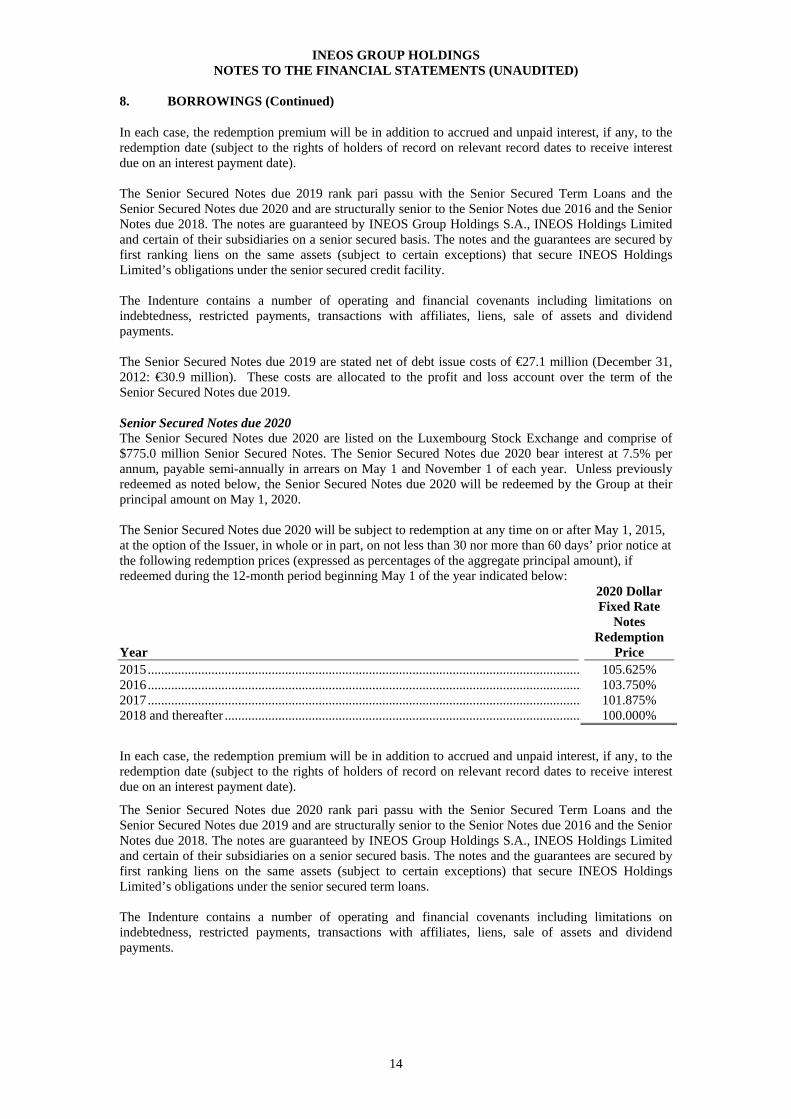
8. BORROWINGS (Continued)
In each case, the redemption premium will be in addition to accrued and unpaid interest, if any, to the redemption date (subject to the rights of holders of record on relevant record dates to receive interest due on an interest payment date). The Senior Secured Notes due 2019 rank pari passu with the Senior Secured Term Loans and the Senior Secured Notes due 2020 and are structurally senior to the Senior Notes due 2016 and the Senior Notes due 2018. The notes are guaranteed by INEOS Group Holdings S.A., INEOS Holdings Limited and certain of their subsidiaries on a senior secured basis. The notes and the guarantees are secured by first ranking liens on the same assets (subject to certain exceptions) that secure INEOS Holdings Limited’s obligations under the senior secured credit facility. The Indenture contains a number of operating and financial covenants including limitations on indebtedness, restricted payments, transactions with affiliates, liens, sale of assets and dividend payments. The Senior Secured Notes due 2019 are stated net of debt issue costs of €27.1 million (December 31, 2012: €30.9 million). These costs are allocated to the profit and loss account over the term of the Senior Secured Notes due 2019. Senior Secured Notes due 2020 The Senior Secured Notes due 2020 are listed on the Luxembourg Stock Exchange and comprise of $775.0 million Senior Secured Notes. The Senior Secured Notes due 2020 bear interest at 7.5% per annum, payable semi-annually in arrears on May 1 and November 1 of each year. Unless previously redeemed as noted below, the Senior Secured Notes due 2020 will be redeemed by the Group at their principal amount on May 1, 2020. The Senior Secured Notes due 2020 will be subject to redemption at any time on or after May 1, 2015, at the option of the Issuer, in whole or in part, on not less than 30 nor more than 60 days’ prior notice at the following redemption prices (expressed as percentages of the aggregate principal amount), if redeemed during the 12-month period beginning May 1 of the year indicated below:
Year
2020 Dollar Fixed Rate
Notes Redemption
Price 2015 .................................................................................................................................. 105.625% 2016 .................................................................................................................................. 103.750% 2017 .................................................................................................................................. 101.875% 2018 and thereafter ........................................................................................................... 100.000%
In each case, the redemption premium will be in addition to accrued and unpaid interest, if any, to the redemption date (subject to the rights of holders of record on relevant record dates to receive interest due on an interest payment date).
The Senior Secured Notes due 2020 rank pari passu with the Senior Secured Term Loans and the Senior Secured Notes due 2019 and are structurally senior to the Senior Notes due 2016 and the Senior Notes due 2018. The notes are guaranteed by INEOS Group Holdings S.A., INEOS Holdings Limited and certain of their subsidiaries on a senior secured basis. The notes and the guarantees are secured by first ranking liens on the same assets (subject to certain exceptions) that secure INEOS Holdings Limited’s obligations under the senior secured term loans. The Indenture contains a number of operating and financial covenants including limitations on indebtedness, restricted payments, transactions with affiliates, liens, sale of assets and dividend payments.

INEOS GROUP HOLDINGS NOTES TO THE FINANCIAL STATEMENTS (UNAUDITED)
15
8. BORROWINGS (Continued)
The Senior Secured Notes due 2020 are stated net of debt issue costs of €9.4 million (December 31, 2012: €10.5 million). These costs are allocated to the profit and loss account over the term of the Senior Secured Notes due 2020. Senior Notes due 2016 The Group used the proceeds from the Senior Notes due 2018 to refinance all of its outstanding U.S. dollar-denominated Senior Notes due 2016 on May 15, 2013 and redeem €500 million aggregate principal amount of its outstanding euro-denominated Senior Notes due 2016 pursuant to a partial redemption (redemption date of June 5, 2013). The Senior Notes due 2016 are listed on the Luxembourg Stock Exchange and comprise €1,032.1 million (December 31, 2012: €1,532.1 million) Senior Notes due 2016 (the “Euro Notes”) and $nil million (December 31, 2012: $677.5 million) Senior Notes due 2016 (the “Dollar Notes”) following the May 2013 refinancing. The Senior Notes due 2016 bear interest at 7.875% per annum for the Euro Notes payable semi-annually in arrears on 15 February and 15 August of each year. Unless previously redeemed as noted below, the Senior Notes due 2016 will be redeemed by the Group at their principal amount on 15 February 2016. The Senior Notes due 2016 are subject to redemption at the option of the Group, in whole or in part, at the following redemption prices (expressed as percentages of the principal amount), if redeemed during the 12-month period beginning 15 February of the years indicated below:
Year
Euro Notes Redemption
Price 2013 .................................................................................................................................. 101.313% 2014 and thereafter ........................................................................................................... 100.000% In each case, the redemption premium will be in addition to accrued and unpaid interest, if any, to the redemption date (subject to the rights of holders of record on relevant record dates to receive interest due on an interest payment date.
The Senior Notes due 2016 are secured by junior pledges of all of the shares of INEOS Holdings Limited. The Senior Notes due 2016 are guaranteed by INEOS Holdings Limited and its material operating subsidiaries on an unsecured senior subordinated basis. Such guarantees only become due 179 days after an event of default on the Senior Notes due 2016 has occurred or earlier under certain circumstances. The Indenture contains a number of operating and financial covenants including limitations on indebtedness, restricted payments, transactions with affiliates, liens, sale of assets and dividend payments.
Following the partial redemption of the Senior Notes due 2016 the Group has recognised a charge of €7.9 million as an exceptional finance cost in respect of the write-off of the associated unamortised debt issue costs (see Note 5). The remaining Senior Notes due 2016 are stated net of debt issue costs of €6.9 million (December 31, 2012: €18.3 million). These costs are allocated to the profit and loss account over the term of the Senior Notes due 2016. Senior Notes due 2018 The Senior Notes due 2018 are listed on the Luxembourg Stock Exchange and comprise €500 million Senior Notes due 2018 (the “Euro Notes”) and $678 million Senior Notes due 2018 (the “Dollar Notes”). The Senior Notes due 2018 bear interest at 6.50% per annum for the Euro Notes and 6.125% for the Dollar Notes, payable semi-annually in arrears on 15 February and 15 August of each year. Unless previously redeemed as noted below, the Senior Notes due 2018 will be redeemed by the Group at their principal amount on 15 August 2018. The Senior Notes due 2018 are subject to redemption at the option of the Group, in whole or in part, at the following redemption prices (expressed as percentages of the principal amount), if redeemed during the 12-month period beginning 15 February of the years indicated below:

INEOS GROUP HOLDINGS NOTES TO THE FINANCIAL STATEMENTS (UNAUDITED)
16
8. BORROWINGS (Continued)
Year Euro Notes
redemption price Dollar Notes
redemption price 2015 ........................................................................................... 103.250% 103.063% 2016 ........................................................................................... 101.625% 101.531% 2017 and thereafter .................................................................... 100.000% 100.000% In each case, the redemption premium will be in addition to accrued and unpaid interest, if any, to the redemption date (subject to the rights of holders of record on relevant record dates to receive interest due on an interest payment date).
The Senior Notes due 2018 are secured by junior pledges of all of the shares of INEOS Holdings Limited. The Senior Notes due 2018 are guaranteed by INEOS Holdings Limited and its material operating subsidiaries on an unsecured senior subordinated basis. Such guarantees only become due 179 days after an event of default on the Senior Notes due 2018 has occurred or earlier under certain circumstances. The Indenture contains a number of operating and financial covenants including limitations on indebtedness, restricted payments, transactions with affiliates, liens, sale of assets and dividend payments.
The Senior Notes due 2018 are stated net of debt issue costs of €7.9 million. These costs are allocated to the profit and loss account over the term of the Senior Notes due 2018. Receivables Securitisation Facility The Company has entered into a €1,200 million receivables securitisation facilities agreement (“Receivables Securitisation Facility”) which matures in December 2014. The total amount outstanding at September 30, 2013 was €494.1 million (December 31, 2012: €492.0 million). The Receivables Securitisation Facility is stated net of debt issue costs of €0.5 million (December 31, 2012: €2.0 million).
9. CONTINGENCIES
The Company is subject to various proceedings instituted by governmental authorities arising under the provisions of applicable laws or regulations relating to the discharge of materials into the environment or otherwise relating to the protection of the environment. In management’s opinion, none of the proceedings is material to the financial condition or results of operation of the Company. 10. RELATED PARTIES
Mr JA Ratcliffe, Mr AC Currie and Mr J Reece are shareholders in INEOS AG. INEOS AG provides operational management services to the Group through a management services agreement. INEOS AG management fees of €19.1 million (September 30, 2012: €18.6 million) were charged to the income statement during the three month period ended September 30, 2013. As at September 30, 2013 amounts owed to INEOS AG were €24.1 million (September 30, 2012: €28.7 million). Amounts due from INEOS Group AG, a wholly owned subsidiary of INEOS AG, were €12.2 million (September 30, 2012: €0.1 million). INEOS AG owns and controls a number of operating subsidiaries that are not included in the INEOS Group Holdings S.A. group, including Kerling plc and INEOS Industries Limited. During the three month period ended September 30, 2013 the Group has made sales to these subsidiaries of €94.2 million (September 30, 2012: €204.2 million), recovered costs of €6.6 million (September 30, 2012: €6.7 million) and made purchases of €18.8 million (September 30, 2012: €2.8 million). As at September 30, 2013, €213.2 million (September 30, 2012: €187.3 million) was owed by and €15.5 million (September 30, 2012: €23.4 million) was owed to these subsidiaries.

INEOS GROUP HOLDINGS NOTES TO THE FINANCIAL STATEMENTS (UNAUDITED)
17
10. RELATED PARTIES (Continued)
There were a number of transactions with joint ventures, all of which arose in the normal course of business. The Refining joint ventures are between PetroChina and INEOS Investments (Jersey) Limited, a related party. During the three month period ended September 30, 2013 the Group has made sales to the Refining joint ventures of €70.1 million (September 30, 2012: €201.4 million), recovered costs of €0.8 million (September 30, 2012: €3.2 million) and made purchases of €265.5 million (September 30, 2012: €693.2 million). As at September 30, 2013, €31.2 million (September 30, 2012: €58.8 million) was owed by the Refining joint ventures and €41.6 million (September 30, 2012: €68.9 million) was owed to the Refining joint ventures.
Styrolution is a joint venture between INEOS and BASF. During the three month period ended September 30, 2013 the Group has made sales to the Styrolution joint venture of €57.5 million (September 30, 2012: €93.0 million), recovered costs of €2.7 million (September 30, 2012: €5.3 million) and made purchases of €3.8 million (September 30, 2012: €26.4 million). As at September 30, 2013, €39.6 million (September 30, 2012: €64.8 million) was owed by the Styrolution joint venture and €1.4 million (September 30, 2012: €nil million) was owed to the Styrolution joint venture. During the three month period ended September 30, 2013 the Group has made sales to other joint ventures of €nil million (September 30, 2012: €2.9 million), recovered costs of €32.0 million (September 30, 2012: €nil million) and made purchases of €51.6 million (September 30, 2012: €22.8 million). As at September 30, 2013, €57.4 million (September 30, 2012: €36.6 million) was owed by other joint ventures and €19.3 million (September 30, 2012: €24.0 million) was owed to other joint ventures.
11. SUBSEQUENT EVENTS
On October 1, 2013 the Group transferred the net assets (including pension liabilities) and business of the Grangemouth petrochemical operations to a new subsidiary of Ineos AG, a related party. The business has now re-domiciled in the UK to enable it to be eligible for support under the UK government’s Infrastructure Loan Guarantee Scheme. The transfer out of the Group was completed at a fair value of €nil. The operations at Grangemouth have been losing cash for the past four years due to a combination of a high fixed cost base at the site and a decline in suitable feedstock supplies. A Survival Plan for the business has now been implemented to improve the cost base and invest in new infrastructure to allow the site to import gas from the US by 2016. The Survival Plan will require a total investment of €350 million over the next three years, including €150 million to build the infrastructure needed for gas imports. As part of this Plan, the Group has put in place a €200 million revolving credit facility from the Group to the Grangemouth petrochemical business to fund the ongoing operations and investments required at the site. This facility matures on June 30, 2020 and is secured on the assets of the Grangemouth petrochemical business.
INEOS GROUP HOLDINGS
18
FORWARD-LOOKING STATEMENTS The Company includes “forward-looking statements,” within the meaning of the US securities laws, based on our current expectations and projections about future events, including: • Our high degree of leverage and significant debt service obligations as well as future cash flow and
earnings; • Our ability to deleverage through strategic disposals of certain assets and non-core businesses; • Our sales growth across our principal businesses and our strategy for controlling costs, growing
margins, increasing manufacturing capacity and production levels and making capital expenditures;
• Raw material costs or supply arrangements; • Our technological and manufacturing assets and our ability to utilise them to further increase sales
and the profitability of our businesses; • Our ability to retain existing customers and obtain new customers; • Our ability to develop new products and technologies successfully; • The cyclical and highly competitive nature of our businesses; • Risks related to environmental costs, liabilities or claims; and • Currency fluctuations. All statements other than statements of historical facts included in this report including, without limitation, statements regarding our future financial position, risks and uncertainties related to our business and the notes, strategy, capital expenditures, projected costs and our plans and objectives for future operations, may be deemed to be forward-looking statements. These forward-looking statements are subject to a number of risks and uncertainties. Words such as “believe,” “expect,” “anticipate,” “may,” “intend,” “will,” “should,” “estimate” and similar expressions or the negatives of these expressions are intended to identify forward-looking statements. In addition, from time to time we or our representatives, acting in respect of information provided by us, have made or may make forward-looking statements orally or in writing and these forward-looking statements may be included in but are not limited to press releases (including on our website), reports to our security holders and other communications. Although we believe that the expectations reflected in such forward-looking statements are reasonable, we can give no assurance that such expectations will prove to be correct. We undertake no obligation to publicly update or revise any forward-looking statements, whether as a result of new information, future events or otherwise.
INEOS GROUP HOLDINGS OPERATING AND FINANCIAL REVIEW AND PROSPECTS
19
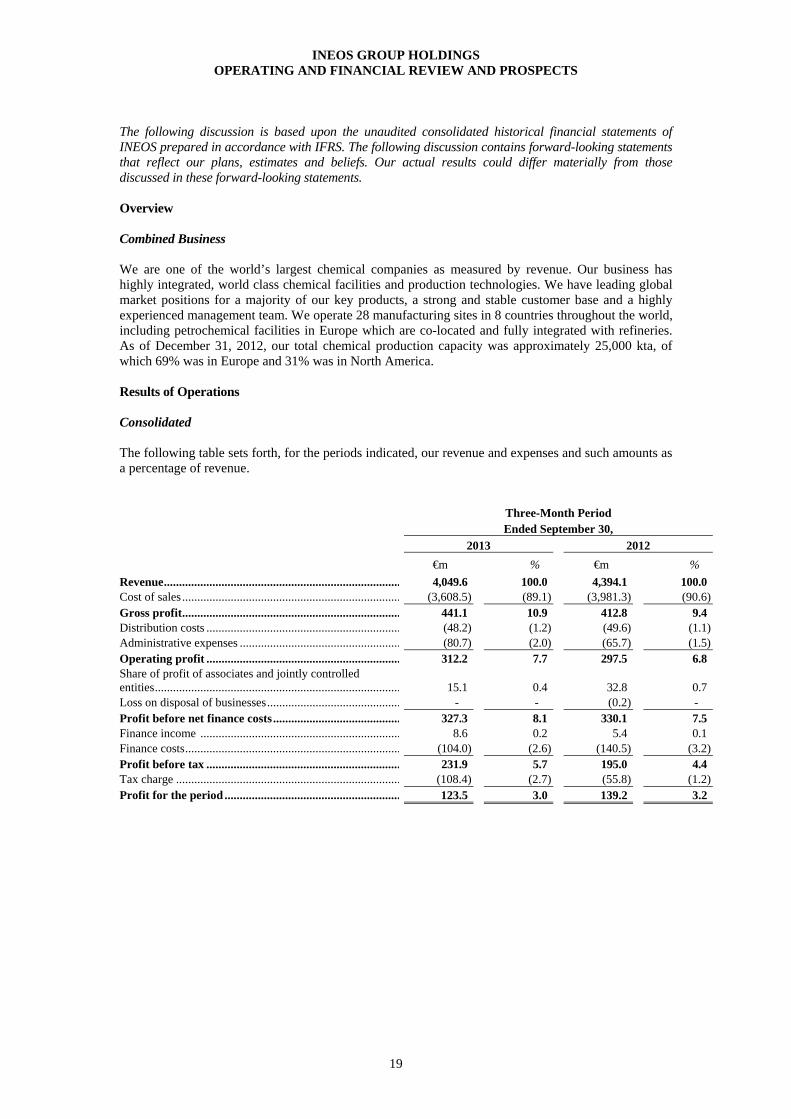
The following discussion is based upon the unaudited consolidated historical financial statements of INEOS prepared in accordance with IFRS. The following discussion contains forward-looking statements that reflect our plans, estimates and beliefs. Our actual results could differ materially from those discussed in these forward-looking statements. Overview Combined Business We are one of the world’s largest chemical companies as measured by revenue. Our business has highly integrated, world class chemical facilities and production technologies. We have leading global market positions for a majority of our key products, a strong and stable customer base and a highly experienced management team. We operate 28 manufacturing sites in 8 countries throughout the world, including petrochemical facilities in Europe which are co-located and fully integrated with refineries. As of December 31, 2012, our total chemical production capacity was approximately 25,000 kta, of which 69% was in Europe and 31% was in North America. Results of Operations Consolidated The following table sets forth, for the periods indicated, our revenue and expenses and such amounts as a percentage of revenue.
Three-Month Period Ended September 30,
2013 2012 €m % €m %
Revenue .............................................................................. 4,049.6 100.0 4,394.1 100.0 Cost of sales ........................................................................ (3,608.5) (89.1) (3,981.3) (90.6) Gross profit ........................................................................ 441.1 10.9 412.8 9.4 Distribution costs ................................................................ (48.2) (1.2) (49.6) (1.1) Administrative expenses ..................................................... (80.7) (2.0) (65.7) (1.5) Operating profit ................................................................ 312.2 7.7 297.5 6.8 Share of profit of associates and jointly controlled entities ................................................................................. 15.1 0.4 32.8 0.7 Loss on disposal of businesses ............................................ - - (0.2) - Profit before net finance costs .......................................... 327.3 8.1 330.1 7.5 Finance income .................................................................. 8.6 0.2 5.4 0.1 Finance costs ....................................................................... (104.0) (2.6) (140.5) (3.2) Profit before tax ................................................................ 231.9 5.7 195.0 4.4 Tax charge .......................................................................... (108.4) (2.7) (55.8) (1.2) Profit for the period .......................................................... 123.5 3.0 139.2 3.2
INEOS GROUP HOLDINGS OPERATING AND FINANCIAL REVIEW AND PROSPECTS
20
Three-Month Period Ended September 30, 2013, Compared to Three-Month Period Ended September 30, 2012 Revenue. Revenue decreased by €344.5 million, approximately 7.8%, to €4,049.6 million in the three month period ended September 30, 2013 as compared to €4,394.1 million for the same period in 2012. The decrease in revenues was primarily driven by lower sales volumes in the third quarter of 2013 as compared to the same period in 2012. Volumes decreased significantly in the Phenol business, driven primarily by lower demand in the domestic markets as well as lower export shipments. In addition the partial closure of the cracker in Lavera during the third quarter of 2013 has continued to constrain volumes. The decrease was partially offset by increased volumes within the O&P North America segment, driven by increased ethylene sales in the quarter. Sales prices were relatively flat overall in line with flat crude oil prices, which averaged $110/bbl for both the three month periods ended June 30, 2013 and 2012. Cost of sales. Cost of sales decreased by €372.8 million, approximately 9.4%, to €3,608.5 million in the three month period ended September 30, 2013 as compared to €3,981.3 million for the same period in 2012. The decrease in cost of sales follows the decrease in sales volumes in the three month period ended September 30, 2013 as compared to same period in 2012. Gross profit. Gross profit increased by €28.3 million, approximately 6.9%, to €441.1 million in the three month period ended September 30, 2013 as compared to €412.8 million for the same period in 2012. The increase reflects the improved margins in O&P North America in the third quarter of 2013 as compared to the same period in 2012, following high cracker operating rates and top of cycle margins as the business again benefited from its flexibility to be able to utilise cheaper NGL feedstocks to maintain healthy margins. Partially offsetting this increase was the the adverse impact of the fire on a compressor at the cracker in Lavera in December 2012. The partial closure of the cracker in the quarter adversely impacted the results in the three month period ended September 30, 2013 by approximately €27 million. In addition O&P Europe margins declined further in the quarter as the weakness in the butadiene market due to depressed European tyre demand has led to a decline in margins in the third quarter of 2013 as compared to the same period in 2012. Distribution costs. Distribution costs decreased by €1.4 million, approximately 2.8%, to €48.2 million in the three month period ended September 30, 2013 as compared to €49.6 million for the same period in 2012. The decrease in distribution costs is primarily due to lower sales volumes in the third quarter of 2013 as compared to same period in 2012. Administrative expenses. Administrative expenses increased by €15.0 million, approximately 22.8%, to €80.7 million in the three month period ended September 30, 2013 as compared to €65.7 million for the same period in 2012. The increase in administrative expenses is primarily due to improved employee performance bonuses in North America and higher pension costs in Germany. Operating profit. Operating profit increased by €14.7 million, approximately 4.9%, to €312.2 million for the three month period ended September 30, 2013 as compared to €297.5 million for the same period in 2012. Share of profit of associates and jointly controlled entities. Share of profit of associates and jointly controlled entities was a profit of €15.1 million for the three month period ended September 30, 2013 as compared to a profit of €32.8 million for the same period in 2012. The share of profit primarily reflects our share of the results of the Refining joint venture with PetroChina. European refining margins were weak in the third quarter of 2013, reflecting the continued soft demand trend across the continent. Loss on disposal of businesses. Loss on disposal of businesses was €nil million for the three month period ended September 30, 2013 as compared to a loss of €0.2 million for the same period in 2012. Profit before net finance costs. Profit before net finance costs decreased by €2.8 million, approximately 0.8%, to €327.3 million for the three month period ended September 30, 2013 as compared to €330.1 million for the same period in 2012.

INEOS GROUP HOLDINGS OPERATING AND FINANCIAL REVIEW AND PROSPECTS
21
Finance income. Finance income increased by €3.2 million to €8.6 million for the three month period ended September 30, 2013 as compared to €5.4 million for the same period in 2012. The income in the third quarter of 2013 primarily relates to interest income on the Group’s investment in INEOS Investments Partnership and interest income from related parties. Finance costs. Finance costs decreased by €36.5 million to €104.0 million for the three month period ended September 30, 2013 as compared to €140.5 million for the same period in 2012. The decrease in finance costs primarily reflects an increase in foreign exchange gains associated with short term intra group funding which was a gain of €23.1 million in the third quarter of 2013, as compared to a gain of €9.8 million in the same period in 2012. In addition lower interest rates on the Group’s debt following the refinancing in May 2013 have resulted in a decrease in finance costs as compared to the same period in 2012. The weighted average interest rate of the Group’s debt has reduced from 7.3% to 5.8%. Profit before tax. Profit before tax increased by €36.9 million, to a profit of €231.9 million for the three month period ended September 30, 2013 as compared to a profit of €195.0 million for the same period in 2012. Tax charge. Tax charge increased by €52.6 million to a charge of €108.4 million for the three month period ended September 30, 2013 as compared to a charge of €55.8 million for the same period in 2012 due to an increase in the effective tax rate due to the mix of profitability across the regions within the Group during the quarter. Profits have generally been made in regions with significantly higher rates than the standard rate in Luxembourg of 28.8% (such as Canada and USA), whilst losses have been made in regions with lower rates than the standard rate (such as Switzerland). After adjusting for the losses from the share of associates and jointly controlled entities, the effective tax rate of approximately 50% for the third quarter of 2013 reflects the anticipated tax rate for the Group for the full year. The effective rate in the third quarter of 2012 was approximately 35%, which reflected the anticipated tax rate for the full year for 2012. Profit for the period. Profit for the period decreased by €15.7 million to a profit of €123.5 million for the three month period ended September 30, 2013 as compared to a profit of €139.2 million for the same period in 2012.
INEOS GROUP HOLDINGS OPERATING AND FINANCIAL REVIEW AND PROSPECTS
22
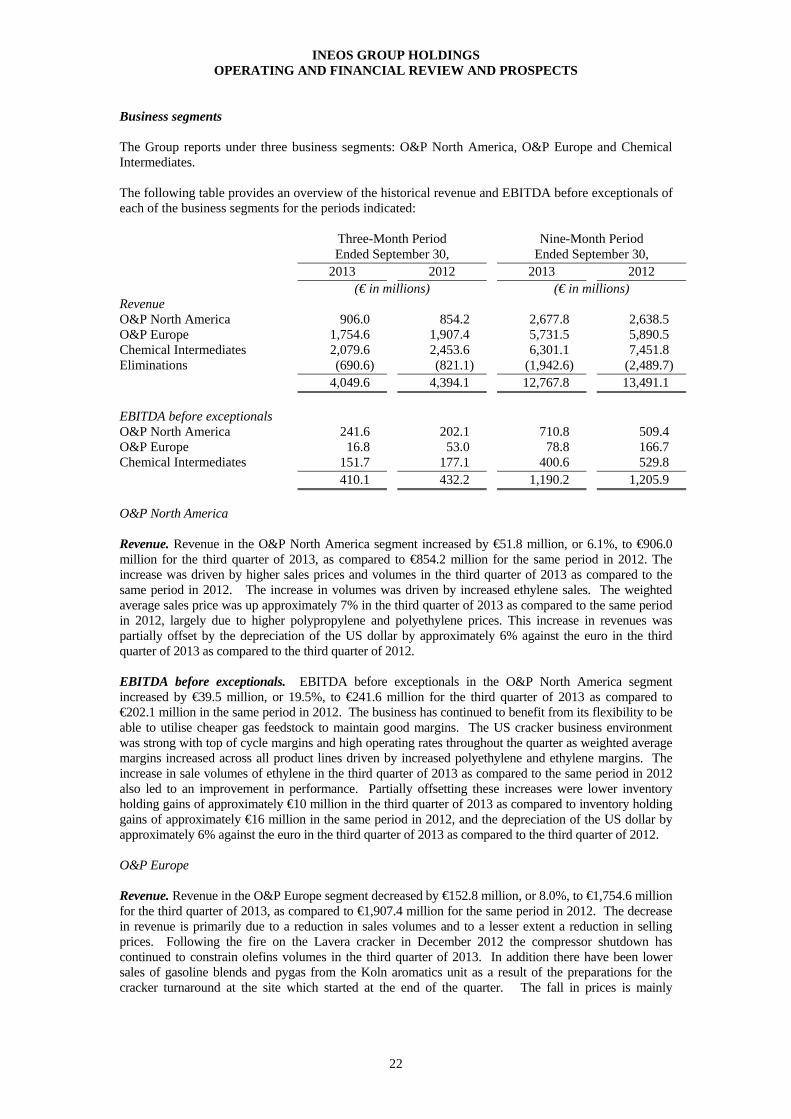
Business segments The Group reports under three business segments: O&P North America, O&P Europe and Chemical Intermediates. The following table provides an overview of the historical revenue and EBITDA before exceptionals of each of the business segments for the periods indicated:
O&P North America Revenue. Revenue in the O&P North America segment increased by €51.8 million, or 6.1%, to €906.0 million for the third quarter of 2013, as compared to €854.2 million for the same period in 2012. The increase was driven by higher sales prices and volumes in the third quarter of 2013 as compared to the same period in 2012. The increase in volumes was driven by increased ethylene sales. The weighted average sales price was up approximately 7% in the third quarter of 2013 as compared to the same period in 2012, largely due to higher polypropylene and polyethylene prices. This increase in revenues was partially offset by the depreciation of the US dollar by approximately 6% against the euro in the third quarter of 2013 as compared to the third quarter of 2012. EBITDA before exceptionals. EBITDA before exceptionals in the O&P North America segment increased by €39.5 million, or 19.5%, to €241.6 million for the third quarter of 2013 as compared to €202.1 million in the same period in 2012. The business has continued to benefit from its flexibility to be able to utilise cheaper gas feedstock to maintain good margins. The US cracker business environment was strong with top of cycle margins and high operating rates throughout the quarter as weighted average margins increased across all product lines driven by increased polyethylene and ethylene margins. The increase in sale volumes of ethylene in the third quarter of 2013 as compared to the same period in 2012 also led to an improvement in performance. Partially offsetting these increases were lower inventory holding gains of approximately €10 million in the third quarter of 2013 as compared to inventory holding gains of approximately €16 million in the same period in 2012, and the depreciation of the US dollar by approximately 6% against the euro in the third quarter of 2013 as compared to the third quarter of 2012. O&P Europe Revenue. Revenue in the O&P Europe segment decreased by €152.8 million, or 8.0%, to €1,754.6 million for the third quarter of 2013, as compared to €1,907.4 million for the same period in 2012. The decrease in revenue is primarily due to a reduction in sales volumes and to a lesser extent a reduction in selling prices. Following the fire on the Lavera cracker in December 2012 the compressor shutdown has continued to constrain olefins volumes in the third quarter of 2013. In addition there have been lower sales of gasoline blends and pygas from the Koln aromatics unit as a result of the preparations for the cracker turnaround at the site which started at the end of the quarter. The fall in prices is mainly
Three-Month Period Ended September 30,
Nine-Month Period Ended September 30,
2013 2012 2013 2012 (€ in millions) (€ in millions)
Revenue O&P North America 906.0 854.2 2,677.8 2,638.5 O&P Europe 1,754.6 1,907.4 5,731.5 5,890.5 Chemical Intermediates 2,079.6 2,453.6 6,301.1 7,451.8 Eliminations (690.6) (821.1) (1,942.6) (2,489.7) 4,049.6 4,394.1 12,767.8 13,491.1 EBITDA before exceptionals O&P North America 241.6 202.1 710.8 509.4 O&P Europe 16.8 53.0 78.8 166.7 Chemical Intermediates 151.7 177.1 400.6 529.8 410.1 432.2 1,190.2 1,205.9
INEOS GROUP HOLDINGS OPERATING AND FINANCIAL REVIEW AND PROSPECTS
23
attributable to butadiene with the average butadiene price for the third quarter of 2013 down 45% as compared to the same period in 2012 as a result of the lengthening market and steepy declining global prices. Europe's butadiene prices decreased, tracking the Asian market where pricing remained under sustained pressure as a result of new butadiene capacity coming on-line. This decrease was partly offset by increases in the ethylene and propylene prices compared to the same period last year, which also led to increases in polymer prices. EBITDA before exceptionals. EBITDA before exceptionals in the O&P Europe segment decreased by €36.2 million or 68.3% to €16.8 million for the third quarter of 2013 as compared to €53.0 million in the same period in 2012. The results for the third quarter of 2013 have been adversely impacted by the fire on a compressor at the cracker in Lavera in December 2012. The partial closure of the cracker in Lavera during the quarter adversely impacted the results by approximately €17 million. The adverse performance in the quarter was also driven by lower inventory holding gains of approximately €17 million in the third quarter of 2013 as compared to inventory holding gains of approximately €33 million in the same period in 2012. The weakness in the butadiene market due to depressed European tyre demand has also led to a decline in margins in the third quarter of 2013 as compared to the same period in 2012. Chemical Intermediates Revenue. Revenue in the Chemical Intermediates segment decreased by €374.0 million, or 15.2%, to €2,079.6 million for the third quarter of 2013, as compared to €2,453.6 million for the same period in 2012. The Phenol business revenues decreased in the third quarter of 2013 as compared to the same period in 2012 driven primarily by a fall in sales volumes. Total sales volumes were down by approximately 21% in the third quarter of 2013 as compared to the same period in 2012, driven by lower demand in the domestic markets as well as lower export shipments. In addition the price of finished products moved in line with the underlying raw material prices with decreased phenol prices being only partially offset by higher acetone prices in the third quarter of 2013 as compared to same period in 2012. The Oligomers business experienced an increase in revenue in the third quarter of 2013 as compared to the same period in 2012, primarily due to increased selling prices as feedstock related contract prices moved in line with increases in underlying raw material costs. This increase was partially offset by a reduction in sales volumes in the third quarter of 2013 as compared to same period in 2012, primarily due to a reduction in PIB volumes following the impact of the Lavera fire in December 2012 and slower LAO demand in North America and Europe. The Oxide business revenues were flat in the third quarter of 2013 as compared to same period in 2012, primarily due to lower sales prices of solvent products as prices came under severe price pressure in Europe due to cheap imports from the Middle East and USA as a result of favourable exchange rates and cheaper raw materials. This was offset by a change in the product mix of the business as the Antwerp ethylene terminal was in full operation for the first time for a full quarter. Nitriles revenues increased in the third quarter of 2013 as compared to the same period in 2012, driven by an increase in sales prices, partially offset by lower sales volumes. The average acrylonitrile sales price was approximately 6% higher in the third quarter of 2013 as compared to the same period in 2012, although this increase was partially offset by a reduction in volumes driven by lower than average operating rates and a turnaround at the Koln site in the quarter. EBITDA before exceptionals. EBITDA before exceptionals in the Chemical Intermediates segment decreased by €25.4 million, or 14.3%, to €151.7 million for the third quarter of 2013 as compared to €177.1 million for the same period in 2012. The results for the third quarter of 2013 have been adversely impacted in the Chemical Intermediates segment by the fire on a compressor at the cracker in Lavera in December 2012. The partial closure of the cracker in Lavera during the third quarter of 2013 adversely impacted the results of the Oxide and Oligomers businesses by approximately €10 million. The Phenol business performance declined in the third quarter of 2013 as compared to the same period of 2012, primarily due to a reduction in sales volumes driven by weak sales opportunities. The Oligomers business profitability increased in the third quarter of 2013 as compared to same period in 2012, driven by improved margins as strong comonomer sales and drilling fluid sales to the US Gulf Coast as well as solid European sales benefited LAO margins. In addition PIB benefited from tight market conditions and SO margins were all strong in all regions including sales into new cosmetic applications. The Oxide business result in the third quarter of 2013 was flat compared to the same period in 2012, following a decrease in product margins which were mostly offset by lower fixed costs. Margins in the solvent business decreased in the third quarter of 2013 as compared to same period in
INEOS GROUP HOLDINGS OPERATING AND FINANCIAL REVIEW AND PROSPECTS
24
2012 as high imports from cheaper feedstock regions in the Middle East and USA squeezed margins. Fixed costs decreased due to lower maintenance costs in the third quarter of 2013 as there was a catalyst change in the third quarter of 2012 at the Koln site which resulted in higher amounts of maintenance expenditure during this quarter. The Nitriles business experienced a decrease in profitability in the third quarter of 2013 as compared to the same period in 2012 driven primarily by weak margins as a result of soft demand in the ABS and acrylic fibre markets.
INEOS GROUP HOLDINGS OPERATING AND FINANCIAL REVIEW AND PROSPECTS
25
Liquidity and Capital Resources
Capital Resources
Our historical liquidity requirements have arisen primarily from the need for us to meet our debt service requirements, to fund capital expenditures for the general maintenance and expansion of our production facilities and for new facilities, and to fund growth in our working capital. Our primary sources of liquidity are cash flows from operations of subsidiaries, cash on our balance sheet and borrowings under the Receivables Securitization Facility. Our ability to generate cash from our operations depends on future operating performance, which is in turn dependent, to some extent, on general economic, financial, competitive market, legislative, regulatory and other factors, many of which are beyond our control. We believe that our operating cash flows, together with the cash resources and future borrowings under the Receivables Securitization Facility, will be sufficient to fund our working capital requirements, anticipated capital expenditures and debt service requirements as they become due, although this may not be the case. Financing Arrangements
In February 2012 the Group issued $1.0 billion Senior Secured Notes due 2019 and €500.0 million Floating Rate Senior Secured Notes due 2019. In May 2012 the Group issued $775 million Senior Secured Notes due 2020 and a new Senior Secured Term Loan totalling $3,025 million. The net proceeds from the notes and the term loan were used to repay all of the remaining indebtedness (including the Term Loan D and Revolving Credit Facility) under the Senior Facilities Agreement. In May 2013 the Group successfully completed the re-pricing and up-sizing of its Senior Secured Term Loan facility and issued fixed rate Senior Notes due 2018. The refinancing of the Senior Secured Term Loans comprised of a $371 million, two-year term loan, a $1.977 billion, five-year term loan, a $640 million five-year add-on term loan, a €494 million, five-year term loan, and a €350 million, five-year add-on term loan. The re-pricing led to a reduction in the margins on the Group’s existing Senior Secured Term Loans. In addition, the proceeds from the additional €350 million and $640 million term loans were used to repay the Group’s existing Senior Secured Notes due 2015, to pay transaction fees and expenses and for general corporate purposes. The fixed rate Senior Notes due 2018 were issued in two tranches, being a $678 million aggregate principal amount of 6.125% Senior Notes due 2018 and a €500 million aggregate principal amount of 6.50% Senior Notes due 2018. The Group used the proceeds from the Notes to refinance all of its outstanding U.S. dollar-denominated Senior Notes due 2016 and redeem €500 million aggregate principal amount of its outstanding euro-denominated Senior Notes due 2016 pursuant to a partial redemption. The Group also has a €1,200 million Receivables Securitisation Facility in place, which matures in December 2014. The Group has a €250.0 million letter of credit facility. Under the terms of the facility the Group undertakes to provide cash collateral to cover any letters of credit, guarantees, bonds or indemnities issued under the facility. As of September 30, 2013, we had a total of €1,032.1 million Senior Notes due 2016, €1,000.7 million Senior Notes due 2018, €1,238.4 million Senior Secured Notes due 2019 and €572.3 million Senior Secured Notes due 2020 outstanding.
INEOS GROUP HOLDINGS OPERATING AND FINANCIAL REVIEW AND PROSPECTS
26
Capital Expenditures
As part of our strategy to focus capital investments on improving returns, we have instituted measures to ensure the most efficient uses of capital investment. We intend to manage capital expenditures to maintain our well-invested asset base. Capital expenditure incurred during the nine months ended September 30, 2013 was €378.9 million (€337.2 million in the nine months ended September 30, 2012) analysed by business segment as follows: Nine months
ended September 30, 2013 2012 (€ in millions)
O&P North America 180.9 113.2 O&P Europe 109.4 86.0 Chemical Intermediates 88.6 138.0 378.9 337.2 The main capital expenditures in the nine months ended September 30, 2013 were the purchase of a feedstock pipeline in Texas, USA for €66.3 million and an expansion of a furnace within the O&P North America segment, additional spend on a project to improve the feedstock flexibility of the KG cracker in Grangemouth, Scotland and turnarounds within the O&P Europe segment at Lillo, Belgium and Koln, Germany. In addition there was some further capital expenditure on the finalisation of the ethylene terminal project in Antwerp, Belgium within the Chemical Intermediates segment. The remaining capital expenditure related primarily to sustenance expenditure. Working Capital
We anticipate that our working capital requirements will vary due to changes in raw material costs, which affect inventory and account receivables levels, and sales volumes. Working capital levels typically develop in line with raw material prices, although timing factors can affect flows of capital. We expect to fund our working capital requirements with cash generated from operations and drawings under our Receivables Securitization Facility. Cash Flows
During the nine month period ended September 30, 2013 and 2012, our cash flow was as follows:
Nine months
ended September 30, 2013 2012 (€ millions)
Cash flow from operating activities ......................................................... 720.1 799.5 Cash flow from investing activities ......................................................... (369.2) (327.2) Cash flow from financing activities ......................................................... (409.0) 152.0
Cash flows from operating activities
Net cash flow from operating activities was an inflow of €720.1 million for the nine month period ended September 30, 2013 (inflow of €799.5 million in the nine months ended September 30, 2012). The inflow was due to the profit generated from operations, partially offset by working capital outflows of €236.6 million in the nine month period (outflow of €232.1 million in the nine months ended
INEOS GROUP HOLDINGS OPERATING AND FINANCIAL REVIEW AND PROSPECTS
27
September 30, 2012). The working capital outflow in the nine months ended September 30, 2013 reflects the typical seasonal outflow the Group experiences in the first nine months of the year as business picks up after the seasonal lows at the end of the fourth quarter. The working capital outflows in the nine months ended September 30, 2012 reflects the same seasonal outflows, coupled with an overall increase in raw material selling prices experienced across the Group during that period. Taxation payments of €208.5 million were made in the nine months ended September 30, 2013 (payments of €157.1 million in the nine months ended September 30, 2012). The payments in the nine months ended September 30, 2013 primarily reflect payment on account made to the tax authorities in the US, Canada and Germany. The mix of profitability of the Group has changed in 2013 as compared to 2012, with a higher proportion of income sourced in the US and Canada. As a consequence, this has led to an increase in the overall amount of tax payable by the Group as corporate tax rates are higher in those countries. Cash flows from investing activities
There were no other significant cash flows from investing activities in the nine months ended September 30, 2013 and 2012 other than the acquisition of property, plant and equipment (refer to the “Capital Expenditure” section).
Cash flows from financing activities
Interest payments of €486.3 million were made in the nine month period ended September 30, 2013 (€575.3 million in the nine months ended September 30, 2012). The interest payments during the first nine months of 2013 relate to monthly cash payments in respect of the Senior Secured Term Loans, semi-annual interest payments on the Senior Notes due 2016, 2019 Dollar Fixed Rate Notes, Senior Secured Notes due 2020 and a final interest payment on the Senior Secured Notes due 2015 which were redeemed in May 2013, quarterly interest payments on the 2019 Euro Floating Rate Notes and €70.2 million of call premia in relation to the May 2013 refinancing. The interest payments during the first nine months of 2012 relate to monthly cash payments in respect of the Senior Credit Facilities, semi-annual interest on the Senior Secured Notes due 2015 and on the Senior Notes due 2016 and a quarterly interest payment on the Senior Secured Notes due 2019. In addition the Group paid €146.2 million of accrued PIK interest as a result of the repayments made on the Term Loans under the Senior Credit Facilities from the proceeds of the Senior Secured Term Loans, Senior Secured Notes due 2019 and the Senior Secured Notes due 2020. The Revolving Credit Facility was cancelled in May 2012 as a result of the redemption of the Senior Facilties Agreement. In the nine months ended September 30, 2012 the Group made repayments on the Revolving Credit Facility of €293.0 million. The Group made no repayment or drawdown on on the Receivables Securitization Facility during the nine months ended September 30, 2013 (€150.5 million repayment in the nine months ended September 30, 2012). The Group made scheduled repayments of €22.0 million on the Senior Secured Term Loans during the nine months ended September 30, 2013 (scheduled repayments of €12.1 million in the nine months ended September 30, 2012). In February 2012 the Group issued $1.0 billion Senior Secured Notes due 2019 and €500.0 million Floating Rate Senior Secured Notes due 2019, resulting in a combined cash inflow of €1,262.5 million. The proceeds of the notes were used to repay senior debt of €1,231.2 million (plus the associated PIK interest of €59.0 million). In May 2012 the Group issued $775 million Senior Secured Notes due 2020 and a new Senior Secured Term Loan totalling $3,025 million, resulting in a combined cash inflow of €2,875.6 million. The net proceeds from the notes and the term loan were used to repay all of the outstanding Term Loan C, Term Loan D and Revolving Credit Facility indebtedness under the Senior Facilities Agreement, including the associated PIK interest of €87.2 million. The Group paid associated debt issue costs of €91.7 million in relation to the issue of the Senior Secured Notes and Senior Secured Term Loans during the nine months ended September 30, 2012.

INEOS GROUP HOLDINGS OPERATING AND FINANCIAL REVIEW AND PROSPECTS
28
In May 2013 new Senior Secured Term Loans of €350 million and $640 million resulting in a combined cash inflow of €838.5 million were issued to redeem the 2015 Senior Secured Notes due 2015 of €735.1 million and fund the cost of refinancing which included call premia of €70.2 million and debt issue costs of €17.2 million. In addition new Senior Notes due 2018 of €500 million and $678 million were issued resulting in a combined cash inflow of €1,017.5 million. The proceeds from the Dollar Notes were used to redeem in full the Dollar Senior Notes due 2016 of $677.5 million (€517.1 million) whilst the proceeds from the euro Notes were used to partially redeem €500 million of the Euro Senior Notes due 2016. In July 2013 the Group entered into a bilateral bank loan agreement to fund some specific capital expenditure at the Koln, Germany site, resulting in an inflow of €14.3 million in the three month period ended September 30, 2013. Net debt
Total net debt as at September 30, 2013 was €6,234.7 million (December 31, 2012: €6,164.1 million). The Group held net cash balances of €1,158.1 million as at September 30, 2013 (December 31, 2012: €1,235.4 million) which included restricted cash of €202.4 million used as collateral against bank guarantees and letters of credit. The Group had availability under undrawn working capital facilities of €210 million as at September 30, 2013.
The Group entered into two interest rate caps in May 2012 to hedge the variable interest rate exposures on the €500.0 million Floating Rate Senior Secured Notes due 2019. The interest rate caps have a strike price of 1.25% per annum, which is in line with the EURIBOR floor on the Floating Rate Notes of 1.25% per annum. These derivative instruments expire in May 2015.