Industries, Investment Opportunities, and Corporate ...Industries, Investment Opportunities, and...
48
Industries, Investment Opportunities, and Corporate Governance Structures * Stuart L. Gillan Department of Finance College of Business and Economics University of Delaware 306 Purnell Hall, Newark, DE 19716. (302)-831-1779 FAX: (302) 831-3061 [email protected] Jay C. Hartzell University of Texas Department of Finance Austin, TX 78712-1179 (512) 471-6779 FAX: (512) 471-5073 [email protected] Laura T. Starks University of Texas Department of Finance Austin, TX 78712-1179 (512) 471-5899 FAX: (512) 471-5073 [email protected] Preliminary draft, September 2002, may be quoted with permission. * This paper was started while Gillan was with the TIAA-CREF Institute. The views expressed in this paper are those of the authors and do not necessarily reflect those of TIAA-CREF. We would like to thank Jennifer Bethel, Kose John, Sheridan Titman, and seminar participants at Oklahoma State University, the University of Kansas, University of Southern California, and the University of Texas at Austin for their comments. We would also like to thank Carlos Molina and Li Yong for research assistance.
Transcript of Industries, Investment Opportunities, and Corporate ...Industries, Investment Opportunities, and...
Industries, Investment Opportunities, and Corporate Governance Structures*
Stuart L. Gillan Department of Finance
College of Business and Economics University of Delaware
306 Purnell Hall, Newark, DE 19716.
(302)-831-1779 FAX: (302) 831-3061 [email protected]
Jay C. Hartzell University of Texas
Department of Finance Austin, TX 78712-1179
(512) 471-6779 FAX: (512) 471-5073
Laura T. Starks University of Texas
Department of Finance Austin, TX 78712-1179
(512) 471-5899 FAX: (512) 471-5073
Preliminary draft, September 2002, may be quoted with permission.
* This paper was started while Gillan was with the TIAA-CREF Institute. The views expressed in this paper are those of the authors and do not necessarily reflect those of TIAA-CREF. We would like to thank Jennifer Bethel, Kose John, Sheridan Titman, and seminar participants at Oklahoma State University, the University of Kansas, University of Southern California, and the University of Texas at Austin for their comments. We would also like to thank Carlos Molina and Li Yong for research assistance.
Industries, Investment Opportunities, and Corporate Governance Structures
Abstract
We provide an argument and present evidence that industry factors play an important role in corporate governance. In particular, an industry’s investment opportunities, product uniqueness, competitive environment, information environment and leverage help explain its corporate governance structures. These factors can have quite different associations (in strength and direction) with the monitoring capabilities of the board of directors versus the shareholder orientation of corporate charter provisions. This suggests systematic differences in the relative costs and benefits of alternative monitoring mechanisms. A focus on firm influences within industries suggests that firm and industry factors can each explain up to half of the variation in governance structures. We also find evidence that firms’ broad governance structures revert over time toward industry norms.
Industry, Investment Opportunities, and Corporate Governance Structures
The separation of ownership and control in corporations can result in costly
agency conflicts between owners and managers. Impediments to monitoring and the
existence of transactions costs imply that contracts alone cannot resolve such conflicts,
giving rise to the need for governance structures (Hart, 1995). The corporate
governance structures that have developed in order to constrain management and help
solve agency problems comprise a set of mechanisms, internal and external to the firm.
As pointed out by Jensen (1993), John and Senbet (1998) and Shleifer and Vishny
(1999), these internal (boards of directors, corporate charters) and external (market for
corporate control, legal and regulatory rules, investor monitoring, labor and product
markets) mechanisms interact to determine the governance environment in which a
company operates.
The interactions among the mechanisms imply that a firm’s corporate
governance should be viewed as the set of mechanisms in place rather than individual
components. The net effect of the mechanisms for a given firm depends not only on the
control benefits the firm receives, but also on the costs of the mechanisms to managers
and shareholders due to the frictions and constraints that the mechanisms impose.
Because agency problems vary across firms, the costs and benefits of governance
structures to control these problems also vary. Thus, the optimal cost-benefit tradeoff
depends on a particular firm’s environment, including its investment opportunities, and
its competitive, information, and regulatory environments.
The fundamental question we address in this paper is the extent to which
governance structures are related to firm and industry characteristics. We do so by
developing and testing hypotheses regarding corporate governance structures. The null
hypothesis is that corporate governance is irrelevant and governance structures do not
1
vary systematically across firms or industries, i.e., governance structures are completely
random. The two alternative hypotheses assume that governance structures vary
systematically across firms or industries. The difference between these two alternative
hypotheses is the reason for the systematic variation. The first alternative hypothesis
maintains that the systematic variation in governance structures is due to particular firm
and industry characteristics. This hypothesis implies that the existence of particular
governance mechanisms, such as board structures and corporate charter provisions,
should be significantly related to characteristics that determine the costs and benefits of
the mechanisms. Our second alternative hypothesis, which is mutually exclusive from
the null hypothesis but not the other alternative hypothesis, is that governance structures
may look similar across firm or industries, or within industries, but without apparent
explanation (i.e., variation that is not easily explained by observable factors). For
example, commonality in corporate governance could be influenced by benchmarking to
industry peers, or by firms sharing common corporate governance advisors.
We test these hypotheses using a panel dataset of corporate governance
mechanisms for a broad cross-section of more than 2,300 firms over four years. We
investigate these firms’ overall portfolio of governance mechanisms, including a set of
board-related variables, a set of corporate charter provisions (e.g., antitakeover
devices), and the choice of state of incorporation. We also separately analyze the sets
of board variables and charter provisions. The analysis produces evidence of
systematic variation in corporate governance, indicating that governance structures are
not random. Moreover, we find evidence supportive of the hypothesis that governance
structures vary with industry and firm characteristics. The results suggest that, at least
in part, governance structures vary with the expected costs and benefits of different
governance mechanisms.
2
Specifically, we find that investment opportunities, product uniqueness, the
competitive and information environments of the industry, and the average industry
leverage are associated with governance structures.1 Although firm factors augment
industry factors in explaining variation in corporate governance, the results suggest that
industry factors tend to dominate firm factors in explaining the variance in our measure
of overall governance structure. This result is not universal, however, because firm and
industry influences each explain about the same amount (half) of the observed variation
in board structures.
Importantly, we find that our indices of board and charter provisions exhibit quite
different associations with different firm and industry characteristics. This suggests that
viewing corporate governance in terms of just the features of the board, just the charter
provisions, or as a combined single index, may mask important relationships between
corporate governance structures and features of the contracting environment. We also
find that governance structures are relatively stable over time; we observe only small
governance changes during our four-year sample period. However, the governance
changes we do observe exhibit mean reversion toward industry averages.
Several previous studies have also examined sets of corporate governance
structures and have provided important contributions on some of the same issues we
analyze (Danielson and Karpoff, 1998; Gompers, Ishii and Metrick, 2002; John and
Kedia, 2002). We view the corporate governance structures as endogenous to the
industry and environmental factors, an approach that differs greatly from the empirical
papers by Danielson and Karpoff and Gompers, Ishii and Metrick. Beyond this
1 Two previous papers on corporate governance structures have provided some limited evidence on industry factors in these structures. Danielson and Karpoff (1998) find evidence of relations between board composition, ownership structure, and provision use, but conclude that the overall use of governance provisions is not systematically related to industry grouping. Gompers, Ishii, and Metrick (2001) provide preliminary evidence that provision use may be related to industry
3
difference, our primary focus is on industry effects, while their primary focus is on the
individual firm level. We differ from John and Kedia in that we focus on empirical
evidence, while they focus on theoretical evidence. Our results can be viewed as
complementary to the previous papers.
In the following section, we discuss corporate governance structures. In Section
II, we develop hypotheses for the determinants of such structures across industries. We
describe the data in Section III and present evidence regarding industry determinants of
corporate governance systems in Section IV. Section V examines firm determinants of
governance while controlling for broad industry influences. We consider changes in
corporate governance structures across our sample period in Section VI and provide
concluding comments in Section VII.
I. Corporate Governance Structures
In this paper we focus on explaining the components of a firm’s governance
structure that managers can affect, including board composition, corporate by-law and
charter provisions, and state laws. (The last of these derives from the firm’s choice of
state for incorporation.)
The most prominent governance mechanism that managers can affect is the
board of directors, whose duty is to represent the shareholders. Our two alternative
hypotheses suggest that board characteristics should vary systematically across firms
and industries, either because of systematic differences in costs and benefits, or
because of some other commonality. Previous research suggests that the board
characteristics affect the board’s effectiveness and that the important characteristics are
board size, independence, and composition (John and Senbet, 1998). For example,
classification in that certain industry groups are prevalent among firms with provisions in shareholder interests versus manager interests.
4
communication and coordination problems with larger boards imply that smaller boards
are more efficient (Jensen, 1993; Yermack, 1996), but for some industries, the benefits
from a larger board may outweigh the increased communication and coordination costs.
The independence of directors, considered important in determining the monitoring
capabilities of a board (Fama and Jensen, 1983; Weisbach, 1988; Brickley, Coles and
Terry, 1994; Borokhovich, Parrino, and Trapani, 1996), may be more important for some
types of firms than others. Similarly, the independence of board monitoring committees,
i.e., the audit, compensation, and nominating committees, although considered
important by many regulatory bodies and investors (John and Senbet, 1998; Gillan and
Starks, 2000; Deli and Gillan, 2000) may have more importance in some industries than
others.2
Two other issues pertaining to board structure are the separation of the chief
executive officer (CEO) and chairman of the board (COB) positions and the presence of
a lead director. Although arguments have been made and evidence presented that
separating the CEO and COB positions is in shareholders’ interests (Jensen, 1993;
Goyal and Park, 2002), Brickley, Coles and Jarrell (1997) provide contrasting evidence
that the costs of separating the CEO and COB positions may exceed the benefits.
Rather than separate the two positions, others advocate designating a lead independent
director.3
In summary, existing research suggests that small boards with a majority of
independent directors on the board and on its committees provide the strongest
monitoring capabilities. Although the evidence is mixed on separating the CEO and
chair positions or designating a lead director, doing so may improve the board’s
2 For example, recent New York Stock Exchange listing standard changes requiring that board be comprised of a majority of independence directors and that audit, compensation, and nominating committees be composed solely of independent directors.
5
monitoring of corporate management. According to our null hypothesis, the benefits of
these board structures would not be related to particular firm or industry characteristics.
In contrast, our primary alternative hypothesis suggests that the benefits and costs of
each of these structures would vary across industry and firm characteristics and that for
some industries and firms, these structures would be more prevalent than for others.
The second major internal governance mechanism is a firm’s corporate charter
and bylaws, that is, the set of rules and procedures under which each firm operates.
The importance of the charter and bylaw provisions and their effects as governance
mechanisms is evidenced by shareholder proposals seeking amendments to such
measures (e.g., Gillan and Starks, 1998; 2000). The provisions that have been identified
as most important include dual-class share structures, in which there is a separation of
cash-flow rights and voting rights, and certain amendments, such as blank-check
preferred stock, classified boards, fair-price restrictions, limiting shareholder ability to call
special meetings or act by written consent, poison pills, or supermajority voting
requirements (see Appendix A for a more detailed discussion of each of these
provisions). The announcements of the adoption of many of these amendments have
been met with negative stock price responses, indicating shareholders perceive them as
wealth-reducing. (See, for example, Jarrell and Poulsen, 1988a; 1988b.) Some of the
amendments, however, are viewed as positive for the firm, for example, Bhagat and
Brickley (1984) argue that the adoption of cumulative voting, which affords minority
shareholders the possibility of board representation, is associated with enhanced
corporate value. According to our alternative hypotheses, these amendments should
vary systematically across industries, either because the benefits and costs vary
3 See CalPERs’ US Corporate Governance Principles http://www.calpers-governance.org/principles/domestic/us/page01.asp.
6
because of industry characteristics or because there is some industry commonality such
as the use of the same attorneys in constructing the corporate charter.
Finally, managers can affect their firm’s governance structure through the choice
of state of incorporation. State laws offer firms varying levels of antitakeover protection
and may negate firms’ need to adopt charter amendments. In fact, Bebchuk and Cohen
(2002) find that states that offer stronger antitakeover protections are more successful in
retaining local companies in their incorporations and in attracting out-of-state
incorporations. Differences in firm or industry characteristics may lead some firms to
incorporate (or reincorporate) in a particular state, while other firms do not perceive the
benefits to outweigh the costs.
While these three broad sets of governance choices – board structure, corporate
charter provisions, and state of incorporation – have been studied extensively, empirical
work has generally focused on the effects of these mechanisms on firm value,
performance, or specific corporate decisions (see reviews by Hermalin and Weisbach
(2002) for boards of directors and Bittlingmayer (1999) for the market for corporate
control). In contrast, we consider the endogeneity of the mechanisms themselves − that
is, how governance mechanisms are associated with environmental factors. Theory
suggests that board structure, corporate charter provisions, and state laws have costs
and benefits that vary across firms depending on their characteristics and
circumstances. If so, then we would expect to find associations between these
governance choices and factors that influence their relative costs and benefits.
Our approach is similar to that of Hermalin and Weisbach (1998, 2002), who
argue that boards of directors are an endogenous response to agency problems. It is
also similar to that of Smith and Watts (1992) and Bushman, Chen, Engel, and Smith
(2000). Smith and Watts suggest that the investment opportunity set and industry
factors play a significant role in determining financial and governance policies. Bushman
7
et al. examine the relation between the timeliness of accounting earnings and
governance systems. In addition, Kole and Lehn (1999) examine how some components
of governance systems in the airline industry changed after deregulation.
In order to differentiate between our two primary alternative hypotheses of
systematic variation in corporate governance structures, we need to develop additional
hypotheses regarding which factors in a firm’s environment are likely to affect managers’
choice of governance mechanisms. There are two important considerations in the
development of these additional hypotheses. The first is the difference between strong
corporate governance and optimal corporate governance. The second is the degree of
substitutability between different monitoring mechanisms.
Stronger corporate governance does not necessarily imply optimal monitoring
because the costs of the stronger governance may outweigh benefits. For example,
consider the role of independent directors on boards. According to many institutional
investors and corporate oversight bodies, independent directors provide superior
oversight as compared to directors with links to corporate management, implying that
boards should consist of a majority of independent directors.4 However, there also exist
costs of having too high a proportion of outsiders on the board. Outside directors do not
have the detailed information that inside directors possess from their involvement in
firms. In addition, outside directors may not have the time or commitment of insiders
given other responsibilities. In the extreme, a board consisting of exclusively outsiders
could make poorer decisions than a board with insiders.
The second consideration is that some corporate governance mechanisms may
serve as substitutes. For example, Hartzell (2001) finds that termination incentives can
substitute for executive compensation being sensitive to firm performance. Similarly,
4 See, for example, TIAA-CREF Policy Statement on Corporate Governance, March 2000, http://www.tiaa-cref.org/libra/governance/index.html.
8
debt, as a self-enforcing governance mechanism, or product market competition, may
substitute for board oversight. The issue of substitutability remains an empirical
question, one that we address further in this paper.
II. Industry and firm determinants of governance
The literature has long recognized the importance of environmental
considerations in corporate finance and corporate governance. In firm-level studies,
industry effects are apparent for compensation contracts (Murphy, 1998, and Aggarwal
and Samwick, 1999), ownership structure – particularly for media and regulated firms
(Demsetz and Lehn, 1985), and takeovers and restructurings (Mitchell and Mulherin,
1996). Moreover, CEO turnover is associated with industry heterogeneity (Parrino,
1997) and the level of product market competition (DeFond and Park, 2001). At the
industry-level, Smith and Watts (1992) find evidence that the investment opportunity set
is related to cross-sectional variation in corporate financing, compensation, and dividend
policies. Such findings indicate that different aspects of governance, notably
compensation contracts, managerial turnover, ownership structure, and the market for
corporate control appear to be influenced by industry considerations. These findings
also suggest that the relative magnitude of agency costs differs across firms and
industries, which would be consistent with our first alternative hypothesis.
There also exists evidence consistent with our second alternative hypothesis that
industry clustering of governance provisions and board characteristics can occur due to
factors unrelated to the benefits and costs of such structures. For example, evidence,
both anecdotal and academic, suggests that industry peer comparisons are common
(e.g., Bizjak, Lemmon, and Naveen (2002) on executive compensation). This evidence
implies that elements of competitive benchmarking may influence corporate governance.
9
According to both of our alternative hypotheses, firm and industry characteristics
would influence the type and intensity of monitoring by corporate boards and the use
antitakeover measures. Such characteristics, or environmental factors, are likely to
include investment opportunities, information uncertainty, product uniqueness, and the
competitive nature of the product market. Managers facing attractive investment
opportunities may have greater discretion in project selection than those facing less
attractive investment opportunities, suggesting potentially high payoffs to board
monitoring. Manager’s discretion may also be affected by product uniqueness. Unique
products can generate market power and the ability to earn quasi-rents. In such cases,
it may be less critical if a mistake is made, thus the benefit from monitoring is lower.
In noisy environments, where managers face riskier outcomes to their decisions
and monitoring costs for (outside) board members are high (Demsetz and Lehn, 1985),
board monitoring by independent directors is relatively inefficient. Supporting this view,
Hermalin and Weisbach (1998) show that with poorer information the option to fire
management is less valuable. Consequently, the intensity of board monitoring declines.
Noisier environments imply that firms’ charter provisions will be more structured,
because of the increased uncertainty.
The competitive environment can affect corporate governance structures in
opposite directions. If product market competition disciplines managers, then the
marginal benefit of additional governance would be low as competition would substitute
for other mechanisms (Leibenstein (1966) and Hart (1983)). Alternatively, a competitive
environment could raise the marginal cost of poor managerial decisions, resulting in a
positive association between competition and internal governance strength. Thus, the
direction of this relationship is an empirical question, which we address in the analysis.
Previous research suggests two other factors that could be expected to influence
corporate governance on an industry basis: a regulatory environment and capital
10
structure. For example, Demsetz and Lehn (1985) argue that firms in regulated
industries should require less internal monitoring because regulatory agencies and the
government provide firm oversight. Thus, governance structures should be related to
whether firms operate in regulated industries. Managers may also be constrained by
firms’ capital structures. Jensen (1986) and Hart (1995) argue that debt provides a self-
governance factor for managers. Based on this argument, we would expect to observe
industries with more debt in the capital structures to have similar, and less restrictive,
corporate governance structures because leverage disciplines managers.
This set of additional hypotheses serves as a subset of our primary hypothesis
that corporate governance structures are an endogenous response to environmental
factors. The endogeneity itself, however, poses a serious challenge to researchers
studying these issues. Thus, we first adopt an industry level focus to determine whether
or not systematic or environmental factors influence governance structures. An industry-
level analysis affords us several advantages. First, pooling the data eliminates firm
idiosyncrasies that could influence the results, providing more reliable estimates.
Second, industry aggregates are less affected by error-in-variables problems. Finally,
this approach mitigates to some degree the endogeneity issues prevalent in firm-level
analyses.5 Following our industry-level analysis, we also conduct a firm level analysis to
examine the extent to which firm level factors influence governance structures beyond
industry factors.
III. Data and Construction of Governance Indices
To examine our hypotheses regarding the endogeneity of firms’ corporate
governance structures, we focus on each firm’s board of directors, corporate bylaw and
charter provisions, ownership, state of incorporation, and firm characteristics during the
11
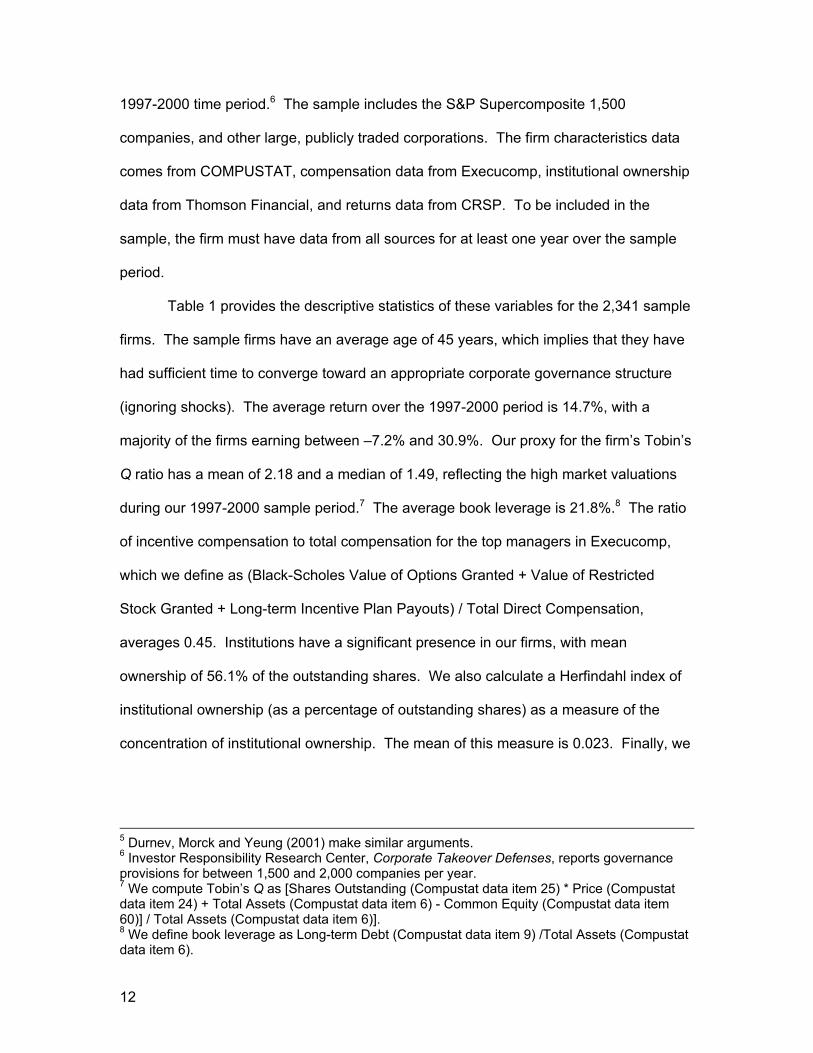
1997-2000 time period.6 The sample includes the S&P Supercomposite 1,500
companies, and other large, publicly traded corporations. The firm characteristics data
comes from COMPUSTAT, compensation data from Execucomp, institutional ownership
data from Thomson Financial, and returns data from CRSP. To be included in the
sample, the firm must have data from all sources for at least one year over the sample
period.
Table 1 provides the descriptive statistics of these variables for the 2,341 sample
firms. The sample firms have an average age of 45 years, which implies that they have
had sufficient time to converge toward an appropriate corporate governance structure
(ignoring shocks). The average return over the 1997-2000 period is 14.7%, with a
majority of the firms earning between –7.2% and 30.9%. Our proxy for the firm’s Tobin’s
Q ratio has a mean of 2.18 and a median of 1.49, reflecting the high market valuations
during our 1997-2000 sample period.7 The average book leverage is 21.8%.8 The ratio
of incentive compensation to total compensation for the top managers in Execucomp,
which we define as (Black-Scholes Value of Options Granted + Value of Restricted
Stock Granted + Long-term Incentive Plan Payouts) / Total Direct Compensation,
averages 0.45. Institutions have a significant presence in our firms, with mean
ownership of 56.1% of the outstanding shares. We also calculate a Herfindahl index of
institutional ownership (as a percentage of outstanding shares) as a measure of the
concentration of institutional ownership. The mean of this measure is 0.023. Finally, we
5 Durnev, Morck and Yeung (2001) make similar arguments. 6 Investor Responsibility Research Center, Corporate Takeover Defenses, reports governance provisions for between 1,500 and 2,000 companies per year. 7 We compute Tobin’s Q as [Shares Outstanding (Compustat data item 25) * Price (Compustat data item 24) + Total Assets (Compustat data item 6) - Common Equity (Compustat data item 60)] / Total Assets (Compustat data item 6)]. 8 We define book leverage as Long-term Debt (Compustat data item 9) /Total Assets (Compustat data item 6).
12
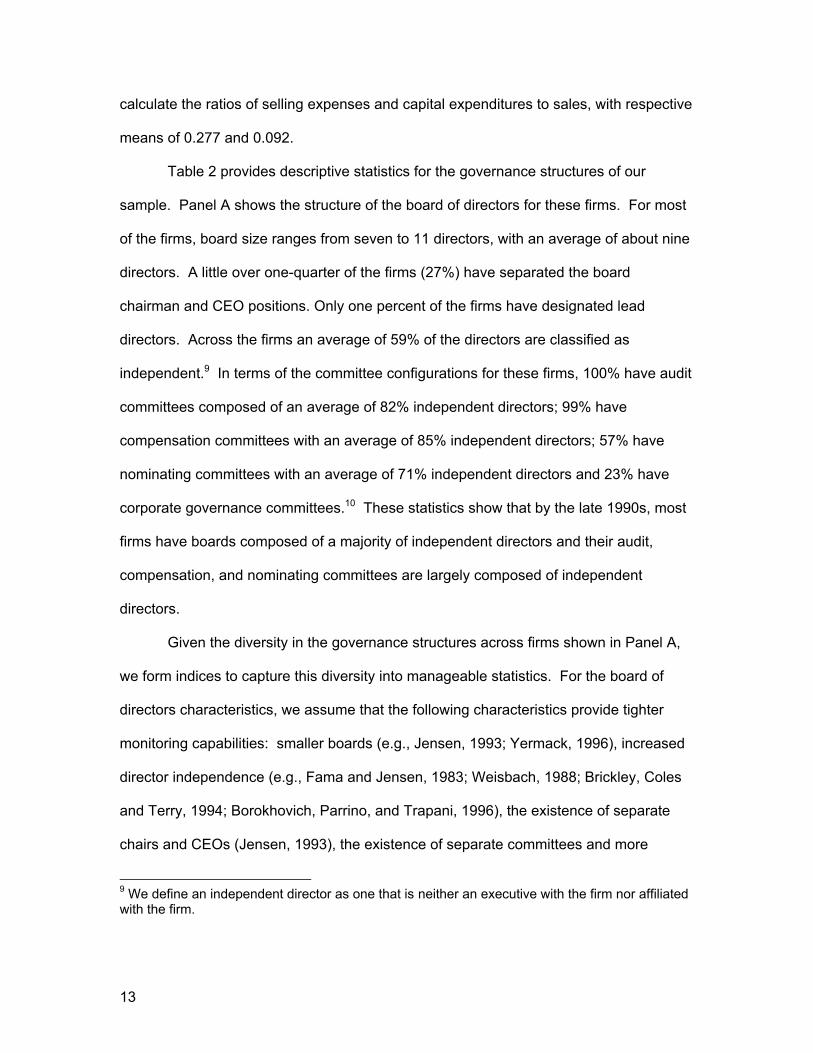
calculate the ratios of selling expenses and capital expenditures to sales, with respective
means of 0.277 and 0.092.
Table 2 provides descriptive statistics for the governance structures of our
sample. Panel A shows the structure of the board of directors for these firms. For most
of the firms, board size ranges from seven to 11 directors, with an average of about nine
directors. A little over one-quarter of the firms (27%) have separated the board
chairman and CEO positions. Only one percent of the firms have designated lead
directors. Across the firms an average of 59% of the directors are classified as
independent.9 In terms of the committee configurations for these firms, 100% have audit
committees composed of an average of 82% independent directors; 99% have
compensation committees with an average of 85% independent directors; 57% have
nominating committees with an average of 71% independent directors and 23% have
corporate governance committees.10 These statistics show that by the late 1990s, most
firms have boards composed of a majority of independent directors and their audit,
compensation, and nominating committees are largely composed of independent
directors.
Given the diversity in the governance structures across firms shown in Panel A,
we form indices to capture this diversity into manageable statistics. For the board of
directors characteristics, we assume that the following characteristics provide tighter
monitoring capabilities: smaller boards (e.g., Jensen, 1993; Yermack, 1996), increased
director independence (e.g., Fama and Jensen, 1983; Weisbach, 1988; Brickley, Coles
and Terry, 1994; Borokhovich, Parrino, and Trapani, 1996), the existence of separate
chairs and CEOs (Jensen, 1993), the existence of separate committees and more
9 We define an independent director as one that is neither an executive with the firm nor affiliated with the firm.
13
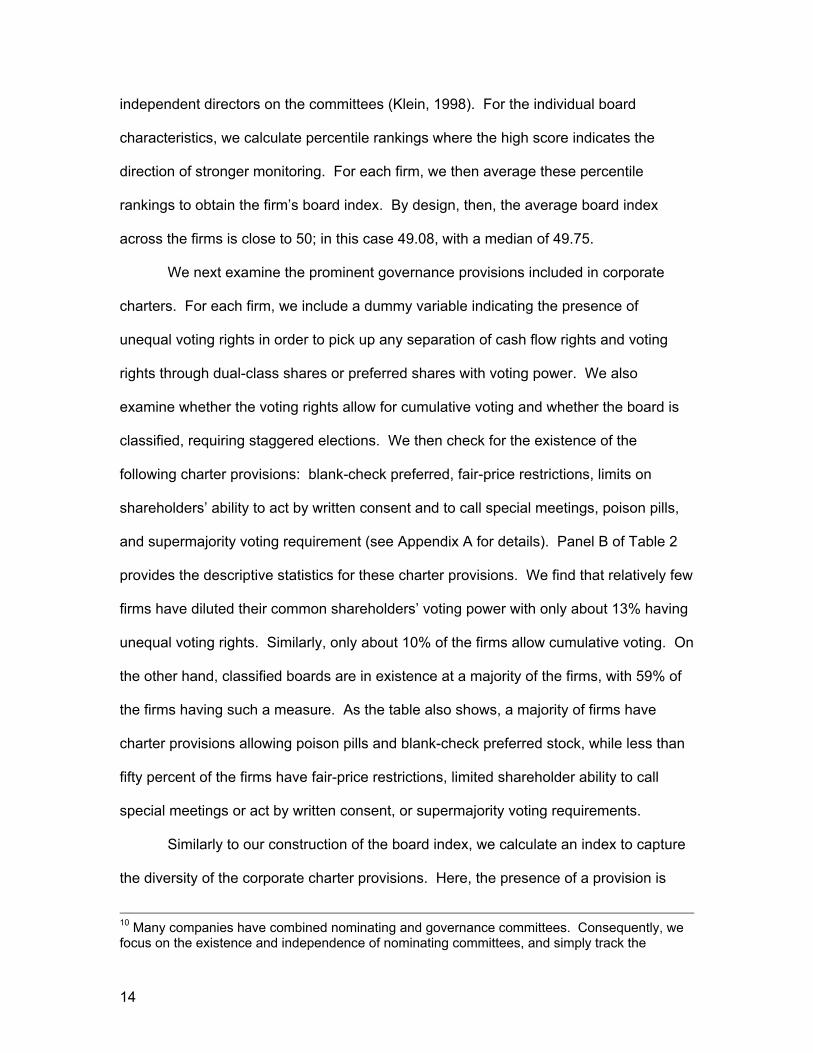
independent directors on the committees (Klein, 1998). For the individual board
characteristics, we calculate percentile rankings where the high score indicates the
direction of stronger monitoring. For each firm, we then average these percentile
rankings to obtain the firm’s board index. By design, then, the average board index
across the firms is close to 50; in this case 49.08, with a median of 49.75.
We next examine the prominent governance provisions included in corporate
charters. For each firm, we include a dummy variable indicating the presence of
unequal voting rights in order to pick up any separation of cash flow rights and voting
rights through dual-class shares or preferred shares with voting power. We also
examine whether the voting rights allow for cumulative voting and whether the board is
classified, requiring staggered elections. We then check for the existence of the
following charter provisions: blank-check preferred, fair-price restrictions, limits on
shareholders’ ability to act by written consent and to call special meetings, poison pills,
and supermajority voting requirement (see Appendix A for details). Panel B of Table 2
provides the descriptive statistics for these charter provisions. We find that relatively few
firms have diluted their common shareholders’ voting power with only about 13% having
unequal voting rights. Similarly, only about 10% of the firms allow cumulative voting. On
the other hand, classified boards are in existence at a majority of the firms, with 59% of
the firms having such a measure. As the table also shows, a majority of firms have
charter provisions allowing poison pills and blank-check preferred stock, while less than
fifty percent of the firms have fair-price restrictions, limited shareholder ability to call
special meetings or act by written consent, or supermajority voting requirements.
Similarly to our construction of the board index, we calculate an index to capture
the diversity of the corporate charter provisions. Here, the presence of a provision is
10 Many companies have combined nominating and governance committees. Consequently, we focus on the existence and independence of nominating committees, and simply track the
14
considered to provide management with less restrictive governance (with the exception
of the cumulative voting provision, which works in the opposite direction). Again, we
employ percentile rankings of each provision and by design, the average charter
provision index is nearly 50% because it is based on the average across each firm’s
percentile rankings for each provision. A firm with a high charter provisions index has
fewer corporate governance provisions in place. Put another way, the higher the
governance provisions index, the more the firm’s governance is in shareholder rather
than management interests.
The remaining major controllable factor in the firm’s governance structure is the
state of incorporation (see Bebchuk and Cohen, 2002, for an extensive study of state of
incorporation). State laws can substitute for antitakeover charter provisions or
supercede them. We employ seven indicators of the state governance laws: the
presence of a control share acquisition statute, a fair-price statute, freeze-out
restrictions, poison pill endorsement, a director duty provision, a short-term profit
provision, and incorporation in Delaware (see Appendix B). The first six indicators are
derived from Bebchuk and Cohen (2002) and Gartman (2000), while the seventh
indicates considers incorporation in Delaware, given that state’s prominence as a
corporate domicile and extensive case law.11 As in the previous governance indices that
we construct, we also use a ranking for the state index. In this case, we again use
percentile rankings in which each firm is ranked on the seven measures based on state
existence of governance committees. 11 Bebchuk and Cohen (2002) term the first five as standard antitakeover devices and number 6 as an extreme device (only Pennsylvania and Ohio have such a law). Bebchuk and Cohen also point out one other extreme measure in state laws – a required staggered board. Since we are using a measure of the existence of classified boards on a direct firm basis, we do not include that measure here.
15
of incorporation law, where the highest rank indicates the absence of the antitakeover
provisions.12
Finally, we construct a total governance index for each firm by taking the average
ranking for each firm across all of the governance provisions (rather than an average of
the three separate governance indexes). We take the average across all of the
provisions in order to avoid weighting one provision more than any other. We focus on
three governance indices: the board index, the charter provision index, and the total
governance index (which includes components of the board index, the provision index,
and the state index). These indices differ from those of other researchers in both their
construction and purpose. Gompers, Ishii and Metrick (2001) derive a governance index
based on corporate charters in which they add up the existence of the 24 charter
provisions they study. For our charter provision index, we focus on the eight most
prominent charter provisions and rather than summing the provisions for an index, we
use percentile rankings across firms. Further, Gompers, Ishii and Metrick examine
different hypotheses than we do. Bebchuk and Cohen (2002) derive a state charter
index that is similar to our state index, but we omit one of their indicators, a law requiring
staggered boards, because we use that measure directly in our charter provisions index.
We employ the state index in our total governance index, but we do not analyze the
state index separately.
IV. Empirical evidence on industry factors
Our first step is to determine whether there is a systematic industry factor in the
corporate governance measures adopted by firms. We categorize industries according
to Fama and French (1997) and average the governance structures across the firms
12 If we omit Delaware as a separate state indicator, we derive an index with a correlation of over 90% with the index including Delaware separately.
16

within each industry. Appendices C and D provide the board and governance
provisions by industry averages. Examining these statistics by industry shows
substantial variation in board structures across industries. For example, the average
percentages of independent directors on boards in the entertainment, beer and liquor, or
textile industries are 43-44%, while the average percentages of independent directors on
boards in the utilities, precious metals, or aircraft industries are over 70%.
In Table 3, we provide a formal test of whether these differences across
industries are significant. The results of ANOVA tests of industry-factor significance are
shown for the total governance index in Panel A, the board index in Panel B, and for the
charter provision index in Panel C. For all three indices, the industry factor is highly
significant in explaining companies’ corporate governance structures. For the total
governance index, a firm’s industry explains between 5.8% and 8.8% of its variation,
depending on the year. Similarly, for the board index, the industry explains between
8.3% and 11.6% of its variation, while for the charter provision index, industry explains
between 3.5% and 6%.
Given that industry factors play a role in corporate governance structures, we
next consider our hypotheses regarding whether industry characteristics can explain
these results. As hypothesized in Section II, the predominant factors in an industry
environment expected to affect constituent firms’ corporate governance structures are
factors that capture the investment, competitive, monitoring and information
environments in which the firms operate. We use the industry’s average Tobin’s Q ratio
as our proxy for the firm’s investment opportunities.
To capture the self-governance monitoring provided by leverage, we average the
book leverage measure across all sample firms in the industry. Some industries’
production technologies may more easily support the use of debt, which may in turn
lessen the need for other governance devices. Similarly, regulation may also substitute
17
for some governance mechanisms, so we measure the monitoring provided by a
regulatory body with an indicator variable for regulated industries, defined as utilities,
banks, insurance, and trading. We attempt to capture the competitive structure of the
industry in two ways. First, as a proxy for the degree of product uniqueness, we use the
industry’s average ratio of Selling Expenses to Sales, following the Titman and Wessels
(1988) argument that firms with unique products advertise more. Second, we calculate a
Herfindahl index of the firms’ market shares. Our measure of the information
environment is the industry volatility of returns on the firms’ common shares (expressed
as the average standard deviation of monthly returns for firms in that industry). This
measure captures the uncertainty that management faces, and the uncertainty that
investors face in trying to determine the actions taken by management. We also
incorporate a measure of compensation structure by calculating each industry’s average
proportion of compensation that is incentive based (Incentive Pay / Total Pay, as defined
above). Finally, we use dummy variables for years 1998, 1999, and 2000 to control for
time effects, and to determine if there are differences across the years in the sample.
For these industry characteristics to explain the industry clustering found in Table
3, there must be commonality across firms within an industry in these characteristics.
Table 4 provides the results of ANOVA tests of industry-factor significance for three of
our four hypothesized important characteristics: Tobin’s Q ratio (in Panel A), product
uniqueness (in Panel B) and stock return volatility (in Panel C). (We omit the Herfindahl
index since it is calculated on an industry basis.) For all three, the industry factor tends
to be highly significant, generally explaining from 16-28% of the variation in the
characteristics. (The one exception is that in 2000 the industry factor for product
uniqueness was not significantly different from zero.)
To test our hypotheses further, in Table 5 we focus on the results from a series of
regressions in which the dependent variables are the governance indices and the
18

independent variable are proxies for industry common characteristics. 13 The dependent
variables are the total governance index in model (1), the board index in model (2), and
the charter provision index in model (3).14 In addition to the coefficient estimates, the
table presents t-statistics, where the estimated standard errors are robust to
heteroscedasticity (see White, 1980), and corrected for clustering within industries over
time. This correction implies that our degrees of freedom equal the number of industries
(not industry-years) and our significance levels reflect this.
According to the results for model (1), the total governance index is related to the
industry’s investment opportunities (using our proxy, Tobin’s Q), its product uniqueness,
its degree of competition, and its average leverage. The total governance index is not
significantly related to industry volatility, the presence of regulation, or to the structure of
executive compensation.
Examining models (2) and (3) along with model (1) provides insights as to the
effects of these variables by showing whether the significance of the coefficients on the
total governance index derives from the board index or the provision index (or both).
First, the effects of investment opportunities on the total governance index appear to
stem from board structure rather than from governance provisions. This relation is
consistent with the hypothesis that the benefits of board monitoring are higher in
industries with greater growth or investment opportunities.
Partially offsetting the overall positive coefficient for Tobin’s Q ratio is the
negative relation between the total governance index and the industry’s product
uniqueness. This negative relation is driven largely by the relation between the board
index and product uniqueness, implying that industries with unique products are less
13 In this set of regressions we omit the industry category “other” because we are examining systematic industry factors and the “other” category contains a diverse set of firms that cannot be otherwise categorized. Thus, we would not expect systematic factors to exist for this group.
19
likely to have stronger monitoring through their board of directors. This result is
consistent with the idea that managers in some industries are allowed more flexibility in
decision-making. Further, if one assumes that industries with unique products are those
requiring more managerial initiative, this result is also consistent with the theory of
Burkart, Gromb and Panunzi (1997) that excessive monitoring can harm managerial
initiative.
The results show that an industry’s governance structure is significantly related to
its competitive environment. Firms in more competitive environments, as measured by
the Herfindahl index of product market concentration, have governance structures that
are less restrictive for management (a combination of weaker boards and more charter
provisions in place). This result is consistent with the hypothesis that product market
competition disciplines managers and may substitute for internal corporate governance
structures.
Although the industry’s information environment (based on the return volatility
proxy) is significant in each of the constituent indices, industries with greater volatility
have weaker board structures, but fewer charter provisions. The overall effect is no
relation with the total governance structure. This is consistent with the argument that the
board monitoring costs are higher in less stable or noisier environments.
Industries with greater financial leverage are, on average, associated with
weaker governance structures. This result is driven by the relation between leverage
and the board index, and is consistent with arguments by Jensen (1986) and Hart (1995)
that leverage imposes discipline on the managers, reducing the need for a strong board
of directors. We observe no significant relations between board structure or charter
provision use and regulated industries.
14 Although the dependent variables have finite support, we use ordinary least squares regressions, as we do not have observations near the support limits of zero and 100.
20
Finally, the total corporate governance structure does not differ significantly
across industries for the different years in the sample (1997-2000). However, there are
significant differences in board structures and by-law and charter provisions across the
years. The signs of the coefficients suggest that board structures are stronger in each of
the years 1998-2000 as compared to the first year in the sample, but that charter
provisions are weaker (from the shareholder perspective). Further F-tests for
differences between the dummies indicate that the board structures became
progressively stronger and the charter governance measures became progressively
weaker.15 These tests provide evidence on statistical significance; we explore the
economic importance of these changes more thoroughly in later sections of the paper.
The results in Table 5 indicate that studying board structure or charter provisions
by themselves would lead to very different conclusions as to how governance structure
relates to the industry characteristics. This provides two particularly important insights
into analyzing corporate governance structures. First, a complete analysis of
governance structure should examine sets of similar controllable corporate governance
structures rather than focusing only on individual governance components. Second, it is
also important to consider related governance components separately (in this case our
board and provisions indices). Our evidence suggests that combining the board and
governance provisions into a single index masks relations between the component
indices and characteristics associated with the relative costs and benefits of each. Aside
from the implications for empirical researchers, this is important in the context of (a)
single-number governance scores being developed in practice, and (b) mandated
increases in board independence in recent regulatory changes.
15 The F-tests show that for the board index regressions all three annual dummy variables are significantly different from each other. For the provision index regressions, 1998 was significantly different from 2000, as was 1999, but 1998 and 1999 were not significantly different from each other.
21
V. Empirical evidence on firm factors
In this section, we incorporate firm characteristics into the analysis to explore the
relative importance of firm versus industry factors in explaining governance structure
variation. The issue we address is that once we have controlled for industry factors, how
are governance structures associated with firm-specific factors? Thus, in this analysis,
we effectively replace the industry-level variables with firm-level variables. We omit the
measures of industry concentration, selling expenses to sales and regulated industries
and instead include industry-level dummy variables to capture these effects. We include
the natural logarithm of assets as a measure of firm size, book leverage, and director
and officer percentage equity ownership (to recognize that such ownership could affect
board structure and charter provision use). We also incorporate the ratio of top-manager
incentive compensation to total compensation. Two measures of institutional ownership
are used. The first is total percentage of equity held by institutions. The second is a
measure of institutional ownership concentration: a ranking of institutional ownership
Herfindahls.16 We incorporate the log of firm age and firm volatility (the standard
deviation of monthly returns).
One industry-level factor that we still include in the firm-level regressions is a
measure of investment opportunities. The rationale is that, although there is a systematic
industry factor in investment opportunities, these opportunities can also vary across
firms within an industry. A complicating factor at the firm level, however, is the possible
endogeneity between our measure of investment opportunities, Tobin’s Q, and the
governance indices. Tobin’s Q reflects market valuations and growth opportunities, thus,
if investors value certain corporate governance structures (as suggested by Gompers,
22

Ishii, and Metrick, 2002), the valuation effects in Tobin’s Q may lead us to inappropriate
conclusions. To address this issue, we also use the ratio of capital expenditures to sales
as an alternative measure in order to capture the growth opportunity implications of Q
without the valuation effects.17 Because of this and similar potential endogeneity
problems, we view these firm-level tests as exploratory.
Table 6 reports the results of regression analyses examining the relation
between the governance indices and firm-level characteristics. Dummy variables control
for industry and year effects (the coefficients are not included in the table for the sake of
brevity). The reported coefficients can be interpreted as estimating the effect of within-
industry variation. The proxy for investment opportunities is Tobin’s Q in Models (1), (3)
and (5) and the ratio of capital expenditures to sales in Models (2), (4) and (6). Given
that our findings are generally robust to the alternate specifications, we focus our
discussion on the results using Q as the dependent variable, but discuss interesting
aspects of the alternate specification.
The results in Table 6 suggest that firm-level relations between corporate
governance structures and investment opportunities differ somewhat from those at the
industry level. In the total index, model (1), Q does not appear to be related to
governance structure, however, in model (3) we see that firms with high growth
opportunities tend to have weaker boards, which is a result counter to what we found in
the industry analysis. The difference is that in this analysis we are holding industry
constant, while in the previous table we were taking averages within an industry. Thus,
across industries, high growth opportunities are associated with stronger boards, but
within industries, the higher-growth-opportunity firms tend to have weaker boards. There
16 We use a ranking of a Herfindahl index of institutional ownership concentration because of outliers in the percentage of institutional ownership variable. This approach is consistent with that of Hartzell and Starks (2002),
23
is no significant association between Q and the provisions index. In models (2), (4) and
(6), we observe that CapEx to sales is negatively associated with the board index, but
positively associated with the charter provisions index and the total index. Although the
level of significance differs across the two specifications, the results are broadly
consistent with the Gompers, Ishii, and Metrick (2001) finding that investment
opportunities are positively correlated with more shareholder-friendly charter provisions.
Focusing on firm size shows that the total governance index is negatively related
to firm size. Examining the components of the total governance index suggests that the
relation is driven by the use of corporate charter provisions, as larger firms tend to use
more charter provisions. We observe no relationship between firm size and the board
index, ceteris paribus. In contrast to the industry-effects regressions, higher firm
leverage is not associated with the board index, but strongly associated with increased
provision use at the firm level.
The influence of directors and officers as measured by their equity ownership is
significantly related to all three indices. Companies in which directors and officers have
more power have weaker board structures, but less restrictive (more shareholder-
oriented) charter provisions. The overall effect is that the total governance structure is
weaker. Although one could interpret this effect as evidence that managers are
entrenched, the lower level of antitakeover measures in such firms would appear
inconsistent with such an interpretation.18 An alternative interpretation is that directors’
and officers’ equity ownership provides its own incentive effects and that other elements
of the board index provide few additional monitoring benefits.
17 In order to mitigate the effect of outliers, we exclude observations where capital expenditures are greater than sales. 18 The net effect of fewer antitakeover amendments on managerial entrenchment would depend on whether director and officer ownership is significant enough to effectively block acquisition attempts.
24
Total institutional ownership generally lacks significance, however companies in
which institutional ownership is more concentrated have stronger board structures. The
association between institutional ownership concentration and the charter provisions
index is not statistically significant. The relation between institutional ownership and
stronger board structures is consistent with institutional shareholder activists and
governance proponents advocating increased board independence.
Firm age is significantly positively related to the board structure index, implying
that older firms have stronger board structures. This result may reflect the increased cost
to younger firms of increased board monitoring (e.g., due to inhibiting managerial
initiative) relative to older firms. In contrast, firm age is not significantly related to the
total governance index. Since there is no significant relation between firm age and the
charter provision index, the absence of significance from the board index to the total
index is likely to be driven by an offsetting negative effect from the third component of
our total governance index, the state index. Further analysis confirms this to be the
case; there is a significant negative correlation between the state index and firm age.
Older firms tend to be incorporated in states with more business-friendly provisions,
consistent with the results of Bebchuk and Cohen (2002). This result is also consistent
with the results of Field and Karpoff (2001) who find that seasoned firms are in more
business-friendly states than are IPO firms.
Finally, we find a strong positive relation between a firm’s corporate governance
structure and its information environment (within the industry) as reflected in the return
volatility. Interestingly, the lack of significance between volatility and the board index
indicates that the relationship in the aggregate is driven by charter provisions. That is,
firms with a more uncertain information environment have fewer charter provisions,
consistent with the industry-level results of Table 5.
25
We test for the joint significance of firm-level variables in two ways. First, using F
tests, we can reject the null that all the coefficients on the firm-level variables are jointly
zero for all specifications, implying that the firm level variables add explanatory power
after we control for industry and time effects. To estimate the economic significance of
this increase in explanatory power, we also estimate a model (not tabled) regressing
each index on only the industry and year dummies. The R-squareds from these models
are at the bottom of Table 6. They show that for the Tobin’s Q analysis in models (1),
(3) and (5), industry and time explain 8.8% of the Total index, 10.4% of the Board index,
and 6.1% of the Provisions index. Comparing these to the r-squared values for the full
models in Table 6 of 10.5% (Total index), 20.3% (Board index) and 10.9% (Provisions
index) provides a qualitative indication that both firm and industry influences are
important in explaining the variance in governance structures. This is especially true for
the two component indices, where industry and time account for roughly half of the
variation in governance structures across firms. However, in the aggregate index, the
firm-level factors add less explanatory power beyond those of time and Industry.
VI. Changes in corporate governance structures
Because we have a four-year sample period, we can examine changes in our
corporate governance structures over a short time frame. Table 7 shows the summary
statistics for these changes. Recalling that each of the three indices (total governance
index, board index, charter provision index) shown in the table has an average of about
49, the mean annual changes in governance indices are economically small. In fact, the
median change for each of the indices is zero. The final two columns, which show the
number of increases and decreases for each index, provide insight into the changes.
While there are both increases and decreases in the overall governance index, these
changes derive primarily from board structure rather than the provisions index. In fact,
26
the table indicates that there are very few changes in the provisions index. The table
also indicates that there are changes in both directions, suggesting that while some
boards are becoming stronger, others are becoming weaker. However, recall that the
evidence in Table 5 showed that on an industry level, there have been trends in that
boards in general were becoming stronger.
To examine whether there are any systematic determinants of the short-term
changes in corporate governance indices, we regress the firm’s change in index against
firm-specific factors. One would expect that the short-term changes could be affected by
recent firm performance, by how the firm’s governance structure compares to other
firms, and by institutional investor influence. We also include dummy variables for the
particular year of the changes. Table 8 provides the results of this analysis.
We find that current or previous-year performance does not have an effect on
changes in a company’s corporate governance structure, at least for our sample
period.19 A significant factor is the relation between the firm’s governance structure and
other firms’ structures in the preceding year. To measure this relative standing, we
construct an abnormal index measure for each of our three indices, defined as the
residual from a regression of the relevant index on industry and year indicator variables.
We find a significant negative relation between changes in an index and the prior year’s
abnormal index. So, on average, firms with weaker governance structures given the
industry and year experience strengthen their governance structure going forward,
ceteris paribus. This mean-reversion effect holds for all three indices; firms with different
total governance, board structures, or charter provisions from similar firms tend to
change back toward the mean. This is consistent with our second alternative hypothesis
19 This does not imply that over a longer term there would not be a relation between performance and governance structure. Poorly performing firms are often pressured by institutional investors and others to change, including changes in boards and provisions (Smith, 1996).
27
that firms’ governance structures are similar, e.g., by firms choosing governance
provisions similar to those of their peers.
Of note is that total institutional ownership is associated with a move toward
stronger board monitoring and lower use of charter provisions – an effect that is also
reflected in the total index. This effect is consistent with institutional investors as a group
paying increased attention to governance issues, however, there is no indication that
institutional investors with more influence in a firm having an effect on governance
structures during our sample period as institutional ownership concentration is not
significantly related to any change in governance structures.
VII. Conclusions
Corporate governance structures provide firms with the costs and benefits of
monitoring management to mitigate the agency problems inherent in the corporate form.
Since the agency problems between shareholders and managers vary across firms due
to differences in the firms’ environments, the costs and benefits of monitoring those
problems would be expected to vary as well. Thus, in this paper we have examined the
systematic relations between firms’ controllable governance structures and factors in the
firms’ environments.
In an industry-level analysis, we find that the strength of the monitoring from the
total controllable governance structure (including the board, the bylaw and charter
provisions, and the state laws) is systematically related to the industry’s investment
opportunities, product uniqueness, competitive environment and leverage. In addition,
the board and charter provision indices are each related to the industry’s return volatility
(as a proxy for information environment) with offsetting effects. These findings also
provide support for the suggestion that governance structures are related to the relative
costs and benefits of different governance mechanisms.
28
We also find some evidence of systematic variation in governance over time. We
find that between industries, boards have moved toward increased monitoring, while
corporate charter provisions have moved toward a more firm-friendly structure. Within
industries, we find evidence of mean reversion for each of our governance indices.
These results imply that governance structures that appear to be weaker in monitoring
capability than predicted by a firm’s industry and time are expected to strengthen in the
future.
Our results have implications for policy makers and researchers alike. First, it is
important to consider different elements of a firm’s governance structure, and not just the
use of board structures or governance provisions. Second, while aggregating
governance structures into a single number allows one to examine systematic
tendencies, the aggregation may also mask important relations between governance
components and firm or industry characteristics. Finally, our results suggest that
regulatory actions applying a one-size-fits-all criterion may be suboptimal, and increase
contracting costs for some firms.
29
References
Bebchuk, Lucian, and Alma Cohen, 2002, Firms’ decisions where to incorporate, working paper, Harvard University.
Bhagat, Sanjai. and James A. Brickley, 1984, Cumulative Voting: The Value of Minority Shareholder Voting Rights, Journal of Law and Economics 27,339-366.
Bittlingmayer, George, 1999, The market for corporate control (including takeovers), Encyclopedia of Law and Economics, Vol. III – The Regulation of Contracts, Boudewijn Bouckaert and Gerritt De Geest, Edward Elgar and the University of Ghent.
Bizjak, John, Michael Lemmon, and Lalitha Naveen, 2002, Has the use of peer groups contributed to higher levels of executive compensation?, working paper, Portland State University.
Borokhovich, Kenneth A., Robert Parrino, and Teresa Trapani, 1996. Outside directors and CEO selection. Journal of Financial and Quantitative Analysis 31, 337-355.
Brickley, James, Jeffrey Coles, and Gregg Jarrell, 1997, Leadership Structure: Separating the CEO and Chairman of the Board, Journal of Corporate Finance 3, 189-220.
Brickley, James, Jeffrey Coles, and R Terry, 1994, Outside directors and the adoption of poison pills, Journal of Financial Economics 35, 371-390.
Burkart, Mike, Dennis Gromb, and Fausto Panunzi, 1997, Large shareholders, monitoring and the value of the firm, Quarterly Journal of Economics, 693-798.
Bushman, Robert, Qi Chen, Ellen Engel and Abbie Smith, 2000, The sensitivity of corporate governance systems to the timeliness of accounting earnings, working paper, University of North Carolina, Duke University and the University of Chicago.
Danielson, Morris, and Jonathan Karpoff, 1998, On the uses of corporate governance provisions, Journal of Corporate Finance 4, 347-371.
Defond, Mark, and Chul W. Park, 1999, The effect of competition on CEO turnover, Joural of Accounting and Economics, 27, 269-305.
Deli, Daniel N., and Stuart L. Gillan, On the demand for independent and active audit committees, Journal of Corporate Finance 6, 2000,427-455.
Demsetz, Harold, and Kenneth Lehn, 1985, The structure of corporate ownership: Causes and consequences, Journal of Political Economy 33, 3-53.
Durnev, Artyom, Randall Morck, and Bernard Yeung, 2001, Does firm-specific information in stock prices guide capital allocation?, NBER working paper 8093.
Fama, Eugene F., and Kenneth R. French, 1997, Industry costs of equity, Journal of Financial Economics 43, 153-194.
Fama, Eugene F., and Michael Jensen, 1983, Separation of ownership and control, Journal of Law and Economics 26, 301-326.
Gartman, Grant, 2000, State Antitakeover Laws, Investor Responsibility Center, Washington, D.C.
Gillan, Stuart L., and Laura T. Starks, 1998. A survey of shareholder activism: Motivation and empirical evidence. Contemporary Finance Digest 2, 10-34.
30
Gillan, Stuart L., and Laura T. Starks, 2000. Corporate governance proposals and shareholder activism: The role of institutional investors. Journal of Financial Economics 57, 275-305.
Gompers, Paul, Joy Ishii, and Andrew Metrick, 2001, Corporate governance and equity prices, NBER working paper 8449.
Goyal, Vidhan K., and Chul W. Park, 2002, Board leadership structure and CEO turnover, Journal of Corporate Finance 8, 49-66.
Hart, Oliver, 1983, The market mechanism as an incentive scheme, The Bell Journal of Economics 14, 366-382.
Hart, Oliver, 1995, Firms, Contracts and Financial Structure, Oxford University Press. Hartzell, Jay, 2001, The impact of the likelihood of turnover on executive compensation,
University of Texas at Austin working paper. Hartzell, Jay and Laura Starks, 2002, Institutional investors and executive
compensation, University of Texas at Austin working paper. Hermalin, Benjamin and Michael Weisbach, 2002, Boards of directors as an
endogenously determined institution: A survey of the economic literature, FRBNY Economic Policy Review, forthcoming.
Hermalin, Benjamin and Michael Weisbach, 1988, The determinants of board composition, Rand Journal of Economics 19, 589-606.
Jarrell, Gregg and Annette Poulsen, 1988a, Shark repellants and stock prices: The effects of antitakeover amendments since 1980, Journal of Financial Economics 19, 127-168.
Jarrell, Gregg and Annette Poulsen, 1988b, Dual class recapitalizations as antitakeover mechanisms: The recent evidence, Journal of Financial Economics 20, 129-152.
Jensen, Michael, 1986, Agency costs of free cash flow, corporate finance and takeovers, American Economic Review 76, 323-329.
Jensen, Michael, 1993, The modern industrial revolution, exit and the failure of internal control systems, Journal of Finance 48, 831-880.
John, Kose and Senbet, Lemma, 1998, Corporate governance and board effectiveness, Journal of Banking and Finance, 22, 371-401.
John, Kose and Semi Kedia, 2002, Design of Corporate Governance: Role of Ownership Structure, Takeovers, Bank Debt and Large Shareholder Monitoring, New York University working paper.
Klein, April, 1998, Firm performance and board committee structure, Journal of Law and Economics 41, 275-303.
Kole, Stacey, and Kenneth Lehn, Deregulation and the adaptation of governance structure: the case of the U.S. airline industry, Journal of Financial Economics 52, 79-117.
Leibenstein, Harvey, 1966, Allocative efficiency vs. ‘X-efficiency’,” American Economic Review 56, 392-415.
Mitchell, Mark L. and J. Harold Mulherin, 1996, The impact of industry shocks on takeover and restructuring activity, Journal of Financial Economics 41, 193-226.
31
Murphy, Kevin, 1998, Executive Compensation, in Handbook of Labor Economics, Ashenfelter, O., and Card, D. (editors), Volume 3, North Holland.
Parrino, Robert, 1997, CEO turnover and outside succession: a cross sectional analysis, Journal of Financial Economics 46, 165-197.
Shleifer, Andrei and Robert W. Vishny, 1997, A survey of corporate governance, Journal of Finance 52, 737-783.
Smith, Michael, 1996, "Shareholder Activism by Institutional Investors: Evidence from CalPERS," Journal of Finance 51, 227-252.
Smith, Clifford W. and Ross L. Watts, 1992, The investment opportunity set and corporate financing, dividend and compensation policies, Journal of Financial Economics 32, 263-292.
Titman, Sheridan and Roberto Wessels, 1988, The determinants of capital structure choice, Journal of Finance 43, 1-19.
Weisbach, Michael S., 1988. Outside directors and CEO turnover. Journal of Financial Economics 20, 431-46
White, Hal, 1980. A heteroscedasticity-consistent covariance matrix and a direct test for heteroscedasticity, Econometrica 48, 817-838.
Yermack, David, 1996, Higher market valuation for firms with a small board of directors, Journal of Financial Economics 40, 185-211.
32
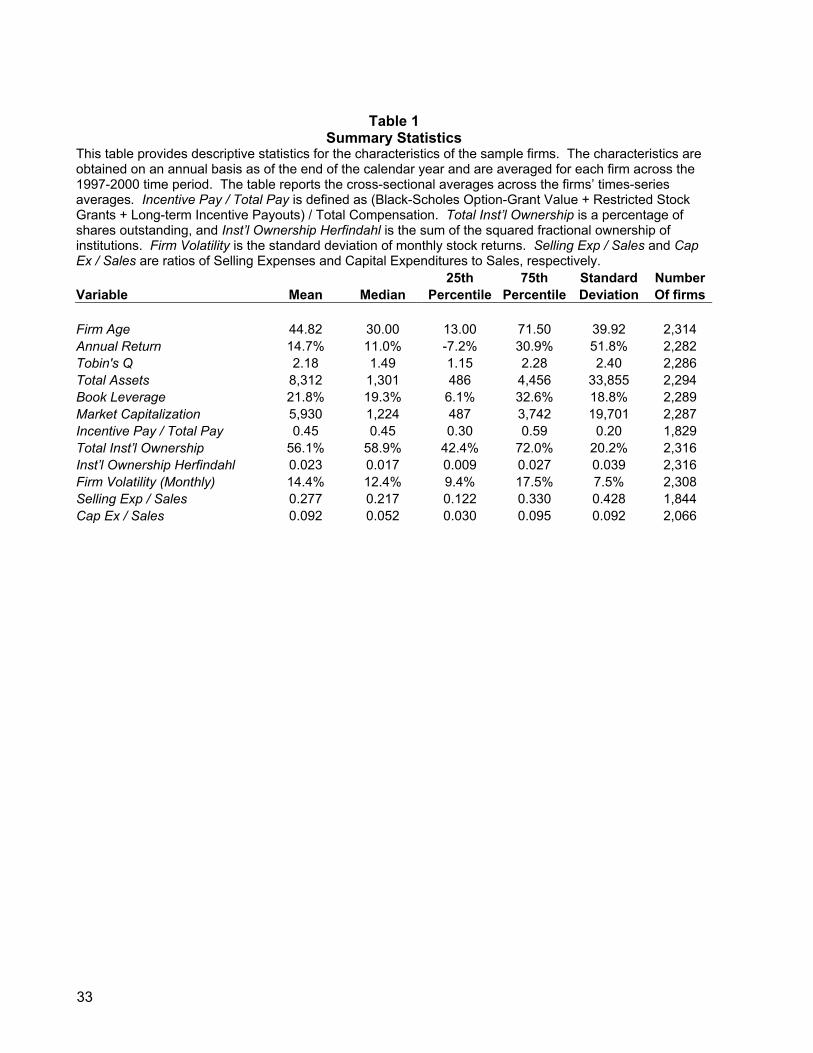
Table 1
Summary Statistics This table provides descriptive statistics for the characteristics of the sample firms. The characteristics are obtained on an annual basis as of the end of the calendar year and are averaged for each firm across the 1997-2000 time period. The table reports the cross-sectional averages across the firms’ times-series averages. Incentive Pay / Total Pay is defined as (Black-Scholes Option-Grant Value + Restricted Stock Grants + Long-term Incentive Payouts) / Total Compensation. Total Inst’l Ownership is a percentage of shares outstanding, and Inst’l Ownership Herfindahl is the sum of the squared fractional ownership of institutions. Firm Volatility is the standard deviation of monthly stock returns. Selling Exp / Sales and Cap Ex / Sales are ratios of Selling Expenses and Capital Expenditures to Sales, respectively. 25th 75th Standard NumberVariable Mean Median Percentile Percentile Deviation Of firms Firm Age 44.82 30.00 13.00 71.50 39.92 2,314 Annual Return 14.7% 11.0% -7.2% 30.9% 51.8% 2,282 Tobin's Q 2.18 1.49 1.15 2.28 2.40 2,286 Total Assets 8,312 1,301 486 4,456 33,855 2,294 Book Leverage 21.8% 19.3% 6.1% 32.6% 18.8% 2,289 Market Capitalization 5,930 1,224 487 3,742 19,701 2,287 Incentive Pay / Total Pay 0.45 0.45 0.30 0.59 0.20 1,829 Total Inst’l Ownership 56.1% 58.9% 42.4% 72.0% 20.2% 2,316 Inst’l Ownership Herfindahl 0.023 0.017 0.009 0.027 0.039 2,316 Firm Volatility (Monthly) 14.4% 12.4% 9.4% 17.5% 7.5% 2,308 Selling Exp / Sales 0.277 0.217 0.122 0.330 0.428 1,844 Cap Ex / Sales 0.092 0.052 0.030 0.095 0.092 2,066
33
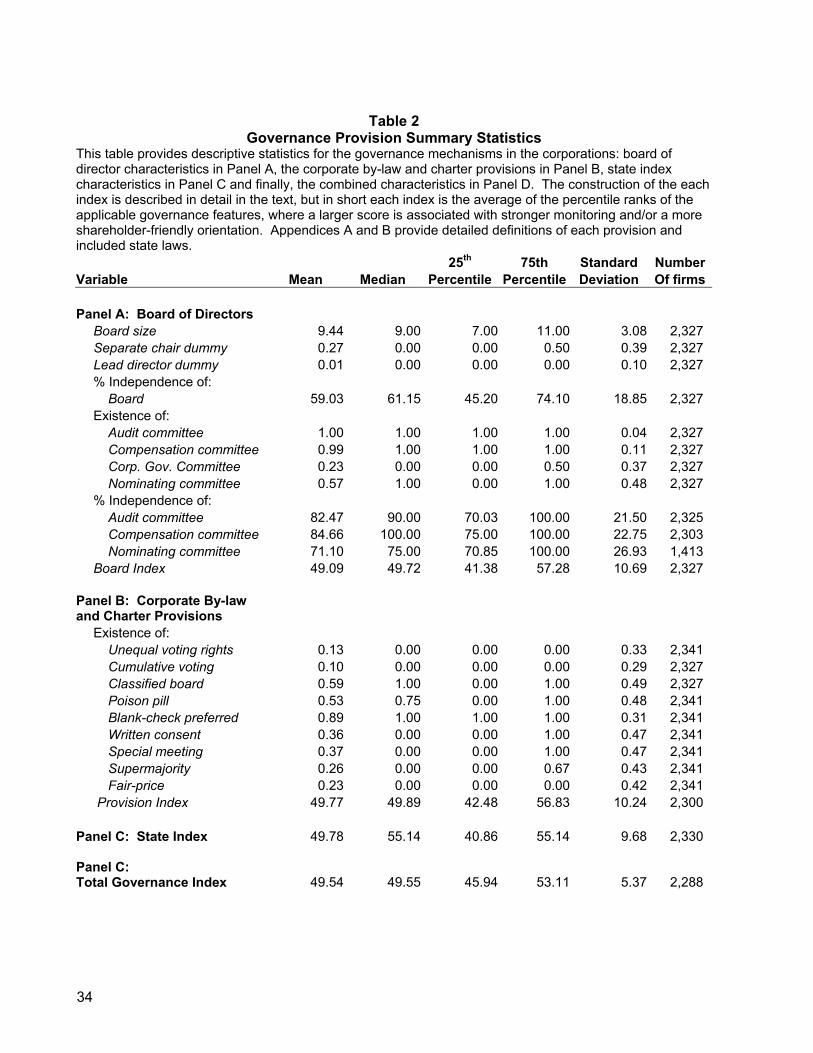
Table 2
Governance Provision Summary Statistics This table provides descriptive statistics for the governance mechanisms in the corporations: board of director characteristics in Panel A, the corporate by-law and charter provisions in Panel B, state index characteristics in Panel C and finally, the combined characteristics in Panel D. The construction of the each index is described in detail in the text, but in short each index is the average of the percentile ranks of the applicable governance features, where a larger score is associated with stronger monitoring and/or a more shareholder-friendly orientation. Appendices A and B provide detailed definitions of each provision and included state laws. 25th 75th Standard NumberVariable Mean Median Percentile Percentile Deviation Of firms Panel A: Board of Directors Board size 9.44 9.00 7.00 11.00 3.08 2,327 Separate chair dummy 0.27 0.00 0.00 0.50 0.39 2,327 Lead director dummy 0.01 0.00 0.00 0.00 0.10 2,327 % Independence of: Board 59.03 61.15 45.20 74.10 18.85 2,327 Existence of: Audit committee 1.00 1.00 1.00 1.00 0.04 2,327 Compensation committee 0.99 1.00 1.00 1.00 0.11 2,327 Corp. Gov. Committee 0.23 0.00 0.00 0.50 0.37 2,327 Nominating committee 0.57 1.00 0.00 1.00 0.48 2,327 % Independence of: Audit committee 82.47 90.00 70.03 100.00 21.50 2,325 Compensation committee 84.66 100.00 75.00 100.00 22.75 2,303 Nominating committee 71.10 75.00 70.85 100.00 26.93 1,413 Board Index 49.09 49.72 41.38 57.28 10.69 2,327 Panel B: Corporate By-law and Charter Provisions Existence of: Unequal voting rights 0.13 0.00 0.00 0.00 0.33 2,341 Cumulative voting 0.10 0.00 0.00 0.00 0.29 2,327 Classified board 0.59 1.00 0.00 1.00 0.49 2,327 Poison pill 0.53 0.75 0.00 1.00 0.48 2,341 Blank-check preferred 0.89 1.00 1.00 1.00 0.31 2,341 Written consent 0.36 0.00 0.00 1.00 0.47 2,341 Special meeting 0.37 0.00 0.00 1.00 0.47 2,341 Supermajority 0.26 0.00 0.00 0.67 0.43 2,341 Fair-price 0.23 0.00 0.00 0.00 0.42 2,341 Provision Index 49.77 49.89 42.48 56.83 10.24 2,300 Panel C: State Index 49.78 55.14 40.86 55.14 9.68 2,330 Panel C: Total Governance Index 49.54 49.55 45.94 53.11 5.37 2,288
34
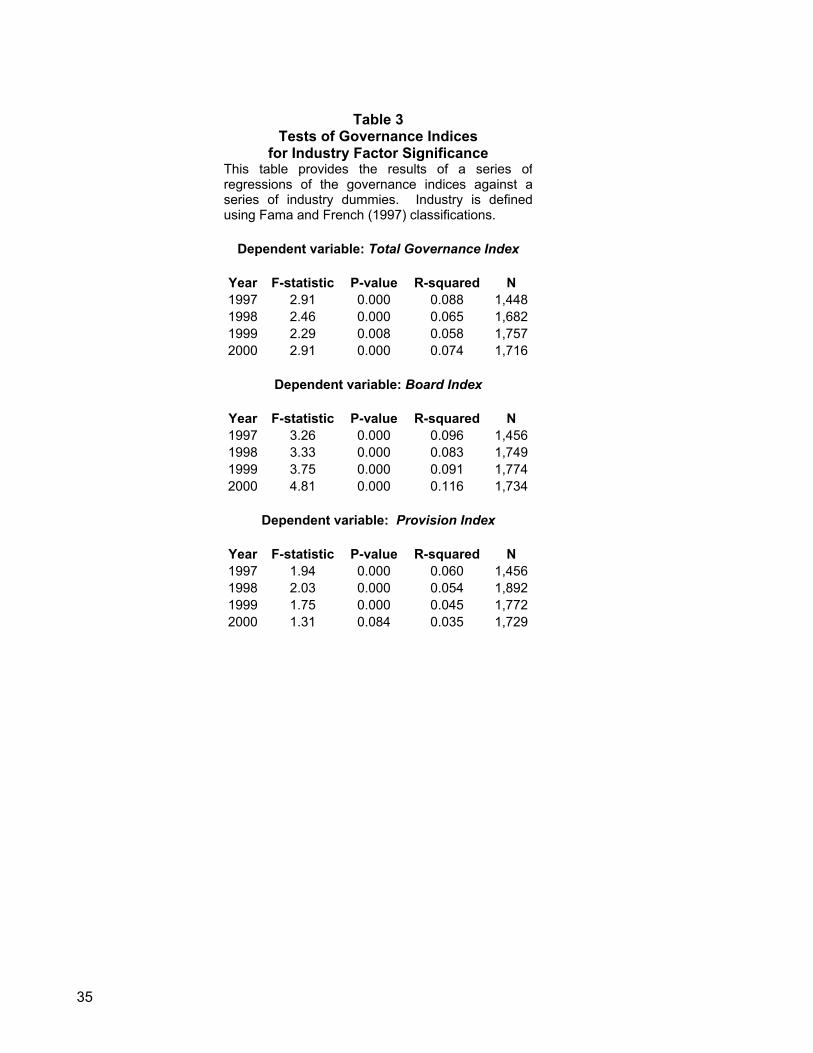
Table 3
Tests of Governance Indices for Industry Factor Significance
This table provides the results of a series ofregressions of the governance indices against aseries of industry dummies. Industry is defined using Fama and French (1997) classifications.
Dependent variable: Total Governance Index
Year F-statistic P-value R-squared N 1997 2.91 0.000 0.088 1,4481998 2.46 0.000 0.065 1,6821999 2.29 0.008 0.058 1,7572000 2.91 0.000 0.074 1,716
Dependent variable: Board Index
Year F-statistic P-value R-squared N 1997 3.26 0.000 0.096 1,4561998 3.33 0.000 0.083 1,7491999 3.75 0.000 0.091 1,7742000 4.81 0.000 0.116 1,734
Dependent variable: Provision Index
Year F-statistic P-value R-squared N 1997 1.94 0.000 0.060 1,4561998 2.03 0.000 0.054 1,8921999 1.75 0.000 0.045 1,7722000 1.31 0.084 0.035 1,729
35
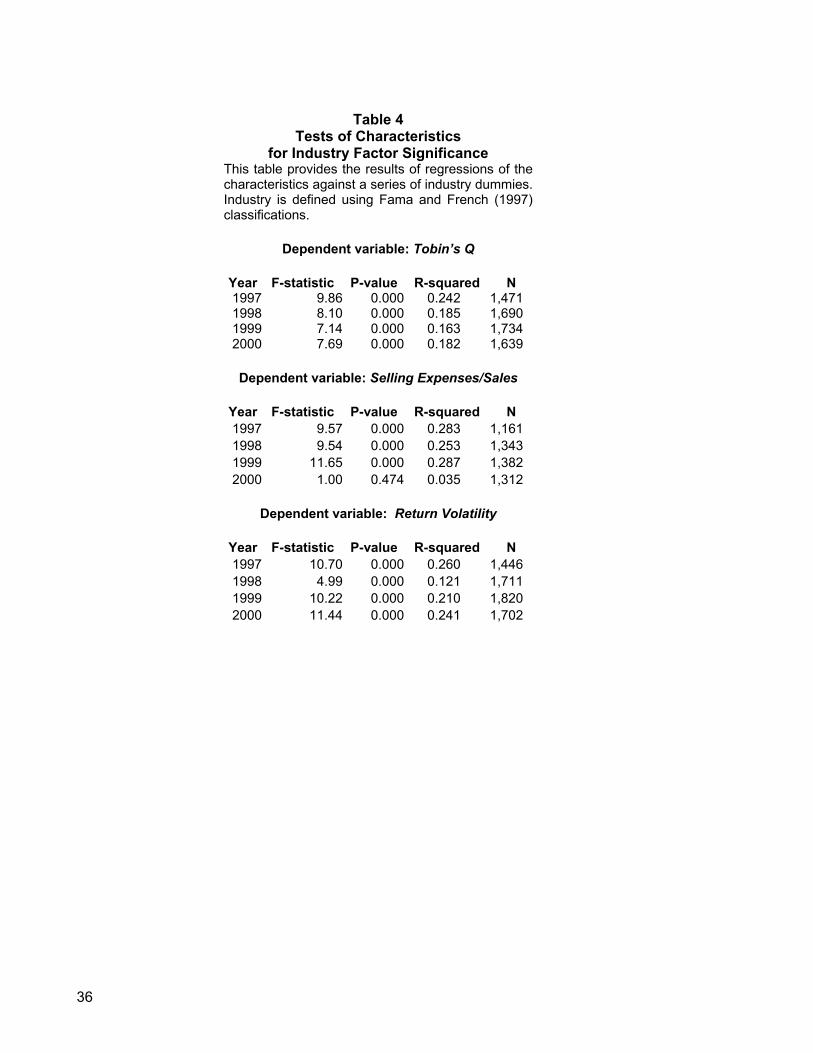
Table 4
Tests of Characteristics for Industry Factor Significance
This table provides the results of regressions of thecharacteristics against a series of industry dummies.Industry is defined using Fama and French (1997) classifications.
Dependent variable: Tobin’s Q
Year F-statistic P-value R-squared N 1997 9.86 0.000 0.242 1,471 1998 8.10 0.000 0.185 1,690 1999 7.14 0.000 0.163 1,734 2000 7.69 0.000 0.182 1,639
Dependent variable: Selling Expenses/Sales
Year F-statistic P-value R-squared N 1997 9.57 0.000 0.283 1,161 1998 9.54 0.000 0.253 1,343 1999 11.65 0.000 0.287 1,382 2000 1.00 0.474 0.035 1,312
Dependent variable: Return Volatility
Year F-statistic P-value R-squared N 1997 10.70 0.000 0.260 1,446 1998 4.99 0.000 0.121 1,711 1999 10.22 0.000 0.210 1,820 2000 11.44 0.000 0.241 1,702
36
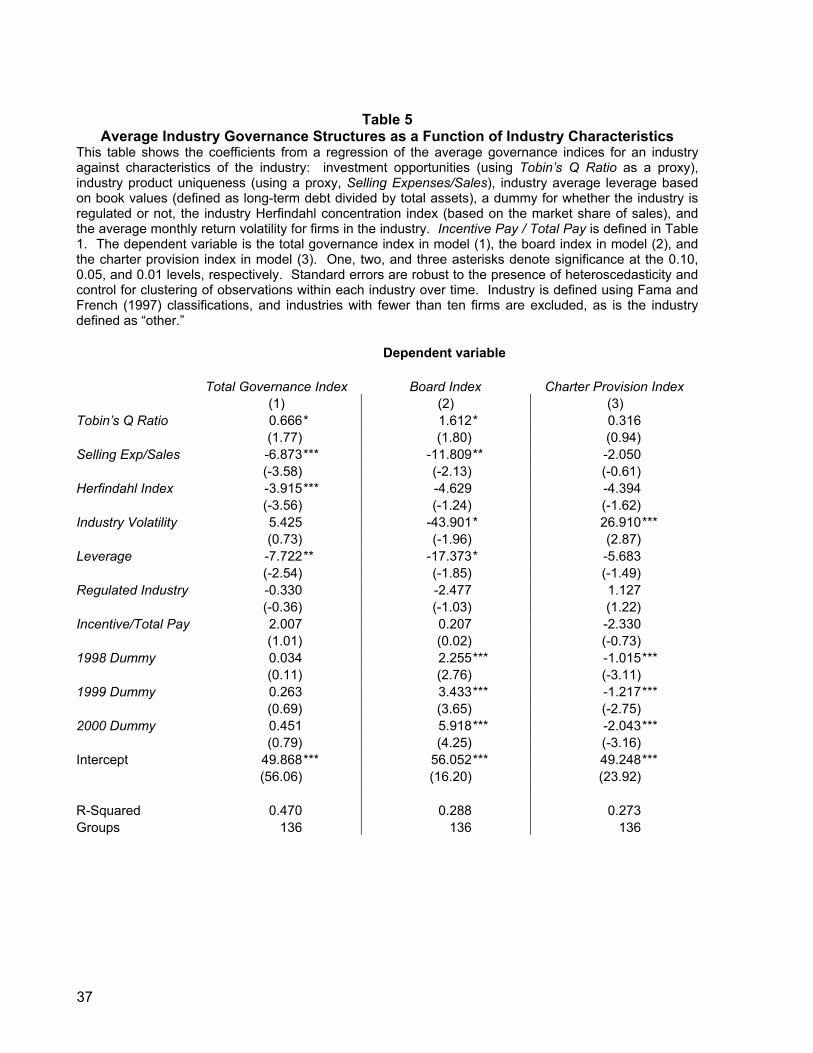
Table 5
Average Industry Governance Structures as a Function of Industry Characteristics This table shows the coefficients from a regression of the average governance indices for an industry against characteristics of the industry: investment opportunities (using Tobin’s Q Ratio as a proxy), industry product uniqueness (using a proxy, Selling Expenses/Sales), industry average leverage based on book values (defined as long-term debt divided by total assets), a dummy for whether the industry is regulated or not, the industry Herfindahl concentration index (based on the market share of sales), and the average monthly return volatility for firms in the industry. Incentive Pay / Total Pay is defined in Table 1. The dependent variable is the total governance index in model (1), the board index in model (2), and the charter provision index in model (3). One, two, and three asterisks denote significance at the 0.10, 0.05, and 0.01 levels, respectively. Standard errors are robust to the presence of heteroscedasticity and control for clustering of observations within each industry over time. Industry is defined using Fama and French (1997) classifications, and industries with fewer than ten firms are excluded, as is the industry defined as “other.” Dependent variable Total Governance Index Board Index Charter Provision Index (1) (2) (3) Tobin’s Q Ratio 0.666 * 1.612* 0.316 (1.77) (1.80) (0.94) Selling Exp/Sales -6.873 *** -11.809** -2.050 (-3.58) (-2.13) (-0.61) Herfindahl Index -3.915 *** -4.629 -4.394 (-3.56) (-1.24) (-1.62) Industry Volatility 5.425 -43.901* 26.910*** (0.73) (-1.96) (2.87) Leverage -7.722 ** -17.373* -5.683 (-2.54) (-1.85) (-1.49) Regulated Industry -0.330 -2.477 1.127 (-0.36) (-1.03) (1.22) Incentive/Total Pay 2.007 0.207 -2.330 (1.01) (0.02) (-0.73) 1998 Dummy 0.034 2.255*** -1.015*** (0.11) (2.76) (-3.11) 1999 Dummy 0.263 3.433*** -1.217*** (0.69) (3.65) (-2.75) 2000 Dummy 0.451 5.918*** -2.043*** (0.79) (4.25) (-3.16) Intercept 49.868 *** 56.052*** 49.248*** (56.06) (16.20) (23.92) R-Squared 0.470 0.288 0.273 Groups 136 136 136
37
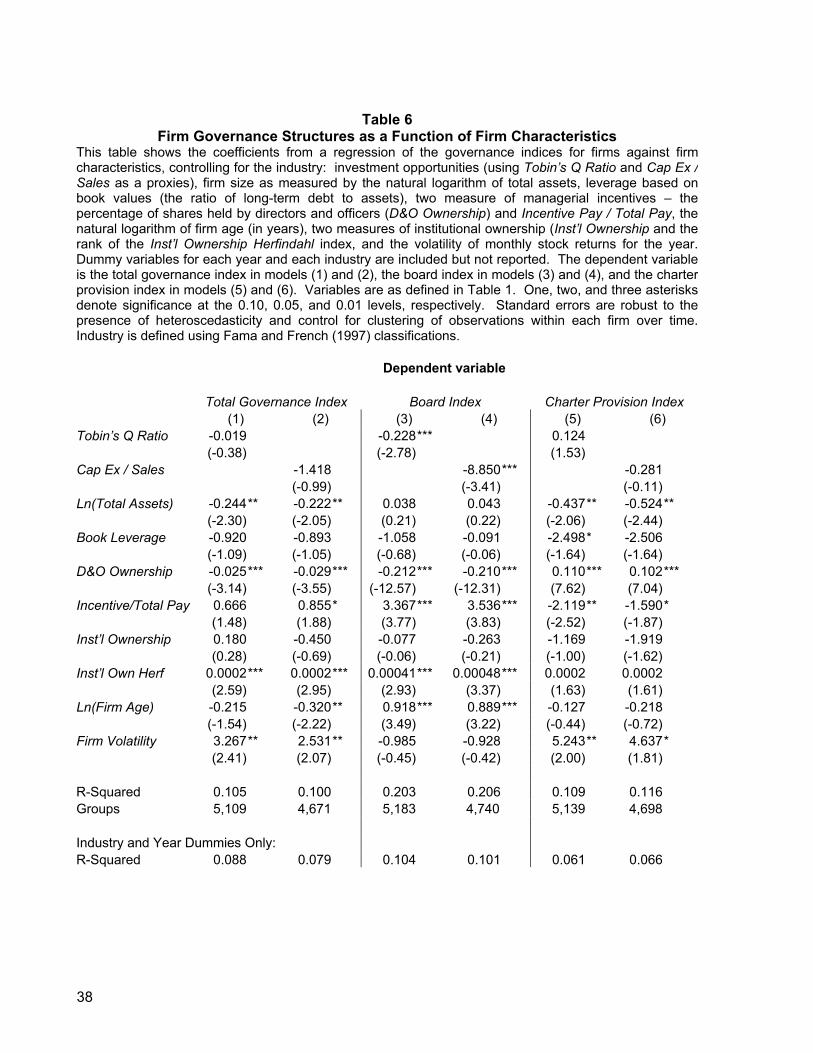
Table 6
Firm Governance Structures as a Function of Firm Characteristics This table shows the coefficients from a regression of the governance indices for firms against firmcharacteristics, controlling for the industry: investment opportunities (using Tobin’s Q Ratio and Cap Ex / Sales as a proxies), firm size as measured by the natural logarithm of total assets, leverage based on book values (the ratio of long-term debt to assets), two measure of managerial incentives – the percentage of shares held by directors and officers (D&O Ownership) and Incentive Pay / Total Pay, the natural logarithm of firm age (in years), two measures of institutional ownership (Inst’l Ownership and the rank of the Inst’l Ownership Herfindahl index, and the volatility of monthly stock returns for the year.Dummy variables for each year and each industry are included but not reported. The dependent variableis the total governance index in models (1) and (2), the board index in models (3) and (4), and the charterprovision index in models (5) and (6). Variables are as defined in Table 1. One, two, and three asterisks denote significance at the 0.10, 0.05, and 0.01 levels, respectively. Standard errors are robust to the presence of heteroscedasticity and control for clustering of observations within each firm over time.Industry is defined using Fama and French (1997) classifications. Dependent variable Total Governance Index Board Index Charter Provision Index (1) (2) (3) (4) (5) (6) Tobin’s Q Ratio -0.019 -0.228*** 0.124 (-0.38) (-2.78) (1.53) Cap Ex / Sales -1.418 -8.850*** -0.281 (-0.99) (-3.41) (-0.11) Ln(Total Assets) -0.244 ** -0.222** 0.038 0.043 -0.437** -0.524** (-2.30) (-2.05) (0.21) (0.22) (-2.06) (-2.44) Book Leverage -0.920 -0.893 -1.058 -0.091 -2.498* -2.506 (-1.09) (-1.05) (-0.68) (-0.06) (-1.64) (-1.64) D&O Ownership -0.025 *** -0.029*** -0.212*** -0.210*** 0.110*** 0.102*** (-3.14) (-3.55) (-12.57) (-12.31) (7.62) (7.04) Incentive/Total Pay 0.666 0.855* 3.367*** 3.536*** -2.119** -1.590* (1.48) (1.88) (3.77) (3.83) (-2.52) (-1.87) Inst’l Ownership 0.180 -0.450 -0.077 -0.263 -1.169 -1.919 (0.28) (-0.69) (-0.06) (-0.21) (-1.00) (-1.62) Inst’l Own Herf 0.0002 *** 0.0002*** 0.00041*** 0.00048*** 0.0002 0.0002 (2.59) (2.95) (2.93) (3.37) (1.63) (1.61) Ln(Firm Age) -0.215 -0.320** 0.918*** 0.889*** -0.127 -0.218 (-1.54) (-2.22) (3.49) (3.22) (-0.44) (-0.72) Firm Volatility 3.267 ** 2.531** -0.985 -0.928 5.243** 4.637* (2.41) (2.07) (-0.45) (-0.42) (2.00) (1.81) R-Squared 0.105 0.100 0.203 0.206 0.109 0.116 Groups 5,109 4,671 5,183 4,740 5,139 4,698 Industry and Year Dummies Only: R-Squared 0.088 0.079 0.104 0.101 0.061 0.066
38
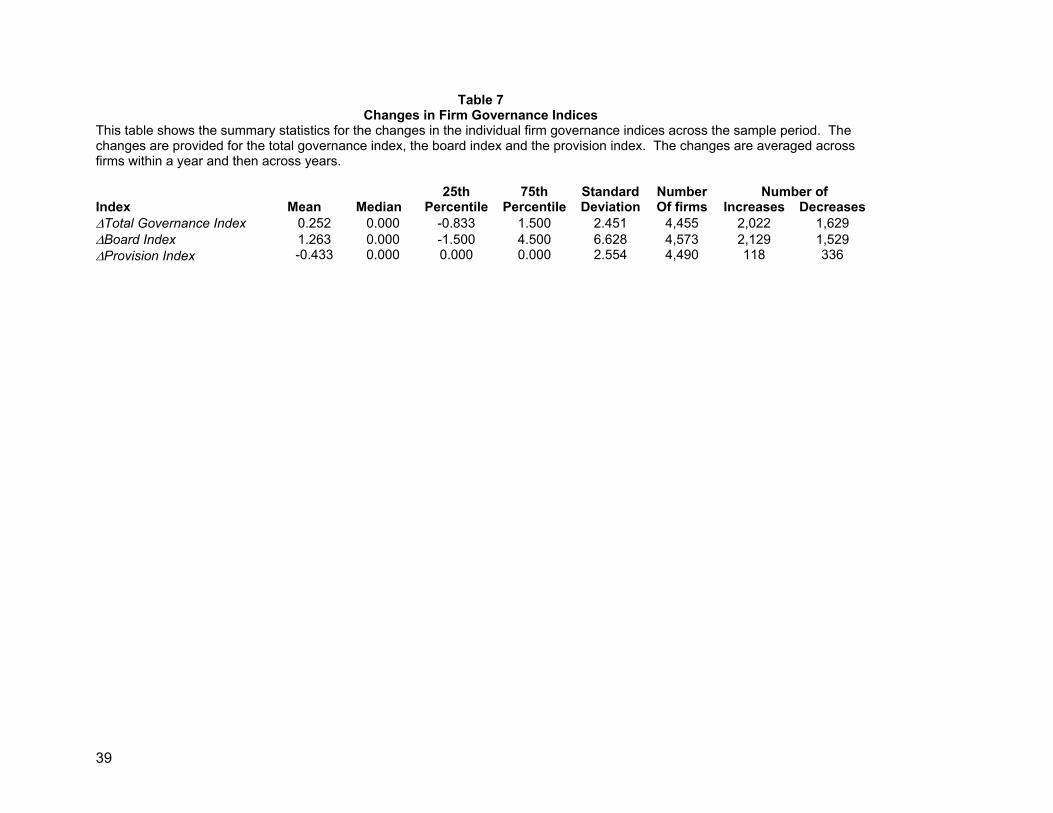
Table 7
Changes in Firm Governance Indices This table shows the summary statistics for the changes in the individual firm governance indices across the sample period. The changes are provided for the total governance index, the board index and the provision index. The changes are averaged across firms within a year and then across years.
25th 75th Standard Number Number ofIndex Mean Median Percentile Percentile Deviation Of firms Increases Decreases∆Total Governance Index 0.252 0.000 -0.833 1.500 2.451 4,455 2,022 1,629∆Board Index 1.263 0.000 -1.500 4.500 6.628 4,573 2,129 1,529∆Provision Index -0.433 0.000 0.000 0.000 2.554 4,490 118 336
39
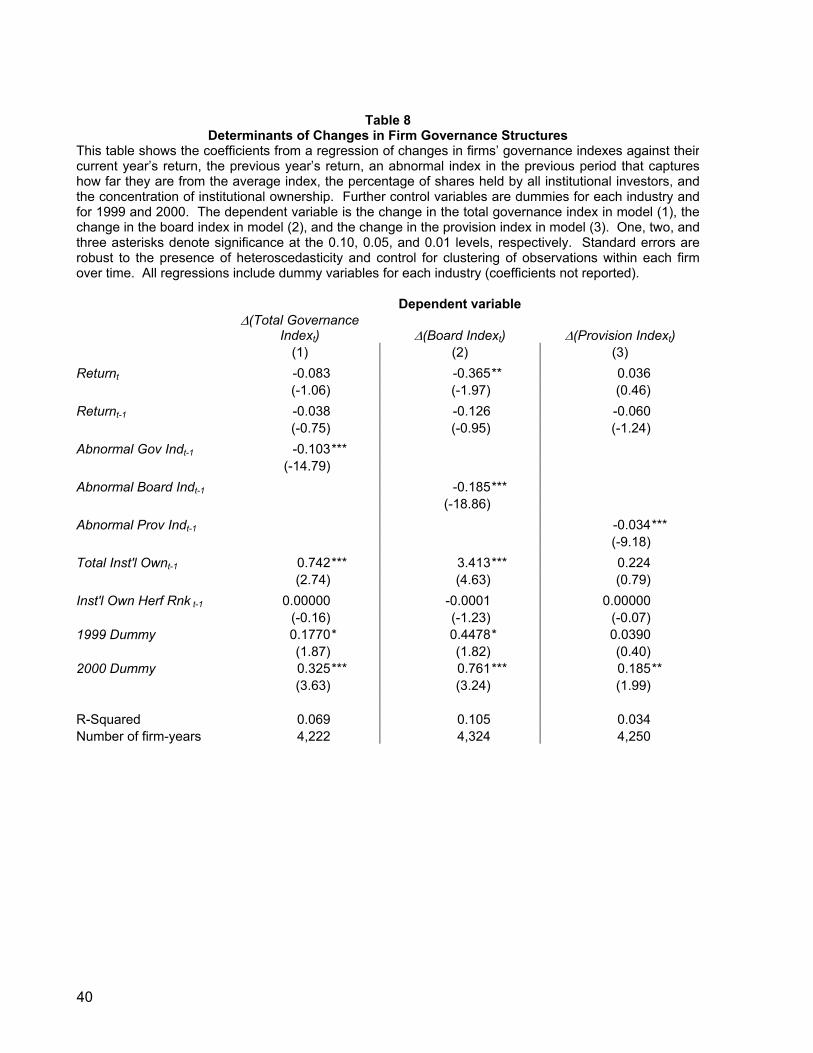
Table 8
Determinants of Changes in Firm Governance Structures This table shows the coefficients from a regression of changes in firms’ governance indexes against theircurrent year’s return, the previous year’s return, an abnormal index in the previous period that captures how far they are from the average index, the percentage of shares held by all institutional investors, andthe concentration of institutional ownership. Further control variables are dummies for each industry andfor 1999 and 2000. The dependent variable is the change in the total governance index in model (1), thechange in the board index in model (2), and the change in the provision index in model (3). One, two, andthree asterisks denote significance at the 0.10, 0.05, and 0.01 levels, respectively. Standard errors are robust to the presence of heteroscedasticity and control for clustering of observations within each firmover time. All regressions include dummy variables for each industry (coefficients not reported).
Dependent variable
∆(Total Governance
Indext) ∆(Board Indext) ∆(Provision Indext) (1) (2) (3) Returnt -0.083 -0.365** 0.036 (-1.06) (-1.97) (0.46) Returnt-1 -0.038 -0.126 -0.060 (-0.75) (-0.95) (-1.24) Abnormal Gov Indt-1 -0.103*** (-14.79) Abnormal Board Indt-1 -0.185*** (-18.86) Abnormal Prov Indt-1 -0.034*** (-9.18) Total Inst'l Ownt-1 0.742*** 3.413*** 0.224 (2.74) (4.63) (0.79) Inst'l Own Herf Rnk t-1 0.00000 -0.0001 0.00000 (-0.16) (-1.23) (-0.07) 1999 Dummy 0.1770* 0.4478* 0.0390 (1.87) (1.82) (0.40) 2000 Dummy 0.325*** 0.761*** 0.185** (3.63) (3.24) (1.99) R-Squared 0.069 0.105 0.034 Number of firm-years 4,222 4,324 4,250
40
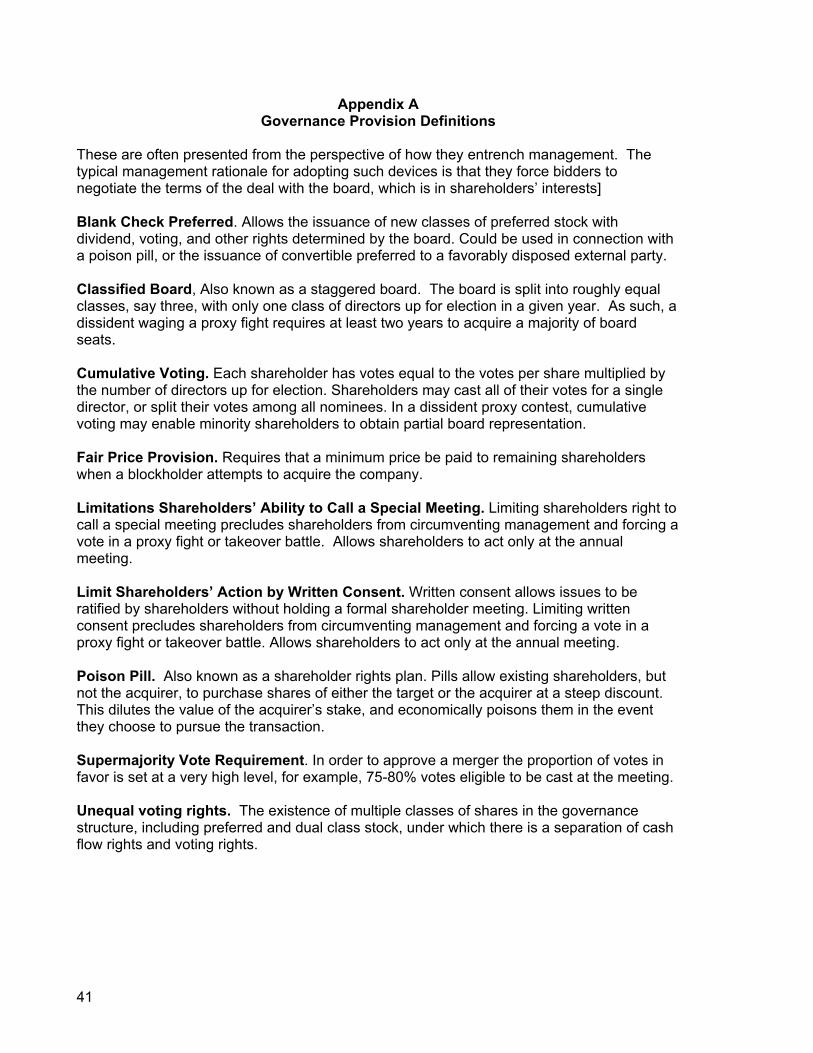
Appendix A Governance Provision Definitions
These are often presented from the perspective of how they entrench management. The typical management rationale for adopting such devices is that they force bidders to negotiate the terms of the deal with the board, which is in shareholders’ interests] Blank Check Preferred. Allows the issuance of new classes of preferred stock with dividend, voting, and other rights determined by the board. Could be used in connection with a poison pill, or the issuance of convertible preferred to a favorably disposed external party. Classified Board, Also known as a staggered board. The board is split into roughly equal classes, say three, with only one class of directors up for election in a given year. As such, a dissident waging a proxy fight requires at least two years to acquire a majority of board seats. Cumulative Voting. Each shareholder has votes equal to the votes per share multiplied by the number of directors up for election. Shareholders may cast all of their votes for a single director, or split their votes among all nominees. In a dissident proxy contest, cumulative voting may enable minority shareholders to obtain partial board representation. Fair Price Provision. Requires that a minimum price be paid to remaining shareholders when a blockholder attempts to acquire the company. Limitations Shareholders’ Ability to Call a Special Meeting. Limiting shareholders right to call a special meeting precludes shareholders from circumventing management and forcing a vote in a proxy fight or takeover battle. Allows shareholders to act only at the annual meeting. Limit Shareholders’ Action by Written Consent. Written consent allows issues to be ratified by shareholders without holding a formal shareholder meeting. Limiting written consent precludes shareholders from circumventing management and forcing a vote in a proxy fight or takeover battle. Allows shareholders to act only at the annual meeting. Poison Pill. Also known as a shareholder rights plan. Pills allow existing shareholders, but not the acquirer, to purchase shares of either the target or the acquirer at a steep discount. This dilutes the value of the acquirer’s stake, and economically poisons them in the event they choose to pursue the transaction. Supermajority Vote Requirement. In order to approve a merger the proportion of votes in favor is set at a very high level, for example, 75-80% votes eligible to be cast at the meeting. Unequal voting rights. The existence of multiple classes of shares in the governance structure, including preferred and dual class stock, under which there is a separation of cash flow rights and voting rights.
41
Appendix B State Law Descriptions
Control share acquisition statute. Requires hostile bidders to put an acquisition to a vote of the shareholders before proceeding. Exists in 27 states. Fair-price statute. which requires a bidder to pay holdout shareholders in a freezeout the same price as in the original transaction in which a block was acquired. Exists in 27 states. Freeze-out restrictions. which gives a bidder a minimum amount of time that must elapse between gaining control and engaging in a freezeout. Exists in 33 states. Poison pill endorsement. which allows the use of poison pill. Exists in 25 states. Director duty provision. which allows managers to take into consideration the interests of non-shareholders when voting on a merger. Exists in 31 states. Short-term profit provision. which requires the recapture or disgorgement of short-term profits made by a hostile acquirer. Exists in 2 states. Incorporation in Delaware.
42
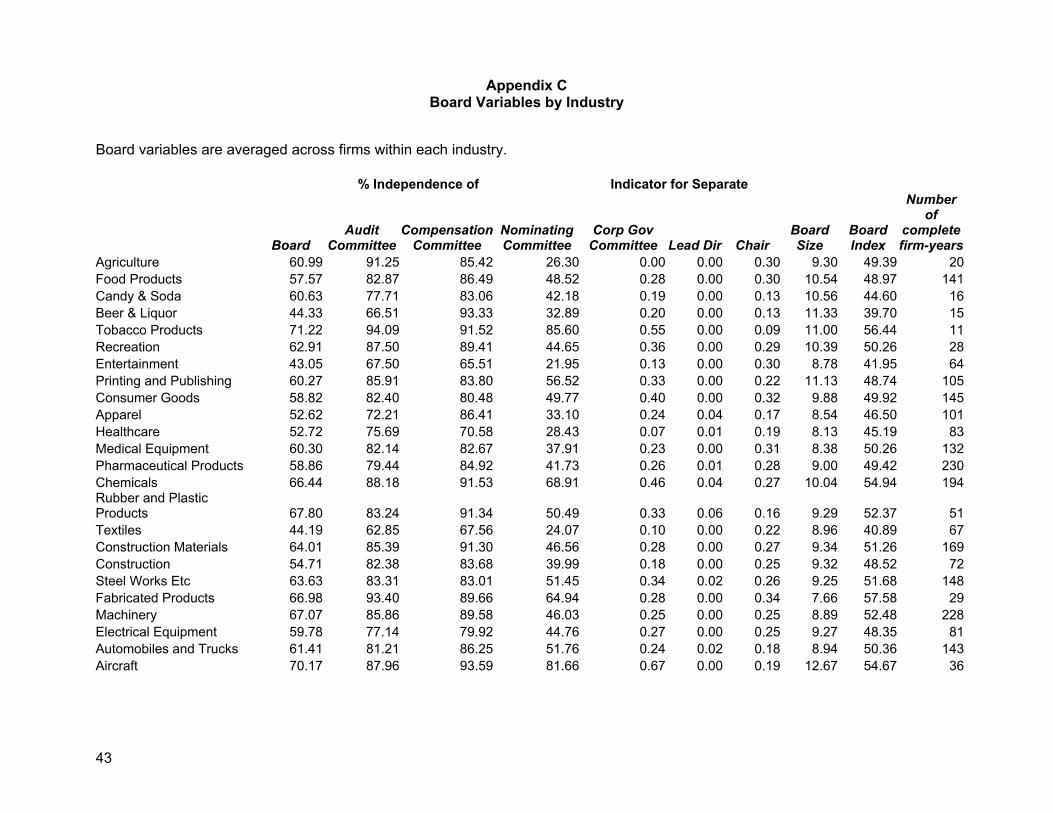
Appendix C Board Variables by Industry
Board variables are averaged across firms within each industry. % Independence of Indicator for Separate
Board Audit
CommitteeCompensation
Committee NominatingCommittee
Corp Gov Committee
Lead Dir
Chair
Board Size
Board Index
Number of
complete firm-years Agriculture 60.99 91.25 85.42 26.30 0.00 0.00 0.30 9.30 49.39 20
Food Products 57.57 82.87 86.49 48.52 0.28 0.00 0.30 10.54 48.97 141Candy & Soda 60.63 77.71 83.06 42.18 0.19 0.00 0.13 10.56 44.60 16Beer & Liquor 44.33 66.51 93.33 32.89 0.20 0.00 0.13 11.33 39.70 15Tobacco Products 71.22 94.09 91.52 85.60 0.55 0.00 0.09 11.00 56.44 11Recreation 62.91 87.50 89.41 44.65 0.36 0.00 0.29 10.39 50.26 28Entertainment 43.05 67.50 65.51 21.95 0.13 0.00 0.30 8.78 41.95 64Printing and Publishing 60.27 85.91 83.80 56.52 0.33 0.00 0.22 11.13 48.74 105Consumer Goods 58.82 82.40 80.48 49.77 0.40 0.00 0.32 9.88 49.92 145Apparel 52.62 72.21 86.41 33.10 0.24 0.04 0.17 8.54 46.50 101Healthcare 52.72 75.69 70.58 28.43 0.07 0.01 0.19 8.13 45.19 83Medical Equipment 60.30 82.14 82.67 37.91 0.23 0.00 0.31 8.38 50.26 132Pharmaceutical Products
58.86 79.44 84.92 41.73 0.26 0.01 0.28 9.00 49.42 230
Chemicals 66.44 88.18 91.53 68.91 0.46 0.04 0.27 10.04 54.94 194Rubber and Plastic Products 67.80 83.24 91.34 50.49 0.33 0.06 0.16 9.29 52.37 51Textiles 44.19 62.85 67.56 24.07 0.10 0.00 0.22 8.96 40.89 67Construction Materials
64.01 85.39 91.30 46.56 0.28 0.00 0.27 9.34 51.26 169
Construction 54.71 82.38 83.68 39.99 0.18 0.00 0.25 9.32 48.52 72Steel Works Etc 63.63 83.31 83.01 51.45 0.34 0.02 0.26 9.25 51.68 148Fabricated Products 66.98 93.40 89.66 64.94 0.28 0.00 0.34 7.66 57.58 29Machinery 67.07 85.86 89.58 46.03 0.25 0.00 0.25 8.89 52.48 228Electrical Equipment 59.78 77.14 79.92 44.76 0.27 0.00 0.25 9.27 48.35 81Automobiles and Trucks
61.41 81.21 86.25 51.76 0.24 0.02 0.18 8.94 50.36 143
Aircraft 70.17 87.96 93.59 81.66 0.67 0.00 0.19 12.67 54.67 36
43
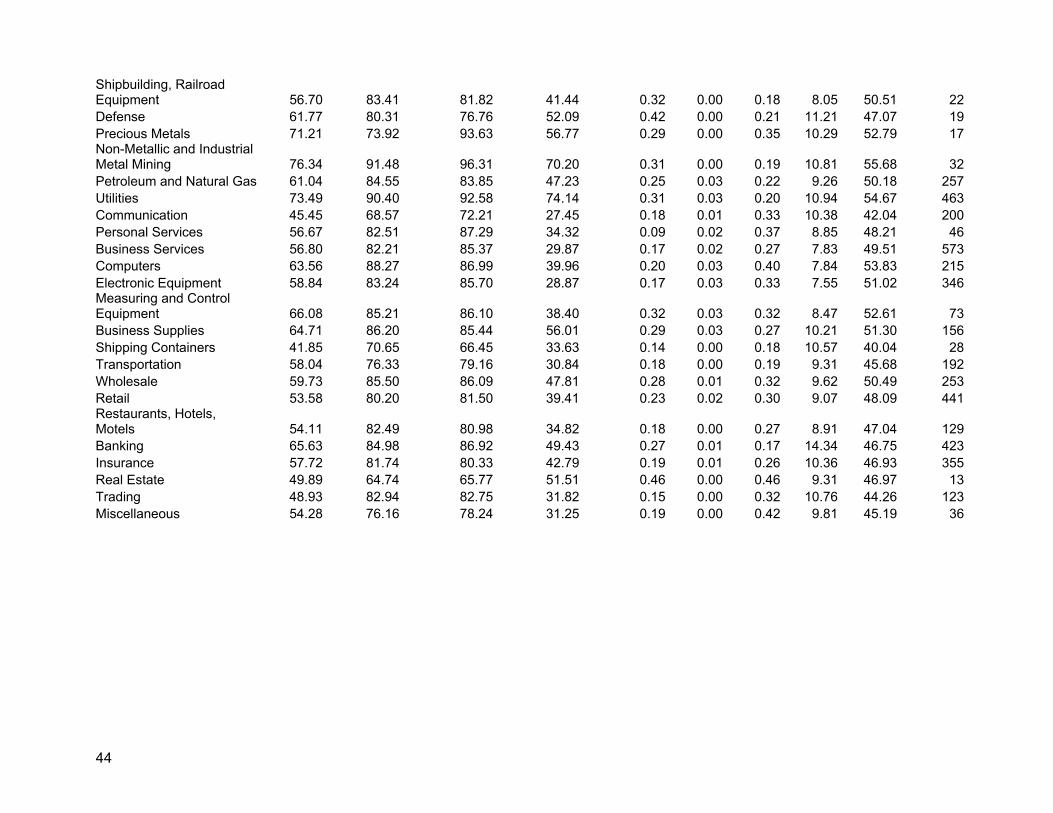
Shipbuilding, Railroad Equipment 56.70 83.41 81.82 41.44
0.32 0.00 0.18 8.05 50.51 22Defense 61.77 80.31 76.76 52.09 0.42 0.00 0.21 11.21 47.07 19Precious Metals 71.21 73.92 93.63 56.77 0.29 0.00 0.35 10.29 52.79 17Non-Metallic and Industrial Metal Mining 76.34 91.48 96.31 70.20 0.31 0.00 0.19 10.81 55.68 32Petroleum and Natural Gas
61.04 84.55 83.85 47.23 0.25 0.03 0.22 9.26 50.18 257
Utilities 73.49 90.40 92.58 74.14 0.31 0.03 0.20 10.94 54.67 463Communication 45.45 68.57 72.21 27.45 0.18 0.01 0.33 10.38 42.04 200Personal Services 56.67 82.51 87.29 34.32 0.09 0.02 0.37 8.85 48.21 46Business Services 56.80 82.21 85.37 29.87 0.17 0.02 0.27 7.83 49.51 573Computers 63.56 88.27 86.99 39.96 0.20 0.03 0.40 7.84 53.83 215Electronic Equipment 58.84 83.24 85.70 28.87 0.17 0.03 0.33 7.55 51.02 346Measuring and Control Equipment 66.08 85.21 86.10 38.40 0.32 0.03 0.32 8.47 52.61 73Business Supplies 64.71 86.20 85.44 56.01 0.29 0.03 0.27 10.21 51.30 156Shipping Containers 41.85 70.65 66.45 33.63 0.14 0.00 0.18 10.57 40.04 28Transportation 58.04 76.33 79.16 30.84 0.18 0.00 0.19 9.31 45.68 192Wholesale 59.73 85.50 86.09 47.81 0.28 0.01 0.32 9.62 50.49 253Retail 53.58 80.20 81.50 39.41 0.23 0.02 0.30 9.07 48.09 441Restaurants, Hotels, Motels 54.11 82.49 80.98 34.82 0.18 0.00 0.27 8.91 47.04 129Banking 65.63 84.98 86.92 49.43 0.27 0.01 0.17 14.34 46.75 423Insurance 57.72 81.74 80.33 42.79 0.19 0.01 0.26 10.36 46.93 355Real Estate 49.89 64.74 65.77 51.51 0.46 0.00 0.46 9.31 46.97 13Trading 48.93 82.94 82.75 31.82 0.15 0.00 0.32 10.76 44.26 123Miscellaneous 54.28 76.16 78.24 31.25 0.19 0.00 0.42 9.81 45.19 36
44
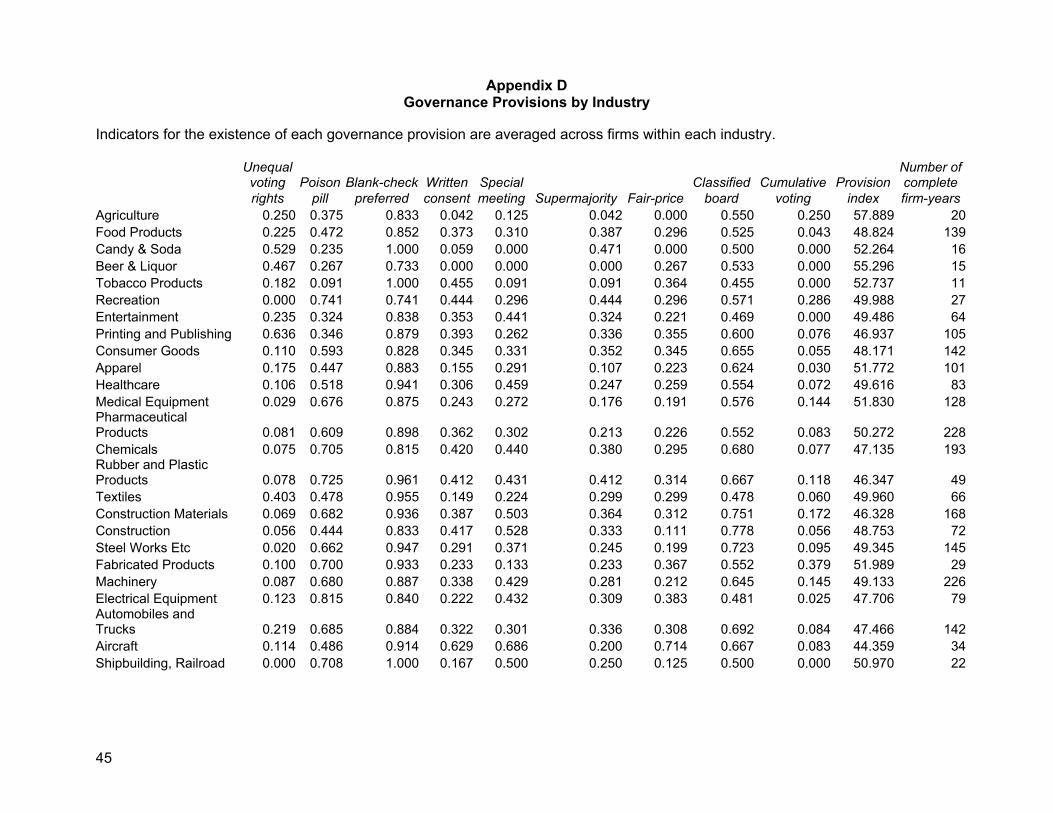
Appendix D Governance Provisions by Industry
Indicators for the existence of each governance provision are averaged across firms within each industry.
Unequal
voting Poison Blank-check Written Special
0.533
Classified
Cumulative
Provision
Number of complete
rights pill preferred consent meeting Supermajority Fair-price
board voting index firm-yearsAgriculture 0.250 0.375 0.833 0.042 0.125 0.042 0.000 0.550 0.250 57.889 20Food Products 0.225 0.472 0.852 0.373 0.310 0.387 0.296 0.525 0.043 48.824 139Candy & Soda 0.529 0.235 1.000 0.059 0.000 0.471 0.000 0.500 0.000 52.264 16Beer & Liquor 0.467 0.267 0.733 0.000 0.000 0.000 0.267 0.000 55.296 15Tobacco Products 0.182 0.091 1.000 0.455 0.091 0.091 0.364 0.455 0.000 52.737 11Recreation 0.000 0.741 0.741 0.444 0.296 0.444 0.296 0.571 0.286 49.988 27Entertainment 0.235 0.324 0.838 0.353 0.441 0.324 0.221 0.469 0.000 49.486 64Printing and Publishing 0.636 0.346 0.879 0.393 0.262 0.336 0.355 0.600 0.076 46.937 105Consumer Goods
0.110 0.593 0.828 0.345 0.331 0.352 0.345 0.655 0.055 48.171 142
Apparel 0.175 0.447 0.883 0.155 0.291 0.107 0.223 0.624 0.030 51.772 101Healthcare 0.106 0.518 0.941 0.306 0.459 0.247 0.259 0.554 0.072 49.616 83Medical Equipment 0.029 0.676 0.875 0.243 0.272 0.176 0.191 0.576 0.144 51.830 128Pharmaceutical Products 0.081 0.609 0.898 0.362 0.302 0.213 0.226 0.552 0.083 50.272 228Chemicals 0.075 0.705 0.815 0.420 0.440 0.380 0.295 0.680 0.077 47.135 193Rubber and Plastic Products 0.078 0.725 0.961 0.412 0.431 0.412 0.314 0.667 0.118 46.347 49Textiles 0.403 0.478 0.955 0.149 0.224 0.299 0.299 0.478 0.060 49.960 66Construction Materials
0.069 0.682 0.936 0.387 0.503 0.364 0.312 0.751 0.172 46.328 168
Construction 0.056 0.444 0.833 0.417 0.528 0.333 0.111 0.778 0.056 48.753 72Steel Works Etc 0.020 0.662 0.947 0.291 0.371 0.245 0.199 0.723 0.095 49.345 145Fabricated Products
0.100 0.700 0.933 0.233 0.133 0.233 0.367 0.552 0.379 51.989 29
Machinery 0.087 0.680 0.887 0.338 0.429 0.281 0.212 0.645 0.145 49.133 226Electrical Equipment 0.123 0.815 0.840 0.222 0.432 0.309 0.383 0.481 0.025 47.706 79Automobiles and Trucks 0.219 0.685 0.884 0.322 0.301 0.336 0.308 0.692 0.084 47.466 142Aircraft 0.114 0.486 0.914 0.629 0.686 0.200 0.714 0.667 0.083 44.359 34Shipbuilding, Railroad 0.000 0.708 1.000 0.167 0.500 0.250 0.125 0.500 0.000 50.970 22
45
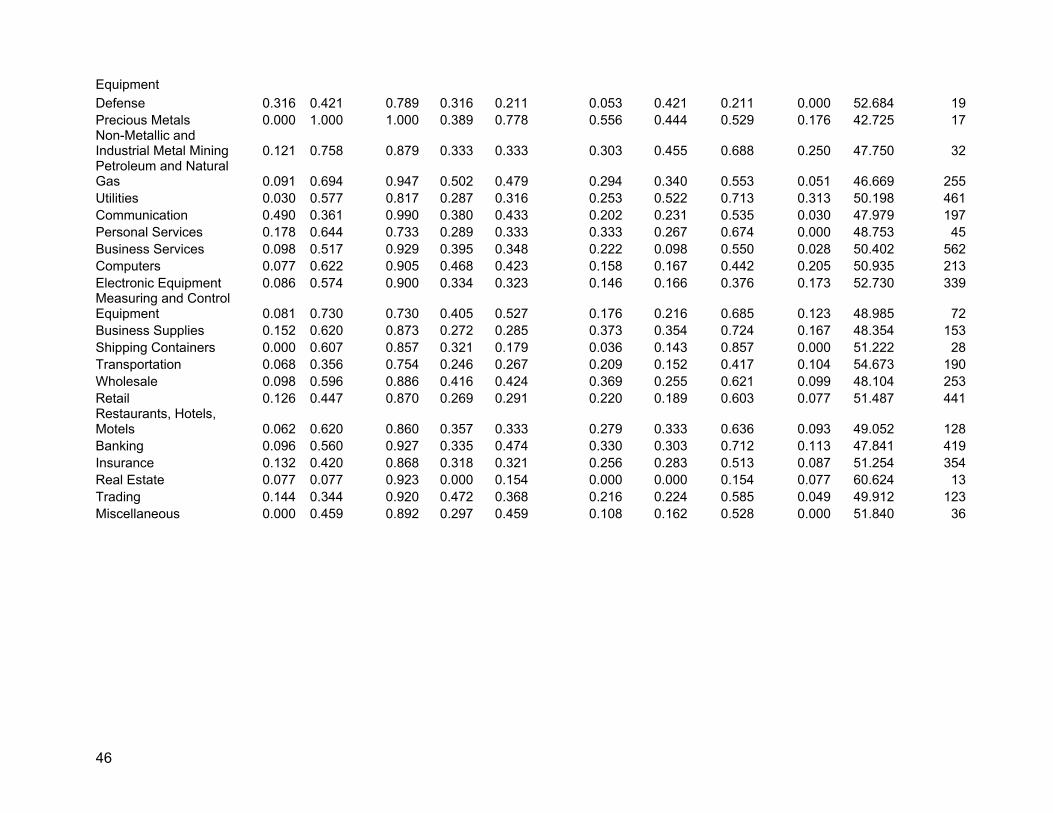
Equipment Defense
0.316 0.421 0.789 0.316 0.211 0.053 0.421 0.211 0.000 52.684 19Precious Metals 0.000 1.000 1.000 0.389 0.778 0.556 0.444 0.529 0.176 42.725 17Non-Metallic and Industrial Metal Mining 0.121 0.758 0.879 0.333 0.333 0.303 0.455 0.688 0.250 47.750 32Petroleum and Natural Gas 0.091 0.694 0.947 0.502 0.479 0.294 0.340 0.553 0.051 46.669 255Utilities 0.030 0.577 0.817 0.287 0.316 0.253 0.522 0.713 0.313 50.198 461Communication 0.490 0.361 0.990 0.380 0.433 0.202 0.231 0.535 0.030 47.979 197Personal Services 0.178 0.644 0.733 0.289 0.333 0.333 0.267 0.674 0.000 48.753 45Business Services 0.098 0.517 0.929 0.395 0.348 0.222 0.098 0.550 0.028 50.402 562Computers 0.077 0.622 0.905 0.468 0.423 0.158 0.167 0.442 0.205 50.935 213Electronic Equipment 0.086 0.574 0.900 0.334 0.323 0.146 0.166 0.376 0.173 52.730 339Measuring and Control Equipment 0.081 0.730 0.730 0.405 0.527 0.176 0.216 0.685 0.123 48.985 72Business Supplies 0.152 0.620 0.873 0.272 0.285 0.373 0.354 0.724 0.167 48.354 153Shipping Containers 0.000 0.607 0.857 0.321 0.179 0.036 0.143 0.857 0.000 51.222 28Transportation 0.068 0.356 0.754 0.246 0.267 0.209 0.152 0.417 0.104 54.673 190Wholesale 0.098 0.596 0.886 0.416 0.424 0.369 0.255 0.621 0.099 48.104 253Retail 0.126 0.447 0.870 0.269 0.291 0.220 0.189 0.603 0.077 51.487 441Restaurants, Hotels, Motels 0.062 0.620 0.860 0.357 0.333 0.279 0.333 0.636 0.093 49.052 128Banking 0.096 0.560 0.927 0.335 0.474 0.330 0.303 0.712 0.113 47.841 419Insurance 0.132 0.420 0.868 0.318 0.321 0.256 0.283 0.513 0.087 51.254 354Real Estate 0.077 0.077 0.923 0.000 0.154 0.000 0.000 0.154 0.077 60.624 13Trading 0.144 0.344 0.920 0.472 0.368 0.216 0.224 0.585 0.049 49.912 123Miscellaneous 0.000 0.459 0.892 0.297 0.459 0.108 0.162 0.528 0.000 51.840 36
46