Industries Energy, Utilities & Mining
80
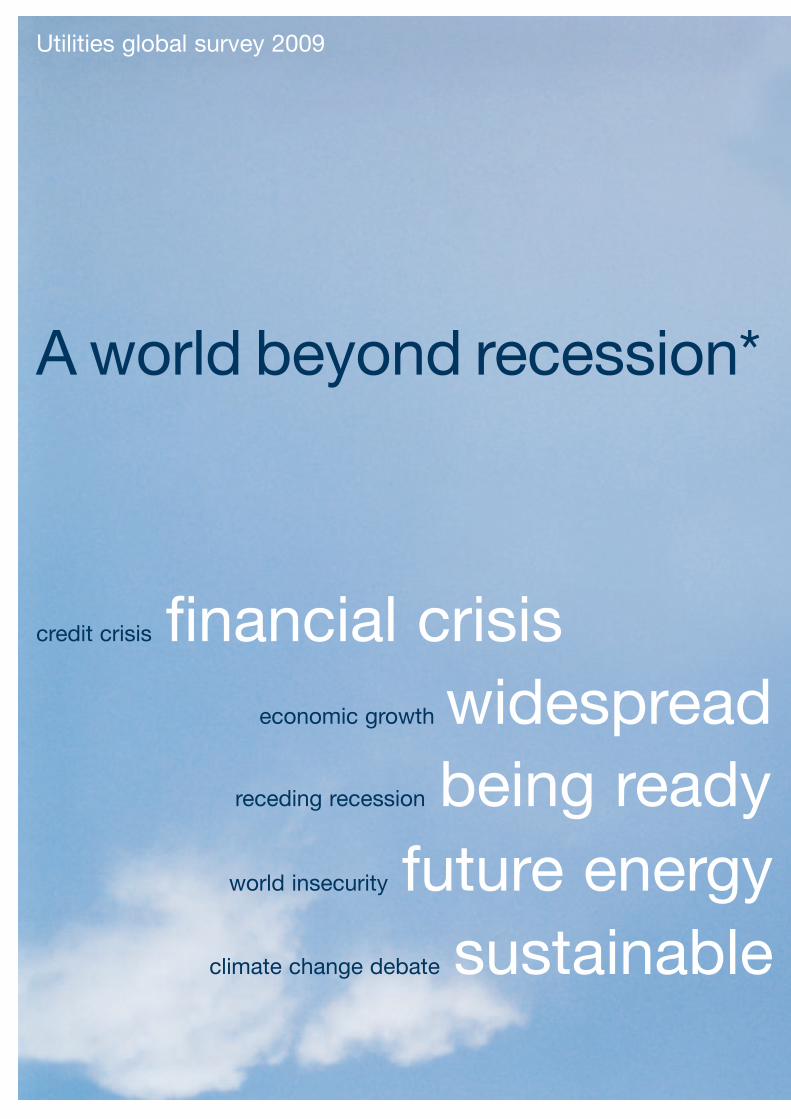
Industries Energy, Utilities & Mining *connectedthinking Utilities global survey 2009 A world beyond recession*
Transcript of Industries Energy, Utilities & Mining

IndustriesEnergy, Utilities & Mining
*connectedthinking
Utilities global survey 2009
A world beyond recession*
Utilities global survey 2009
A world beyond recession*
credit crisis financial crisis economic growth widespread recession
receding recession being ready to power the upturnworld insecurity future energy security
climate change debate sustainable cleaner power

In the space of the past 12 months, utility companies have found themselvesin a very different world with a series of momentous events – the collapse ofgiants of the banking system, the credit and wider financial crisis, the reversalin demand and price growth, and outright recession in many major markets.But the time horizons required for planning in the energy sector requirecompanies to plan and think a long way ahead. A world beyond recessionlooks at the impact of the events of the past year, through the views of seniorutility company executives, and ahead at the world that lies beyond thedownturn.
d recessiony to power the upturny securitye cleaner power

4 Global 26 The Americas2 Report highlights
Utilities global survey 2009
“We are experiencing atransformational economic crisis – one that is on course to fundamentally changeglobalization well beyond the domain of internationalfinance”Klaus Schwab, founder and executive chairman of the World Economic Forum

42 Europe 46 Asia Pacific 58 Middle East & Africa
1 Introduction
2 Report highlights
4 Inside the boardroom: Global4 Risk8 Growth
13 Regulation19 Operations22 People
26 The Americas26 United States34 Canada37 South America
42 Europe
46 Asia Pacific46 Asia50 Australia and New Zealand
58 Middle East and Africa58 Middle East63 Central, East and West Africa68 Southern Africa
70 Looking ahead
71 Contact us
73 Methodology
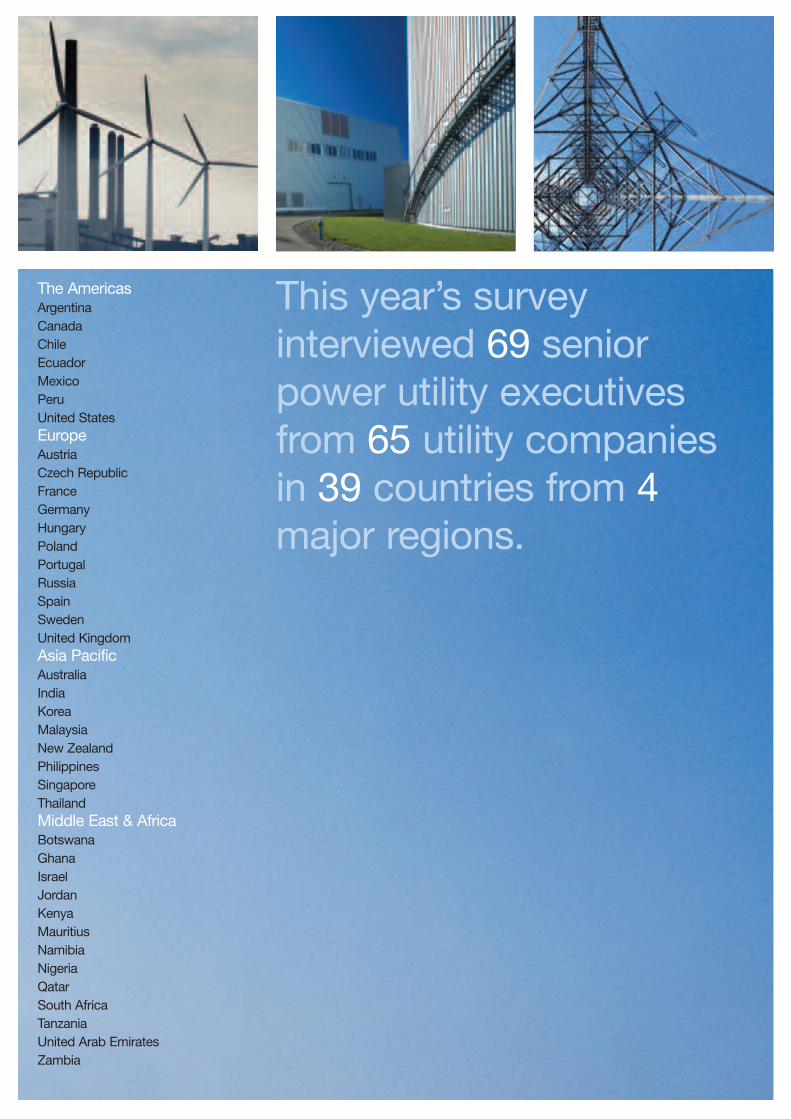
The AmericasArgentinaCanadaChileEcuadorMexicoPeruUnited StatesEurope AustriaCzech RepublicFranceGermanyHungaryPolandPortugalRussiaSpainSwedenUnited KingdomAsia PacificAustralia India Korea Malaysia New Zealand Philippines Singapore Thailand Middle East & AfricaBotswana Ghana Israel Jordan Kenya Mauritius Namibia Nigeria Qatar South Africa Tanzania United Arab Emirates Zambia
This year’s surveyinterviewed 69 seniorpower utility executivesfrom 65 utility companiesin 39 countries from 4major regions.

Manfred Wiegand
Global Utilities Leader
Introduction 1
Each year PricewaterhouseCoopers goes to the heartof boardroom thinking in power utility companies witha survey of senior executives across the globe. In2008, our World of difference report mapped theenormity of the changes witnessed in the last 10years and those lying ahead in future decades. Our2009 report, A world beyond recession, looks at theimpact of the economic downturn and financial crisison the sector but, also, beyond to the time horizonsthat are important for long-term energy planning.
We interviewed about 70 executives from leadingpower utility companies in major markets around theworld to gain their perspective on the implications ofthis very different world environment. We also includethe viewpoints of CEOs from a number of leadingutility companies in different parts of the world.
Power utility companies find themselves operating ina very different world from just a year before. It is aworld shell-shocked by the rapidity of the financialand economic collapse, where previous certaintieshave been replaced by uncertainty, where faith inmarkets and regulation has been shaken and whererecession has taken the place of growth.
For utility companies, however, the timescalesrequired for imperatives such as infrastructurerenewal, new generation and greener energy reachbeyond the recession. The very business of powerrequires them to stretch their horizons further. The investment required in the sector is considerable.Yet the financial crisis has tightened the availability ofcapital. Governments are debt-laden, clouding theoutlook for future subsidy for greener energy, and thedownturn has dampened demand, particularly frombig industrial consumers.
Companies face a delicate balancing act. They needto make the adjustments necessary to steer throughthe changed economic and financial environment butalso maintain a long-term horizon. Fewer investmentswill surely mean reduced reserve margins in thefuture with the danger of higher price spikes andgreater competition for limited supplies when theevolving global recession recedes.

Credit crunch clouds outlook forfuture targets
Utility companies have to judge the pace andlevel of investment programmes to respond toa complex mix of future demand, energysecurity and climate change drivers. Oneresult of the current market environment hasbeen to cast considerable doubt on whetherinvestment will come forward in a timelymanner to keep pace with future demand forpower and climate change targets. Two-thirds(67%) of our survey respondents report that ashortage of capital is having a high or veryhigh impact on their activities.
Investment barriers heighten
The development of new generation capacityand the renewal of existing generation plantsare priority areas for most companies; 83%are seeking to make medium to largeinvestment in new generation and three-quarters are seeking to do likewise intransmission and distribution. However, thesenior utility company executives in oursurvey are worried about the high costs andhigh levels of cost uncertainty associated withprojects. Two-thirds cite problems in securingfinance as a medium or high barrier to projectdevelopment. Skill shortages and access togood procurement capability also continue topose challenges for many companies.
Risk controls set to red alert
The current environment is heighteningenergy trading risk. Liquidity in the market is amajor concern. Eighty-six per cent ofrespondents indicated that reduced liquidityin energy trading markets was having animpact on their companies, with 60% of allrespondents rating this impact as high or veryhigh. Customer credit risk is also identified asan area of major concern and 90% ofrespondents reported a high or very highimpact of increased sales and retail creditrisk. Companies are mindful of the risks ofcustomers going into liquidation, defaultingon payments, bargaining over delivery orsimply shutting down plants and requiring less supply.
Maintaining a focus on climatechange
2009 will be a watershed year for climatechange regulation with world leaders seekingto agree a successor to the Kyoto Protocol.Utility companies in our survey emphasise theimportance of greater clarity of climatechange policy but express concern that theeconomic recession is undermining thechances of an effective response to climatechange. Asked if the economic recessionwould slow down responses to climatechange, 79% felt it would with two thirds ofthe 79% saying it would have a high or veryhigh slowdown impact. Many of thosesurveyed also thought that a return to highenergy prices would dilute commitment toenvironmentalism.
2

Economic incentives needed to boost renewables in the mix
Nearly three-fifths of respondents (59%) feelthat their renewable energy investmentprogrammes are being affected by the lack ofclarity from governments on renewable energytargets and financial support for renewableenergy. The importance of greater certainty onboth targets and economic mechanisms tosupport renewable energy is highlighted by thefact that, even coming off the back of a periodof record high power prices, only 28% ofrespondents believe that unsubsidisedrenewable power can compete commerciallyagainst fossil fuel generation.
Technology holds the key
Technology will be central to future growth andcompetitive advantage. The importance oftechnology for key developments, such asenergy efficiency and the expansion of nuclearpower, has led many survey respondents topinpoint power equipment and technologycompanies as a more significant competitivethreat than even direct competition in the retailmarket by other utility company home marketrivals. Technological innovation is seen ascentral to a range of key developments in thesector. In the coming decade, technologicalinnovation is seen as having most new impacton energy efficiency, solar power, combinedheat and power, distributed generation andcombustible renewable generation. Lookingfurther afield, carbon capture and storage willbe essential for the sector’s contribution to themitigation of climate change.
Report highlights 3

An estimated cumulative investment of US$13.6 trillion isneeded by the power industry in the period to 2030according the reference scenario model used by theInternational Energy Agency. Although this outlookpredated the intensification of the economic downturn inlate 2008 and early 2009, the timeframe for the modeland, indeed, the timescales required to develop newgeneration capacity, particularly in nuclear, take theindustry’s horizons beyond even a deep recession.Moreover, much of the projected electricity demandgrowth occurs outside of the OECD and this rebalancingof world demand is likely to remain a key trend evenduring recession.
4 Inside the boardroom: Global
The investment challenges for the sector flow from threeprincipal imperatives – renewal, diversification andgrowth. The need for renewal of ageing infrastructuremay be alleviated by falling demand but the underlyingrequirement to replace or upgrade plants and networkswill not go away. Similarly, the need for diversification,driven by the twin imperatives of greater energy securityand responding to climate change, remains in place.Energy security concerns have again been highlightedwith interruptions to Russian gas supply to Europe inearly 2009. On the climate change front, the latestscientific consensus on climate change indicates thatthe timetable for effective responses is more urgent thanever.
These concerns are reflected in the industry’sassessment of the most important developments in theirpower market in the coming decade (see Figure 1) andthe most pressing investment priorities (see Figure 2).The need to respond to the encouragement of renewableenergy and to reduce emissions is emphasised by themajority of survey respondents. Concerns over securityof supply also remain strong with over half ofrespondents stating that this would remain a key issue intheir market in the coming decade. The transmissioninfrastructure challenge is reflected in its reappearancein the top six chart in 2009 after dropping out in the pastfew years. Significant proportions of respondentshighlight the need for investment to respond to worriesabout transmission congestion, capacity margins andsecuring upstream gas supply.
RiskEconomic recession and the financial crisishave heightened the risks that utilitycompanies must manage. A major area of riskfor utility companies comes from balancingboth short-term and long-term supply anddemand. In turn, that means judging the paceof investment programmes to respond to acomplex mix of future demand, energysecurity and climate change drivers.

The current economic downturn has dampened energydemand, particularly from big industrial consumers, butthe long-term imperatives highlighted by respondentsremain in place. One result of the current marketenvironment has been to cast considerable doubt onwhether investment will come forward in a timely mannerto keep pace with future demand for power and climatechange targets. Two thirds (67%) of respondents reportthat a shortage of capital is having a high or very highimpact on their activities (see Figure 3).
Uniformly high responses were recorded to this questionacross all regions in the world and this is being reflectedin cutback announcements. In the US, for example,almost half of the top ten utilities have announcedreductions to planned 2009 capital expenditure. In sucha bearish climate, utilities are more than ever mindfulthat the cost and availability of capital is a key risk whendetermining a project’s financial viability.
Global 5
Figure 1: Top six ranking of the most important developments in your power market over the next 10 years?
Source: PricewaterhouseCoopers, Utilities global survey 2009
High or very high impact
Medium impact
Low or very low impact
71%
22%
7%
Encouragement of renewable energy
High or very high impact
Medium impact
Low or very low impact
66%
22%
12%
Regulation of emissions
High or very high impact
Medium impact
Low or very low impact
64%
32%
4%
Increasing efficiency
High or very high impact
Medium impact
Low or very low impact
56%
28%
15%
Increasing regulation and obligation
High or very high impact
Medium impact
Low or very low impact
55%
26%
19%
Increasing transmission capacity
High or very high impact
Medium impact
Low or very low impact
52%
26%
21%
Concerns over security of supply
Figure 2: The most pressing investment drivers
Source: PricewaterhouseCoopers, Utilities global survey 2009
Very pressing
Medium importance
Least pressing
61%
28%
12%
Renewable energy targets
Very pressing
Medium importance
Least pressing
58%
25%
17%
Meeting carbon emission targets
Very pressing
Medium importance
Least pressing
47%
33%
20%
Transmission congestion
Very pressing
Medium importance
Least pressing
46%
26%
28%
Smart metering regulation
Very pressing
Medium importance
Least pressing
45%
29%
26%
Securing gas supplies
Very pressing
Medium importance
Least pressing
35%
36%
29%
A low capacity margin
Figure 3: The impact of a shortage of capital for infrastructure projects
Source: PricewaterhouseCoopers, Utilities global survey 2009
High or very high impact
Medium impact
Small or very small impact
67%
20%
13%
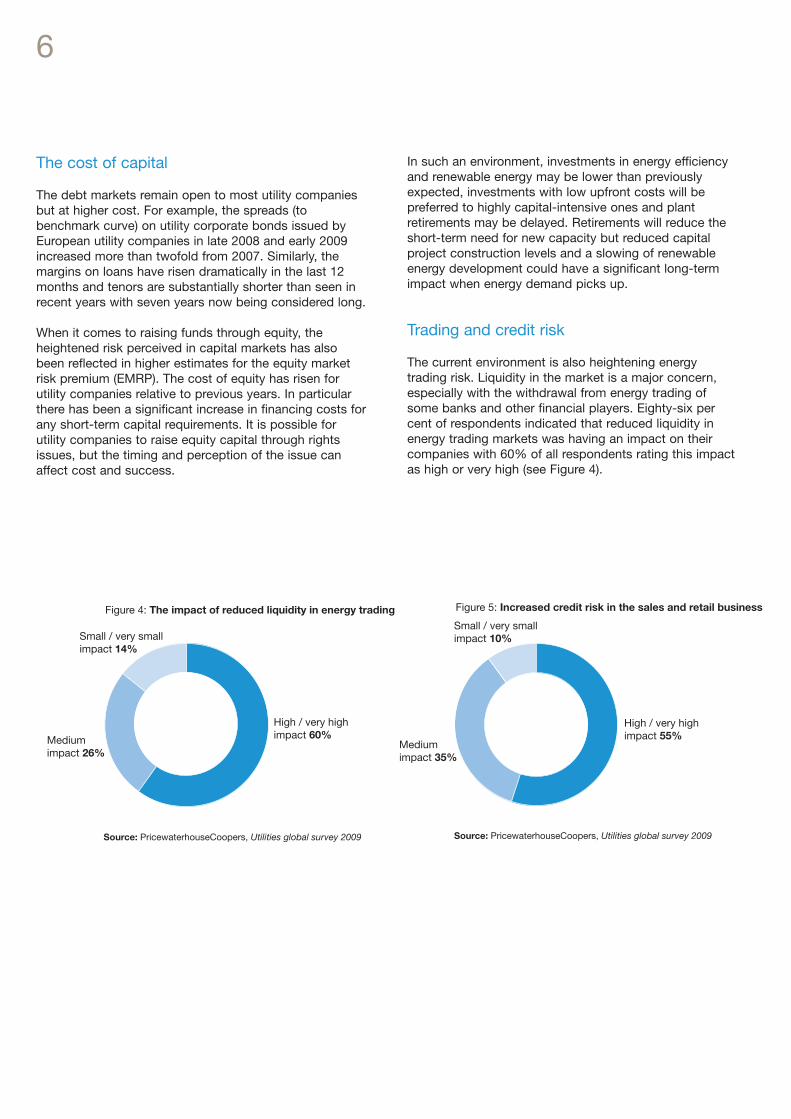
Figure 5: Increased credit risk in the sales and retail business
Source: PricewaterhouseCoopers, Utilities global survey 2009
High / very high impact 55%
Small / very small impact 10%
Medium impact 35%
6
The cost of capital
The debt markets remain open to most utility companiesbut at higher cost. For example, the spreads (tobenchmark curve) on utility corporate bonds issued byEuropean utility companies in late 2008 and early 2009increased more than twofold from 2007. Similarly, themargins on loans have risen dramatically in the last 12months and tenors are substantially shorter than seen inrecent years with seven years now being considered long.
When it comes to raising funds through equity, theheightened risk perceived in capital markets has alsobeen reflected in higher estimates for the equity marketrisk premium (EMRP). The cost of equity has risen forutility companies relative to previous years. In particularthere has been a significant increase in financing costs forany short-term capital requirements. It is possible forutility companies to raise equity capital through rightsissues, but the timing and perception of the issue canaffect cost and success.
In such an environment, investments in energy efficiencyand renewable energy may be lower than previouslyexpected, investments with low upfront costs will bepreferred to highly capital-intensive ones and plantretirements may be delayed. Retirements will reduce theshort-term need for new capacity but reduced capitalproject construction levels and a slowing of renewableenergy development could have a significant long-termimpact when energy demand picks up.
Trading and credit risk
The current environment is also heightening energytrading risk. Liquidity in the market is a major concern,especially with the withdrawal from energy trading ofsome banks and other financial players. Eighty-six percent of respondents indicated that reduced liquidity inenergy trading markets was having an impact on theircompanies with 60% of all respondents rating this impactas high or very high (see Figure 4).
Figure 4: The impact of reduced liquidity in energy trading
Source: PricewaterhouseCoopers, Utilities global survey 2009
High / very high impact 60%
Small / very small impact 14%
Medium impact 26%

Global 7
Liquidity is especially critical because companies areincreasingly dealing on a cleared exchange basis. If theyare in the over-the-counter market, there are collaterals tobe made. Large amounts of funds need to be available forcollateral or as a variation margin. As a result, credit riskmanagement is a very important area for companies. Customer credit risk is also identified as an area of majorconcern and 90% of respondents reported a high or veryhigh impact of increased sales and retail credit risk (seeFigure 5). Companies are clearly mindful of the risks ofcustomers going into liquidation, defaulting on payments,bargaining over delivery or simply shutting down plantsand requiring less supply.
1 2 30
Figure 6: The impact of market volatility
4 5
Note: Rate where 4-5 = agree/strongly agree; 3 = neither agree or disagree; 1-2 = disagree/strongly disagreeSource: PricewaterhouseCoopers, Utilities global survey 2009
Tightened counterparty creditmonitoring in response to
market price volatility
Manage risk exposures throughthe use of a structural hedge as a
result of market price volatility
Reduced/deferred investments/capitalexpenditure in response to
market price volatility
Current trading activities pose anincreasing reputational risk
to the business
Market events have caused mycompany to be concerned about
the efficacy of the firm’s tradingrisk management and governance
control frameworks
Strongly agree/agree
Strongly disagree/disagree
Neither agree or disagree
74%
63%
45%
39%
33%
13%
16%
24%
31%
22%
13%
20%
30%
30%
45%
Agree orstrongly agree
disagree orstrongly disagree
neither agreeor disagree
Price volatility
Companies are having to manage the latest turn of eventsagainst a background of continuing energy price volatility.They are responding in a range of ways. A significantmajority of respondents have taken measures to offset theimpact of volatile energy prices through structural hedgingand tighter counterparty monitoring (see Figure 6).Uncertainty and instability in wholesale energy markets isalso having an effect in terms of reductions or delays incapital expenditure. Respondents are mindful of thepotential for trading activities to cause reputational risk totheir companies and, indeed, 39% see such potentialincreasing. However, only a third go so far as to expressconcern about the efficacy of their firm’s trading riskmanagement and governance control frameworks.

Inorganic growth
However, some players will be less constrained thanothers by the financial markets. Transformational largetransactions cannot be ruled out but the main activity islikely to be at lower value levels and with an emphasis onindividual assets as well as corporate assets. Certainly theunderlying drivers of consolidation, supply security andcapitalisation remain in place and will create increasingpent-up deal demand. M&A remains a key route foracquiring new customers, securing supply and demandbalance in power, the acquisition of new capabilities anddelivering scale (see Figure 7).
8
GrowthThe power utilities industry has come off theback of a series of record-breaking years formergers and acquisitions activity. Inorganicgrowth has been the order of the day for manycompanies, particularly in Europe, ascompanies sought to acquire scale andpresence across territories. Now, many of thebusiest M&A players are concentrating onbedding down their acquisitions and deliveringthe synergies they are seeking. The constrainedavailability of finance will also inhibit dealactivity and, until that situation is eased, thereis unlikely to be a revival in deal values.
Figure 7: Inorganic growth: what is the driver of M&A within your business?
Source: PricewaterhouseCoopers, Utilities global survey 2009
Strong or very strong driver
Medium driver
Weak or very weak driver
Acquisition of skills or knowledge
Strong or very strong driver
Medium driver
Weak or very weak driver
Geographic expansion outside home territory
Strong or very strong driver
Medium driver
Weak or very weak driver
Creating an inherent hedge in portfolio – supply & demand balance in power
47%
33%
20%
Strong or very strong driver
Medium driver
Weak or very weak driver
Regulatory pressure
49%
25%
26%
Strong or very strong driver
Medium driver
Weak or very weak driver
Acquiring new customers
55%
33%
12%
Strong or very strong driver
Medium driver
Weak or very weak driver
Broadening product portfolios to existing customer
34%
30%
36%
46%
35%
19%
Strong or very strong driver
Medium driver
Weak or very weak driver
Scale for competitive advantage
40%
33%
27%
26%
39%
35%

Global 9
Organic growth
In a constrained M&A environment, organic growth assumeseven more importance. The development of new generationcapacity and the renewal of existing generation plants arepriority areas for most companies with over half reporting thatthey are seeking major investment in generation (see Figure8). Investment in transmission and distribution is a similarlypressing issue with many companies seeking to make largeinvestments in network infrastructure. Companies are alsoplacing a strong emphasis on more effective IT infrastructureand the introduction of smart metering. These results werefairly uniform across different parts of the world although ITwas given less emphasis by European respondents. Only23% of European respondents are looking to make major ITinvestment, perhaps a reflection that European marketliberalisation has already spurred investment in moresophisticated platforms.
Regulatory pressure was also identified as a strong driverfor M&A, especially by European and Asia Pacificrespondents. A significant proportion of companies arecontinuing to prioritise international expansion and, again,this is particularly the case among European and AsiaPacific respondents. A quarter of all respondents reportedthat growth outside home territories was a strong or verystrong M&A driver. This rose to a third in the case ofEuropean respondents and slightly more still for those inAsia Pacific.
Figure 8: Organic growth: where are you looking to make new investments?
Source: PricewaterhouseCoopers, Utilities global survey 2009
Large or very large investment
Medium investment
Relatively small or no investment
New generation capacity
Large or very large investment
Medium investment
Relatively small or no investment
Distribution infrastructure
Large or very large investment
Medium investment
Relatively small or no investment
Network infrastructure / transmission capacity
Large or very large investment
Medium investment
Relatively small or no investment
Smart metering
Large or very large investment
Medium investment
Relatively small or no investment
Replacing / upgrading existing generation capacity
Large or very large investment
Medium investment
Relatively small or no investment
IT infrastructure
58%
25%
17%
55%
22%
23%
51%
25%
24%
49%
29%
22%
49%
26%
25%
41%
39%
20%

The UK is an example of the trend to establish long-termcontracts from foreign sources to replace a declining NorthSea gas supply. UK utility companies have put in placelong-term contracts for gas – from Statoil in Norway(through the Langeled pipeline); from Gazprom in Russiapiped through Europe and the Bacton-Zeebruggeinterconnector; and for LNG shipments from sources suchas Qatar. The latter has necessitated considerableinvestment in LNG offload, regasification and pipelineinfrastructure. The BG Group has embarked on a majorinternational acquisition spree to gain access to Australiancoal methane gas for LNG shipping to internationalmarkets in Asia Pacific and further afield.
10
Upstream supply
Securing upstream supply, particularly of gas, remainsessential for most utility companies and our survey showsa progressive ramping-up over recent years ofprocurement strategies and moves to secure access toresources. More companies are placing long-termcontracts or sourcing supply from new regions in order tosecure their energy supply; 70% and 55% of respondentsrespectively cited these two moves compared with only49% and 26% just two years ago (see Figure 6). There isalso a notable increase in the proportion of respondentsreconsidering their fuel mix in both new and existingplants.
Source: PricewaterhouseCoopers, Utilities global survey 2009
Figure 9: How are you responding to upstream fuel challenges now and in the next 5 years?
2007 2008 2009
Improve your company procurement 39% 64% 77%
Secure current fuel mix by entering into long-term contracts 49% 54% 70%
Secure current fuel mix by sourcing fuel from new regions 26% 38% 55%
Change fuel mix in new & planned plants 29% 38% 55%
Upstream integration via direct investments 33% 51% 52%
Upstream integration via joint venture or alliance 27% 53% 46%
Change fuel mix in existing plants 27% 28% 39%
Upstream integration via acquisitions 16% 37% 35%

Global 11
Technology-driven competition and growth
Technology will be key to future growth and competitiveadvantage. The importance of technology for keydevelopments, such as energy efficiency and theexpansion of nuclear power, has led many surveyrespondents to pinpoint power equipment and technologycompanies as a more significant competitive threat thaneven direct competition in the retail market by other utilitycompany home market rivals. Only 14% of surveyrespondents viewed equipment and technologycompanies as no threat and 35% identified them as astrong or very strong threat.
1 2 30
Figure 10: Over the next 10 years, how would you rate the competitive threat posed to companies in your sector in your home territory by the following?
4 5
Note: Rate where 5 = greatest threat; 1 = no threatSource: PricewaterhouseCoopers, Utilities global survey 2009
Financial institutions and investment banks
New entrants from the power equipmentand technology sector
Utility companies based in your home territory
New entrants from energy-intensive users
New entrants from the construction sector
Companies from upstream oil & gas sector
‘New entrant’ technologies, being invested in bycompanies with strong balance sheets, are a threat tocompanies with older and less efficient coal and gasgeneration. Among the important technologies currentlybeing introduced, for example, are very efficient combinedcycle gas turbines (CCGTs) that have a thermal efficiencyof well over 50%. Super-critical coal technology uses highpressures and high temperatures to achieve thermalefficiency of above 40% (compared to mid-30s for mostexisting coal fired generation). These are cleaner, as wellas more efficient, power generation technologies. EarlyCCGTs sometimes had an efficiency of only 40% withlimits on their flexibility. Looking ahead, the potential forstand-alone or distributed local off-grid generation mayalso provide opportunities for power equipment andtechnology companies to play a more visible role with end-customers in the future power landscape.

The downturn may ease some of these constraints butfinance could continue to be a problem for many projects,particularly in the renewable energy field whereuncertainties about market competiveness are cloudingmany investments. Falling carbon prices have exacerbatedthe difficulties faced by renewable energy projects. Sector-wide, companies are expected to adjust their strategies byreducing costs and evaluating risks versus returns on newand existing projects. Postponement or cancellation,however, can increase costs and leave companiesexposed to market share losses in an upturn.
12
Barriers to growth
The importance of capital projects is reflected in thechallenges that companies identify in delivering theirgrowth strategy. Respondents are worried about the highcosts and high levels of cost uncertainty associated withprojects. Over a third cite problems in securing finance asa major barrier to growth. Skill shortages and access togood procurement capability also continue to posechallenges for many companies.
Figure 11: What difficulties/constraints do you anticipate in realising your growth strategy?
Source: PricewaterhouseCoopers, Utilities global survey 2009
Major or significant difficulty/constraint
Medium difficulty/constraint
Little or no difficulty/constraint
52%
33%
15%
Higher levels of project cost
Major or significant difficulty/constraint
Medium difficulty/constraint
Little or no difficulty/constraint
41%
36%
23%
Uncertainties in project cost
Major or significant difficulty/constraint
Medium difficulty/constraint
Little or no difficulty/constraint
36%
32%
32%
Difficulty in securing finance
Major or significant difficulty/constraint
Medium difficulty/constraint
Little or no difficulty/constraint
39%
25%
36%
Lack of skilled labour
Major or significant difficulty/constraint
Medium difficulty/constraint
Little or no difficulty/constraint
32%
32%
36%
Engineering procurement and construction (EPC) shortages
Major or significant difficulty/constraint
Medium difficulty/constraint
Little or no difficulty/constraint
31%
41%
29%
Uncertainty in ability to pass costs on down value-chain

Global 13
RegulationFrom market structure and rules, pricing andcompetition requirements through toemissions frameworks and theencouragement of renewable energy,regulation plays a vital role at the heart of theutilities sector. As we saw in Figure 1, 84% ofrespondents to our survey expect regulation toplay an increasing role in the next 10 yearsand two-thirds of the 84% say it will have alarge or very large impact on their market.
Market change
Regulation is already making itself more strongly felt. Forexample, structural change within energy markets is a keyregulatory challenge faced by major utilities today.Initiatives such as the Energy Third Package in Europehave been designed to facilitate a more transparent andcompetitive landscape. This is raising issues such as assetunbundling and cost reduction. In Europe, the past 12months have seen anti-trust investigations and courtrulings on power market competition and market access.The exact shape of European market reform will not beclear until summer 2009 and there are signs ofcompromise on network unbundling (see Europe section).In the UK, the energy regulator Ofgem is seeking newpowers to investigate and fine electricity companies formarket abuse amid concerns that generators are exploitingweaknesses in the system to push up prices.
In turn, we see utility companies stepping up theirresponses to regulatory change. Ninety three per cent ofsurvey respondents said their company was implementingoperational measures to respond to regulatory moves – upsharply from 76% of respondents two years ago (see Figure 12). A significant proportion of respondents arealso repositioning within the value chain (43%) or by country(41%) – again up from just two years ago. In some cases,such as E.ON’s earlier proposed sale of its networks,companies are seeking to be proactive in anticipation ofregulatory moves. Repositioning, while most evident inEurope with 83% of respondents saying their company isrepositioning by country and 50% within the value chain, isnot confined to that continent. Half of Asia Pacificrespondents and a third of American respondents reportthat their company is repositioning along the value chain inresponse to regulatory initiatives.
Attitudes towards the regulator
Despite the challenges that can come from regulation, mostsurvey respondents are appreciative of the regulatory roleand many more disagreed than agreed with a set ofstatements critical of regulation. Only 32%, for example, feltthat their market had an ‘unclear or non-transparentregulatory process’ and only 30% complained that theretended to be ‘frequent changes to regulatory decisions andoutcomes’. These minority criticisms were slightly more feltby respondents in countries in Asia Pacific, the Middle Eastand Africa.
The less mature evolution of regulation in some of thesecountries was also reflected in a greater lack of support forregulation and lack of personnel with experience ofregulation within utility companies. For example, 44% ofMiddle East and African respondents felt that they lacked anexperienced regulatory resource in their company comparedwith only 14% of American respondents. The stepping up ofregulatory initiatives in Europe also appeared to be causingconcern among European respondents about theircompanies’ regulatory capacity – as many (41%) felt theylacked resource as felt their internal set-up was adequate.
Source: PricewaterhouseCoopers, Utilities global survey 2009
Figure 12: How are you responding to regulatory challenges?
2007 2008 2009
Operational initiatives to respond to regulatory framework & execution (eg unbundling, cost cutting, performance improvement etc) 76% 81% 93%
Industry-wide initiatives, aiming to improve regulatory framework & execution 76% 75% 81%
Reposition in the value chain, ie reducing or increasing presence in individual countries, following regulatory terms & conditions 32% 28% 43%
Reposition by country, ie reducing or increasing presence in individual countries, following regulatory terms & conditions 31% 38% 41%

We also tested respondent views about the political willbehind climate change action by asking whether highenergy prices would deter governments from increasingutility company environmental obligations. Morerespondents (40%) felt that high energy prices would diluteenvironmentalism than disagreed with this view (30%). Theremainder were undecided. Respondents from AsiaPacific, Middle East and African countries were most likelyto see a direct trade-off between energy prices andenvironmentalism – 50% of Asia Pacific respondents and54% of Middle East and African respondents believe thathigher prices would soften policy requirements.
14
Climate change
2009 will be a watershed year for climate changeregulation. Falling energy and carbon prices are castingdoubt on the viability of some renewable energy schemesand the economic downturn is testing commitment toclimate change mitigation. Governments have a chance toset a more certain framework for the industry. The firstyear of the Obama presidency, the direction of travel in therun-up to the December 2009 UN Climate Summit inCopenhagen and the outcome of those talks will all have avital bearing on the outlook for the power utilities industry.The political will of heads of government for a new climatetreaty and the extent of their ambition for clean energy willset the context for the sector for many years.
Whether governments have the political will to drivethrough measures to combat climate change is in somedoubt in the minds of our survey respondents. Asked if theeconomic recession would slow down responses toclimate change, 51% felt that it would have a high or veryhigh impact on a likely slowing of responses and 28% feltthat it would have a medium impact (see Figure 13). Only21% thought it unlikely that the recession would slowclimate change responses.
Figure 13: Will the economic downturn slow down responses to climate change?
Source: PricewaterhouseCoopers, Utilities global survey 2009
High or very high impact
Medium impact
Small or very small impact
51%
28%
21%
A watershed year for climate change policy

Global 15
Call for clarity
The importance of governments delivering greater clarityand developing an effective framework for thedevelopment of cleaner energy is highlighted by surveyresponses to a series of statements about renewableenergy and cleaner energy investment decisions (seeFigure 14). Nearly three-fifths of respondents (59%) feelthat their renewable energy investment programmes arebeing affected by the lack of clarity from governments onrenewable energy targets and financial support forrenewable energy. There were, however, strong regionalvariations in responses with European respondents muchhappier with the renewables policy framework.
The EU has committed to a 20% target of renewableenergy by 2020. Negotiations are taking place to translatethat overall target into individual country targets. Suchnegotiations will prove the testing ground for how far theEU target can be realised.
The Obama administration in the US has placedconsiderable emphasis on building ‘clean energy’measures into its economic stimulus package. TheObama-Biden New Energy for America plan has pledgedUS$150bn over 10 years to such measures and aims toproduce 10 per cent of the country’s electricity fromrenewable sources by 2012, and 25 per cent by 2025. Theplan was announced in late January 2009, part-waythrough our survey interviews, and may go some waytowards assuaging the 60% of American surveyrespondents who felt that lack of clarity was affecting theirinvestment decisions.
The more patchy approach to renewables targets in AsiaPacific, the Middle East and Africa, is reflected in largermajorities of survey respondents in these regions statingthat lack of policy clarity is holding them back. However,even in Europe, there is a need for greater certainty giventhe long-term timescales for investment. For example,58% of European respondents report that uncertainty overthe shape of phase 3 of the EU emissions trading schemepost-2012 is hampering their investment decisions.
Figure 14: Do you agree with the need for environmental regulatory clarity?
Agree 59%
Note: *European respondents onlySource: PricewaterhouseCoopers, Utilities global survey 2009
58%Agree
47%Agree
28%Agree
Lack of clarity from government on targets for renewable energy and long term financial support is impacting my investment decisions
Unsubsidised renewable generation is now commercially competitive against fossil fuel generation in my market
Uncertainty around phase 3 of ETS is impacting on my investment decisions *
Government policy is giving appropriate support to energy efficiency measures
Disagree
Disagree
Neither agree/disagree
Neither agree/disagree
25%Disagree
17%Neither agree/disagree
Disagree
Neither agree/disagree
23%
17%
51%
20%
28%
25%

Impact of climate change regulation
Utility executives in our survey also highlight the need formore effective specific policy mechanisms to restrictgreenhouse gas emissions (GHG). Even in Europe, wherethe EU emissions trading scheme has been in operationsince 2005, a third of respondents felt that GHGregulations had had no impact on their capital projectinvestment decisions (see Figure 15), although the impactof emissions trading was more tangible in Europeanresponses to a separate question on the scheme (seeEurope section). Around half of the respondents from AsiaPacific, the Middle East and Africa reported that suchregulation had no impact on them. Everywhere, fewrespondents said that GHG regulation had caused thecancellation of projects.
16
The importance of greater certainty on both targets andeconomic mechanisms to support renewable energy ishighlighted by the fact that, even coming off the back of aperiod of record high power prices, only 28% ofrespondents believe that unsubsidised renewable powercan compete commercially against fossil fuel generation.American respondents are especially likely to seerenewable power as uncompetitive – only 11% felt it couldcurrently compete without subsidy.
Moreover, the current financial crisis and constraints oncapital investment are exerting significant pressure oninvestment in renewable energy. Investments in wind, solar,and other evolving technologies have been among the firstto be cut. Alone out of the regions, respondents in AsiaPacific were more optimistic about the ability of renewablepower to hold its own in the marketplace.
Figure 15: How have existing and proposed GHG regulations and the carbon price affected major capital project investment decisions to date?
No impact 38%
Americas
Europe
Asia Pacific
MEA
Global
6%
3%
23%Revised projectspecification
7%Delayed orpostponed project
23%Acceleratedthe project
Cancelled project
Relocated project
Source: PricewaterhouseCoopers, Utilities global survey 2009
20 40 600 80 100%

Global 17
Energy savings and efficiency
As the responses in Figure 14 show, utility companysurvey respondents are less critical of regulatory supportfor energy efficiency measures than on other regulatorymatters, with only 28% of all respondents disagreeing withthe proposition that government policy is givingappropriate support. Again there are strong regionaldifferences. European and American respondents aremuch more likely to feel that energy efficiency support hasnot been developed sufficiently.
Energy efficiency is a critically important element in theenergy equation. Energy saved through efficiency is theonly source of ‘free’ energy that is available. However, ifsignificant reductions in per capita energy use are to occur,huge technological advancements will be required. As wedevelop more and better technologies, these efficiencieswill enable us to maximise precious energy resources,meet long-term energy challenges, and revolutioniseenergy usage in transportation and in industry.
Figure 16: Who should take the lead in achieving energy savings and efficiency?
End-users 46%
Americas
Europe
Asia Pacific
MEA
Global
3%
19%Utility companies
7%Oil & gas companies
23%Governments
Others
Source: PricewaterhouseCoopers, Utilities global survey 2009
20 40 600 80 100%
But who is to take the lead? Despite continuing initiatives,there is the danger that energy saving is something thatfalls between different stools and, indeed, only reallycomes to the fore when prices are high. Our surveyindicates the danger that this will continue to be the case.There is an increasing belief among respondents that it isnot for governments to take the lead (see Figure 16). Incontrast to last year’s survey, when 59% of all respondentsfelt that governments should take the lead, only 23% wereof this viewpoint in 2009. Instead, 46% felt the leadneeded to come from the end-users who would benefitfrom efficiency savings. However, unless prices are high, ithas to be questioned just how effective such an approachwill be.

18
Nuclear power expansion
Nuclear power is undergoing a renaissance as moregovernments change their policy stance on new nuclearexpansion. In February 2009, for example, Swedenannounced it will allow the construction of nuclear powerstations, ending a ban imposed after a 1980 referendum.Italy looks set to follow suit and the UK has alreadyannounced a programme of growth in its nuclear plants.This revival of nuclear power is reflected in 59% ofrespondents worldwide anticipating that nuclear powerwould have a significant impact in their market (see Figure17). More than half of these felt that it will have a high orvery high impact. Indeed, some respondents go further andbelieve that nuclear power should be given preference overrenewable energy in reducing CO2 emissions although theirviews are nearly balanced by those who would prioritiserenewable over nuclear power.
Figure 17: Nuclear maintains momentum
Source: PricewaterhouseCoopers, Utilities global survey 2009
High impact
Medium impact
Low impact
34%
25%
41%
Renaissance of nuclear power
Agree
Neither agree or disagree
Disagree
40%
35%
25%
New nuclear should be given preference over renewable energy as a means of reducing CO2
Nuclear power set to make a significant impact

Global 19
OperationsOur survey focused on three critical operationalareas for utility companies – deliveringtechnological improvements, limiting the growthof greenhouse gases and achievingimprovements in operational and environmentalperformance. Effective responses on thesechallenges will be vital for many aspects ofindividual company success, requiringinnovation from power utility companies.
Source: PricewaterhouseCoopers, Utilities global survey 2009
A focus on technology
Where will technological developments have most impactin the coming years? As Figure 18 shows, with regard togeneration and supply, respondents see technology havinga high but steady impact in areas such as wind andnuclear power. However, growing scores for energyefficiency, solar power, combined heat and power,distributed generation and combustible renewable andwaste generation indicate that these are seen as the likelyareas where technology will have the most new impact. All these developments will increase the likelihood oftechnology-driven competition highlighted earlier in Figure 10.
Figure 18: In which areas of generation and supply do you expect technological developments to have the greatest impact over the next 10 years in your market?
2007 2008 2009
Energy savings and efficiency 62% 79% 81%
Wind power plants 66% 62% 68%
Gas-fired plants 45% 69% 67%
Solar power plants 29% 54% 62%
Combined heat and power (CHP) plants 33% 52% 61%
Distributed generation 38% 49% 59%
Coal-fired plants 45% 49% 57%
Nuclear power plants 56% 57% 54%
Combustible renewable 33% 47% 54%
Waste incineration and landfill gas 26% 41% 51%
Micro-generation - - 45%
Geothermal 24% 40% 39%
Hydro power plants 31% 36% 36%
Oil-fired plants 11% 20% 35%

20
The introduction of new energy efficient technology is seen as a key enabler to major improvements in energyefficiency (see Figure 19). Subsidy of energy efficiencyequipment is also seen as important. The Obama-BidenNew Energy for America plan includes a US$1bn perannum federal grant programme “to identify and supportlocal manufacturers with the most compelling plans formodernizing existing or closed manufacturing facilities toproduce new advanced clean technologies”. However,unless prioritised by governments as part of stimulusprogrammes, the potential for substantial subsidyschemes is likely to be restricted because of the pressureson the public spending in many countries as a result of thecost of the various bail out and stimulus measures.
Figure 19: What are the key enablers for major energy efficiency improvements in your market?
New energy efficienttechnology
70%AmericasEuropeAsia PacificMEA
Global
Subsidy of energyefficient equipment
51%
The roll out ofsmart metering
48%
Regulating the energyperformance of buildings
46%
Distributed generation/virtualpower plants
36%
Professionally managedenergy contracting
36%
No really strong enablers 16%
Source: PricewaterhouseCoopers, Utilities global survey 2009
20 40 600 80 100%
Smart metering, which helps individual users to bettermonitor and control the way they use energy, is viewed asplaying a key role by American and Asia Pacific respondentsalthough, in Europe, despite the EU mandating an 80% roll-out of smart metering by 2020, only a minority ofrespondents saw it as important. European utilities appearsceptical about the ability of smart metering to deliver majorimprovements in energy efficiency. Smart metering in Europeis mainly predicated on other gains such as firm monthly bills,back and front office cost savings and improvements inoutage management. In contrast, smart metering in NorthAmerica and many Asia Pacific countries offers greater‘demand response’ advantages due to the very high summerair conditioning loads. Other measures that were identified asplaying a role in delivering efficiency gains included regulationof the energy performance of buildings and distributedgeneration. By placing power generation close to the enduser, distributed generation could play a part in reducingenergy lost in transmission and distribution systems.

Global 21
Limiting the growth of greenhouse gases
Expansion of renewable power sources and nuclear energyremain the principal routes by which respondents to oursurvey anticipate that GHG growth will be contained infuture decades (see Figure 20). Despite its potentialimportance in the generation mix, carbon capture andstorage (CCS) of emissions from coal-fired generationcomes lower down the list of expected technologicalimpacts over the next ten years. In the short-term,respondents are right to be cautious as, although thetechnology is available, it is expensive and is yet to beapplied to large-scale power plants. Current pilotdemonstration projects are still a few years away.Reference scenarios modelled by the IEA assumecommercialisation will not come until around 2020 (WorldEnergy Outlook 2008, International Energy Agency).
Source: PricewaterhouseCoopers, Utilities global survey 2009
However, it is anticipated that CCS will have a significantlong-term impact. Even in its less ambitious 550ppm policyscenario of stabilising GHGs, the IEA assumes that CCS willfeature in 101GW of the 323GW of additional coalgeneration capacity coming onstream between 2021 and2030, including 70% of additional capacity in OECD+countries. Thus, survey respondents’ expectation that thecoal carbon capture and storage picture in 2050 will be littledifferent from 2018 seems pessimistic and, indeed, slightlyalarming given the continuing importance of coal in thegeneration mix. The IEA’s reference scenario projects coal-fired generation to grow at two percent per annum to 2030,maintaining a 47% share of the power generation fuel mix.In the 550ppm policy scenario there is a substantialreduction in the growth of coal-fired generation but, even inthis scenario, it would still play a major role and, indeed, isprojected to be 26% higher by 2030 compared to currentlevels.
Figure 20: In which areas of generation and supply do you expect technological developments to have the greatest impact over the next 10 years in your market?
Over the next 10 years By 2050
2007 2008 2009 2007 2008 2009
Renewable power generation 47% 50% 54% 43% 54% 54%
Nuclear 43% 53% 45% 59% 58% 54%
Energy efficiency improvements 42% 42% 48% 38% 35% 46%
Displacement of new and existing coal fired capacity with gas-fired generation – 18% 16% – 14% 7%
Coal-fired generation with carbon capture & long-term geologic storage – 25% 20% – 26% 26%
Gas-fired generation with carbon capture & long-term geologic storage – 13% 17% – 13% 13%
Carbon capture and storage 26% – – 26% – –
Coal gasification 19% – – 21% – –
Gas-fired generation 22% – – 14% – –

22
Operational and environmental performance
Reduced demand for power in the economic downturnreinforces the importance of utility companies maximisingtheir operational performance. Our survey identified a rangeof opportunities for performance improvement (see Figure21). Better management of the supply chain, utilisation ofassets, billing operations and the delivery of large capitalprojects were seen as areas where high or very highperformance improvement could be achieved. Indeed, atleast half of survey respondents thought the scope forimprovement was high or very high in these areas.Relatively few felt there was little scope for performancegains. Supply chain management stood out with 62%identifying a high or very high potential for performanceimprovement and only 10% seeing little potential.
A company’s environmental performance is becomingincreasingly important from an investment point of view,particularly where carbon trading or other regulatorymechanisms impact investment feasibility and marketperformance. The senior utility company executives weinterviewed reported that communicating theirenvironmental performance was aiding their investorrelations (see Figure 22). Seventy per cent reported apositive impact, up from 57% last year, with very fewreporting a negative impact.
Figure 21: The scope for operational improvements
Source: PricewaterhouseCoopers, Utilities global survey 2009
High potential
Medium potential
Small potential
62%
28%
10%
Supply chain and logistics
High potential
Medium potential
Small potential
59%
30%
10%
Asset management
High potential
Medium potential
Small potential
45%
35%
20%
Finance operations
High potential
Medium potential
Small potential
54%
23%
23%
Billing operations
High potential
Medium potential
Small potential
49%
28%
23%
Delivering large construction projects
PeopleHaving the right people skills in place andusing these flexibly is critical to sustainingbusiness strategy and responding to marketchanges, especially as companies facetougher market conditions. Utility companieshave diverse workforces, often workingremotely and geographically dispersed. Whilethe economic downturn has helped to pushthe people factor slightly lower down theboardroom agenda, the issue of a limitedsupply of candidates with the right skillsremains a major challenge. In the long-term,companies are worried about decliningenrolment in university courses for thesciences and technologies, and expectdifficulties in recruiting and integratingyounger employees.

Global 23
Our survey confirmed continuing skills shortage concernsamong utility companies, particularly in the field of capitalproject management and technical expertise in the growthareas of renewable power and nuclear energy (see Figure23). Concern about lack of capital project managementexpertise was particularly expressed by Americanrespondents, reflecting the relative lack of infrastructureinvestment in recent years and the need to ramp up suchinvestment in the period ahead. In Europe, in contrast,anxiety about nuclear expertise stood out, again reflectingthe need to expand nuclear generation after a period inwhich nuclear power was largely off the developmentagenda.
Companies are deploying a range of strategies to respondto these concerns. In order to meet immediate needs, 70%of respondents said their companies were outsourcingspecific operations to specialists. A minority (41%) werealso looking to the international labour market and importingtalent from abroad. Looking to the longer term, 77% ofrespondents reported that their companies are stepping upclose co-operation with universities and academicinstitutions on course content and 54% were developingand running their own academies. In-house academies wereparticularly favoured by Asia Pacific respondents with 69%saying that they are taking this route.
Figure 22: What has been the impact of your environmental strategy & performance on your investors?
Source: PricewaterhouseCoopers, Utilities global survey 2009
Positive
Negative
No impact
70%
7%
23%
Positive
Negative
No impact
57%
13%
31%
2009
2008
Figure 23: In which sectors do you have a skills shortage?
Capital project managers 62%
Source: PricewaterhouseCoopers, Utilities global survey 2009
20 40 600 80 100%
20%
33%
Renewable generation - technical skills
Nuclear generation - technical skills
Electrical engineers
Energy traders
Gas engineers
IT professionals
Thermal generation - technical skills
Sales professionals
Procurement professionals
Marketing and communication professionals
HR professionals
61%
19%
32%
52%
38%
38%
29%
26%
29%

24
With survey respondents putting so muchemphasis on the need to balance short-term reaction to the financial crisis andeconomic downturn with a long-term focuson a world beyond recession, we decidedto hear the viewpoint of chief executivesand top leaders from power utilitycompanies in North America, Europe andAsia.
Dr. Jürgen Großmann is president and CEO of RWE AG, oneof Europe’s leading energy companies. Reflecting on thechanges of the past year, he says: “No one could havesuspected that we were about to face the biggest financialcrisis in the post-war era. Its extent and consequences stillcannot be predicted entirely”. He points out that one impactof the events of the past year has been that many people“now question the entire (banking) system and are secondguessing the fundamental principles of the market economy.State intervention in the economy has become the order ofthe day. Could we have imagined this a year ago? Certainlynot”.
The need to look ahead decades not years
Among the short-term impacts Dr. Großmann observes that“industrial energy consumption is on the decline, andcustomers are experiencing difficulty in making payments.Financing costs are on the rise and politicians areincreasingly inclined to regulate functioning marketprocesses more intensely”. However, notwithstanding thesefactors, and the profound nature of the changes wrought bythe financial and economic crisis, RWE emphasises theimportance of maintaining a long term perspective: “Weshould think in terms of decades, not years. This is why, inaddition to the demands currently placed on us, we alwayskeep a watchful eye on the fundamental challenges facingthe energy industry that have lasting effects. Majorinvestments must be made in Europe’s energyinfrastructure, especially in new generation capacity,electricity and gas grids, and gas storage facilities”.
Sources: BC Hydro and CPI – PwC interview. RWE – Do It. The New RWE, Annual Report 2008. CPI quotes also published in Risk, Responsibility & Opportunity: The CEO’s guide to climate action, PwC in conjunction with the Copenhagen Climate Council
Bob Elton, president & CEO of Canada’s BC Hydro, thethird largest electric utility in Canada, emphasises thatpower utility companies are used to facing short-termsituations that are different from the long-term outlook. Theimportant thing is maintaining focus on the long-term whileoptimising, and indeed looking for opportunities, in theshort-term. “The key objective of any leader must be to beclear about where you intend to be when the recession isover. You do have to adjust the pace a bit but the importantthing is to make sure that you’re facing in the right directionwhen it is over and it doesn’t have an impact on your longterm course”, says Elton.
Like RWE, BC Hydro has experienced reductions in demandfor power. “There are pluses and minuses”, Bob Elton pointsout. “It can give you more time and reduce risks. Forexample, there are opportunities to step up maintenanceprogrammes and other capital asset improvements. It givesus a chance to drive down costs, particularly on the capitalside, to take advantage of the market being a bit softer”.Skills shortages and an ageing workforce are among thekey challenges facing power utility companies in NorthAmerica and in many regions around the world. Again Eltonhighlights advantages that flow from the downturn:“Responding to the talent shortage has probably been a biteasier this year because of reduced hiring in the generaleconomy. We’re continuing to hire more young people toaddress demographic imbalances in the workforce”.
Climate change policy
While utility companies are used to planning for the long-term, the stakeholder landscape is more complex and canbe more short-term. “Our customers are less interested inthe long-term trends and, in some jurisdictions, governmentpolicy has a tendency to change pretty quickly towardsshort-term measures”, observes Elton. “A good example isenvironmental rules or legislation on climate change. It istempting for governments to lose focus on that which Ipersonally think would be a big mistake. I have seen that insome parts of the world, although not in our home market.Some form of carbon pricing is very important”.
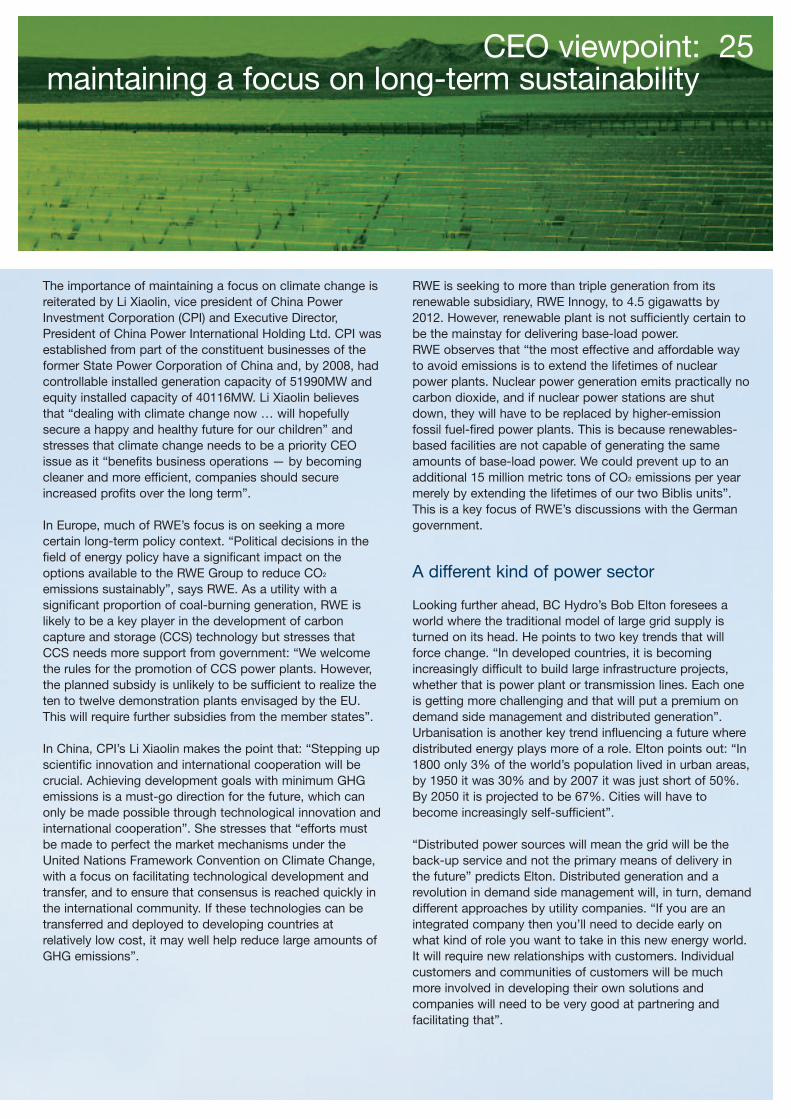
maintaining a focus on long-term sustainabilityCEO viewpoint: 25
The importance of maintaining a focus on climate change isreiterated by Li Xiaolin, vice president of China PowerInvestment Corporation (CPI) and Executive Director,President of China Power International Holding Ltd. CPI wasestablished from part of the constituent businesses of theformer State Power Corporation of China and, by 2008, hadcontrollable installed generation capacity of 51990MW andequity installed capacity of 40116MW. Li Xiaolin believesthat “dealing with climate change now … will hopefullysecure a happy and healthy future for our children” andstresses that climate change needs to be a priority CEOissue as it “benefits business operations — by becomingcleaner and more efficient, companies should secureincreased profits over the long term”.
In Europe, much of RWE’s focus is on seeking a morecertain long-term policy context. “Political decisions in thefield of energy policy have a significant impact on theoptions available to the RWE Group to reduce CO2
emissions sustainably”, says RWE. As a utility with asignificant proportion of coal-burning generation, RWE islikely to be a key player in the development of carboncapture and storage (CCS) technology but stresses thatCCS needs more support from government: “We welcomethe rules for the promotion of CCS power plants. However,the planned subsidy is unlikely to be sufficient to realize theten to twelve demonstration plants envisaged by the EU.This will require further subsidies from the member states”.
In China, CPI’s Li Xiaolin makes the point that: “Stepping upscientific innovation and international cooperation will becrucial. Achieving development goals with minimum GHGemissions is a must-go direction for the future, which canonly be made possible through technological innovation andinternational cooperation”. She stresses that “efforts mustbe made to perfect the market mechanisms under theUnited Nations Framework Convention on Climate Change,with a focus on facilitating technological development andtransfer, and to ensure that consensus is reached quickly inthe international community. If these technologies can betransferred and deployed to developing countries atrelatively low cost, it may well help reduce large amounts ofGHG emissions”.
RWE is seeking to more than triple generation from itsrenewable subsidiary, RWE Innogy, to 4.5 gigawatts by2012. However, renewable plant is not sufficiently certain tobe the mainstay for delivering base-load power. RWE observes that “the most effective and affordable wayto avoid emissions is to extend the lifetimes of nuclearpower plants. Nuclear power generation emits practically nocarbon dioxide, and if nuclear power stations are shutdown, they will have to be replaced by higher-emissionfossil fuel-fired power plants. This is because renewables-based facilities are not capable of generating the sameamounts of base-load power. We could prevent up to anadditional 15 million metric tons of CO2 emissions per yearmerely by extending the lifetimes of our two Biblis units”.This is a key focus of RWE’s discussions with the Germangovernment.
A different kind of power sector
Looking further ahead, BC Hydro’s Bob Elton foresees aworld where the traditional model of large grid supply isturned on its head. He points to two key trends that willforce change. “In developed countries, it is becomingincreasingly difficult to build large infrastructure projects,whether that is power plant or transmission lines. Each oneis getting more challenging and that will put a premium ondemand side management and distributed generation”.Urbanisation is another key trend influencing a future wheredistributed energy plays more of a role. Elton points out: “In1800 only 3% of the world’s population lived in urban areas,by 1950 it was 30% and by 2007 it was just short of 50%.By 2050 it is projected to be 67%. Cities will have tobecome increasingly self-sufficient”.
“Distributed power sources will mean the grid will be theback-up service and not the primary means of delivery inthe future” predicts Elton. Distributed generation and arevolution in demand side management will, in turn, demanddifferent approaches by utility companies. “If you are anintegrated company then you’ll need to decide early onwhat kind of role you want to take in this new energy world.It will require new relationships with customers. Individualcustomers and communities of customers will be muchmore involved in developing their own solutions andcompanies will need to be very good at partnering andfacilitating that”.

26 The Americas
United States
The drive to deliver shareholder value
Utility company managers are looking with renewedurgency at the best options to more effectively manageand maintain ‘utility plant in service’. In terms of plantmaintenance and operations, companies are increasingtraining, retaining skills, implementing more effectiveprocurement practices, deploying standardised supplychain processes and systems, embracing portfoliomaximisation modelling techniques and improving plantperformance information. Managers recognise theexponential impact of an extra percentage point ofcapacity and are exploring all options to consistentlydeliver at higher levels. When asked about their strategyto enhance shareholder value, 67% of the USrespondents to our survey cited ‘improving capacityfactors’ as receiving a high focus in their companies (see US Figure 1).
Utility managers are also focusing more on fuel diversitythan they did in the past. This is cited as an importantroute to more shareholder value. Fifty-seven per cent ofrespondents reported that this was being given a ‘high’ or‘very high’ focus. The importance of greater fuel diversityis partly driven by the need to secure supply and avoidoverdependence on a narrow range of fuel sources, but isalso influenced by climate change concerns.
Similarly, utility managers are seeking new ways toprovide better and more efficient customer service withhalf of respondents giving this a high or very high focusas a means of delivering shareholder value. Investmentsare being made in new and information-rich customerbilling systems.
The United States moved into the downturn ahead of other world economies andhas seen some of the most dramatic events of the financial crisis. Historic USfederal government intervention, designed to prevent a more severe economiccrisis, has come from both the outgoing Bush administration and the new Obamapresidency. In this environment, fundamental operational matters have played aprominent role in US utility company priorities. Companies continue to focus onplant capacity and maintenance, customer service, long-term capital projects,rate case preparedness, and environmental/climate change readiness rather thanon mergers and acquisitions or other strategic restructuring moves.

United States 27
1 2 30
United States Figure 1: What is the focus of your company’s strategy forenhancing shareholder value?
4 5
Note: Average response. Rate where: 5 = greatest focus; 1 = least focusSource: PricewaterhouseCoopers, Utilities global survey 2009
Improving capacity factors
Increasing fuel diversity
Focused customer service initiatives
Developing new products and services
Spinning off a portion of thecompany to become a pure play
Outsourcing backoffice functions
Advanced metering infrastructure (AMI) and other smartmeter/grid technology is being either explored orimplemented by nearly every large-scale utility. Improvedcustomer cost and service information is being capturedand acted upon. Utility managers also appear more awareof additional costs that are often driven by a minority of thecustomer base, and they are more cognizant of theregulatory and customer care issues (and costs) that canarise when service levels do not achieve desired targets.
The ability to drive shareholder value is further complicatedby the difficulties in accessing the capital markets. Highperformance in the areas of focus highlighted in Figure 1are an integral part of demonstrating the ability to be anoutstanding operator and thus not further limiting access tocapital markets. Survey respondents are focused onoptimising working capital and other cash managementpractices in order to respond to the increased tightening ofthe capital markets (see US Figure 2). In addition to theareas of focus above, working capital optimisationpractices include such strategies as expense control,collateral management, maintaining headroom on existingcredit facilities, and hedging interest rates and commodityprice risk.
1 2 30
United States Figure 2: How will your company respond to the increased difficulties to access the capital markets?
4 5
Note: Average response. Rate where: 5 = greater focus; 1 = least focusSource: PricewaterhouseCoopers, Utilities global survey 2009
Optimise working capital and other cashmanagement practices and related information
Reduce the size of the current establishedconstruction programme
More aggressively pursueconsolidation opportunities
Partner with utilities and others to reducethe size of your individual company’s
construction capital requirements
28
A focus on infrastructure and majorconstruction
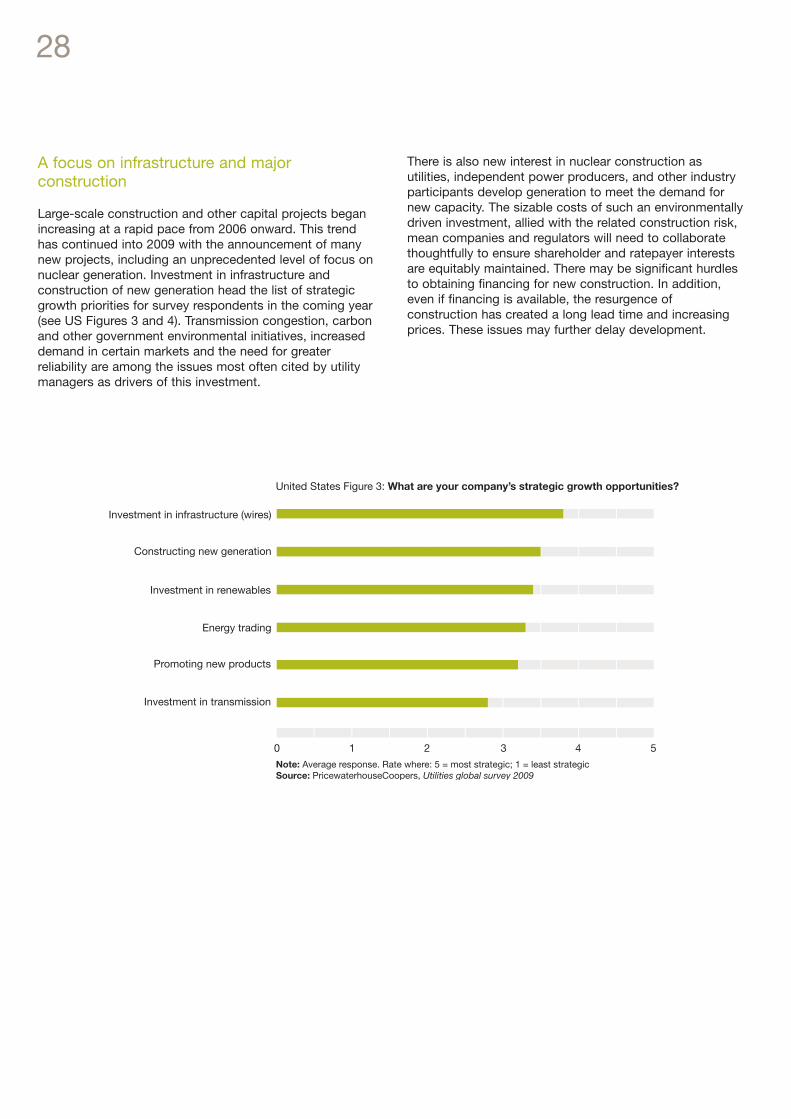
Large-scale construction and other capital projects beganincreasing at a rapid pace from 2006 onward. This trendhas continued into 2009 with the announcement of manynew projects, including an unprecedented level of focus onnuclear generation. Investment in infrastructure andconstruction of new generation head the list of strategicgrowth priorities for survey respondents in the coming year(see US Figures 3 and 4). Transmission congestion, carbonand other government environmental initiatives, increaseddemand in certain markets and the need for greaterreliability are among the issues most often cited by utilitymanagers as drivers of this investment.
There is also new interest in nuclear construction asutilities, independent power producers, and other industryparticipants develop generation to meet the demand fornew capacity. The sizable costs of such an environmentallydriven investment, allied with the related construction risk,mean companies and regulators will need to collaboratethoughtfully to ensure shareholder and ratepayer interestsare equitably maintained. There may be significant hurdlesto obtaining financing for new construction. In addition,even if financing is available, the resurgence ofconstruction has created a long lead time and increasingprices. These issues may further delay development.
1 2 30
United States Figure 3: What are your company’s strategic growth opportunities?
4 5
Note: Average response. Rate where: 5 = most strategic; 1 = least strategicSource: PricewaterhouseCoopers, Utilities global survey 2009
Investment in infrastructure (wires)
Constructing new generation
Investment in renewables
Energy trading
Promoting new products
Investment in transmission

United States 29
1 2 30
United States Figure 4: Over the next year, what will your company’s focus be on?
4 5
Note: Average response. Rate where: 5 = most focus; 1 = least focus*Question not asked in 2008Source: PricewaterhouseCoopers, Utilities global survey 2009
Acquiring/constructing new generation
Rate cases
Acquiring/constructing distribution infrastructure
Acquiring/constructing new transmission
20082009
*Developing new products and services
Mergers/acquisitions
Rising costs and regulatory transitionhave elevated rate cases to the topfocus of US survey respondents
Consistent with expectations and the focus on marketrecovery, regulators are continuing to allow lower returnsand rates than requested. The average return on equityreceived in 2008 rate cases was 10.28% versus an averagerequested rate of return of 11.13% (SNL Interactive).Mergers and acquisitions (M&A) are beginning to trendupward as compared with the prior year's responses. M&Ais likely to be an important part of many companystrategies as they respond to deregulated marketopportunities and the capital market environment.
Regulation and government – the new administration
The beginning of 2009 ushered in a new politicaladministration focused on embracing economic recovery.Utilities continue to experience rising costs for power,materials, labour, and other costs to provide services. Inaddition, transition periods and rate freezes have ended orare ending in many states. Rate cases are now the numberone focus for utility companies in the coming 12 months.Many utilities are filing rate cases for the first time in yearsand are requesting significant rate increases to cover theserising costs and capital investment.

1 2 30
United States Figure 5: What will be the biggest change in the US utility industry over the next five years?
4 5
Note: Average response. Rate where: 5 = most change; 1 = least changeSource: PricewaterhouseCoopers, Utilities global survey 2009
More environmental regulationsregarding GHG emissions
Greater share of non-US ownership
More merged companies
More pure-play companies (eg, generation only,transmission & distribution only)
20082009
More regulation
GHG emissions – the big change issue
Looking ahead, US utility company senior executives areincreasingly aware that legislation limiting GHG emissionsis forthcoming with Congress seeking a cap-and-tradesystem and the administration supporting moreEnvironmental Protection Agency (EPA) regulations andoversight. The vast majority (91%) of survey respondentsexpect ‘big’ or ‘very big change’ with more carbonemission regulation and none gave a ‘low change’ ratingto this aspect of regulation (see US Figure 5). In thisenvironment, power companies that own coal plants arereluctant to make investments in their existing or newassets as new regulations may significantly impact theirdecisions.
30
Further, US utility company senior executives see moremergers on the horizon – exactly half see a ‘big’ or ‘verybig’ change with more merged companies and a further42% give ‘medium change’ rating to more M&A. Mergersmay be necessary to raise capital to fund improvementsand new construction. Support for critical infrastructureand renewable energy may lead to less complicatedregulatory M&A approval. There is also a significantexpectation of more foreign ownership coming into thesector – 84% gave this scenario a medium to highprobability and none gave it a ‘little or no change’ rating.

1 2 30
United States Figure 6: What is your company’s strategy for dealing with climate change, carbon credits and other environmental issues?
4 5
Note: Average response. Rate where: 5 = most important; 1 = least importantSource: PricewaterhouseCoopers, Utilities global survey 2009
Energy efficiency (AMI, smart grids)
Renewables investment
Advanced coal generation investment
Nuclear investment
Carbon capture and sequestration
Purchase credits
To manage environmental demands, utility managers planto make a range of technological and generationinvestments, headed by ‘energy efficiency’ technologiessuch as AMI (see US Figure 6), which 83% ofrespondents viewed as ‘very important’ or ‘mostimportant’ with the remainder rating it as ‘mediumimportance’. Renewables investment is also important. An increasing number of power deals have been forrenewable assets or technology with wind energy leadingthe trend. Growth in ‘renewables’ will be fuelled by taxincentives and public sentiment for clean energy.
United States 31
Nuclear license applications are on the riseand pro-nuclear sentiment is growing
The new administration has pledged to significantlyincrease the production of alternative energy in the nextfew years to create a clean energy economy. A third ofUS survey respondents were attaching a ‘mostimportant’ rating to renewable investment with a furtherthird rating of medium or high importance to theircompanies’ strategy for dealing with climate change.Significantly, half of survey respondents highlightednuclear investment as ‘most important’ or ‘veryimportant’ to their companies’ climate change response.

United States Figure 7: Is your utility company’s stock appropriately valued?
Source: PricewaterhouseCoopers, Utilities global survey 2009
Yes 25%
Too low 67%
2009
Yes 76%
Too low 24%
2008
Don’t know 8%
The impact of IFRS
Most of the world already talks to investors andstakeholders about corporate financial performance inthe language of International Financial ReportingStandards (IFRS). In addition, US investors buysecurities issued by foreign companies that report theirinformation using IFRS. The Securities and ExchangeCommission (SEC) continues to drive toward theadoption of IFRS to allow US companies to competefairly against foreign companies for capital, as theirfinancial information would be presented on aconsistent basis of accounting.
32
United States Figure 8: What movement do you expect in utility stocks over the next twelve months?
Source: PricewaterhouseCoopers, Utilities global survey 2009
Higher 75%
2009
Same 25%
Lower 8%
Higher 76%
2008
Same 16%
Utility stock outlook
Each year we ask utility company senior executiveswhether their stock is appropriately valued and whatmovement they expect over the next 12 months.Respondents have been accurate in some of their pastprojections. Last year, respondents generally felt that themarkets were indicating the price was right (76%). Withthe significant fluctuations in the market during 2008,current year respondents have changed their views, with67% now believing their stock is undervalued. Theoutlook among respondents continues to be bullish, with75% expecting utility company stock prices to rise in thecoming 12 months.
United States Figure 9: How important will a change to International Financial Reporting Standards (IFRS) be to your business?
Source: PricewaterhouseCoopers, Utilities global survey 2009
Moderatelyimportant 42%
Not important 50%
Don’t know 8%
Moderatelyimportant 32%
Not important 56%
Very important 12%
2009 2008Very important 0% Don’t know 0%

United States 33
In the second half of 2008, the SEC issued a roadmapfor the adoption of IFRS as the primary financialreporting standard in the US for SEC registrants but hasindicated that it will evaluate certain milestones before itmandates use of IFRS by all US registrants. Our surveyindicates that the significance of IFRS is perhaps onlyjust beginning to be felt in the US power utilitiesindustry. Fewer than half of respondents believe achange to IFRS will be important to their companies,with 50% saying it will not be important (see US Figure9). As the SEC continues to drive toward allowing oreven mandating the use of IFRS by US registrants, thisarea will become worthy of careful observation.Increasing competition for capital and more commonacceptance of the IFRS standard domestically is likelyto make IFRS adoption a greater priority for US utilities.
United States Figure 9: How important will a change to International Financial Reporting Standards (IFRS) be to your business?
Source: PricewaterhouseCoopers, Utilities global survey 2009
Moderatelyimportant 42%
Not important 50%
Don’t know 8%
Moderatelyimportant 32%
Not important 56%
Very important 12%
2009 2008Very important 0% Don’t know 0%
Awareness of IFRS significance slow to take hold
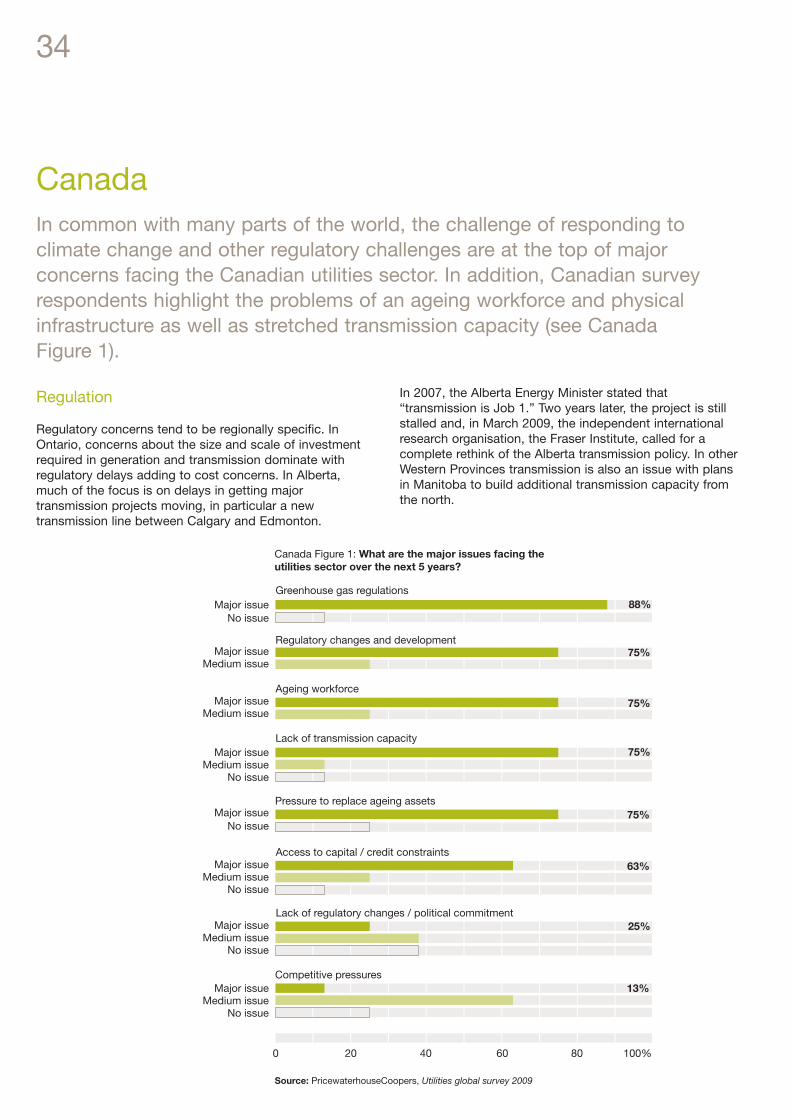
34
Regulation
Regulatory concerns tend to be regionally specific. InOntario, concerns about the size and scale of investmentrequired in generation and transmission dominate withregulatory delays adding to cost concerns. In Alberta,much of the focus is on delays in getting majortransmission projects moving, in particular a newtransmission line between Calgary and Edmonton.
CanadaIn common with many parts of the world, the challenge of responding toclimate change and other regulatory challenges are at the top of majorconcerns facing the Canadian utilities sector. In addition, Canadian surveyrespondents highlight the problems of an ageing workforce and physicalinfrastructure as well as stretched transmission capacity (see Canada Figure 1).
20 40 600
Canada Figure 1: What are the major issues facing the utilities sector over the next 5 years?
80 100%
Source: PricewaterhouseCoopers, Utilities global survey 2009
Regulatory changes and development
Ageing workforce
Pressure to replace ageing assets
Lack of transmission capacity
Competitive pressures
Access to capital / credit constraints
Greenhouse gas regulationsMajor issue
No issue
Major issueMedium issue
Major issueMedium issue
Major issueMedium issue
No issue
Major issueNo issue
Major issueMedium issue
No issue
Major issueMedium issue
No issue
Lack of regulatory changes / political commitmentMajor issue
Medium issueNo issue
75%
63%
25%
75%
13%
88%
75%
75%
In 2007, the Alberta Energy Minister stated that“transmission is Job 1.” Two years later, the project is stillstalled and, in March 2009, the independent internationalresearch organisation, the Fraser Institute, called for acomplete rethink of the Alberta transmission policy. In otherWestern Provinces transmission is also an issue with plansin Manitoba to build additional transmission capacity fromthe north.

Canada 35
People
The recent economic slowdown and consequent spike inavailable staff does not appear to have had a significantimpact on concerns about the skills shortages associatedwith the imminent retrial of long term experiencedemployees. Recent increases in the availability of juniorand intermediate staff are unlikely to mitigate theseconcerns as it is not possible to rapidly replace the leveland quality of the skills associated with retirees with junioror recent staff. The one area where the recent economicslowdown may have a beneficial impact is in theavailability of skilled construction personnel andcontractors.
Climate change
Climate change regulation in Canada is in a state of flux.British Columbia and Alberta have implemented carbonpolicies that are explict or implicit taxes on carbonemissions and the federal government has alsoimplemented a regime. There is a strong commitment tothe concept of ‘intensity based’ measures.
Such measures seek to restrict emissions to some pre-specified rate relative to input or output. However thefinancial impact and key underlying concepts of thisregulation are being fundamentally affected by thecollapse in energy prices and the rapid development inUS policy.
Utility companies in our survey report that the issue ofmanaging greenhouse gases (GHGs) is already having aconsiderable impact on their operations, in particular oncapital construction plans and costs (see Canada Figure 2). Most companies are reviewing their generationmix – only a quarter say that GHGs are having littleimpact on the fuel mix.
There is significant investment by Canadian utilitycompanies in wind power and very significant new hydroinvestment planned in specific locations in Quebec,Alberta and British Columbia. Expansion of nuclear poweris also receiving strong backing. Alberta andSaskatchewan are two provinces that have previouslybeen largely reliant on fossil fuels but now both havenuclear power plant proposals. There is also renewedinvestment in nuclear technology in numerous Ontariolocations as well as refurbishment projects for reactors inQuebec and New Brunswick.
20 40 600
Canada Figure 2: What has been the impact of the greenhouse gas issue on the following areas?
80 100%
Source: PricewaterhouseCoopers, Utilities global survey 2009
Capital construction costs
Generation mix
Environmental IT systems requirements
Environmental reporting requirements
Re-configuration of transmission systems
Capital construction plansMajor impact
Medium impactNo impact
Major impactMedium impact
No impact
Major impactMedium impact
No impact
Major impactMedium impact
No impact
Major impactMedium impact
No impact
Major impactMedium impact
No impact
38%
25%
25%
63%
38%
63%

36
1 2 30
Canada Figure 3: What is the likely impact of diminished accessto capital/credit constraints?
4 5
Note: Average response. Rate where: 5 = major impact; 1 = no impactSource: PricewaterhouseCoopers, Utilities global survey 2009
1 year time frame
3 year time frame
5 to 10 year time frame
Capital constraints
The credit crunch and ensuing financial crisis is having animpact on the availability of funding for utility companycapital projects and other purposes (see Canada Figure 3).Half of Canadian survey respondents report that diminishedaccess to capital is having a significant or major impact(scores of 4 or 5) on their planning over the coming 12months and another quarter report a medium impact (ascore of 3) over this time frame.
1 2 30
Canada Figure 4: What is the likelihood that jurisdictions in Canada currently primarily serviced by Crown Corporations (or similar publicly owned entities) will seek to increase current level of public/private partnerships or other sources of private sector investment?
4 5
Note: Average response. Rate where: 5 = very likely; 1 = not likelySource: PricewaterhouseCoopers, Utilities global survey 2009
Maritimes
Ontario
Newfoundland
British Columbia
Saskatchewan
Quebec
Manitoba
Alberta
Nearly two-thirds (63%) viewed credit constraints as asignificant issue for the sector (see Canada Figure 1).However, Figure 3 indicates that utility company executivesexpect these constraints to improve over time as currentfinancial conditions ease. Figure 4 indicates some optimismabout the potential for additional private sector financingthrough public private partnerships in some provinces. This is particularly the case in the Maritimes and AtlanticProvinces and Ontario, where expenditure needs areespecially high.

South America 37
Stalling or contracting economic growth is beingaccompanied by continuing tight financial conditions as thefall-out from the banking crisis runs its course. Mostcountries, whether developing or high income, have notbeen exempt from the impact of the financial crisis. Sincedeveloping countries have had less access to internationalcapital markets, the slowdown will affect them mainlythrough indirect mechanisms, including reduced demandfor their exports, lower commodity prices and reducedcapital inflows.
South AmericaAfter several years of strong economic growth, expansion in the region isweakening in response to the wider global economic downturn and financialcrisis. The International Monetary Fund has forecast that Latin America GDPeconomic expansion will drop to 1.1% in 2009 after unprecedented annualexpansion over the last six years at a rate of around 5%. In its March 2009forecast, the World Bank anticipated that the Latin American economy is likelyto contract in 2009, experiencing a drop of 0.6%.
1 2 30
South America Figure 1: What are your company’s future intentions in terms of investments?
4 5
Note: Average response. Rate where: 5 = most focus; 1 = least focusSource: PricewaterhouseCoopers, Utilities global survey 2009
Invest in new projects globally
Invest in/bid for new projects locally
Invest in/bid for new projects regionally
Invest additionally in the same projects
Focus on management contracts
20082009
Reduce shareholding, sell out
Maintain investment in current projects
Focus of EPC, construction, supply contracts
During the extraordinary growth years, different countriespursued different economic policies and criteria that havehad implications in the utilities arena. On the one hand,Brazil, Chile, Uruguay, Peru and Colombia have seenimprovements in their outputs, which have translated intothe energy field. On the other hand, Venezuela and, in largepart, the remainder of the countries in the region, haveseen declines in energy activity.

38
The investment outlook
As can be seen in Figure 1, there has been a significantshift in the investment priorities of utility companies.Compared to responses in last year’s survey, the appetiteto invest in new projects, particularly outside the region,has been curtailed. Instead, priorities at present arefocused on current projects, either to invest additionalfunds or just to maintain existing investments. Thedampening of new project investment ambition alsoreflects energy policies implemented in countries likeBolivia, Venezuela and Ecuador, where many utilities havebeen nationalized impacting the investment plans ofseveral companies. In addition, utility prices haveremained relatively low in some countries, such asArgentina and Bolivia, discouraging investment in newinfrastructure and concentrating efforts on maintainingcurrent projects.
The changed investment priorities stem from the mainconcerns identified by survey respondents (see SouthAmerica Figure 2). Both the high cost of financing and theglobal crisis in the banking system went from beingamong the least worrisome or ‘unremarked on’ issues in2008 to become the two major concerns for 2009. Themain concern in 2008 – regulatory uncertainty – remains asignificant concern but has been eclipsed by the financialand global economic crisis. As well as the high cost offinance, survey respondents are more worried about thedifficulty of accessing finance compared with 12 monthsago. In contrast, macroeconomic volatility declined inimportance, maybe in line with respondents’ expectationsof flatter economic growth. Perhaps in response to theimplications of flat or contracting macro economicconditions, survey respondents once again express someconcern about potential political instability, a factor whichhad declined in importance in the 2008 survey.
1 2 30
South America Figure 2: Which of the following does your company consider to be the main concerns facing investors in the region in the coming years?
4 5
Note: Average response. Rate where: 5 = most concern; 1 = least concern*Question not asked in 2008Source: PricewaterhouseCoopers, Utilities global survey 2009
Macroeconomic volatility
Inadequacy of legal safeguards, anddispute resolution mechanisms
High cost of financing
Lack of skills and competenceof available workers
20082009
*Global crisis in the banking system
Political instability
Regulatory policy uncertainty
Financial constraints/difficultyin access to finance
High tax rates and administrative costs
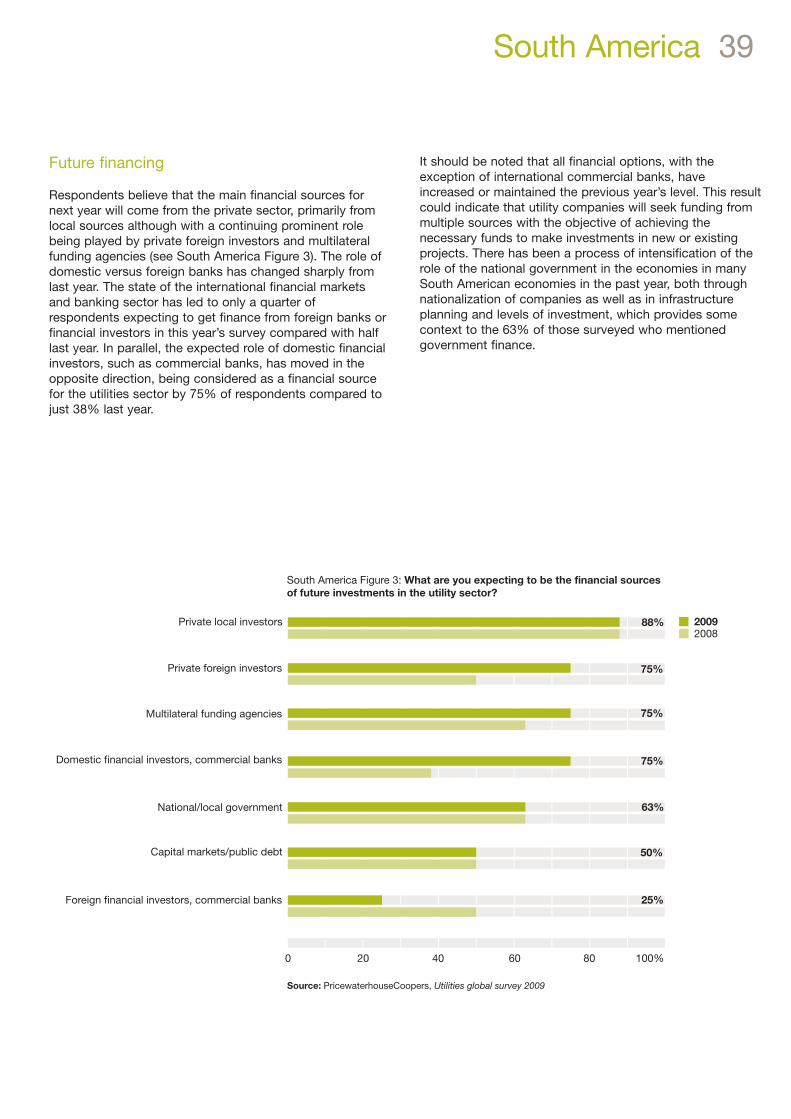
South America 39
Future financing
Respondents believe that the main financial sources fornext year will come from the private sector, primarily fromlocal sources although with a continuing prominent rolebeing played by private foreign investors and multilateralfunding agencies (see South America Figure 3). The role ofdomestic versus foreign banks has changed sharply fromlast year. The state of the international financial marketsand banking sector has led to only a quarter ofrespondents expecting to get finance from foreign banks orfinancial investors in this year’s survey compared with halflast year. In parallel, the expected role of domestic financialinvestors, such as commercial banks, has moved in theopposite direction, being considered as a financial sourcefor the utilities sector by 75% of respondents compared tojust 38% last year.
It should be noted that all financial options, with theexception of international commercial banks, haveincreased or maintained the previous year’s level. This resultcould indicate that utility companies will seek funding frommultiple sources with the objective of achieving thenecessary funds to make investments in new or existingprojects. There has been a process of intensification of therole of the national government in the economies in manySouth American economies in the past year, both throughnationalization of companies as well as in infrastructureplanning and levels of investment, which provides somecontext to the 63% of those surveyed who mentionedgovernment finance.
20 40 600
South America Figure 3: What are you expecting to be the financial sources of future investments in the utility sector?
80 100%
Source: PricewaterhouseCoopers, Utilities global survey 2009
Private local investors
National/local government
20082009
Foreign financial investors, commercial banks
Capital markets/public debt
88%
Multilateral funding agencies 75%
63%
Private foreign investors 75%
25%
50%
Domestic financial investors, commercial banks 75%

40
Sustainable energy
Alternative sustainable energy pricing will affectcompetitive electricity pricing in the near future. Gas (bothpipeline and liquefied natural gas) still stands out, andwith more emphasis than previous years, as the mainsustainable energy source identified by the respondents,followed by hydro power (see South America Figure 4).Half of the electricity generated in Latin America comesfrom hydropower sources and one quarter comes fromnatural gas sources. It is important to emphasise thatthese figures vary significantly between the variouscountries in the region. For example, in Brazil the greaterpart of generation comes from hydro power sources whilein Argentina it comes from natural gas.
The importance of Liquefied Natural Gas (LNG) has beengrowing since 2007 as concerns grow about the reliabilityof supply from net exporting countries like Bolivia andArgentina. This has encouraged countries such as Chileand Brazil to analyse the possibility of installing LNGplants in their territories. Respondents attach relativelyless importance to bio-energy, nuclear and solar power interms of their impact on future electricity pricing.
1 2 30
South America Figure 4: Which of the following alternative sustainable energy sources do you believe will affect competitive electricity pricing in your region in the near future?
4 5
Note: Average response. Rate where: 5 = strongly affect; 1 = least affectSource: PricewaterhouseCoopers, Utilities global survey 2009
Gas (pipeline)
Gas (LNG)
Wind
Hydro power
20082009
Bio-energy
Solar
Nuclear
Restructuring of power markets
Performance improvement remains in first place as thekey driver for restructuring of generation and distributionmarkets (see South America Figure 5). In the light of themore constrained financial market context, lack ofinvestment and the inability to maintain networks,identified as the least important driver in 2008, rose inimportance in the minds of survey respondents to be thesecond key driver. Other factors, such as tariffrationalisation, competition, legislation and improvedcustomer care, are also seen by senior utility executivesas more important key drivers than in the past, but stillplay an underpinning role to performance improvementand investment.
Reflecting the focus on performance improvement, costreduction and a return to core business are seen as themain tactics to improve utility company profitability (seeSouth America Figure 6). However, cost reduction is notexpected to be achieved primarily through personnelreduction. Price/ tariff increases continue to be seen as animportant contributor to improved profitability althoughreorganizing capital structure, which took first position lastyear, has declined in importance, again reflecting themore constrained financing environment.

South America 41
1 2 30
South America Figure 5: What are the key drivers for the restructuring of the generation and distribution markets?
4 5
Note: Average response. Rate where: 5 = major driver; 1 = not a driverSource: PricewaterhouseCoopers, Utilities global survey 2009
Improved customer care
Inability to supply to theindigent (poor population)
Competition
20082009
Current fragmented industry
Performance improvement
Tariff rationalisation
Lack of investment/inabilityto maintain networks
Legislation
Integration with other industries
1 2 30
South America Figure 6: Which do you see as the most likely way to improve the profitability of South American utility companies?
4 5
Note: Average response. Rate where: 5 = most likely; 1 = least likelySource: PricewaterhouseCoopers, Utilities global survey 2009
20082009
Diversification
Outsourcing
Vertical integration
Integration with other industries
JVs and alliances
Reorganising capital structure
Price/tariff increases
Cost reductions
A return to core business
Personnel reductions

Out of our European survey respondents, a quarter envisagethe price remaining at a sub Euro 20 level with three-quartersnot expecting it to top the Euro 30 price reached in mid 2008.However, a quarter of respondents are more bullish, pointingto an upward trend above the Euro 30 level.
Declining industrial activity, resulting in reduced electricityand fuel demand, is putting downward pressure on carbonprices. The extent of the economic downturn will be a keyfactor shaping the carbon markets in 2009. Many companiesare scaling back or delaying investment in capital intensiveemissions reduction projects as it is now more cost-effectiveto buy carbon credits.
In the longer term, however, more than half the companiessurveyed expect carbon prices to be higher in phase 3 of theEU-ETS after 2012. In late 2008, EU ministers confirmed thatthe cap in phase 3 would be 1,847MtCO2 per year and that,subject to concessions for internationally-competitive heavyindustries, auctioning would be the principal allocationmethod. From 2013 there will be limited free allocation to thepower and heat sector. The free allocation to major industrialsectors will ratchet down over the period to 2020 – althoughthose exposed to international competition are expected toreceive some dispensation. In our survey, many utilitiesexpected auctioning of allowances in phase 3 would push theprice up – although a similar number suggested thatauctioning would not affect profitability.
42 Europe
The European power and gas utilities sectors are in themidst of a number of major developments. Liberalisationreached a landmark stage with the opening of choice ofsupplier to all electricity and gas customers in the EUfrom July 2007. The second phase of the EU EmissionsTrading Scheme (ETS) commenced in 2008 and will rununtil 2012. Alongside these developments, the EuropeanCommission has proposed ambitious new pan-Europeanpolicy measures on further market integration and climatechange initiatives, with an ambitious timetable to adoptthe new legislation in 2009.
Carbon price outlook
The prices paid for permits to produce carbon under theEuropean Union’s emissions trading scheme (EU-ETS) fellsignificantly in the second half of 2008 and the early partof 2009, from around Euro 30 per tonne CO2 in summer2008 to only about Euro 8 in February 2009, beforerecovering to around Euro 14 in April 2009. At such levels,carbon prices are below the level needed to deliver astrong pricing signal for the development of cleanerenergy. Europe’s senior utility company executives see amixed outlook for future carbon prices for the remainingperiod of phase 2 of the ETS until 2012.
Energy security, cleaner energy, market competition and energy infrastructurehave been the issues dominating the European power market agenda. Aheadof the recession, European leaders set their sights some way forward bycommitting to a 20:20:20 ambition of 20% emissions reductions, 20%renewable energy and a 20% improvement in energy efficiency by 2020.

Europe 43
Europe Figure 1: What is your estimate of the average carbon price during the period 2009-2012?
Source: PricewaterhouseCoopers, Utilities global survey 2009
Below 20 Euros 25%
Above 50 Euros 8%
Between 21 and 30 Euros 50%
Between 31 and40 Euros 17%
Moves to cleaner power
It is the longer-term view of carbon prices that appears tobe the dominant consideration in utility companyoperational responses. Three-quarters of the utilitiessurveyed are considering investment in clean coal ornuclear generation, and two thirds stated that the EU ETSwill prompt more investment in gas-fired generation inphase 2. As Europe Figure 2 shows, the impact of ETShas been to accelerate moves to reduce the emissions ofexisting operations and to promote consideration ofnuclear generation and clean coal technology, among arange of measures which are now much more strongly onthe agenda of European power utility companiescompared with just two years ago.
20 40 600
Europe Figure 2: What impact will phase 2 of EU ETS to 2012 have on your business?
80 100%
*in 2007, the question was ‘What impact has the EU ETS had on your business since 1 January 2005?’Source: PricewaterhouseCoopers, Utilities global survey 2009
Shift in the fuel mix to favour lower carbon generation
2007*
2009
Postponement of investment in new generation
More investment in generation outside the EU
Minimal impact on operational decisions
50%
50%
50%
33%
75%
67%
67%
58%
75%
75%
Active consideration of clean coal technology
More investment in gas-fired generation
Active consideration of carbon capture and storage
More investment in renewables
Other reductions in emissions (eg through improved operations or maintenance)
Active consideration of investment in nuclear generation

Europe Figure 3: Do you have some carbon capture and storage (CCS) projects already operational or planned?
Source: PricewaterhouseCoopers, Utilities global survey 2009
25%
83%
50%
Commercial scale demonstration projects
Small scale pilot projects
CCS R&D
In the World Energy Outlook 2008, the IEA estimates that162 GW of generating capacity with carbon capture andstorage (CCS) is needed by 2030 to avoid the worsteffects of climate change – this is equivalent to bringingon stream 10 projects per year over that time frame. It is,therefore, encouraging that 83% of respondents fromutilities in Europe report that their companies areevaluating CCS projects (see Europe Figure 3). The criticalchallenge is overcoming the economic barriers andgetting the projects off the drawing board or moving fromdemonstration to full-scale deployment – a combination ofdirect government incentives, regulation and a carbonprice signal is needed.
European electricity low carbon declaration
In March 2009, nearly 60 chief executives from leadingEuropean electricity companies, including E.ON, RWE, EDF,Enel and Iberdrola, met in Brussels to urge stronger actionto support low-carbon electricity. According to the FinancialTimes, they pledged to make electricity carbon free by 2050but said that measures such as the speedier release ofgovernment subsidies for carbon capture and storagewould be essential for this ambition (Energy chiefs urgequick action on carbon, Financial Times, 19 March 2009).
44
20 40 600
Europe Figure 4: What potential policies or actions will have the greatestimpact and provide the best energy security for Europe?
80 100%
Source: PricewaterhouseCoopers, Utilities global survey 2009
50%
42%
42%
33%
75%
50%
High impact
Subsidising the development of CCS via the EU-ETS
The promotion and development of new LNG regasification facilities
The promotion and development of new nuclear generation facilities
The construction of the Nabucco pipeline
Liberalisation and the creation of a single European market
The promotion and development of new renewable generation facilities
Medium impactLow impact
High impactMedium impact
Low impact
High impactMedium impact
Low impact
High impactMedium impact
Low impact
High impactMedium impact
Low impact
High impactMedium impact
Low impact
33%
50%
42%
33%
17%
42%
17%
8%
17%
33%
8%
8%

Europe 45
The power utility leaders’ unprecedented joint declarationalso called for a commitment to nuclear power, better co-ordination of the patchwork of national systems forsubsidising renewable electricity generation andincentives for the construction of new grid connections.The latter are important to achieve true liberalisation ofEurope’s power markets and to help deliver greaterenergy security by unblocking interconnections betweengrid systems. The issue of energy security again cameinto focus with further interruptions to Europe’s gassupply from Russian in early 2009.
Energy security
The issues highlighted in the joint declaration by powerutility company leaders are also reflected in the actionsthat our survey respondents view as important in meetingenergy security concerns with a more open market,greater renewable capacity and emissions tradingincentives for CCS coming top of the list of developmentsthat would have a high or very high positive impact onenergy security (see Europe Figure 4). Measures such asmore LNG capacity, nuclear generation and theconstruction of the Nabucco pipeline, which would carrygas from the Caspian region to Austria via Turkey, areseen as underpinning in their impact on energy security.
The latter has been long discussed, often in the context ofcompeting Russian-backed pipeline proposals –Nordstream, which would bring Russian gas under theBaltic Sea, and Southstream, a gas pipeline under theBlack Sea routing to Austria and Italy. The latter was givena controversial boost with the March 2009 sale byAustria’s OMV of a holding in Mol, Hungary’s oil and gascompany, to Russia’s Surgutneftegaz. The outcome andspeed of development of the various pipeline proposalswill have a major bearing on the extent of Europe’s futuredependence on Russian gas.
Market liberalisation
Many of Europe’s energy policy issues are the subject ofdiscussions by the European Parliament in spring and earlysummer 2009. They include resolving the long-runningquestion of whether and to what extent companies mustseparate their supply businesses from nationaltransmission networks. Calls for completer separationappear to have been dropped in return for a series ofmeasures, including tighter regulation of the separation ofmanagement but not ownership of supply and transmissionas well as various consumer-oriented measures.
However, the proposals are subject to approval by theEuropean Parliament and time is running out beforeelections in June 2009. Any delay could complicate mattersand leave agreement hanging in the air for some timefurther. Uncertainty over European energy policy is perhapsa factor in a slowing of survey respondents’ expectationsof how open their electricity markets will be in five yearstime compared with now, with respondents less optimisticthan when asked the same question two years ago (seeEurope Figure 5). Gas market opening is lagging behindelectricity although, on gas, survey respondents were moreoptimistic than two years ago.
1 2 30
Europe Figure 5: How open do you consider your home market to be now, and how open will it be in 5 years time?
4 5
Note: Average response. Rate where: 5 = fully open; 1 = not openSource: PricewaterhouseCoopers, Utilities global survey 2009
Electricity – currently20072009
Gas – currently
Electricity – 5 years
Gas – 5 years

46 Asia Pacific
Asia2009 is proving to be a very challenging year for power utility companies in Asia.The impact of the global economic and financial crisis is posing numerousbusiness and operating challenges – for example, slowing growth in electricitydemand versus growing generation capacities; rapidly increasing fuel,environmental compliance and other costs versus lesser-responsive tariffs. Powerutility executives are seeking various means to increase operational efficiencies inthe current difficult market situation. At the same time, some of the power utilities,especially those in China, continue to be confident for the future and seek growthopportunities locally and overseas to meet the expected long-term demandgrowth of the utilities in the region.
Performance improvement
Asia power utilities enjoyed strong profitability from thegrowth of demand for electricity during 2007, despiteincreasing fuel and other costs. However, in 2008, theincreased capacity available and the slower growth inelectricity demand, combined with the continued increasein coal costs and increased environmental compliancecosts, have caused a lot of power utilities to sufferoperational losses. This is particularly the case in Chinawhere the tariff received by utility companies has not beenadjusted in full for the rapid increase in fuel cost.
Cost reduction and capital restructuring has become keyto performance improvement in the minds of the utilitycompany executives we surveyed. Respondents placed astronger emphasis on cost reduction and capitalrestructuring in their companies than in the previous year(see Asia Figure 1). The focus on cost reduction reflectsthe growing competitiveness in the utility marketenvironment across Asia. As more and more generationfacilities came online as a result of expansion plans,power utility companies, particularly in China, also facedless demand, putting more pressure on the absorption offixed costs to deliver profitability.

Asia 47
1 2 30
Asia Figure 1: What is driving your company’s performance improvement?
4 5
Note: Average response. Rate where: 5 = strong driver; 1 = weak driver*Question not asked in 2008Source: PricewaterhouseCoopers, Utilities global survey 2009
20082009Cost reduction
People/head reduction
Capital restructuring
Joint ventures and outsourcing
*People/head costs
The need for capital restructuring stems, in part, fromincreasing costs and the relative slow responsiveness oftariff changes. In China, for example, although there arecoal-price linkage mechanisms which allow a pass-throughof any coal price increase to tariffs, the power utilities arenot getting a 100% tariff pass-through. In 2008, the coalprice rose significantly but the tariff was only adjusted by afractional amount in some locations. This has been asignificant issue for power utilities in maintainingprofitability.
Cost reduction and capital restructuring areincreasingly vital

48
Investment
Capital restructuring may also be prompted by a quest forefficiencies and modernisation as companies seek todevelop and expand in a region considered to be anattractive market with long-term strong growth potential.Per capita use of electricity is still very low compared toother developed countries. A large majority (88%) of surveyrespondents report that their companies are investing innew technology, both information technology and newtypes of generation or transmission technology (see AsiaFigure 2). This investment focus also reflects the need forAsian utility companies to meet efficiencies andopportunities through more efficient managementprocesses. The same percentage of survey respondentsreport that their company is also expanding beyond theirdomestic market with foreign investments.
Part of this is investment in generation and transmission fornuclear and renewable energy to address the demand forcleaner generation. There is an increasing number ofrenewable and nuclear plants in the region. Power utilitiesare also investing in more technologically advancedgeneration facilities with ‘mega generation’ units being builtto increase generation efficiency.
20 40 600
Asia Figure 2: In which areas of your business have you invested recently?
80 100%
Source: PricewaterhouseCoopers, Utilities global survey 2009
20082009
Enterprise risk management
Overseas investments
50%
88%
50%Managing non-domesticbusinesses/new acquisitions
88%
75%
88%
75%
75%
Information technologyand e-business
Energy trading
New technologies ingeneration, transmission etc.
Regulatory management strategy
Customer relationshipmanagement (CRM)
On the overseas investment front, Chinese companies areactively pursuing foreign growth opportunities. Forexample, Huaneng Power International, a major Chineseutility company, recently acquired Tuas Power in Singapore.Some utility companies are also moving up the supplychain to acquire coal mining assets and dilute the impact ofrising coal costs.
Regulation
The regulatory environment has not changed significantly inthe last few years. The different level and progress ofliberalisation across the continent offers different kinds ofrisk and opportunities to investors of different appetite.Although the region has not seen major regulatorydevelopments, more survey respondents believe thatregulation facilitates business development (see Asia Figure3). This apparent increasing acceptance of the importanceof regulation bodes well for the development of moresophisticated power markets in the continent in the future.

Asia 49
20 40 600
Asia Figure 3: Is the nature of regulation a facilitator of business development or impediment?
80 100%
Source: PricewaterhouseCoopers, Utilities global survey 2009
20082009
Regulation impedesbusiness development
Regulation facilitatesbusiness development
63%
37%
Future challenges
Although utilities are stepping up hydro power, nuclear andrenewable generation capacity, coal-fired plants continue toplay a dominant role in Asian power generation. Fuel costsand tariff setting look set to continue to be a key challengealthough, with a slowing or downturn in economic growth,fewer survey respondents single out fuel costs as a majorchallenge compared to previous years. (see Asia Figure 4)
There is a need for power utilities to introduce measures forcost efficiencies in order to maintain competitiveness in themarket. However, it is still necessary to have some changesto the tariff-setting mechanism to enhance long-termviability of the industry. In China, we see more and morelobbying by companies to seek change in the tariff settingmechanism. Companies are also concerned aboutenvironmental compliance costs. Environmentalcompliance is becoming increasingly important as moreAsian countries have stepped up regulatory measures.
20 40 600
Asia Figure 4: What is/are the major challenge(s) to your business within the next 12 to 24 months?
80 100%
Source: PricewaterhouseCoopers, Utilities global survey 2009
20082009
Tariff setting
Technology requirements
63%
38%
25%Demand and Supply
25%
50%
25%
63%
Customer relationshipmanagement (CRM)
Environmentalcompliance costs
Labour
Fuel cost

50
Passage of the legislative package is uncertain withoutsupport from the either the opposition party or the Greensand Independent Senators of the Australian Senate. TheAustralian Government has also committed to extendingthe renewable energy target to achieve 20% of electricitysupply from renewable sources by 2020. At a state level,a number of states are also driving ahead with plans toimplement energy efficiency targets that apply to energyretail businesses.
In New Zealand, energy utilities also continue to operatein an uncertain environment. Challenges include theregulatory framework for transmission and distributionservices, the roles of the various regulators, uncertainintroduction of carbon pricing (the new government isreviewing the implementation of the proposed emissionstrading scheme), the reform of consenting processes, andchanging hydrological conditions.
Regulatory uncertainty, coupled with the global financialcrisis and economic downturn, are providing significantchallenges for utility companies, particularly those that areundertaking very large capital programmes to reinforceelectricity transmission and distribution security, as wellas to bring additional generation sources on-stream. Oursurvey respondents also identify the potential ‘energyefficiency/demand side management revolution’ as a bigchange lying ahead – we discuss this later under‘operations’.
Australia and New ZealandThe development of legislation for an emissions trading scheme, and itssubsequent impact on investment in new generation and other energyinfrastructure, has been a major focus for Australian utility companies. In December 2008, the Australian Government released its White Paper forthe proposed Carbon Pollution Reduction Scheme (CPRS), planned to startin July 2010. This was followed by the release of the draft exposurelegislation in March 2009.
Opportunities for growth
In Australia, there is a clear need for significant investmentin energy infrastructure to meet demand growth, replaceaged network assets, to transition to lower carbon-intensive generation and to create the infrastructure toprepare for growth in generation, including the likelihoodof significantly more renewable and distributedgeneration. In New Zealand with large hydro systemsdependency, investment in new generation sources tooptimise security of supply is a key driver due to theinherent variability associated with existing hydrogeneration schemes and increasing exploitation of thecountry’s excellent wind generation resource. The newgovernment has reversed the moratorium on new base-load thermal generation, providing opportunities forreassessment of thermal investments. This is temperedsomewhat by the proposed imposition of carbon pricingthrough the CPRS for the electricity sector, which willimpact on the economics of carbon intensive fuelsources.

Australia and New Zealand 51
1 2 30
Australia and New Zealand Figure 1: What will be the biggest changes in the Australian and New Zealand utility industry over the next five years?
4 5
Note: Average response. Rate where: 5 = major change; 1 = minor change*Question not asked in 2008Source: PricewaterhouseCoopers, Utilities global survey 2009
Arrival of clean coal
More merged companies
More pure-play companies(generation only, T&D only)
Greater involvement of investmentfunds supported by O&M companies
Greater share of non-Australianownership
Exit of governments fromasset ownership
More regulation
Significant growth inrenewable generation
20082009An ‘energy efficiency/demand-side
management revolution’
*The introduction of anemissions trading scheme
*The impact of smart meteringon consumer behaviour
Climate change policy dominates the agenda

1 2 30
Australia and New Zealand Figure 2: How important are the following strategic growth opportunities for your company over the next 12-18 months?
4 5
Note: Average response. Rate where: 5 = very important; 1 = not important*Question not asked in 2008Source: PricewaterhouseCoopers, Utilities global survey 2009
Outsourcing of business activities
Trading – energy, renewableprogrammes, emissions
Fuel diversity
Implementing new technology solutions
Investment in infrastructure (wires/pipes)
Constructing new generation
Mergers / acquisitions
Business-wide cost reductionprogramme
Investment in renewables
*Re-financing
Sale of non-core assets
20082009
Business re-structuring
Integration: generation and retail
Securing supply of fuel sources
Change in human resourcespolicies and practices
52
Survey respondents highlight that new capacityinvestments, particularly in renewable energy and gridinfrastructure, will feature prominently in strategies forgrowth over the next 12 to 18 months (see Aus/NZ Figure2). Grid investment is being primarily driven by loadgrowth and major asset renewal programmes.
Those businesses with strong balance sheets will be inthe best position to invest in, and profit from, anincreasing demand for energy infrastructure. For others,there will be difficulty in accessing project finance and/orrefinancing existing debt facilities on viable terms withinthe current global credit environment. In contrast to theneed for more electricity infrastructure, limited liquidity inthe financial markets is likely to see a growing focus oncapital management and a drive for business-wide costreductions across utility businesses as the global financialcrisis continues.
Regulation
During 2008, the most significant advance in energy marketreform in Australia was the passage of a new National GasLaw (NGL). This transferred responsibility for the economicregulation of natural gas transmission and distributionpipeline services from the states to the Australian EnergyMarket Commission (AEMC – rule making and marketdevelopment) and the Australian Energy Regulator (AER-national energy regulator), except for Western Australia.

1 2 30
Australia and New Zealand Figure 3: Which aspects of regulatory uncertainty provide the greatest disincentive to investment in the energy and utilities sector?
4 5
Note: Average response. Rate where: 5 = major impact; 1 = no impactSource: PricewaterhouseCoopers, Utilities global survey 2009
Retail price caps
Uncertainty about future emissionstrading arrangements
State legislations in wholesale market throughpricing arrangements that distort the market
ACCC attitude towards marketconcentration and market structure
Uncertainty about how thenational regulator will behave
Network pricing regimes
Uncertainty about how much power thestates will give up to the national regulator
Transmission – inter andintra-connection approval process
Uncertainty about future of environmentalschemes that support "green" investors 2008
2009
Changes in wholesaleenergy market rules
State ownership of energy assets
State legislations through mandating ofnew generation or transmission projects
Australia and New Zealand 53
Despite these reforms, the survey shows perceptionsamong respondents that regulatory uncertainty is a majordisincentive to investment in the energy sector arestrengthening. Some major developments that havecontributed to this are:
• Continued uncertainty over the timing of the introduction of emissions trading.
• A draft decision by the AER to reduce weighted averagecost of capital that will be applied to future regulatory revenue determinations for electricity distribution network assets.
• A delay until 2011 in the implementation of a national energy consumer framework (eg a code of conduct for electricity and gas retailers). This has resulted in energy retailers having to continue to operate customer retail processes with different rules in each state.
• A reluctance of the South Australia and the Australian Capital Territory governments to deregulate electricity retail prices despite independent regulators’ recommendations to do so.
• Increases in regulatory costs as Victoria, South Australia, and New South Wales have imposed different energy efficiency schemes on electricity retailers instead of one national scheme.

54
In New Zealand, the same trends are evident with anincreasingly uncertain regulatory environment which isrequiring additional management focus and resources andunnecessary costs. In particular, the proposed NewZealand Emissions Trading Scheme (which is currentlyunder review) and transmission and distribution price andquality regulation processes have both led to investmentdelays. Reviews of the functions and the status of themarket regulator, the Electricity Commission, and theeconomic regulator, the Commerce Commission, areongoing. In addition, the Commerce Commission’s pendingreport on the levels of competition in the electricitygeneration and retail sectors is increasing uncertainty forindustry participants.
Operations – the impact of advance interval meters
Following the completion of a national cost benefitanalysis, the Ministerial Council on Energy (MCE), in June2008, re-affirmed a commitment to a roll-out of electricitysmart meters in state jurisdictions where benefits outweighcosts. The provision of smart meters is expected to enableconsumers to make more informed choices and bettermanage their electricity use and greenhouse gas emissions.This can reduce demand for peak power with potentialinfrastructure savings, and drive efficiency and innovationin electricity business operations and retail marketcompetition.
The survey results indicate that a focus on energy efficiencyand demand management will be one of the biggest areasof change in the next five years (see Aus/NZ Figure 1).Survey respondents are also optimistic that a range ofoperational efficiencies and customer behaviour changeswill flow from smart metering (see Aus/NZ Figure 4).However, there is still uncertainty and risk regarding the netbenefits of advanced interval meters by distributors andretailers. In Australia, the separation of retail anddistribution creates a split benefits problem. This hasnecessitated the Victorian Government to mandate therollout of smart meters by electricity distributors to smallcustomers by December 2013.
Other jurisdictions are expected to review their position inJune 2012 after the regulatory framework for smart metersis completed and pilots and trials have been conducted toconfirm the technology. In New Zealand, the roll out ofsmart meters is not mandated by government but is gainingmomentum, as retail and network owners seek to exploitthe opportunities from more effective measurement andmanagement of demand by customers, and relatedinvestment reduction.
Optimism about smart metering

Australia and New Zealand 55
1 2 30
Australia and New Zealand Figure 4: What affect will advanced interval meters have?
4 5
Note: Average response. Rate where: 5 = major affect; 1 = no affectSource: PricewaterhouseCoopers, Utilities global survey 2009
Change customer consumption behaviourthrough the introduction of time of use tariffs
Change customer consumption behaviour through thedirect load control of key appliances in key periods
Change customer consumption behaviourby shifting load to off-peak periods
Reduce retailer bad debt andworking capital requirements
Induce a demand response that leads to a deferralof the need for peak network augmentation
Change customer consumption behaviourby reducing overall energy consumption
Result in distribution business efficiencies including avoided costs(meter reading, disconnections/reconnections, reduced
calls to faults and emergency lines)
Reduce retailer's hedging costs due tointerval data leading to improved forecasting
A useful mechanism for retailersto develop new product offerings
Reduce retailer call centre costs asa result of fewer high bill enquiries
Big potential for energy demand sidemanagement revolution

56
Given the prevalence of operational coal mines and knowncoal reserves, this technology is in receipt of substantialAustralian Government support. The Aus$500m NationalClean Coal Fund is one example of this. However,respondents’ optimism should be tempered by the lack ofemergence of any viable pilot, let alone a commercialproject, and the potential short fall between the cost ofCCS technology and expected carbon prices.
Operations – clean coal technology
The extent and pace of development of clean coaltechnology remains uncertain and many players insideand outside the utility sector remain sceptical about itsdevelopment. Survey respondents from Australia and NewZealand share this scepticism and highlight theimportance of economic incentives coming through theprice of carbon to spur the technology. However, therehas been a significant year on year shift in respondents’positive outlook on clean coal. Progress on an emissionstrading scheme has led more to believe a carbon pricesignal may become effective and an overwhelmingmajority (88%) consider that clean coal technology willhave commercial applications within the next ten years(see Aus/NZ Figure 5).
20 40 600
Australia and New Zealand Figure 5: Do you agree with the global scepticism about the reality of clean coal technology being available in the near future?
80 100%
Note: Average response. % share of response*Question not asked in 2008Source: PricewaterhouseCoopers, Utilities global survey 2009
Yes, because the carbon price is too low
Yes, because it will have commercialapplications within 10 years
*Will the advent of clean coal increase ordecrease gas-fired generation in the region?
Yes, in the Australia/New Zealand context
2008200988%
63%
25%
88%
Economic spur needed if carbon capture is to become real

Australia and New Zealand 57
Australia and New Zealand Figure 6: The forthcoming Carbon Pollution Reduction Scheme will have financial implications for both carbon intensive and non-carbon intensive businesses – How will your management respond?
Note: Average responses only. % share of respondentsSource: PricewaterhouseCoopers, Utilities global survey 2009
Easily or fairly easily 50%
Substantial or significantdifficulty 25%
Neither 25%
Articulate and quantify the specific risks and opportunities associated with the Carbon Pollution Reduction Scheme
Easily or fairly easily 50%
Substantial or significant difficulty 12%
Neither 38%
Translate these risks into clear financial and commercial solutions for your business
Easily or fairly easily 38%
Substantial or significant difficulty 12%
Neither 50%
Demonstrate that you have corporate structures in place to deal with these changes
Easily or fairly easily 38%
Substantial or significant difficulty 24%
Neither 38%
Advise your stakeholders on your short, medium and long-term carbon and sustainability reporting mechanisms
Managing risks – the focus is on carbon
Many utility businesses in Australia and New Zealandhave started to adapt their strategies and operations toposition themselves for a carbon constrained future.Companies have responded at different times and tovarying degrees, with many waiting for more certainty onemissions trading before fully committing to largeinvestment decisions. All three of the major verticallyintegrated ‘gentailer’ businesses in Australia have beenactive in looking to secure access to low carbonelectricity generation and a number of generators areassessing capital projects to increase the efficiency oftheir plants, develop renewable energy sources or progress ‘clean coal’ solutions.
However, at the time of writing, new capital intensiveenergy projects are struggling to raise project finance andthis is likely to have as much to do with uncertainty aroundthe future price of carbon as it has with the current state ofthe capital markets. Across the board, many surveyrespondents indicate cautious optimism that they can fullyassess and manage the risks, identify opportunities, andmanage stakeholder expectations regarding managing risks(see Aus/NZ Figure 6).

58 Middle East & Africa
Middle EastGrowing demand for electricity, and the impact of an inadequate physical and financialinfrastructure, means that the region’s developing markets have enormous long-termpotential for power developers. There are high expectations for project activity in thewater and power sector in 2009. However, the progress on major contracts tendered in2008 will depend on the health of the project finance market in 2009 with banksgrowing increasingly risk averse and selective about which projects they back.Moreover, the economic slowdown has led to reduced power and water demandexpectations in some parts of the region as planned residential and businessdevelopments have been put on hold.
Priorities for the sector
The majority of those questioned stated that satisfying demandwas the top priority for their organisations followed by meetingthe high capital requirements involved in expansion andrefurbishment of water and power facilities. In Saudi Arabia, forexample, one of the region’s most populous countries, powerconsumption is increasing by an average of 7% per annum andwater usage is rising by about 3%. Electricity demand isforecast to climb to more than 60,000MW by 2025, from about38,000MW today and demand for desalinated water is expectedto nearly double from the current level of 800 million gallons aday.
Expansion plans in Saudi Arabia and other countries in theregion have been hit hard by the loss of liquidity in the financialsector. The total value of the eight power and water projects inthe Gulf seeking financing in 2009 is US$18.3bn whereas thevalue of the only major independent water and power projectfinancing to close in 2008 was US$3.5bn.
Abu Dhabi has led the Gulf in encouraging greater privatesector participation in utility projects, with the implementationof five independent water and power projects (IWPP) in recentyears.
However, the strained bank lending market has thrown intoquestion the viability of the independent power project (IPP)and IWPP models, and Abu Dhabi is now preparing to turn itsprivatisation strategy on its head and fund projects publicly.This strategy is expected to be implemented by governmentsthroughout the region who will not want to allow delays onany power and water projects that could have a negativeeffect on their economies. The estimated surplus ofUS$342bn in the Gulf Cooperation Council’s (GCC) currentaccount would enable the governments to fund theseprojects themselves if project financing cannot be obtained intime.

Middle East 59
1 2 30
Middle East Figure 1: What are the priorities for the sector?
4 5
Note: Average response. Rate where: 5 = high priority; 1 = low prioritySource: PricewaterhouseCoopers, Utilities global survey 2009
Satisfy the growing demand for power
Substantial amount of investment inexpansion and refurbishment
Promotion of a safety culture
Human resource development
Alternative sustainable energy sources
While environmental concerns have prompted interest in'green' energy schemes elsewhere in the world, they arenot the main driver in the Middle East. In a region that hasto date relied exclusively on oil and gas as feedstock for itspower plants, renewable resources provide a way todiversify away from hydrocarbons and are a welcomemeans of increasing energy security. But while it is possibleto argue in favour of alternative energy projects on thegrounds that oil and gas reserves will eventually run out,this is not a pressing concern because the structure of themarket in the region means they do not have enough gasto fire their power plants.
In this context, survey respondents gave stronger scores topipelined gas, followed by liquefied natural gas (LNG), asthe ‘alternative’ energy source likely to have the mostsignificant effect on competitive electricity pricing amongalternative energy sources. Renewable energy sources likewind, bio-energy and nuclear power were not rated muchin importance, although solar power ranked higher than theother renewable sources.
Producers have no incentive to sell their gas on thedomestic market when they can secure much higher priceson export. But local utilities, accustomed to heavilysubsidised prices for feedstock, are unwilling to payinternational prices so alternative energy projects areincreasingly attractive and, for as long as global pricesremain high, that will remain the case. The Gulf plans tobuild power plants with an additional capacity of78,800MW by 2015. The majority of these plants willprimarily burn gas, and to some degree oil, but it is clearthat decision makers in the region are becomingincreasingly aware of the need to diversify their energysources. The Egyptian Electricity Holding Company, forexample, is planning to develop facilities to supply4,000MW of nuclear power and 5,980MW of wind powerunder its expansion plan for the years 2013-27.
Renewables remain low priority in a hydrocarbon rich region
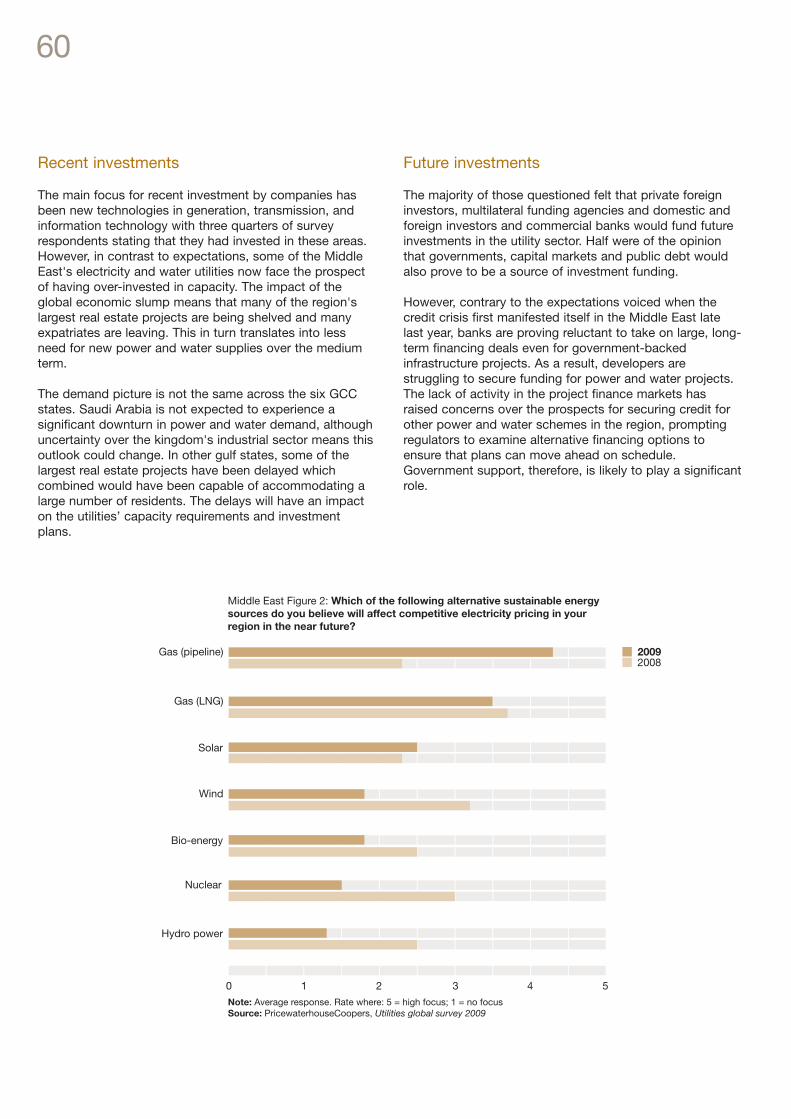
60
Recent investments
The main focus for recent investment by companies hasbeen new technologies in generation, transmission, andinformation technology with three quarters of surveyrespondents stating that they had invested in these areas.However, in contrast to expectations, some of the MiddleEast's electricity and water utilities now face the prospectof having over-invested in capacity. The impact of theglobal economic slump means that many of the region'slargest real estate projects are being shelved and manyexpatriates are leaving. This in turn translates into lessneed for new power and water supplies over the mediumterm.
The demand picture is not the same across the six GCCstates. Saudi Arabia is not expected to experience asignificant downturn in power and water demand, althoughuncertainty over the kingdom's industrial sector means thisoutlook could change. In other gulf states, some of thelargest real estate projects have been delayed whichcombined would have been capable of accommodating alarge number of residents. The delays will have an impacton the utilities’ capacity requirements and investmentplans.
Future investments
The majority of those questioned felt that private foreigninvestors, multilateral funding agencies and domestic andforeign investors and commercial banks would fund futureinvestments in the utility sector. Half were of the opinionthat governments, capital markets and public debt wouldalso prove to be a source of investment funding.
However, contrary to the expectations voiced when thecredit crisis first manifested itself in the Middle East latelast year, banks are proving reluctant to take on large, long-term financing deals even for government-backedinfrastructure projects. As a result, developers arestruggling to secure funding for power and water projects.The lack of activity in the project finance markets hasraised concerns over the prospects for securing credit forother power and water schemes in the region, promptingregulators to examine alternative financing options toensure that plans can move ahead on schedule.Government support, therefore, is likely to play a significantrole.
1 2 30
Middle East Figure 2: Which of the following alternative sustainable energy sources do you believe will affect competitive electricity pricing in your region in the near future?
4 5
Note: Average response. Rate where: 5 = high focus; 1 = no focusSource: PricewaterhouseCoopers, Utilities global survey 2009
Wind
Bio-energy
Hydro power
Gas (LNG)
Solar
Gas (pipeline)
Nuclear
20082009

Middle East 61
1 2 30
Middle East Figure 3: What is driving utility performance improvement?
4 5
Note: Average response. Rate where: 5 = very important; 1 = not importantSource: PricewaterhouseCoopers, Utilities global survey 2009
Capital restructuring
Joint ventures and outsourcing
People/head reduction
People/head costs
Cost reduction20072009
Performance improvement
Cost reduction and reduction of human capital wereidentified as the key factors driving utility performanceimprovement (see Middle East Figure 3). The importance ofcapital restructuring was also stressed by surveyrespondents. In Saudi Arabia, for example, the SaudiElectricity Company (SEC) has been developing plans toimprove efficiency and performance with changes alreadyafoot. In March 2008, it issued a tender for its first everindependent power project (IPP), to be located at Rabigh.
The next step was to improve project procurement. Insteadof tendering engineering, procurement and constructionprojects individually, SEC has started to bundle them intogroups to attract the biggest contractors and increasecompetition. It has also begun buying materials in bulk. Thecompany is also working on improving the efficiency of itsworkforce. In 2008, almost 800 people had acceptedredundancy packages and were to be replaced with newemployees in a restructured and reduced workforce withlower costs per employee.
Cost reduction key to performance gains

62
1 2 30
Middle East Figure 4: How important will the following activities be foryour company over the next 12 - 24 months?
4 5
Note: Average response. Rate where: 5 = very important; 1 = not importantSource: PricewaterhouseCoopers, Utilities global survey 2009
Business restructure
Acquisition of fuel sources
Changes in human resourcespolicies and practices
Sale of non-core assets
Implementing newtechnology solutions
Integration: generation and retail
Outsourcing of business activities
Business wide costreduction programme
Future priorities
Looking ahead over the next two years, companies areprioritising the implementation of new technology solutionsand changes in human resources policies and practicesfollowed by business wide cost reduction strategies (seeMiddle East Figure 4). The interruption in explosive demandgrowth presents an opportunity for some utilities to widentheir supply options. New technologies, such as floatingdesalination, are beginning to take hold, as illustrated by theSEC’s barge-mounted desalination units in Shuaibah. The start-up of the first phase of the Shuaibah IWPP inFebruary 2009 has increased supplies to Jeddah by 200,000cm/d. A further 150,000 cm/d of capacity has also come onstream following the extension of the original Shuaibahdesalination plant. The SEC is also among the major utilitysector players to be implementing a business wide costreduction plan.

Africa 63
Central, East and West AfricaThe African power industry is an investment hotspot. Governments, utilityplayers and other stakeholders all have a ‘build, build, build’ mentality as theylook to satisfy the region’s rapidly increasing demand for electricity. However,as the ripples from the international financial crisis reach the region andinvestors become increasingly risk averse, the industry needs to take boldsteps to attract the required investment inflows.
Growth and investment
Market reforms in the Central, East and West African powersector have had varied levels of success to date. There hasbeen some success in putting power entities onto asounder financial footing. However, poor capacity utilisation,inefficient procurement of fuel and spare parts, deficientmaintenance, as well as high transmission and distributionlosses, are still major issues. Independent Power Projects(IPPs) were considered a key part of this reform programmebut, in a number of cases, state utilities have remainedvertically integrated and maintained a dominant share of thegeneration market, with private power playing on thefringes.
Governments and utilities are actively pursuing newinvestment to drive improvements and greater private sectorparticipation. As Africa Figure 1 shows, senior utilitycompany executives in Central, East and West Africa wereall expecting to make large investments in new generationcapacity compared to 58% of all survey respondents.
This is driven in part by the substantial African infrastructuredeficit. Electricity coverage in sub-Saharan countries is only61% of that of other low income countries and generationcapacity is only 88% (Foster, September 2008, AfricaInfrastructure Country Diagnostic project).
Despite continued support from concessionary sources forpower projects, this will ultimately be insufficient to meet theplanned investments. There is strong recognition of the rolethat needs to be played by private finance. However, liketheir counterparts elsewhere, the current economicdownturn and financial crisis has led survey respondents inthe region to be concerned about the impact of a shortageof capital for infrastructure projects.
1 2 30
Africa Figure 1: What is the driver of your growth strategy? Organic growth – where are you looking to make new investments?
4 5
Note: Average response. Rate where: 5 = large investment; 1 = little or no investmentSource: PricewaterhouseCoopers, Utilities global survey 2009
Replacing / upgrading existinggeneration capacity
IT infrastructure
New generation capacity
Distribution infrastructure
Smart metering
Networkinfrastructure / transmission capacity
Rest of the WorldCentral, East and West Africa

64
Africa Figure 2: Total investment commitments in Sub-Saharan Africa energy sector
Source: World Bank and PPIAF, PPI Project Database. (http://ppi.worldbank.org),18 April, 2009
100 200 300 400 500 600 700 800 900 1, 000 1, 100 1, 200Total investment commitments in US$m
1998
1999
2000
2001
2002
2003
2004
2005
2006
Investment year 2007
1997
US$1,192m
US$166.8m
US$3,129m
US$2,497m
US$55.8m
US$483.5m
US$713m
US$450.5m
US$585m
US$715m
US$754m
Reliability of fuel supply
Even in oil and gas-rich West African countries, there areproblems with reliable fuel supply. For African utilities,improvements in procurement and contracting are key waysin which they intend to respond to upstream fuel challengesover the next five years and, again, survey respondents inthe region are focusing on these even more than their globalcounterparts (see Africa Figure 3).
The world economic crisis could provide a silver lining, withfuel and commodity costs likely to soften over the shortterm. But the downside is that there is likely to be a hardersqueeze on capital required for expansion and rehabilitation.However, these trends should not mask the morefundamental improvements in procurement that need totake place to address inefficiency, as well as the lack ofconsistent and structured procurement strategies.Institutions that are not leveraging off current best practicemodels in procurement will find themselves even furtherbehind the curve.
Performance improvement
Again, reflecting the ground to be gained, Central, East andWest African survey respondents see much more potentialfor operational performance improvement right across theboard compared to their global counterparts, particularly inthe fields of supply chain and logistics, asset managementand finance operations (see Africa Figure 4).
Nonetheless, foreign direct invesment in Africa has continuedto grow steadily since the 1990s and the World Bank hasindicated that it will take active steps to provide liquiditysupport. Private sector involvement in the energy sector hascontinued to trend upwards over the last decade – with ahigh watermark reached in 2005 (see Africa Figure 2). Whilesome traditional sponsors may withdraw from developingcountries, investors and sovereign funds from Asia and theMiddle East are becoming increasingly active.
Arguably, the more pressing constraints on capital comefrom within. Despite over a decade of experience since theAfrican reform process began to unfold, project structuring isstill not following a ‘cookie cutter’ approach – wherebystandard processes and documents are used from policysetting down to procurement. This has driven up thecomplexity of transactions and, anecdotally, had a negativeimpact on the number of successful financial closings. Themarket has also raised concerns about the approach toeconomic and non-economic infrastructure. Somegovernments have chosen to develop the economicinfrastructure themselves and are trying to send the non-economic infrastructure to the private sector.
Traditionally, greenfield generation is seen as the mostattractive economic infrastructure – particularly where powerpurchase agreements (PPAs) are in place. Distribution canattract investment if more focus is put on commercialviability. The key measure to have in place is enforceability ofcontracts, but better collection ratios and targetedsubsidisation would also help.

Africa 65
African utilities face a paradox around their supply chainand logistics. Many have to run open tender processesacross the value chain. When key parts do breakdown, thenthere can be supply interruptions while time is taken tosource parts through the open process.
20 40 600
Africa Figure 3: How are you responding to upstream (fuel) challenges now & in the next 5 years?
80 100%
Source: PricewaterhouseCoopers, Utilities global survey 2009
Upstream integrationvia joint venture or alliance
Upstream integrationvia acquisitions
Secure current fuel mix byentering into long-term contracts
Change fuel mixin existing plants
Change fuel mix innew & planned plants
Upstream integrationvia direct investments
Secure current fuel mix bysourcing fuel from new regions
Improve yourcompany procurement
Rest of the WorldCentral, East and West Africa100%
83%
83%
67%
67%
67%
33%
17%
1 2 30
Africa Figure 4: How much potential for operational performance improvement do you see in the following areas:
4 5
Note: Average response. Rate where: 5 = high potential; 1 = low potentialSource: PricewaterhouseCoopers, Utilities global survey 2009
Billing operations
Delivering largeconstruction projects
Supply chain and logistics
Asset management
Workforce management
Finance operations
Rest of the WorldCentral, East and West Africa
The result is that some utilities are holding a significantinventory of spares – some of which are not scheduled tobe replaced in the next decade. The implications of holdingthis amount of inventory are even more negative in thecurrent environment, as most institutions need to free upworking capital.

66
New generation
African utilities are far more likely to be changing thegeneration fuel mix in new and planned plants than theircounterparts in the rest of the world. All of the Africansurvey respondents we spoke to indicated a likely changein this area – compared to the global aggregate of just55%. The region’s respondents also think it is highly likelythat there will be greater demand for alternative energyresources.
Gas is a pressing investment driver in Africa. This isespecially the case in West Africa, with the growth ofnatural gas-fired power plants in Nigeria and Ghana – aswell as the development of the West African Gas PipelineProject. This will transport Nigerian natural gas to Benin,Togo and Ghana, with a potential extension to Coted’Ivoire and Senegal. In East Africa, Tanzania hassubstantially invested in gas and is looking to drive upcapacity in this area. Meanwhile, Kenya is doing likewise in geothermal.
Exacerbating these challenges is the fact that Central, Eastand West Africa is identified as having a skills shortage thatis above the global aggregate (see Africa Figure 5). Theshortages are seen as particularly severe in the operationaland maintenance areas. However, in the area of capitalproject management, only half of the region’s respondentsreport a shortage of capital project managers. This mayunderestimate the sector-wide picture withPricewaterhouseCoopers’ firms in the region anecdotallyreporting utility company sector shortages in business andproject development, technical and economic feasibilitycapability and, finally, in project managers who can deliveron time and on budget.
20 40 600
Africa Figure 5: In which sectors do you have a skill shortage?
80 100%
Source: PricewaterhouseCoopers, Utilities global survey 2009
IT professionals
Capital project managers
Gas engineers
Marketing and communicationprofessionals
Renewable generation– technical skills
Electrical engineers
Energy traders
Nuclear generation– technical skills
GlobalCentral, East and West Africa100%
83%
67%
67%
67%
50%
50%
50%

Africa 67
Step change
PricewaterhouseCoopers’ firms in the Central, East andWest African region have observed a step change inthinking about African power issues. Development partners,governments, business and other stakeholders have startedto work together to develop regulatory and other solutionsto the many problems faced in the continent. Indeed, thetime for talking is over – there is a pressing need for realchange to happen. Without real change, the region’s powershortages are likely to continue.
As can be seen in Africa Figure 6, hydro power stands outfor respondents as the alternative energy resource that willaffect electricity pricing in the region. It is estimated that95% of Africa’s technical hydropower potential remainsunexploited and it remains the leading region for thedevelopment of hydro technology. Only 36% of globalsurvey respondents think that this technology will havemore impact over the next five years, but this figure rises to67% in Central, East and West Africa. The Congo, TheDemocratic Republic of Congo and Ethiopia are some of thehotspots for major hydro power projects. Moreover, astechnology continues to improve, small-scale hydro poweris likely to become an even more important generationsource right across the continent.
1 2 30
Africa Figure 6: Which of the following alternative sustainable energy resources, or mix of resources, do you believe will affect competitive electricity pricing in your region in the foreseeable future?
4 5
Note: Average response. Rate where: 5 = greatly affect; 1 = no affect*Question not asked in 2008Source: PricewaterhouseCoopers, Utilities global survey 2009
Gas
*Other – geothermal, diesel
Solar
Wind
Hydro power20082009
Nuclear

68
Southern AfricaLike their peers in the rest of the continent, Southern African utility companiesare focused on capacity expansion to meet the growing demand for power inthe region. The successful execution of comprehensive expansion plans,coupled with energy efficiency and demand side management initiatives, areexpected to restore the region’s target reserve margin by 2012. Securinginvestor support and generation equipment amid worldwide demand is of thehighest priority in boardrooms.
Outlook for pan-African initiatives
As is evident from the survey results across the Africancontinent, cooperation between countries, governments,utility companies and other stakeholders will remain key forthe development of solutions and actions to deal with thegrowing power demand in the region. The outlook for keypan-African initiatives remains strong in the eyes of surveyrespondents and, indeed, there is greater optimism on theoutlook for harmonisation of legislation and alternativeenergy resources (Southern Africa Figure 1).
Respondents to our survey expect to see increasedinvestment in new generation capacity and greater use ofcontinent wide resources (see Southern Africa Figure 2).South Africa is responsible for more that 80% of powerbeing generated in the region, with its national power utilityEskom’s build programme set to double its generationcapacity by 2026. Keeping the build programme on track iscritical to the improvement of the current tight supply/demand balance in the region.
1 2 30
Southern Africa Figure 1: In keeping with the NEPAD principles of connecting Africa, how likely is the following?
4 5
Note: Average response. Rate where: 5 = very likely; 1 = unlikelySource: PricewaterhouseCoopers, Utilities global survey 2009
African utilities co-operate with eachother to form a common power pool 2008
2009
Cross-border transactions
More demand for alternative energyresources (gas, nuclear, wind)
Harmonisation of legislationthroughout the sub-region

Africa 69
1 2 30
Southern Africa Figure 2: Given expectations that the demand for electricity will increase over the next few years, what affect will this have?
4 5
Note: Average response. Rate where: 5 = very likely; 1 = unlikelySource: PricewaterhouseCoopers, Utilities global survey 2009
New investment in furthergeneration capacity 2008
2009
Greater use of continental-wide resources
Return to service of stationsthat are currently mothballed
Cleaner energy
As we saw in Southern Africa Figure 1, survey respondentsexpect to see an increased demand in alternative energyresources in the region in the next five years. Alternativesustainable energy sources and rising fuel costs willcontinue to affect electricity pricing in the region in thefuture. In contrast to their counterparts elsewhere in thecontinent, Southern African survey respondents expect thetrio of gas, solar and hydro power to have a high to mediumimpact on the future energy mix (see Southern Africa Figure 3). With the exception of gas, it is noticeable thatexpectations of the impact of all alternative fuel sources arelower compared with last year’s survey. This is likely to be inpart because of the pressure to increase generationcapacity and the higher costs of such generation comparedto the region’s coal plants.
Restructuring
Restructuring of the generation and distribution markets willremain important if the industry is to meet challenges suchas market competition and regulatory compliance.Performance measurement and improvement, investment innew technology and enhanced customer management areall seen as vital, by survey respondents, to the success ofthe region’s market restructuring.
The Southern African region will continue to focus oncapacity expansion over the next 10 years coupled withskilled resource development requirements. Regional co-operation will be key to the region’s ability to meet industrychallenges. Keeping expansion plans on track will be vital tothe improvement of the current tight supply demandbalance in the region.
1 2 30
Southern Africa Figure 3: Which of the following alternative sustainable energy sources do you believe will affect competitive electricity pricing in your region in the near future?
4 5
Note: Average response. Rate where: 5 = greatest affect; 1 = no effectSource: PricewaterhouseCoopers, Utilities global survey 2009
Nuclear
Wind
Hydro power
Solar
Gas20082009

70
In any crisis there is opportunity. When energy and powerprices were skyrocketing less than a year ago, the call forlong-term solutions was loud and widespread. But now, asconsumption falls and the energy crisis seems to be waning,there is a danger of being lulled into complacency. Already, inthe current credit crunch, investments in wind, solar, andother evolving technologies have been among the first to becut. Will companies and governments act now to set a moresustainable long-term course for power production andconsumption or will the current economic crisis dilute suchmoves?
One crucial test will be the resolve of governments in the lead-up to the December 2009 UN Climate Summit inCopenhagen to try to agree a successor to the KyotoProtocol. An energy policy that fosters the investment neededover the long term cannot be fully effective unless there is aclearly defined approach to carbon reduction requirements.Policy makers and power companies alike need to embrace amulti-resource mindset. There will be a need for collaborationand imaginative initiatives that leverage technology andpeople to promote increased supply and reduced demand.
Despite the current downturn, companies seeking growth aresetting their sights on a future low carbon but high energydemand world. It will require bold footprint moves. In somecases that will be moves by companies upstream to securegas supply, in other cases it will be horizontal expansion toincrease presence in the renewable energy or nuclear powerfield and, in other cases, it will be developing newtechnological capabilities to ensure that new sources ofpower generation can be maximised and a more flexible mixof distributed and grid power networks can be deployed.
Traditional boundaries and spheres of operation are beingsuperseded by new, more far-reaching power utility companyroles and footprints. Already, utility companies are looking atthe potential to develop networks of plug-in electric carrecharging points and to harness the potential of overnightcharging to make use of underused off-peak generationcapacity. Carbon sequestration will require alliances withmining and oil exploration companies in order to developunderground or underwater carbon storage. First mover orearly mover advantage in developing commercial scalecarbon capture technology at an acceptable cost will givecrucial competitive advantage in the future.
It is obvious that it is impossible to invest fast enough inalternative sources of energy to displace the significantcontribution that hydrocarbons represent. At a minimum,hydrocarbons will be a bridge to a future when investments inalternative sources will have more impact. However, that is fardown the road. For many countries now, exploiting domestichydrocarbons is necessary to energy security. Thedevelopment of cleaner coal technology will perhaps be themost critical single development in the power sector in thecoming decade.
The most important factor underlining all of this, as oursurvey respondents make clear, will be an effective regulatoryframework that provides the long-term certainty andincentives required to move to more energy secure, lowcarbon power production. Past cycles of one-off, short-termsolutions must be broken and give way to a long-termplanning horizon—30 years or more. That will not just requirean effective agreement at Copenhagen in December 2009 butneeds to embrace other regulatory policies as well. Policiesthat govern such matters as consumer and buildings energyefficiency and the permitting of sites for power generation,LNG re-gasification terminals and other vital infrastructuremust also be aligned with energy security and low carbongoals.
Looking ahead‘What did you do in the downturn?’ Moves made in the downturn may comeback to haunt or delight in a future upturn. The very business of power utilitycompanies requires them to look far ahead. No government or customer willremember the downturn if the lights go out in the upturn. Likewise, thetimetable of global warming means moves made during the current period arelikely to be critical for the medium to long-term mitigation of greenhouse gas growth.

Contact us 71
Global contacts
Manfred WiegandGlobal Utilities LeaderTelephone: +49 201 438 1517Email: [email protected]
Michael HurleyGlobal Energy, Utilities & Mining Advisory LeaderTelephone: +44 20 7804 4465Email: [email protected]
James KochGlobal Energy, Utilities & Mining Tax LeaderTelephone: +1 713 356 4626Email: [email protected]
Olesya HatopGlobal Energy, Utilities & Mining MarketingTelephone: +49 201 438 1431Email: [email protected]
Territory contacts
Asia-Pacific
AustraliaMichael HappellTelephone: +61 3 8603 6016Email:[email protected]
ChinaGavin ChuiTelephone: +86 10 6533 2188Email: [email protected]
IndiaKameswara RaoTelephone: +91 40 2330 0750Email: [email protected]
IndonesiaWilliam DeertzTelephone: +62 21 521 3975Email: [email protected]
SingaporeRobert MontgomeryTelephone: +65 6236 4178Email: [email protected]
Europe
AustriaGerhard Prachner Telephone: +43 501 88 1800Email: [email protected]
BelgiumBernard GabrielsTelephone: +32 3 259 3304Email: [email protected]
DenmarkPer Timmermann Telephone: +45 39453945Email: [email protected]

SpainGonzalo Sanchez MartinezTelephone: +34 946 022 534Email: [email protected]
SwedenMartin GaveliusTelephone: + 46 8 555 335 29Email: [email protected]
SwitzerlandRalf SchlaepferTelephone: +41 58 792 1620Email: [email protected]
TurkeyFaruk SabuncuTelephone: +90 212 326 6082Email: [email protected]
United KingdomRoss HunterTelephone: +44 207 804 4326Email: [email protected]
Middle East and Africa (MEA)
Middle EastReinhard SchulzTelephone: +971 2 6946905Email: [email protected]
Central, East and West AfricaVishal AgarwalTelephone: +254 20 285 5581Email: [email protected]
Southern AfricaStanley SubramoneyTelephone: +27 11 797 4380Email: [email protected]
The Americas
United StatesDavid EtheridgeTelephone: +1 415 498 7168Email: [email protected]
CanadaAlistair BrydenTelephone: +1 403 509 7354Email: [email protected]
John WilliamsonTelephone: +1 403 509 7507Email: [email protected]
Latin AmericaJorge BacherTelephone: +54 11 4850 6801Email: [email protected]
For copies of the report, please visit www.pwc.com/energy
72 Contact us
Europe (continued)
Finland Juha TuomalaTelephone: +358 9 2280 1451 Email: [email protected]
FrancePhilippe GiraultTelephone: +33 1 56 57 88 97Email: [email protected]
GermanyManfred WiegandTelephone: +49 201 438 1517Email: [email protected]
GreeceSocrates Leptos-BourgiTelephone: +30 210 687 4693Email: [email protected]
IrelandDenis O’ConnorTelephone: +353 1 792 6288Email: [email protected]
ItalyJohn McQuistonTelephone: +390 6 57025 2439Email: [email protected]
NetherlandsAad GroenenboomTelephone: +31 26 3712 509Email: [email protected]
NorwayStaale JohansenTelephone: +47 9526 0476Email: [email protected]
PortugalLuis FerreiraTelephone: +351 213 599 296Email: [email protected]
Russia & Central and Eastern EuropeDavid GrayTelephone: +7 495 967 6311Email: [email protected]

PricewaterhouseCoopers (www.pwc.com) provides industry-focusedassurance, tax and advisory services to build public trust and enhancevalue for its clients and their stakeholders. More than 155,000 people in 153countries across our network share their thinking, experience and solutionsto develop fresh perspectives and practical advice.
PricewaterhouseCoopers refers to the network of member firms ofPricewaterhouseCoopers International Limited, each of which is a separateand independent legal entity.
The Global Energy, Utilities and Mining group (www.pwc.com/energy) is theprofessional services leader in the international energy, utilities and miningcommunity, advising clients through a global network of fullydedicated specialists.
Methodology
A world beyond recession Utilities global survey 2009 is based on research conducted betweenJanuary-February 2009 with 69 senior executives from 65 utility companies across 39 countries.Research covered the four major regions of the Americas, Europe, Asia Pacific, Middle East andAfrica. The majority of utility participants were Senior Vice-Presidents and Presidents, CEOs orother senior managers. No more than two interviews were taken from any individual company,although multiple respondents were taken from some countries. The survey sample is comprisedof power and gas utilities (suppliers, transmission companies, traders or generators) that havedeveloped a broad range of interests in a number of complementary utility sectors or otherregions.
Acknowledgements
PricewaterhouseCoopers thanks all the participants who took time to complete the survey. Wewould also like to thank our local PricewaterhouseCoopers teams, in each of the four regionscovered by this study, for their insightful contributions throughout this year’s project. This is theeleventh utilities sector survey. We take this opportunity to thank everyone who has participatedover this eleven-year period, both within PricewaterhouseCoopers and in the utilities sector.
73
PricewaterhouseCoopers would like to thank Vattenfall for providing images used in this survey.
This report cover is printed on FSC Profisilk 300gsm. The text pages are printed on FSC Profisilk 170gsm.

www.pwc.com
© 2009 PricewaterhouseCoopers. All rights reserved. PricewaterhouseCoopers refers to the network of member firms ofPricewaterhouseCoopers International Limited, each of which is a separate and independent legal entity.