Industrialisation and the Environmental Quality under ...archive.ias.unu.edu/resource_centre/UNU-IAS...
54
UNU/IAS Working Paper No. 106 Industrialisation and the Environmental Quality under Economic Reforms: An Indian Case Study K. Narayanan and T. Palanivel October 2003
Transcript of Industrialisation and the Environmental Quality under ...archive.ias.unu.edu/resource_centre/UNU-IAS...

UNU/IAS Working Paper No. 106
Industrialisation and the Environmental
Quality under Economic Reforms:
An Indian Case Study
K. Narayanan and T. Palanivel
October 2003

Industrialisation and the Environmental Quality under Economic Reforms:
An Indian Case Study
K. Narayanan and T. Palanivel
UNU/IAS
Abstract
The purpose of this study is to analyse the linkages between industrialisation and the
environmental quality in the context of on-going economic reforms in India. The study
also explores the possibility of accelerating and sustaining a higher industrial growth for
India. In dealing with the industry-environment linkages, the study follows the
analytical framework provided by the Environmental Kuznets Curve. It finds evidence
to support an inverted U shaped relationship between industrial value added per capita
and carbon emissions. However, the relationship turned out to be U shaped in the case
of water pollution. Multiple regression analysis indicates that, apart from industrial
value added, trade, technology and economic reforms also emerge significant in
determining environmental quality. Overall, the analysis points out a vital role for FDI
in accelerating and sustaining India’s industrial growth.
--------------------------------------
This is a part of the larger work that we are carrying out in the project on Sustainable Development Framework for India. We
benefited from the discussions that we have had with Professors Kirit Parikh, K. L. Krishna, N.S. Siddharthan and Yukihiko
Kiyokawa. The usual disclaimers apply.

1
1. Introduction
In the 1990s there have been many attempts to evaluate the impact of economic growth
on environment quality. There was little agreement as to whether economic growth led
to environmental degradation or to increasing environmental quality. At the one
extreme there are some who argue that economic growth results in ever increasing use
of energy and materials and hence more environmental degradation. At the other
extreme are some others who claim that the faster road to environment improvement is
more economic growth. In the early 1990s, a number of empirical studies [Grossman
& Krueger 1991, 1994, Shafik and Bandopadhyaya 1992, Panayotou 1995] found an
inverted U-shaped relationship between income and some local environment pollutants
such as particulate and sulfur dioxide. This implies a changing relationship between
environment quality and economic growth: environmental degradation gets worse in
the early stages of development, but eventually reaches a peak and starts improving as
income exceeds a certain level. This relationship has been defined as the
Environmental Kuznets’ Curve [EKC] after Simon Kuznets who first observed a
similar changing relationship between income and inequality.
Most of the empirical studies on EKC are based on either a cross-country data at a
given time point or panel data for samples of developed and/or developing countries.
However, an EKC obtained from cross-country regressions1 “may simply reflect the
juxtaposition of a positive relationship between pollution and income in developing
countries with a fundamentally different negative one in developed countries, not a
1 Levine and Zervos (1993) have identified the conceptual and statistical problems associated with cross-
country regressions on empirical linkages between economic growth and indicators of national policies.

2
single relationship that applies to both categories of countries” [Vincent 1997 pp. 417].
The same problem might hold true for results obtained from panel data because of the
differences that exist between these two data sets. Moreover, as Unruh and Moomaw
(1998) pointed out “it does not seem appropriate to infer a GDP-dependent dynamic
equation of motion for a national pollution trajectory from a static analysis” [p.228].
Further, these studies ignored the role of economic reforms and the resultant structural
change in the economy, as well as technology transfer for pollution abatement and
energy efficiency, in the EKC analysis.
Departing from the conventional approach of linking environment quality with overall
economic growth, this paper examines the operation of EKC from a developing country
[viz., Indian] perspective and analyses the inter-relationship between environmental
quality and industrial growth. Moreover, unlike many earlier studies, this paper uses
time series data. Industrial growth [defined as value added per capita] rather than
income per capita is chosen because industry is viewed as a more polluting sector
compared to agriculture or service sector. Theoretical analysis of EKC clearly states
structural change in the economy as an important reason for inverted U-shape
[Panayotou 1993].2 That is economic growth bring about structural change that shifts
the center of gravity of the economy from low-polluting agriculture to high polluting
industry and eventually back to low polluting services. Moreover, after pursuing an
inward-looking development strategy for more than four decades, India decided to take
a historic step of shifting its’ policy paradigm in 1991. The seeds of economic
2 In the literature, there are many other reasons given for an inverted U-shaped relationship the details of
which are discussed in Section 4.

3
liberalisation were visible during the 1980s itself. Much of this policy focussed on
reforms with respect to industry and trade. As a result of this shift in the policy the
Indian industrial sector grew at a higher rate than that of the previous decades and
emerged as an engine of growth of the economy. Therefore, any meaningful link
between economic growth and environment should take into account the role of
industrial sector in the analysis.
Further, since liberalisation in economic policies also enabled large inflow of foreign
capital, technology and trade, attempt would also be made to examine the impact of
economic reforms in general and these variables in particular in determining the level
of air and water pollution. Specifically, in this study, factors such as economic reforms,
trade and technology are also brought into industry environment linkages.
The study is divided into five broad sections. Section 2 deals with an overview of the
industrialisation experience in India during last 50 years. Section 3 presents a discussion
on the link between industrialisation and environment quality in India. While section 4
discusses the framework of analysis, data and methodology used in the analysis of
industry-environment linkages, section 5 presents the results of econometric analysis.
Section 6 discusses some of the implications of the results of the analysis for sustainable
industrialisation. In Section 7, a brief summary and major conclusions of the study are
presented.

4
2. An Overview of the Industrialisation Experience
2.1 Policy Framework
The basic element of early industrialisation strategy was import substitution. Export
pessimism was the underlying assumption. Consequently, since 1956, India placed high
emphasis on the capital goods sector or the heavy industry. The choice of capital or
investment goods sector over consumer goods’ sector was made on the assumption that
the economy suffered from serious “capital constraint’. Capital constraint was said to be
operating in terms of both financial capital [due to low propensity to save] and availability
of physical capital goods. Allocating a larger share of the nation’s limited investable
resources to create the capacity to produce capital goods whose output will also be used to
produce capital goods was expected to remove this capital constraint.
The policy imperatives to implement this strategy includes industrial licensing, control on
capacity, import and export controls, control of capital issues, control of foreign exchange,
allocation of raw materials, price controls and allocations of credit. These measures
suggest that the planners and policy makers understood the need for using a wide variety
of instruments and controls to steer the industrial development in a desired direction.
During the late 1960s and early 1970s, government introduced further regulations to
restrict the growth of monopoly in Indian industries and monitor the foreign exchange
flows into the economy.
The heavy industry biased industrialisation strategy stressed heavily on a “closed
economy” approach. Very limited role was assigned to international trade. Achievement

5
of national self –sufficiency was given top priority in the policy formulation. It was
widely believed that controls and regulations of exports and imports, and state trading in
select commodities, are necessary not only from the point of view of utilising limited
foreign exchange resources available but also for securing an allocation of the productive
resources of the country in line with the targets defined in the Plan [Planning Commission
1950]. The implementation of import substitution was ought to be achieved through the
insistence on indeginisation requirements of the industrial output in most industries.
These elaborate system of government control over production, investment, technology,
locational choice, prices and foreign trade instituted in the mid 1950s led to lackluster
growth, an internationally uncompetitive industrial structure, a perpetually precarious
balance of payments, and above all, rampant rent seeking and the corruption of social,
economic, and political systems.3 Consequently, India neither achieved self-reliance in
industrial growth nor eradicated poverty. Moreover, during the late 1960s and 1970s,
Indian industry experienced a deceleration due to low productivity, high costs, low quality
of production and obsolete technology [Ahluwalia, 1985]. Recognition of these
bottlenecks lead to some fresh thinking among Indian planners on the need to promote
technological modernisation and competitiveness, apart from efforts to remove these
supply-side hurdles.
In the early 1980s, three important committees namely, the Abid Hussain Committee, the
Narasimhan Committee and the Sengupta Committee were set up to review industrial and
3 See for example, Srinivasan (1994) and Ahluwalia (1991).

6
trade policies. These committees recommended easing up of trade policy, the substitution
of physical and quantitative controls by fiscal and other means of macroeconomic
management, the promotion of greater public sector autonomy in business and operating
decisions and the need for measures for enhancing productive efficiency and technological
modernisation.
These recommendations resulted in the process of de-regulation during the 1980s, but
gathered more momentum in the early 1990s. The measures introduced in the 1980s
include (i) de-licensing without any investment limit of thirty-two groups of industries, (ii)
broad-based classification of commodities for issue of licenses, (iii) automatic permission
for expansion of capacities, (iv) permission to MRTP and FERA companies also to avail
(ii) and (iii), if they are located in an industrially backward region, (v) increase in the paid
up capital limit of the firms to be covered under the MRTP Act from Rs.20 crores to
Rs.100 crores and key changes in trade policy including increasing access of exporters to
inputs at international prices and classification of several important inputs, parts and
components under OGL. Further, selective permission for foreign direct investments was
also granted in cases where the FDI involve transfer of technology.
As a result, during the 1980s industrial output and productivity performance improved
significantly [Kelkar and Kumar 1990, Nagaraj 1991 and Ahluwalia 1991]. However,
inspite of showing an up-beat performance during the early years of moderate reforms, the
industrial sector exhibited severe structural rigidities by the end of this decade. The
industrial growth rate, for the first time, turned out negative in 1990-91. The economy also
experienced a severe balance of payments problem in 1991. The economy in early 1990s

7
was seen as having a variety of problems including an inefficient, high cost and non-
competitive industrial structure, serious infrastructure related bottlenecks and
significant constraints on the availability of financial capital. It was argued that policy
induced rigidities had constrained the choices of industries, apart from protecting them
from internal and external competition. Efforts were directed to identify these rigidities
and it was widely recognised that bureaucratic determination of plant capacity, product
mix and location resulted in ignoring the market processes. Trade in scarce materials
became more lucrative than efficient manufacturing. Further, the trade policy also had
an anti-export bias, which blunted export orientation. This bias was reinforced by
curbing of imports via tariffs and quantitative restrictions as a part of the import
substitution strategy. All these necessitated major reforms not only in the industrial
sector, but also in the trade, exchange rate, financial and fiscal sectors.
The reform measures, introduced since July 1991, are designed to remove these policy-
induced distortions and foster efficiency to face global competitiveness. Liberalilsation
measures include, widespread industrial de-licensing, dilution of MRTP Act, trade
reforms including lowering of tariffs and removal of physical barriers on imports,
opening up of many sectors for FDI and higher equity participation, changes in FERA,
liberalisation of policies related to foreign technology purchase and licensing, capital
market reforms, liberal permission for inward flow of foreign portfolio investments
from foreign institutions and allowing the exchange rate to be determined by the market
forces. In the following section, the impact of these policies on the industrial
performance is examined.

8
2.2 Performance
This section deals with an analysis of the changing share of the industrial sector in general
and the manufacturing sub-sector in particular in gross domestic output of the economy.
There has been a significant shift in the sectoral share of GDP over the last 50 years.
Tough the share of agricultural sector has been declining (from 55 to 25 per cent) over the
years; it is still account more than one fourths of the GDP and has had a significant impact
on industrialisation, employment and incomes. The share of industrial sector and service
sector in GDP has been increasing steadily from 16 and 28 per cent in 1951 to 32 and 43
per cent respectively in 1999 (see Chart 1).
Chart 1: Sectoral Shares of GDP
Table 1 provides the trends in the rate of capital formation at broad sectoral levels. It is
evident that during the last three decades, the share of industry in total capital formation
[or investment] has increased from 50 per cent to 60 per cent. The share of investment
Sectoral Share of GDP
0
10
20
30
40
50
60
70
80
90
100
1951 1955 1959 1963 1967 1971 1975 1979 1983 1987 1991 1995 1999
Per
cen
t
Agriculture Industry Services

9
in agriculture has actually declined from 3.35 to 2.90, while that of services has
increased slowly from 6.03 to 8.31. This highly increasing share of industry in the total
investments made in the economy is evidence of a dominant role played by the
industrial sector in the overall economy.
The reforms of 1991 are expected to correct the distortions made by the earlier
industrialisation strategy and more specifically to tackle the problems of a high cost and
globally uncompetitive industrial sector which is out of tune with India’s capital scarcity
and labour abundance.
Table 1: Average Rates of Capital Formation: Destinations (Per Cent of GDPMP)
Period Agriculture Industry Services
1971-75 3.35 9.75 6.03
1976-80 4.19 11.26 6.80
1981-85 3.76 13.32 7.53
1986-90 3.04 15.15 7.31
1991-95 2.84 15.06 7.55
1996-98 2.90 15.67 8.31
Source: Pandit and Mohanty, 2001.
A growing body of literature has examined the impact of liberalisation in industrial and
trade policies on manufacturing sector performance in different countries.4 While most of
the studies focused on making inter-country comparisons, a few studies analyse the impact
4 Refer USITC (1997) for a detailed review.

10
of trade liberalisation on manufacturing productivity.5 Studies examining the impact of
de-regulations policy point out that productivity trends in the organized manufacturing
sector in India show a clear turn for the better in the 1980s [Ahluwalia, 1991]. Similar
evidence for the post 1991 period is yet to be well documented.6 Kumar (2000) examines
the macro implications of economic reforms, in particular highlighting growth and
sustainability, fiscal adjustment and stability and external sector. He documents changes
in sectoral performance, industrial restructuring, foreign direct investment flow, enterprise
level R & D during the post reform period. Basant (2000) observes that liberalisation has
promoted a trend of corporate restructuring and consolidation through mergers and
acquisitions. There are also evidences of differences in the mode of technology transfer
[Siddharthan, 1999] during the post reform period. However, the processes by which
increased dynamic efficiency is achieved in response to industrial and trade liberalisation
are not spelled out explicitly in the literature available so far. Moreover, although there is
a broad consensus on the need for economic reforms in India; especially because of its’
ability to improve competitiveness and the resultant impact on improving efficiency in
resource use; there has hardly been any attempt in the literature so far on the possible
outcome of such an improved efficiency on sustainability of the very foundations of recent
industrial growth. This study, while examining the nature and pattern of industrialisation
in the post-reform period, largely focuses on this missing aspect of recent industrialisation
in India. Specifically, an attempt has been made to bring out the inter-relationship
between industrialisation and environmental quality, and examine the role of economic
5 Roberts and Tybout (1996) present research studies based on data on panels of producers surveyed in
five newly industrializing countries: Chile, Columbia, Mexico, Morocco and Turkey. 6 Das (1999) finds that productivity performance of Indian industries worsened in the 1990s [1990-91 to
1994-95] as against the 1980s. However, most industries witnessed entry of global players during the
post 1995-96 period and therefore the trend could well be different if one considers these later years also.

11
reforms, trade and technology in determining environmental quality in a developing
economy like India.
In evaluating the industrialisation experience during the last 50 years, it is important to
take into account the overall policy framework and performance of the economy. Also,
while assessing the possibilities of sustaining and accelerating industrial growth, the
possible performance of the economy as well as India’s obligations under the WTO
regime have to be examined.
Table 2 presents the growth rates of industrial production. It can be observed that the
trend growth rate has been increasing from about 5 per cent during the 1970s to 7 per
cent during the second half of 1980s and 1990s.
Table 3 presents the trend rates of growth of the industrial sector during two time
periods, 1970 to 1985 and 1986 to 2000. These two periods represent a regulated and
liberal policy regime. The trend clearly points out an increase in the growth from the
first to the second period.

12
Table 2: Growth Rates of Industrial Production (Per Cent)
1976-80 1981-85 1986-90 1991-95 1996-00
Based on 5 year moving average
Based on observed data
5.28
1.34
5.66
6.21
7.11
7.59
6.25
5.47
7.10
7.05
Source: Pandit and Mahanty, 2001.
Table 3: Trend Rates of Growth (Per Cent)
Period Industry
1970 – 85 4.76
1986 – 00 6.52
1970 – 00 5.81
Table 4: Growth in Value-added of Select Industries
Industries 1980s 1990s
Textiles 5.3 [32.76] 8.0[26.15]
Leather Products 5.6[1.4] 8.3[1.13]
Rubber, Plastics etc 15.2[3.22] 5.5[6.22]
Chemical Products 10.6[9.18] 9.0[11.84]
Basic Metals 6.0[7.62] 5.8[6.43]
Metal Products 5.9[5.15] 5.6[4.31]
Machinery& Equipment 6.9[5.04] 9.4[7.78]
Transport Equipment 7.1[6.92] 9.1[6.45]
All Manufacturing 7.8 7.1
Note: Figures within parentheses are industry share in value-added in 1980-81 and 1990-91
Source: Srivastava [2000]
Changing pattern of growth of different sub-sectors within the broad manufacturing
sector is presented in Table 4. It can be observed from the table that while traditional

13
industries like textiles, leather products and transport equipment shows an increasing
trend in the 1990s when compared to the 1980s, chemical products, rubber and plastics
and metals show a decline in the 1990s when compared to the 1980s. This gradual shift
in the focus of industrial growth may have some serious implications for environment
quality.
As the experience of developed economy show, productivity growth is a key feature of
economic development. For an analysis of productivity growth, we need to know not
only the trends but also whether the observed growth is the result of an increase in
resource base size or improvement in resource use efficiency. Since Indian economy is
known for its resource limitations, productivity growth from resource use efficiency is
crucial for sustainable economic growth. It is in this context, productivity growth
(productivity is a relatively simple concept: it is the relationship between output and
inputs. It can be considered in terms of either partial factor productivity or total factor
productivity) assumes policy significance.

14
Chart 2: Sectoral TFPG Estimates for Indian Economy
Source: Mukherjee, R., M. Chattopadhyay, and C. Neogi, 2000.
As one might expect, there were large variations among sectors in the rate of growth in
TFP. The manufacturing sector witnessed a faster growth in productivity compared to
other sectors. Agriculture sector also shows a significant increase in productivity. Other
activities including services and public administration showed a relatively slow growth in
productivity (see Chart 2).
Few attempts have been made to examine the impact of economic reforms on total
factor productivity in Indian industries.7 The results of these estimates are inconclusive.
At best it may be pointed out that there could be large variation in productivity
performance in the Industrial sub-sectors between the pre and post-reform period.
7 Refer Das (2000) for a review of all these studies.
Trends in Productivity in Selected Sectors
0
50
100
150
200
250
300
350
400
1950 –51 1954 – 55 1958 – 59 1962 – 63 1966 – 67 1970 – 71 1974 – 75 1978 – 79 1982 – 83 1986 – 87 1990 – 91 1994 – 95
1950
-51=
100
Agr. Manuf. + mining Others

15
Krishna and Mitra [1998] have also observed statistically significant increase in
productivity growth in four industry groups chosen by them. Das (2000) also reports
mixed trend for productivity performance in Indian manufacturing. For the
manufacturing sector in total, the total factor productivity [TFPG] is around 1.81 per
cent per annum for the period 1980-95. Comparison of different industries have shown
that TFP growth rates are either negative or in the range of 0 to 2 per cent range. His
results indicate that trade liberalisation, particularly the reduction of the non-tariff
barriers, leads to improvements in productivity growth through increasing exposure to
competition, especially in the intermediate goods industries.
2.3 Building Technological Capabilities
Technological capabilities comprise a broad range of effort that every enterprise must
itself undertake in order to access, implement, absorb and build upon the knowledge
required in production. Since technology cannot simply be transferred like a physical
product, nor can purchases of blueprints or patents give ready made technological
upgradation, firms in a developing country like India need to develop capabilities to
acquire and absorb these new technologies from abroad [Kumar and Siddharthan, 1997].
However, firms operating in a “protected” market may not have had incentives to acquire
these capabilities. Therefore, there would be large-scale variation between firms within an
industry as well as across industries in efforts to build technological capabilities. Simple
comparisons of R & D intensities reveal large variation across industries, although the
intensity itself is very low for most industries. Evidence of promoting local technological
efforts to build a National System of Innovation is hard to find in India. Most studies have
shown that indeginisation requirements, which the Government policy has been insisting

16
upon, although has facilitated technological learning, dampened the international
competitive capabilities by limiting the direction of exports to those countries that have
similar market and resource conditions. This, in turn, could also result in low and
differential competitive capabilities. With liberalisation and the resultant increased FDI
inflow, there is a continual flow of technology. One could witness productivity
improvements through spillover of foreign direct investment. However, spillover varies
between industries and indicates the possibility to increase with the level of local
capability and competition. Therefore, any amount of policy effort to promote technology
transfer may not always produce the intended results. At best, requirements may secure
diffusion of a large share of a smaller technology stock. Alternative policies, such as
support to education and competition in the domestic markets may, on the other hand,
increase both the inflow of technology and the absorptive capacity of domestic firms.
Therefore, host country governments have limited possibilities to influence the
multinationals in their choice of production location, choice of techniques, etc. However,
much of it depends on the performance of host country industries. Moreover, MNCs can
also be lured to undertake R & D efforts in host countries with the advantage of cheap
scientifically and technically qualified manpower.
Trends in R & D intensities [R & D expenditure as a ratio of Sales Ratio] for select
industry groups are given in the following table. It appears that although the R & D
intensity of industrial sector in total shows only a marginal decline during the last 16 years,
there are large differences between different industrial sub-sectors. Transportation and
Telecommunication were the only sectors where R & D intensity seems to have increased
marginally. In all other cases, it has actually declined in the post liberalisation period.

17
This could be because during the years immediately after economic reforms, most
industries experienced large inflow of FDI and transfer of technology from the parent to
the affiliates. The industrial sector experienced technological paradigm shift and as a
result, dependency on imports of technology was more than in-house technological efforts.
Table 5: Ratio of R & D to Sales in Select Industries
Industry 1980-83 1988-91 1994-95
Chemicals 0.95 0.69 0.65
Textiles 0.45 0.25 0.26
Paper & Pulp 0.49 0.23 0.12
Sugar 0.44 0.77 0.47
Food processing 0.29 4.25 1.2
Glass 1.11 0.51 0.5
Transportation 1.07 0.65 1.09
Telecommunications 1.86 1.23 1.96
Machine Tools 3.92 1.37 1.67
Electrical &
Electronics
0.80 0.94 0.78
All Industries 0.74 0.73 0.70
Source: Basant, 2000.
2.4 FDI and Shifts in Technological Paradigm
Liberalisation of economic policies and the outward orientation introduced since 1991 has
brought about a dramatic change in Indian industries. These policy measures considerably
transformed the environment in which the industrial firms had been operating. As a
consequence, most industries witnessed the entry of new firms involving foreign equity
and adoption of strategies by the already existing firms to introduce technological change
and improve their performance. The new players brought in modern engineering, efficient
processes and effective shop-floor layouts. The new manufacturing strategies include
breaking up of the plant into modules and cells, reduce the complexity of purchasing

18
logistics, reduction of inventories and product complexity, and creation of simpler
processes by encouraging flexibility and teamwork. Manufacturing activity in many
industries also makes extensive use of CAD/CAM [computer-aided designs and
computer-aided management] in their plants. Moreover, the materials used in most
industries have also undergone a change from traditional steel and cast iron to aluminum
and thermoplastics. Some of the existing industries have oriented their systems by
replacing the batch system by work flow, organising the production in product modules
and by keeping the product-mix flexible in order to save time, reduce cost and increase
quality. The new joint ventures, it appears, are becoming catalysts to activate the
capabilities of the existing plants in areas of cost control and product development. As a
result, the policy changes to introduce market-induced efficiency have had far reaching
implications for the nature and pattern of industrialisation.
Table 6: Sectoral Distribution of Stock of FDI in India
Industry Group FDI Stock as in
March 1980
FDI Stock as in
March 1990
Approvals
1991-97
I. Plantation and Horticulture 4.1 9.5 0.33
II. Mining 0.8 0.3 1.06
III. Petroleum and Power 3.9 0.1 28.91
IV. Manufacturing 86.9 84.9 37.18
Of which
Food and Beverages 4.2 6.0 5.17
Textiles 3.4 3.4 1.62
Machinery and Machine Tools 7.6 13.1 2.24
Transport Equipment 5.5 10.4 4.84
Metal and Metal Products 12.7 5.2 6.0
Electrical and Electronics 10.4 10.9 5.44
Chemical and Allied Products 32.3 28.4 6.88
Miscellaneous Manufacturing 10.7 7.5 6.01
V. Services [Mostly Infrastructure] 4.1 5.2 31.31
Source: Kumar, 1998.

19
From the above given table, it is evident that FDI flow into the Indian economy has
undergone substantial change during the last two decades. Bulk of the flow is going to
the industrial sector [broadly defined to take into account the infrastructure industries
also]. There appear to be a dramatic change in the share of many industrial sub-sectors:
namely, chemical and allied products, metal and metal products and textiles showing a
declining trend and petroleum and power and infrastructure industries [mostly
telecommunications] showing an increasing trend.
3. Industrialisation and Environmental Quality
3.1 Policy Towards Environmental Protection
It is widely believed that environmental protection is presenting a fundamental challenge
in the face of the nation’s desire to industrialize faster. Although India’s response to
environmental problems dates back to 1972 when the government established a National
Committee on Environmental Planning and Coordination [NCEPC], it hardly had any
meaningful impact on the polluters. NCEPC was replaced by a National Committee on
Environmental Planning [NCEP] in 1981 and it was authorised to prepare an annual ‘state
of the environment’ report. Therefore, governmental efforts for air and water pollution
management could be traced only to the list of policies during the last two decades:
National Water Policy 1987; National Conservation Strategy and Policy Statement on
Environment and Development, 1992; and Policy Statement for Abatement of Pollution,
1992. The strategy and policy statements prescribe command and control, technological
measures, zoning, fiscal incentives, and use of economic instruments as mechanisms for
air and water pollution control. That is the approach to control pollution in India is to use
regulatory instruments along with systems for monitoring the prescribed standards to

20
achieve the government’s policy goals. Standards for ambient and point source
emissions/discharges are set by various acts of the government and compliance is
mandatory. There are provisions for penalties as given in these acts. The Central and
State Pollution Control Boards monitor all these.8
Despite the aforementioned legislation and policy measures adopted by the government,
air and water pollution remains a major concern in India. The very poor quality of air and
water in many parts of the country suggest that these policies have not worked too well. A
great deal of effort is needed to improve the enforcement mechanism to ensure that the
policies drawn up for the control of air and water pollution are implemented both in letter
and spirit. Also, as experience in developed countries has shown, firms react to popular
pressure. In order to generate such pressure, citizens should be given the right to
information and effluent quality measurements of all firms should be publicly available.
3.2 Industry Environment Linkages
In this section, we analyse the impact of industrialisation on environmental quality in
terms of India’s past as well as that of neighboring countries. Industrialisation is likely
to affect environment in many ways. Polluting the atmosphere, especially in terms of
air and water quality has been one of the most important negative externality of
industrial development. This paper analyses the impact of recent industrial
development on air and water pollution.
8 Detailed outline of the policies could be found in Parikh et al (2000) and Palanivel (2001).

21
“Air pollution could be defined as the presence in the atmosphere of one or more
contaminants in such quantities and for such duration as is injurious, or tends to be
injurious, to human health or welfare, animal or plant life, or property or would
unreasonably interfere with the enjoyment of life or property” [TERI, 1998]. Air
pollution has been aggravated by, among others, industrialisation, increasing traffic,
and higher levels of energy consumption. The major pollutants are particulate matters,
sulphur dioxide (SO2), nitrogen oxides (NO2), Carbon monoxide (CO2), and
hydrocarbons (HC). Of all these air pollution indicators, the present study would
examine changes with respect to Carbon monoxide (CO2) for which a time series data
has been made available by WDR 1999. This is not to argue that other forms of
pollution are unimportant. They are indeed, equally, if not more important than CO2.9
Currently, annual ambient air quality data are available for only three pollutants,
namely SPM, SO2, and NO2 and that also for only two years, 1993 and 1994. An
analysis carried out by TERI (1998) indicates that at majority of the locations in
residential and industrial areas, the air quality standards are violated with respect to
SPM. However, in general, SO2 and NO2 levels in India are within the prescribed
limits. The present study would, therefore, focus largely on Carbon monoxide
emissions.
CO2 is one of the most widely distributed of all air pollutants-global emissions
probably exceed the combined emissions of all other major air pollutants. The most
important effect of carbon monoxide emission is that it deprives tissues of oxygen and
9 Efforts are being made to collect time series data on SPM, SO, NO, and HC in order to test EKC with
respect to these indicators as well.

22
people with cardio-respiratory diseases turn out very sensitive to these changes.
Although air pollution is considered to be more of a localized problem, the analysis of
causal factors responsible for air pollution at the national level does yield some insights.
Table 7: Annual Average Rate of Change in Carbon Monoxide [CO2] (in Per Cent
Terms)
Environment
Indicator
Country 1981-90 1991-96 1981-96
CO2 kg per $ of
GDP
India 0.98 1.07 1.02
China -3.85 -5.23 -4.37
Indonesia -0.31 -0.72 -0.46
CO2 kgppp
India -3.04 -1.35 -2.40
China -7.75 -7.50 -7.65
Indonesia -4.25 -3.07 -3.81
CO2
India 6.89 6.73 6.83
China 5.03 5.79 5.31
Indonesia 6.08 7.03 6.44
CO2 per capita
India 4.65 4.84 4.72
China 3.51 4.59 3.92
Indonesia 4.15 5.25 4.56
Source: Authors calculation on the basis of data provided by WDR 1999.
Table 8 provides a comparative picture of India in terms of energy efficiency. It can be
noticed that although India’s energy performance is increasing at the rate of about 1.74-
per cent per annum, it is far from being satisfactory when compared to what China has
achieved. The rate of growth in energy efficiency has actually declined marginally
during the post when compared to the pre reform period. Although there are large-
scale variations in energy consumption between different industrial sector [Chakraborty

23
and Mukhopadhyaya, 2000], this study has pointed out that some of the industries have
become very efficient with respect to energy utilisation during the post reform period.
When one compares the rate of change in commercial energy consumption, India seems
to be comparable to that of both China as well as Indonesia. It is heartening to note that
the rate of growth in commercial energy consumption has actually declined more for
India when compared to China and Indonesia [for whom it has actually increased].
This decline in the commercial energy consumption would have serious positive impact
on environmental quality, especially the carbon emissions.
Table 8: Annual Average Rate of Change in Energy Consumption
Environment
Indicators
Country 1981-1990 1991-1996 1981-1996
Commercial Energy
Consumption
India 4.17 2.75 3.64
China 3.94 3.56 3.80
Indonesia 2.87 4.64 3.53
GDP Per Unit of
Energy
Consumption
India 1.75 1.72 1.74
China 5.25 7.15 5.96
Indonesia 1.18 2.65 1.73
Source: Authors calculation on the basis of data provided by WDR 1999.
Sustainable water use has quantitative and qualitative dimensions. While the first may
imply a cutback on magnitude of water use resulting in reduced production in the
absence of improved technology of water use, the second implies that the nature of
water as a flow and of water bodies as stores of water be maintained intact. India’s
water resources contain 113 river basins, of which 14 are major, 44 are medium and the

24
remaining 55 are minor. The fourteen major river basins account for 83 per cent of the
total area of the basins, contribute 85 per cent of the total surface flow, and house 80
per cent of the population served by the basins. The major river basins are those of
Brahmaputra, Ganga, Indus, Godavari, Krishna, Mahanadi, Narmada, Cauvery,
Brahmani, Tapti, Mahi, Subarnarekha, Pennar, and Sabarmati. The quality of river
water is monitored at 480 stations under different programmes such as MINARS
[monitoring of Indian national aquatic resources], GEMS [global environmental
monitoring systems], and GAP [ganga action plan]. A number of physical, chemical,
biological and bacteriological parameters are being measured under the programme, but
the important ones are BOD [biochemical oxygen demand], DO [dissolved oxygen],
and TC [total coliform count]. The sources of pollution are many and varied. This
study examines the role of industry in water pollution.
Data on pollution load in terms of BOD at all India reveal that as in 1995-96, the share
of industry BOD in total BOD is about 17.5 per cent as against the urban BOD which
constitutes about 82.5 per cent. In absolute terms, industry BOD is 751.4 thousand tons
when compared to 3538.79 thousand tons of urban in a total of 4290.17 thousand tons.
Chopra and Goldar (2000) have calculated the pollution load ratio R [where R =
BOD/Surface water available for non-agricultural sectors] to be 9.53 as in 1995-96.
There is large-scale variation between different States in India with respect to BOD.
Among different industrial sectors, water pollution is concentrated within a few
industrial sub-sectors mainly in the form of toxic wastes and organic pollutants. Out of
the total pollution contributed by industrial sub-sector, 40-45 per cent of the total

25
pollutants can be traced to the processing of industrial chemicals and nearly 40 per cent
of the total organic pollution to the food products industry alone. Food products and
agro-based industries together contribute 65-70 per cent of the total industrial
wastewater in terms of organic load. According to CPCB (1994) most of the defaulting
industries to operate without adequate pollution control facilities are mainly sugar mills,
distilleries, leather processing units, and thermal power stations. Among these it is the
small-scale sector, which lack the treatment facilities the most. The annual average rate
of change in water pollution as well as the share of different industries in Water
pollution is given in the following tables.
Table 9: Annual Average Rate of Change Per Cent in Water Pollution
[All India in Terms of BOD]
Indicator 1980 to 1990 1991-1996 1980-1996
BOD per day
India 0.0019 2.58 0.97
China 8.07 0.87 5.37
Indonesia 9.43 6.73 8.42
BOD per day per
worker
India -0.45 -0.83 -0.59
China 0.05 0.00 0.03
Indonesia -1.41 -1.75 -1.54
Source: Authors calculation on the basis of WDR 1999.
Table 10: Industrial Distribution of Water Pollution [BOD] (Per Cent Share)
Industry/Time 1980 1985 1990 1996
Chemical 5.98 7.48 7.29 8.23
Clay & Glass 0.18 0.25 0.22 0.21
Food 53.85 47.52 50.92 51.14
Metal 14.10 16.58 15.32 14.47
Paper & Pulp 7.57 8.76 7.96 7.92
Textiles 14.08 14.44 13.18 12.54
Wood 0.38 0.40 0.32 0.29
Others 3.85 4.57 4.79 5.20
Source: WDR, 1999.

26
From Table 10, it can be observed that the share of industries in water pollution is
changing over the period 1980 to 1996. Chemical industries appear to be an important
candidate for water pollution monitoring. Although the share of Food is the maximum,
there are signs of decline in this sector. Another important pollutant, Textiles is also
showing a declining trend. Increase in the share of Chemicals could also be because
the composition of industrial output has changed from metal and metal based to
chemical and chemical based and also to micro electronic based. Such a trend was
reported even during the 1980s [Kelkar and Kumar (1990)].
The Central Pollution Control Board [CPCB] identified a total of 1551 medium and
large industrial units in the country under the seventeen highly polluting industrial
sectors. Of these about 77 per cent are predominantly water polluting and 15 per cent
are predominantly air polluting, and the remaining 8 per cent are both air and water
polluting industries. Annual progress in the implementation of pollution control
measures in the 17 categories of highly polluting industries is presented in the
Economic Survey of the India [2000-01]. According to the CPCB, as on 30th
September 2000 out of a total of 1,551 large and medium industries identified in 1992
in the 17 categories of highly polluting industries, 1,326 industries have installed the
requisite pollution control facilities to comply with the prescribed environmental
standards. 168 industries have closed down and only 57 industries are yet to install the
necessary pollution control facilities.
With respect to water pollution, the Ministry of Environment and Forests in
coordination with the CPCB identified 851 industries along the major rivers and lakes

27
in the country which were found discharging their untreated or partially treated
effluents in the fresh water bodies. As on 30 September 2000 596 units were found to
comply with prescribed standards and another 232 units have been closed. Only 23
units have not installed the requisite pollution control facilities.
In sum, it could be stated that economic reforms carried out since 1991 has resulted in
large inflow of foreign capital and shifts in technological paradigms. Shifts in
technological paradigm in most industries also represent changing input requirements. As
a result any attempt to discuss the sustainability of industrial growth should focus on the
implications of the use of these resources by the industrial sector in terms of domestic
production capabilities. Evidence in India suggests that not only the material used in
industrial production has undergone drastic change during the recent period, but also the
industrial output has become more import intensive. The industrial sector appears to have
started using energy saving technologies. These factors to-gether point to certain issues of
sustainability. While the former would mean some implications for balance of payments,
the latter poses serious questions about channeling investment to power generation and the
resultant pollution aspects.
Secondly, increased competition and FDI inflow in a more liberal regime has also
contributed to improving productive efficiency of most industrial sectors. Increased
industrial output could be sustained either by maintaining the increased rate of investment
or by improving the efficiency of existing capital and labour. Developing countries,
during their initial phase of liberalisation, are more likely to depend on the former for
sustaining the industrial growth. What are the possibilities for maintaining domestic and

28
foreign investments in Indian industries, therefore, assumes considerable importance in
the sustainability analysis.
Thirdly, there appear to be serious environmental consequences of the new industrial
output and a careful examination of the effectiveness of new technology and policy
measures in facilitating green industrial output is the need of the hour.
4. Analytical Framework, Data and Methodology
The analytical framework used in examining the link between industrialisation and
environmental quality is basically drawn from the literature on Environmental Kuznets
Curve [EKC]. The framework is based on the assumption that at the beginning of a
growth path in a country increase in GDP corresponds with high environmental
degradation. Environmentally friendly technologies are not yet accessible and the
awareness of environmental problem is low. Environmental degradation increases with
income up to a certain point beyond which environmental quality is enhanced by higher
GDP per capita, implying an inverted U-shaped relationship between these two
variables. The literature identifies many reasons for an inverted U-shaped relationship
including (I) structural change, (ii) technology, (iii) trade, (iv) migration, etc.10
In the context of industrialisation, following Lopez (1994) it could be argued that when
producers’ free ride on the environment or pay fixed pollution prices, growth results
inescapably in higher pollution levels. When producers pay the full marginal social
10
Refer Panayotou (2000) for a detailed review.

29
cost of pollution they generate, the pollution-income relationship depends on the
properties of technology and of preferences. With homothetic preferences pollution
levels still increase monotonically with income but with non-homothetic preferences,
the faster the marginal utility declines with consumption levels and the higher the
elasticity of substitution between pollution and other inputs, the less pollution will
increase with output growth. Empirically plausible values for these two parameters
result in an inverted U-shaped relationship between pollution and income.
Although most of the empirical testing of ‘inverted U’ movement of pollution with the
growth of per capita income for a large number of countries was carried out during the
mid 1990s, some of the earlier studies also raised the theoretical possibility of an
‘inverted U’ shaped EKC [Beckerman 1972, Simon 1977, 1981]. Lack of reliable data
on pollution prevented any further work in this area but with the advent of Global
Environmental Monitoring System (GEMS) on air and water, the Toxic Release
Inventory (TRI) etc., empirical investigation on EKC started in 1990s at a larger scale
[Grossman and Krueger, 1995, Shafik and Bandyopadhyay, 1992, Selden and Song,
1994, Torras and Boyce 1998, Kaufmann, et.al 1998, Carson et. al 1997, Ravallion,
Heil and Jalan 2000]. Almost every study has tried to analyse the relationship of a
select pollutant e.g. CO2, SPM, NOx, Sox, BOD, etc and the growth of per capita
income for various developed and/or a cross section of developed and developing
countries. As mentioned in Section 1, most of the studies following EKC have tested
and reported many plausible relationship between economic growth and the
environment, including the possibility of no relationship also, in examining this inter-
relationship.

30
EKC is based on the argument that continuous economic growth induces environmental
improvement through structural and technological change (Grossman 1993, Seldon and
Song, 1994). EKC runs across on the argument that negative environmental impact of
the greater output will be outweighed by the technological (read environmental
friendly) advancement in production mechanism. The implication of this theory for
industrialisation is through the following ways:
i) Growth in output will favour the shift from pollution intensive to non-pollution
intensive industries
ii) Energy consumption per unit of output will decline and hence less pollution.
It is now well established that, in a developing country like India, share of FDI in total
industrial output increases with the industrial growth. Technological improvement in
industries through FDI and removal of institutional barriers and increased
competitiveness accelerate productivity which imply lesser use of capital and energy
for the same output level or greater output from the same level of capital investment
and energy consumption.
Moreover, as the analysis presented in the previous section has revealed, there has been
a change in the industrial composition of FDI, especially in the post reform period and
large inflow of FDI and the resultant impact on competitiveness has encouraged
technological paradigm shifts in most manufacturing industries. Technological
paradigm shifts assume considerable importance because, during the pre-reform period,
industrial establishments were only allowed to traverse on a given technology and any

31
shift in the paradigm required prior approval of the government [and fresh license].11
As a result, any attempt to capture the industrialisation-environment linkage need to
take into account the role of trade, FDI and technology. Moreover, a large body of
empirical analysis dealing with air quality has also tested “race to the bottom”
hypotheses.12
In the race to the bottom world, decent environment standards impose
high costs on polluters in high-income countries. To remain competitive, these firms
relocate to low-income countries whose government and people are desperate for
investment.
Statistical data for the analysis presented in this section is largely drawn from the
World Development Report 1999. Definition of the variables used in the analysis is
given in the appendix. The empirical exercise is carried out in two stages: firstly an
attempt has been made to test for possible relationship between air and water pollutant
with industrial value added per capita and secondly, the study examines the role of
economic reforms, trade and technology in determining environmental quality
[represented by CO2 and BOD].
The reduced form equation that most studies testing EKC have used takes the form:
The simplest model specification [Shafik and Bandyopadhyay 1992, Hettige, Lucas and
Wheeler 1992, Shafik 1994 and Rothman 1998] shows a relationship between an
environmental indicator (E) and the income per capita (Y):
11
For a discussion on the impact of liberalisation on shifts in technological paradigm refer Narayanan
(1998). 12
See Wheeler (2000) for a review of these studies and recent empirical testing of the “race to the
bottom” model.

32
E it = o + 1 Y it + 2 Y2it + it
Where E = environment indicator, Y = income per capita, is the error term and ’s are
the parameters to be estimated.
To this basic model, Panayotou (1997) has included Population (P), Growth (g), and
Policy (p). Cropper and Griffiths (1994), Cole, Rayner, and Bates (1997), Suri and
Chapman (1998), Kaufmann, Davidsdottir, Garnham, and Pauly (1998) have
introduced variables related to trade in the basic environment-income functional form.
Ratnayake and Kim (1999) attempted to explain air and water pollution in terms of
lagged average of incomes, strictness of authority, registered vehicles per capita, apart
from Gross regional domestic product per capita. Regional, rather than total GDP was
considered because they estimated the regression for a pooled data for different cities in
South Korea.
The present study also begins with the functional form widely used in the literature.
However, since the focus is to explain the link between industrialisation and
environmental quality, the study uses industrial value added per capita, rather than GDP
per capita. Moreover, the study also analyses the role of economic reforms, technology
and trade in explaining air and water pollution at the all India level. Further, since
liberalisation in India witnessed large inflow of foreign capital, an attempt would also
be made to examine the role played by foreign investment in determining air and water
quality. The regression equation estimated, therefore, takes the form:
E t = o + 1 I t + 2 I2t + 3 Tr + 4 Th + 5 FDI + 6 DR + it
Where E = environment quality [represented by CO2 and BOD]

33
Tr = Trade in goods as a share of goods GDP
Th = Technological efforts [represented by GDP per unit of energy consumed in the
case of CO2 equation and R & D intensity in the case of BOD]
FDI = foreign direct investment and
DR = dummy variable having 0 and 1 observations for the period before 1991 and after
1991 respectively.
The results of the model estimation are discussed in the next section.
5. Empirical Results
This section begins with an examination of the relationship between air quality and
industrialisation [Figures are presented in the appendix]. An inverted U-shaped
relationship between industrial value added per capita and the indicator of air quality is
displayed by carbon monoxide. It shows that at lower levels of industrial value added
per capita, air pollution rises and then after reaching a peak, gradually declines when
the value added increases. This relationship between CO2 and industrial value added
per capita is statistically significant at 1- per cent level in a two-tailed test. The
estimated turning point for the inverted U shaped curve appear to be around industrial
value added per capita US $ 85 [at constant1995 prices], which India achieved in the
year 1995.
However, in the case of water pollution, the reverse seems to be taking place. The
curve takes a U shaped relationship showing that at both very low as well as very high
levels of industrial value added per capita, BOD tends to be high. That is, as the

34
industrial value added increases, the water pollution level goes down and after a certain
point the additional industrial output is leading to increased water pollution. This curve
estimation is also significant at 1- per cent level in a two-tailed test. Generally the
turning points for water quality indicators occur at relatively lower levels of income
than those for air pollution. The turning point for upward sloping appears to be at
industrial value added per capita US $ 65 [at constant 1995 prices].
Earlier studies dealing with a particular country case [Ratnayake and Kim 1999 (for
South Korea) and Vincent 1997 (for Malaysia)] also tested EKC and report mixed
results, but regressed different pollution indicators on income per capita. In the context
of a developing country like India, it is very important to note that the relationships
between pollution emission and industrial value added should only be taken as
indicatory. It is possible to attribute the inverted U-shaped relationship between carbon
emissions and industrial value added to the observed increase in energy efficiency.
Further, from the observed industrial distribution of FDI one could support the
contention that the new industrial output is much less pollution intensive than the older
ones. However, it is not possible to feel complacent, especially because, as has been
observed in section 3, pollution emissions in absolute terms appear to have increased in
India during the post reform period when compared to the 1980s. Much of this increase
in pollution [CO2] could be attributed to the growth of transport sector.
With respect to water pollution, it must be observed that chemical industry, which has
grown at a high rate during the last two decades, could be the major factor. It could be
argued that most industrial establishments do not fulfill the effluent treatment

35
considerations. It is quite likely that these industries are actually not in a position to
invest the amount of money required for water pollution abatement. Murti (1997)
estimated the capital stock required for water pollution abatement in Indian industry in
a hypothetical situation where all polluting industries would comply with standards.
The total capital stock is estimated at Rs.59,179 million. Assuming a discount rate of
15 per cent and lifetime of fifteen years gives a capital recovery of factor of 0.171.
Using this, the total annualized capital cost required for water pollution abatement in
major water polluting industries is Rs.10,120 million. Total annual investment needed
for water pollution abatement across industries [inclusive of wage bill, material cost,
and power cost] is estimated at Rs.14,089 million which is about 1.17 per cent of the
annual turnover of all water polluting industries. Can the policy measures adopted
direct the industries to carry out this is a big question that needs to be answered.
Further, it may be pointed out that industrial output may not be the only factor
explaining CO2 and BOD, and therefore, it is important to examine the role of industrial
value added in the presence of other explanatory variables, especially factors capturing
technological efforts, foreign direct investment and trade orientation. The results of
least squares estimation are presented in the following two tables.
In both tables, three columns present the estimated equations. The difference between
the equations is that the basic model takes into account the role of industrial value
added along with a dummy variable to capture the effect of economic reforms. In the
subsequent equations, economic reform is captured by two specific factors: trade and
FDI. This is because, most significant changes in India, especially after the

36
implementation of economic reforms, have been with respect to trade and foreign
capital inflow. The third equation was estimated to check for the possible adverse
effect of multicollinearity. Variable capturing technological capability was dropped at
this stage because it had a very highly significant correlation with the trade variable.
Table 11: Determinants of Carbon Emissions
Dependent Variable LCO2
Variables Equation 1 Equation 2 Equation 3
Constant -4.037
(-4.949) -4.800
(-3.743) -5.319
(-4.269)
LIVAPC 4.142
(4.522) 5.020
(3.319) 5.962
(4.414)
LIVAPC2 -0.983
(-3.720) -1.262
(-2.766) -1.600
(-4.218)
Policy 0.0015
(2.224)
LTECH -1.001
(-2.254)
-0.732
(-1.269)
LFDI 0.00267
(0.406)
0.00629
(1.032)
LTRADE 0.106
(1.644)
0.135
(2.187)
R Sqr 0.931 0.922 0.911
R bar Sqr 0.908 0.887 0.881
D.W. 2.643 2.197 1.985
F 40.492 26.005 30.548
NOBS 17 17 17
Source: Authors’ calculation.
Note: Figures in parenthesis are t-values. Co-efficients in bold are significant at 1 per
cent level and those underlined are significant at 5 or 10 per cent level in two tailed test.
From the results presented in these two tables, it is evident that EKC holds true even in
the presence of other variables only in the case of carbon emissions. With respect to
BOD, the moment one introduces other explanatory variables, industrial value added
turns out insignificant. This could be because industrial waste, which is one of the

37
important factors contributing to water pollution, may be a more dominating factor
rather than industrial output by itself. This could also be due to the fact that BOD is
defined in terms of the amount of oxygen that bacteria in water will consume in
breading down waste.
Technological efforts appear to be an important factor in explaining pollution emissions.
In both CO2 as well as BOD, the variables used to capture technological efforts
emerged significant with a negative sign, indicating that greater the efforts are lesser
the pollution would be. Improvements in technological efforts, especially energy
saving and environmentally benign could also be attributed to the government policy on
pollution abatement introduced since 1993 and increasing presence of FDI with the
latest technological configuration.

38
Table 12: Determinants of Water Pollution
Dependent Variable: BOD
Variables Equation 1 Equation 2 Equation 3
Constant 12.037
(6.393) 6.183
(3.196) 8.335
(4.779)
LIVAPC -6.530
(-3.150)
-0.435
(-0.207)
-2.189
(1.511)
LIVAPC2 1.803
(3.161)
0.134
(0.234)
0.726
(1.387)
Policy 0.0337
(2.130)
LTECH -0.273
(-2.044)
LFDI 0.00895
(1.032)
LTRADE 0.228
(1.884)
0.407
(4.446)
R Sqr 0.811 0.928 0.899
R bar Sqr 0.767 0.895 0.875
D.W. 0.828 1.650 1.511
F 18.583 28.220 38.475
NOBS 17 17 17
Source: Authors’ calculation.
Note: Figures in parenthesis are t-values. Co-efficients in bold are significant at 1 per
cent level and those underlined are significant at 5 or 10 per cent level in two tailed test.
The policy dummy variable to capture the impact of economic reforms turned out
significant with a positive sign, indicating the possibility of an increasing trend in
pollution emission during the post reform period. Decomposing the policy effect into
trade and FDI, we find that the trade variable emerge significant with a positive sign.
This would imply that during the years immediately after reforms, trade is likely to
dominate, and in the process may also cause certain environmental damage. However,
over a period of time, especially after the countries start imposing legislation to regulate
unwarranted trade, the relationship might change. In the case of FDI the results do not
indicate “race to the bottom” world experience for India. FDI, although had a positive

39
sign in determining both CO2 as well as BOD, turned out insignificant. A more careful
analysis on the actual technology used by the FDIs in their Indian plants would provide
better insights.
6. Implications for Sustainable Industrialisation
The economic reforms since mid 1985 have helped Industry to accelerate its growth.
Industry grew at an annual average rate of about 4.76 per cent during 1970-71 to 1984-
85. In the late 1980s, its growth rate improved significantly, to reach an average of
over 7 per cent. This was the period when the first steps towards industrial and trade
reforms were introduced, and they clearly had favourable effects on industrial growth.
The growth rate declined to about 5-6 per cent in the early 1990s due to contractionary
fiscal and monetary policies adopted to address the BOP crisis in 1990-91. However,
the fresh reforms in the early 1990s helped growth to accelerate again little over to 7
per cent per year during the second half of 1990s. In fact, for three consecutive years,
1994-97, industry grew about 10 per cent per annum. This not only shows that Indian
industry has capacity to grow at about 10 per cent per year, but also reflects that
accelerating growth to 12 per cent is not impossible. We believe that the Industrial
sector is likely to grow at about 8 per cent per annum during the next 4 or 5 years even
at the current level of investment and resource efficiency. Certainly the rate could be
raised if India were able to raise its investment as well as efficiency levels. Pandit and
Mohanty (2001) have projected slightly more than 8 per cent growth rate for the
industrial sector during the next twenty years, taking into account the possibility of FDI
inflow in industry and infrastructure sectors. One clear point that emerges from their
study is that to achieve higher rates of industrial growth, we need to step up FDI inflow.

40
The real issue is whether Indian industry can sustain this higher growth over the long
run, as well as whether Industry could further accelerate growth to reach a double-digit
level, at least for some years when infrastructure bottlenecks have been substantially
reduced. In other words, we ask whether Indian industry has the necessary resources to
support this high growth target. Sustainability of growth hinges, among other things, on
robust saving and investment processes. It is well known that while the bulk of
domestic savings come from the household sector, the bulk of domestic investment is
undertaken by the private corporate and the public sectors [Table 11]. One feature of
the behaviour of the rate of saving is the steady decline of the saving rate in the public
sector since the mid 1970s. A slight reversal of this downward trend in the last few
years does not as yet appear to be permanent. On the other hand, the saving rates of the
private corporate sector as well as the household sector have both steadily increased the
former more vigorously.

41
Table 13: Average Rates of Savings and Investment (Per Cent of GDPMP)
Period Gross Domestic Saving Domestic Gross
Capital Formation
Households Corporate Public Total
1971 – 75 13.08 1.83 3.24 18.15 19.04
1976 – 80 16.81 1.71 4.97 23.50 22.93
1981 – 85 15.69 1.80 4.11 21.61 23.48
1986 – 90 18.25 2.29 2.65 23.19 25.91
1991 – 95 21.09 3.56 1.53 26.18 27.91
1996 – 99 21.75 4.51 2.33 28.59 30.26
Source: Pandit and Mohanty, 2001.
Further, while India has recognized the role of foreign direct investment (FDI), its
performance in attracting substantial capital inflows through this route still remains a
pipe dream. In the current global environment, China appears to be the only country
that will be able to sustain its record of mopping up huge FDI. Following China, this is
the most opportune time for India to gear its institutional and infrastructure systems to
realize at least $5 billion to $6 billion of FDI in the next few years in new projects, be it
in manufacturing or infrastructure areas. Further, India must create an atmosphere to
attract efficiency-seeking investments and increase the value added content of its
exports [Kumar and Siddharthan 1997]. It would be possible for India to do so by
increasing its resource advantage and undertaking administrative reforms that facilitate
a smooth flow of business and knowledge sharing.
There is large potential for improving the productivity of the industrial sector in general
and energy efficiency in particular. The recent experience has shown that technology
transfer through FDI has led to scope for improving productivity and energy efficiency.

42
Mukherjee et al (2001) point out that TFP of the industrial sector has increased from
0.75 per cent during the 1970s to 2.98 in the 1980s and to 3.07 in the 1990s. There is
large scope for improvement in the TFP levels. Similarly, with regard to the energy
there exists large potential to improve. As has been pointed out earlier, India is lagging
behind China in energy efficiency. If India is able to increase the output per unit of
energy consumption at the present Chinese level, there would be large saving potential
of crucial energy output and therefore it can be very useful in promoting sustained
industrial growth. Batra (2001) has pointed out that the oil intensity in the industrial
sector in India would decline from 0.023 [kg per 1000 rupees or 20 US $] in 1980 to
0.007 by 2045. Between 1980 and 2000, the oil intensity has declined from 0.023 to
0.013. Savings in energy consumption may put much less pressure on the energy
supply position. Moreover, if India implements strict environmental regulations, SPM
emissions and BOD loads will also be within the controlled emission norms for all
industrial units. Batra (2001) has pointed out that it will be possible for India to reduce
the current controlled emissions by at least 10 per cent, and by 2019 it is envisaged that
at least 20 per cent of the output will comply with these new norms. By 2047 the entire
production from all units will do so. It may, therefore, be argued that environment may
not pose serious problem in sustaining industrial growth. Adoption of energy efficient
technology in most industries may also lead to better environment.
Most recent estimates have shown that R & D expenditure in India has reached a level
of one per cent of the GDP. It is heartening to know that India has touched the one per
cent benchmark level after so many years of efforts. However, if it strives to make it to
at least 3 to 4 per cent of the GDP, and directing its’ R & D activities to complement

43
technology transfers, especially in the field of environmentally benign and energy
saving technology, it would go a long way to solve adverse effects on environment as
well as provide scope for greater international competitiveness. The state can also
encourage the establishment of joint R & D units by several enterprises in a given
industry to take advantage of economies of size in research [Siddharthan, 2001].
Last, but not the least, attention must also be focussed on using the openness to explore
foreign markets in order to sustain industrial growth. East Asian and the recent Chinese
experience have shown that there is great potential for the present day developing
countries to use trade to boost its industrialisation. Indeed, it needs to be pointed out
that much of the problems that the exporters in India face relate to delays in shipments
and corrupt bureaucracy. Infrastructure investments, especially to improve port
facilities would go a long way to boost Indian exports.
Summing up, these are trying times and to rise to the occasion, what we require is a
cohesive politico-techno- economic leadership response.
6. Summary and Conclusions
In examining the inter-relationship between industrialisation and environmental quality
and to provide a scenario for accelerating and sustaining higher growth rate for the
industrial sector in India, the study largely followed the analytical framework provided
by the Environmental Kuznets Curve [EKC]. However, since India moved from an
inward looking policy to a more open-economy approach since 1991, attempts were
also be made to examine the impact of economic reforms on this inter-relationship.

44
Further, the analysis presented in section 2 reveals that the acceleration in industrial
growth that India experienced during the last two decades has been largely contributed,
among others, by the nature and quantum of foreign direct investments [FDI] and the
resultant shifts in technological paradigm in which the industrial sector was operating
for a long time. The present study, therefore, has also taken into account the role of
technological factors in explaining the determinants of environmental quality.
This paper finds evidence to support an inverted U shaped relationship between
industrial value added per capita and carbon emissions. However, the relationship
turned out to be U shaped in the case of water pollution. Multiple regression analysis
indicates that, apart from industrial value added, trade, technology and economic
reforms also emerge significant in determining environmental quality.
Overall, the analysis points out a vital role for FDI in accelerating and sustaining
India’s industrial growth. Policy initiatives to attract efficiency seeking FDI, especially
in the manufacturing and the infrastructure sector would go a long way to place the
industrial sector on sustained growth path. Further, care also needs to be taken to
regulate the pattern of industrialisation, especially in terms of adapting energy saving
and environmentally benign technologies. Transparency in environmental management
system and capacity building in pollution control boards would also ensure that
environmental laws are effectively enforced. The sooner the State directs its’ policy
toward these pressing issues, the better would be the scenario for sustained industrial
growth.

45
References
Ahluwalia, Isher J. (1991): Productivity and Growth in Indian Manufacturing, Oxford
University Press, Delhi.
----------- (1985): Industrial Growth in India: Stagnation since the Mid-Sixties, Oxford
University Press, Delhi.
Basant, Rakesh (2000): “Corporate Response to Economic Reforms” in Nagesh Kumar
(ed.) Indian Economy under Reforms: An Assessment of Economic and Social
Impact, Bookwell, New Delhi, pp.45-92.
Batra, R. K. (2001) (ed.): Green India 2047: Directions, Innovations and Strategies for
Harnessing Action, Tata Energy Research Insitute, New Delhi.
Beckerman, W.B. (1972) Economic Development and the Environment : A False
Dilemma reprinted in Beckerman W.B. (1995) Growth, the Environment and the
Distribution of Incomes: Essays by a sceptical Optimist, Edward Elgar
Carson, R.T, Y.Jeon and D.R. Mccubbin (1997) ‘The relationship between air pollution
emissions and income : US data Environment and Development Economics 2
Chakraborty, D. and K. Mukhopadhyay (2000): “Economic Reforms and Energy
Consumption Changes in India – A Quantitative Analysis”, paper presented in a
Conference on Industrialization in a Reforming Economy: A Quantitative Assessment,
Delhi School of Economics, Delhi, December 20-22.
Chopra, Kanchan and Biswanath Goldar (2001): “Sustainable Development Framework
for India: The Case of Water Resources”, UNU/IAS, Project Report.
Cole, M.A., A.J. Rayner, and J.M. Bates (1997): The Environmental Kuznets Curve:
an Empirical Analysis.
Cropper, M. and C. Griffiiths (1994): “The Interaction of Population Growth and
Environmental Quality, Population Economics, no.84.
Das, Deb Kusum (2000): “Productivity Growth in Indian Manufacturing: Does Trade
Liberalization Matter?”, paper presented in Conference on “Industrialization in a
Reforming Economy-A Quantitative Assessment” at the Delhi School of Economics,
December 20-22.
Grossman, G. (1993): “Pollution and growth: what do we know?” in Goldin, I. and
Winters, L. (eds.) The Economics of Sustainable Development, Cambridge
University Press, Cambridge.
Grossman, G. and A. Krueger (1995): “Economic Growth and the Environment”,
Quarterly Journal of Economics, 110 (2), pp.353-77.

46
-------------- (1996): “The Inverted-U: what does it mean?” Environment and
Development Economics, 1, pp.119-22.
Kaufman, R.K., B. Davidsdottir, S. Garnham and P. Pauly (1998): “The determinants of
atmospheric SO2 concentrations: reconsidering the environmental Kuznets curve”,
Ecological Economics, 25, pp.209-20.
Kelkar, Vijay and Rajeev Kumar (1990): “Industrial Growth in the Eighties: Emerging
Policy Issues”, Economic and Political Weekly, January 27.
Krishna, K. L. (1999): “Industrial Growth and Diversification” in Uma Kapila (ed.)
Indian Economy Since Independence, Academic Foundation, New Delhi.
Krishna and Mitra (1998): “Trade Liberalisation, Market Discipline and Productivity
Growth: New Evidence from India”, Journal of Development Economics, 56, pp.447-62.
Kumar Nagesh (2000): “Economic Reforms and Their Macro-Economic Impact”,
Economic and Political Weekly, March 4, pp.803-12.
---------- (1998): “Liberalisation and Changing Patterns of Foreign Direct Investments:
Has India’s Relative Attractiveness as a Host of FDI Improved?”, Economic and Political
Weekly, vol. 33, No.22, May 30.
------- and N. S. Siddharthan (1997): Technology, Market Structure and
Internationalization, Routledge, New York and London.
Levine, R. and S.J. Zervos (1993): “What have we learned about policy and growth from
cross-country regressions”, American Economic Review, 83, no.2, pp.426-30.
Lopez, R. (1994): “The Environment as a Factor of Production: The Effects of Economic
Growth and Trade Liberalisation”, Journal of Environmental Economics and
Management, 27, pp.163-84.
Mukherjee, Robin, Manabendu Chattopadhyay and Chiranjib Neogi (2001): Sustainable
Development Framework for India: Productivity, Human Development and Basic Needs
in India, UNU/IAS Project Report.
Murty, M.N. (1997): Natural Resources Accounting: Measuring Environmentally
Adjusted Value Added with Illustrations from Indian Industry, Reported submitted to
IDRC, Canada.
Nagaraj, R. (1991): “Industrial Growth: Further Evidence and Towards an Explanation
and Issues”, Economic and Political Weekly, October 13.
Narayanan, K. (1998): “Technology Acquisition, De-regulation and Competitiveness: A
Study of the Indian Automobile Sector”, Research Policy, vol.27, no.2, pp.215-28.

47
Palanivel, T. (2001): “Sustainable Development Framework for India”, paper presented in
the 3rd
IRSA International Conference, Jakarta, Indonesia, March 20-21.
Panayotou, Theodore (2000): “Economic Growth and the Environment”, Center for
International Development at Harvard University Working Paper No.56, , Environment
and Development Paper No.4, July.
------------- (1997): “Demystifying the Environmental Kuznets Curve: Turning a Black
Box into a Policy Tool”, Environment and Development Economics.
------------(1995): “Environmental Degradation at Different Stages of Economic
Developoment”, Beyond Rio (The Environmental Crisis and Sustainable Livelihood in the
Third World).
------------ (1993): “Empirical Tests and Policy Analysis of Environmental Degradation at
Different Stages of Economic Development”, Working Paper WP238 Technology and
Employment Programme, Geneva: International Labor Office.
Pandit, V. and Mohanty (2001): “Sustainable Development Framework for India: Macro
Economic Forecasting”, UNU/IAS Project.
Parikh, Kirit, Jyoti Parikh and Tata L. Raghu Ram (1999): “Air and Water Quality
Management: New Initiatives Needed”, in Kirit S. Parikh (ed.) India Development
Report 1999-2000, Oxford University Press, New Delhi., pp.85-96.
Planning Commission (1950): “First Five Year Plan”, Planning Commission, Government
of India, New Delhi.
Ratyanake, Ravi and Woo-Young Kim (1999): “Economic Growth and The Environment
in High-Performing East Asian Countries: Lessons from South Korea”, Department of
Economics, University of Auckland.
Ravallion, M, Mark Heil and Jyotsana Jalan (2000) ‘Carbon emission and income
inequality’, Oxford Economic Papers, 52.
Roberts, Mark J. and James R. Tybout (1996): Industrial Evolution in Developing
Countries, Oxford University Press, New York.
Seldon, T. and Song, D. (1994) ‘Environmental quality and development: is there a
Kuznets Curve for air pollution emissions?’ Journal of Environmental Economics and
Management, 27.
Shafik, N. and S. Bandyopadhyay (1992): Economic Growth and Environmental
Quality: Time Series and Cross-Country Evidence, World bank, Washington D.C.
Siddharthan, N.S. (2001) “Globalisation and the Budget: Urgent need for Institutional
Reforms”, Economic and Political Weekly, March 17, pp.889-92.

48
------------ (1999): ” WTO and the Globalisation of Enterprises”, Economic and Political
Weekly, vol. 34, no.21, pp.1287-91.
Simon J.J. (1981) The Ultimate Resource, Princeton University Press
---------- (1977) The Economics of Population Growth, Princeton University Press
Srivastava, Vivek (2000): “Impact of India’s Economic Reforms on Industrial
Productivity, Efficiency and Competitiveness” Part I, National Council of Applied
Economic Research, New Delhi.
Srinivasan, T. N. (1994): “Foreign Trade Policies and India’s Development”, in T.N.
Srinivasan (ed.) Agriculture and Trade in India and China, ICEG, San Fransisco.
Suri, V. and D. Chapman (1998): “Economic Growth, trade and energy: Implications for
the Environmental Kuznets Curve”, Ecological Economics, 25, pp.195-208.
TERI (1998): Looking Back to Think Ahead: Green India 2047, Teri, New Delhi.
Torras, M and Boyce, J.K (1998) ‘ Income, Inequality and Pollution: A Reassessment
of the Environmental Kuznets Curve’, Ecological Economics, 25
Unruh, G.C. and W.R. Moomaw (1998): “An Alternative Analysis of Apparent EKC-
type Transitions”, Ecological Economics, 25, pp.221-29.
USITC (1997): The Dynamic Effects of Trade Liberalisation: An Empirical Analysis,
USITC Publication 3069, USITC, Washington.
Vincent (1997): “Testing for Environmental Kuznets Curves within a developing country”,
Environment and Developmental Economics, Vol.2, part 4, pp.417-33.
Wheeler, David (2000): “Racing to the Bottom? Foreign Investment and Air Quality in
Developing Countries”, Development Research Group, World Bank, November.

49
APPENDIX 1
Definitions
Industry shares of emissions of organic water pollutants refer to emissions from
manufacturing activities as defined by two-digit divisions of the International Standard
Industrial Classification (ISIC), revision 2: stone, ceramics, and glass (36). Emissions of
organic water pollutants are measured by biochemical oxygen demand, which refers to
the amount of oxygen that bacteria in water will consume in breaking down waste. This
is a standard water-treatment test for the presence of organic pollutants.
Emissions of organic water pollutants are measured by biochemical oxygen demand
[BOD], which refers to the amount of oxygen that bacteria in water will consume in
breaking down waste. This is a standard water-treatment test for the presence of organic
pollutants.
Emissions per worker are total emissions of organic water pollutants divided by the
number of industrial workers. Organic water pollutants are measured by biochemical
oxygen demand, which refers to the amount of oxygen that bacteria in water will
consume in breaking down waste. This is a standard water-treatment test for the
presence of organic pollutants.

50
GDP per unit of energy use is the U.S. dollar estimate of real GDP (at 1995 prices) per
kilogram of oil equivalent of commercial energy use. Commercial energy use refers to
apparent consumption, which is equal to indigenous production plus imports and stock
changes, minus exports and fuels supplied to ships and aircraft engaged in international
transportation. For more information, see WDI table 3.8.
Commercial energy use refers to apparent consumption, which is equal to indigenous
production plus imports and stock changes, minus exports and fuels supplied to ships
and aircraft engaged in international transportation.
Carbon dioxide emissions from industrial processes are those stemming from the
burning of fossil fuels and the manufacture of cement. They include contributions to the
carbon dioxide produced during consumption of solid, liquid, and gas fuels and gas
flaring.
Value added in manufacturing is the sum of gross output less the value of intermediate
inputs used in production for industries classified in ISIC major division 3. Chemicals
comprise ISIC groups 351 and 352.
Trade in goods as a share of goods GDP is the sum of merchandise exports and imports
divided by the current value of GDP in U.S. dollars after subtracting value added in
services.

51
APPENDIX 2
EKC BETWEEN CARBON EMISSIONS AND INDUSTRIAL
VALUE ADDED PER CAPITA
APPENDIX 2 EKC BETWEEN CARBON EMISSIONS AND INDUSTRIAL VALUE
ADDED PER CAPITA
CO222KG$N
IVAPCN
110 100 90 80 70 60 50 40
2.7
2.6
2.5
2.4
2.3
2.2
2.1
Observed
Linear
Quadratic
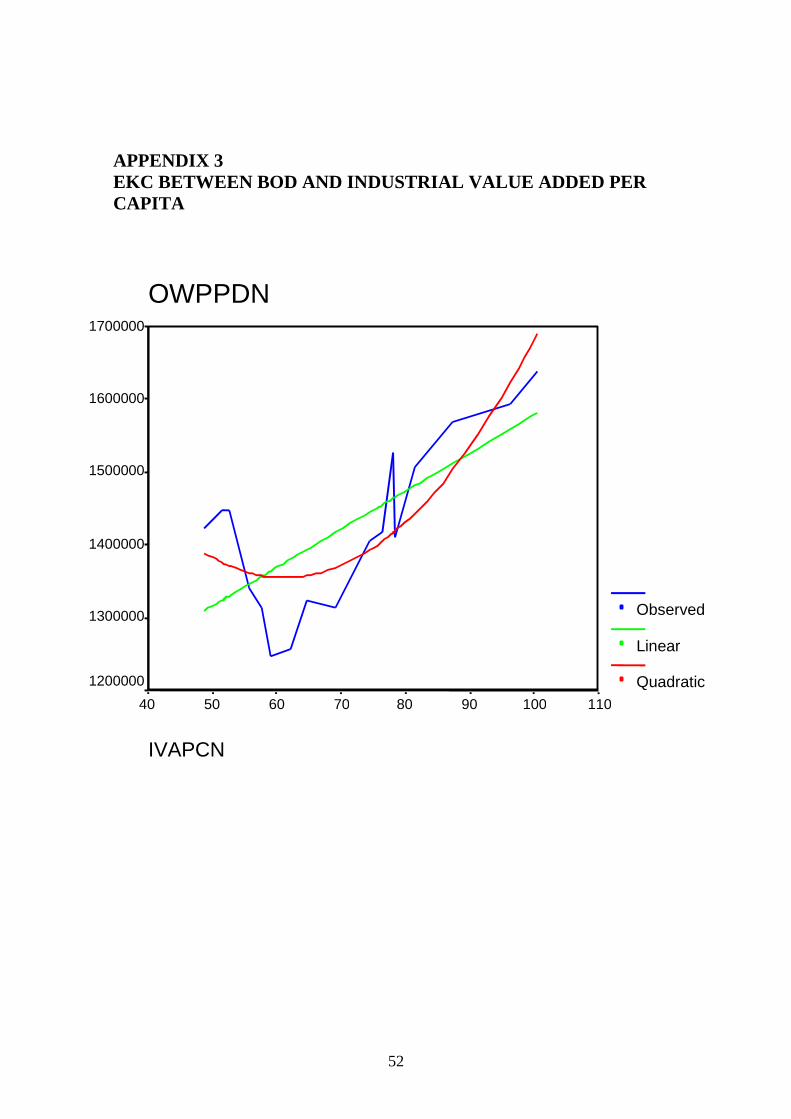
52
APPENDIX 3
EKC BETWEEN BOD AND INDUSTRIAL VALUE ADDED PER
CAPITA
OWPPDN
IVAPCN
110 100 90 80 70 60 50 40
1700000
1600000
1500000
1400000
1300000
1200000
Observed
Linear
Quadratic