Industrial Growth and Competitionsimonk/pdf/igc.pdf · Industrial Growth and Competition K. Simons,...
153
Industrial Growth and Competition K. Simons, 2003 1 Essential Course Notes EC2212 Industrial Growth and Competition The Role of Technology in Firm Success, Industry Evolution, and Regional and National Growth Kenneth L. Simons Date of this version: 12 Jan. 2003. Date of first version: Autumn 1996. Copyright ©1996-2003 by Kenneth L. Simons. All Rights Reserved.
Transcript of Industrial Growth and Competitionsimonk/pdf/igc.pdf · Industrial Growth and Competition K. Simons,...

Industrial Growth and Competition K. Simons, 2003
1
Essential Course NotesEC2212
Industrial Growth andCompetition
The Role of Technology in Firm Success, IndustryEvolution, and Regional and National Growth
Kenneth L. Simons
Date of this version: 12 Jan. 2003.Date of first version: Autumn 1996.
Copyright ©1996-2003 by Kenneth L. Simons.All Rights Reserved.
Industrial Growth and Competition K. Simons, 2003
2
Contents
Sections
Contents ......................................................................................................................2Sections ...............................................................................................................2Tables ..................................................................................................................5Figures.................................................................................................................5
Syllabus for EC2212........................................................................................................6
1. The Course ..............................................................................................................7Learning Objectives .............................................................................................7Schedule ..............................................................................................................7Lectures and Seminars .........................................................................................8Projects, Assignments, and Due Dates..................................................................8Readings ..............................................................................................................9Project and Assignments ......................................................................................9
2. Quick Reference to Readings.................................................................................10Week 1. Technological Change and Economic Growth ......................................10Week 2. Sources of Invention — Small Firms and Innovative Networks ............11Week 3. Sources of Improvement and Efficiency — Big Firms and StreamlinedStructure ............................................................................................................12Week 4. Evolution of New Industries.................................................................13Week 5. Turnover of Corporate Leadership........................................................15Week 6. Shakeouts.............................................................................................16Week 7. Alternative Reasons for Shakeouts and Industry Concentration ............17Week 8. Product Differentiation and Market Niches...........................................18Week 9. Firm Growth ........................................................................................18Week 10. Firm Technological Success and National Development.....................19
Industrial Growth & Competition ..................................................................................20
3. Technological Change and Economic Growth........................................................21Improving Technology Contributes Enormously to Economic Growth. ..............21Economic Growth and Technology: Some Facts ................................................23The Unbound Prometheus ..................................................................................26Joseph Schumpeter and the Schumpeterian Hypothesis ......................................34British Industry and Technological Progress ......................................................35The Basic Model of Economic Growth ..............................................................36Conclusion.........................................................................................................38Study Guide .......................................................................................................38
4. Sources of Invention: Small Firms and Innovative Networks .................................42Firm Size ...........................................................................................................42Individuals who Create Innovations ...................................................................43Regional Agglomerations of Firms.....................................................................44The Economy of Cities.......................................................................................44Study Guide .......................................................................................................45

Industrial Growth and Competition K. Simons, 2003
3
5. Sources of Invention: Big Firms & Streamlined Structure, Improvement &Efficiency..................................................................................................................48
Firm Size and R&D ...........................................................................................48Empirical Findings about Firm Size, Industry Concentration, and R&D.............50R&D Cost-Spreading – A Model that Explains the Empirical Patterns ...............50Study Guide .......................................................................................................56
6. Evolution of New Industries ..................................................................................59Types of Competitive Evolution.........................................................................59A First Comparison of Some Industry Evolutionary Patterns..............................60Study Guide .......................................................................................................65
7. Turnover of Corporate Leadership .........................................................................68Examples ...........................................................................................................68Detecting and Analyzing Corporate Leadership Turnover ..................................69Why Does Leadership Turnover Occur?.............................................................70Does Leadership Turnover Occur? .....................................................................71Possible Firm Strategies .....................................................................................72Technological and Non-Technological Causes of Turnover................................73Study Guide .......................................................................................................73
8. Shakeouts ..............................................................................................................77Prevalence .........................................................................................................77Causes ...............................................................................................................78A Theory of Shakeouts.......................................................................................79Actual Survival Patterns.....................................................................................84Summary of Evidence Regarding the Theory .....................................................88Technological and Non-Technological Causes of Shakeouts ..............................90Study Guide .......................................................................................................90
9. Alternative Reasons for Shakeouts and Industry Concentration..............................92Reasons for Advantages to Large Firms / Early Entrants ....................................92How Assumptions Affect Conclusions in Models of Industry Competition ........95Bounds on Predicted Industry Concentration......................................................95Study Guide .......................................................................................................97
10. Product Differentiation and Market Niches ........................................................101How Product Differentiation Matters for Competition and Industry Analyses ..101Market Niches Defined ....................................................................................102Examples of Product Differentiation and its Effects .........................................102Study Guide .....................................................................................................105
11. Firm Growth ......................................................................................................107The Myth of the U-Shaped Long-Run Firm Cost Curve ...................................107Major Theories of Firm Growth .......................................................................108Empirical Patterns in Product Industries...........................................................110Empirical Patterns for Firms/Plants in Multiple Industries................................112Study Guide .....................................................................................................113
12. Firm Technological Success and National Development ....................................116Linear versus Leapfrog Models of Technology Development...........................116Catching Up in the Face of International Competition ......................................117

Industrial Growth and Competition K. Simons, 2003
4
National Technology Policy .............................................................................120Study Guide .....................................................................................................121
Educational Tools........................................................................................................122
13. Mathematical Skills Related to the Text .............................................................123Interpreting Derivatives ...................................................................................123Greek Letters ...................................................................................................123Computing Derivatives ....................................................................................123Maximizing a Function ....................................................................................125
14. Course Quiz.......................................................................................................127
References and Extended Bibliographies .....................................................................135
15. References in the Main Text ..............................................................................136
16. Bibliography - How Industries Work .................................................................142Advertising ......................................................................................................142Firm Entry and Survival - Age and Size Relationships .....................................142Firm Entry and Survival - Organizational Ecology Models ..............................142Firm Entry and Survival - Patterns of Leadership Turnover..............................143Firm Entry and Survival - Patterns of Shakeouts ..............................................143Firm Growth ....................................................................................................144Firms - Definition ............................................................................................145Firms - Diversification .....................................................................................145Firms - Inter-Firm Alliances.............................................................................145Firms - Labor Practices ....................................................................................146Firms - Vertical Integration..............................................................................146Geographic Agglomeration of Firms and R&D ................................................146History of Industry and Technology (Key Works)............................................146Industry Economics Texts ................................................................................147Product Differentiation.....................................................................................147Production Cost - Cost Curves and Minimum Efficient Production Scale.........147Production Cost - Experience/Learning Curves, Progressive Reduction ...........147R&D - Appropriability.....................................................................................148R&D - Incentive Structure ...............................................................................148R&D - Racing and Preemptive Patenting .........................................................149R&D - Sources of Innovation...........................................................................149Technology - Demand-Pull versus Supply-Push...............................................149Technology - Diffusion / Spillovers .................................................................149Technology - Dominant Designs ......................................................................149Technology - Lock-In and Network Externalities .............................................150Technology - Product Life Cycles ....................................................................150Technology - Schumpeterian Hypothesis .........................................................150Technology - Trajectories ................................................................................152
Industrial Growth and Competition K. Simons, 2003
5
TablesTable 3.1. Growth Rates (% per year) of GDP per Worker Hour in Sixteen Industrial
Countries, 1870-1979.............................................................................................25Table 7.1. Examples of Corporate Leadership Turnover in the US.................................69Table 8.1. Degree of Shakeout in a Sample of US Manufactured Products.....................78Table 10.1. Penicillin Types and Their Manufacturers, 1948-1993...............................103Table 11.1. Evolving Size Distribution in US Tire Manufacturing ...............................111Table 11.2. Evolving Size Distribution in US Tire Manufacturing, 4A Firms in 1930 ..111Table 11.3. Evolving Size Distribution in US Tire Manufacturing, B Firms in 1915 ....112Table 11.4. Growth and Exit among US Manufacturing Plants ....................................113
FiguresFigure 3.1. Production over Time in Growth Model with No Productivity Growth.........37Figure 3.2. Production over Time in Growth Model with 3% Annual Productivity Growth
..............................................................................................................................38Figure 6.1. Number of Manufacturers versus Time of Various US and UK Products ....62Figure 8.1. Number of Producers, Entry, and Exit in the Four Products .........................80Figure 8.2. Price and Output in the Four Products..........................................................81Figure 8.3. One Theory (that Seems to Fit with Facts) About Shakeouts ........................82Figure 8.4. Survival over Time in the Four Products ......................................................85Figure 8.5. Survival in Manufacture of Ballpoint Pens...................................................87Figure 8.6. Survival in Manufacture of Shampoo...........................................................87Figure 9.1. Illustration of Sutton’s Model of Effects of Advertising Cost-Spreading ......96Figure 11.1. U-Shaped Marginal and Average Cost Curves .........................................108Figure 11.2. U-Shaped Cost of Growth........................................................................109Figure 12.1. Firm positions and profits in quality-efficiency space...............................118Figure 12.2. International and home-country producers in quality-efficiency space......119

Industrial Growth and Competition K. Simons, 2003
6
Syllabus forEC2212

Industrial Growth and Competition K. Simons, 2003
7
1. The Course
The growth of economies depends on the growth and survival of industries andfirms. If you analyze national or multinational economies, industry competition, orcompany management, it is important to know how industries develop and change. Acrucial part of this change, in many industries and for overall economic growth, iscontinual development of new or improved production methods and products.
This course examines industrial change beginning from the inception of anindustry. We pay close attention to technology, which often drives industrialcompetition. We examine the entry, exit, and growth of firms in individual markets, suchas the production of automobiles, shampoo, calculators, penicillin, or software. We studyhow oligopolies form. We talk about possible national policies and strategies forcorporate success. Parts of the story include product variety, economies of scale andscope, advertising and distribution, firm growth by expansion or merger, internationaltrade, and the growth of cities.
Analyzing these issues in practice requires considerable research skills, and thecourse is designed to give you some of those skills. Half your grade in the course willcome from a research project. You will learn ways to collect data, analyze it, and relateyour findings to topics in the course. Your experience in the project is useful preparationfor third-year dissertations, and also for industry studies carried out in financial firms,consultancies, and corporate management.
This is a half-unit course for second- or third-year economics students.Recommended prerequisites are quantitative methods I and principles of economics.Students with other backgrounds should consult the lecturer before registering. As usualfor courses at Royal Holloway, Industrial Growth and Competition should take you aboutten hours per week. Your grade is based 50% on the research project, and 50% on anend-of-year exam.
Learning ObjectivesIn this course, you will learn:
• Ways in which firms change and compete in industries, with a focus on ways relatedto technological change. Also, ways in which the industries relate to regional,national, and global economic growth.
• Skills useful for research in which you analyze actual firms, markets, or industries.
ScheduleThe following is an approximate schedule, divided into ten weeks:
1. Technological Change and Economic Growth2. Sources of Invention: Small Firms and Innovative Networks3. Sources of Improvement and Efficiency: Big Firms and Streamlined Structure4. Evolution of New Industries5. Turnover of Corporate Leadership6. Shakeouts7. Sources of Increasing Returns

Industrial Growth and Competition K. Simons, 2003
8
8. Product Niches, Patents, Economies of Production Scale, & Other Influences onDynamics
9. Firm Growth10. Supporting Economic Growth
Lectures and SeminarsLectures are for all students simultaneously, and mainly provide a first-pass
opportunity to learn the material in the lecture notes. Feel free to ask questions;sometimes you will be asked questions too. Seminars involve fewer students at a time soit is easier to discuss course material and practice with it, and discuss how to handle yourongoing projects. Attendance will be taken at seminars and if you fail to attend morethan one seminar, expect to be questioned by your advisor and/or by the department’sacademic coordinator; in extreme cases students may even be barred from exams for non-attendance! (These attendance policies hold for all courses in the department.) Beforeeach seminar, you absolutely must study all sections of the course notes that pertain tolectures given to date. We will discuss this material and you will be quizzed and put onthe spot to answer questions! Studying the course notes should not take long so thisshould not be a big burden; the other required readings (see below) may be done at anyappropriate time. Bring your course notes with you to the seminars. Seminars willinvolve many kinds of activities, including at one point a game that will help youexperience firsthand some of the industry theories in the course.
Projects, Assignments, and Due DatesYou choose, during the first seminar session, a research topic to analyze during
the course. Every project will involve collection of some empirical evidence (orsimulated data in rare cases), statistical analysis of the evidence, and a write-up withreference to the relevant literature. As the course goes along, I will guide you to gothrough these processes. You will be part of a team that gathers key information, butultimately you will do your own analyses and write your own report. You and your teamshould start reading and gathering relevant information right away. Biweeklyassignments will help you prepare the final project report, because each assignmentrequires you to do a key piece of the project work.
Note the following due dates. Assignments are due in your seminar classes andwill be discussed but not be collected; you will tick a sheet indicating whether you havedone the assignment. Two copies of the final project report must be handed in to thedepartment office by noon on the last day of the spring term.
28 Jan. Assignment 1 Team report: literature review about the team’s topic11 Feb. Assignment 2 Team report: data listing and documentation (data
collection required!)25 Feb. Assignment 3 Individual report: literature review about your topic11 Mar. Assignment 4 Individual report: data analysis18 Mar. Assignment 5 Draft version of your final project28 Mar. Project Report Two copies of your final report due by 12:00 noon

Industrial Growth and Competition K. Simons, 2003
9
ReadingsIn addition to reading for your project, the main reading is my course notes. The
course notes are essentially a draft textbook, which I wrote because there is no textbookthat covers the topics of the course. The notes are not as extensive as a fully-developedtext, and to flesh out your knowledge you will need to read from further sources.
Further required and optional readings are listed in the course notes. You mustlook at the required readings to extract the main points, but I don’t expect you to readevery word. The course notes include self-study questions to direct your reading. Theoptional further readings are useful if your project relates to a topic, or if you want tolearn more. Almost all these readings are in Bedford Library; the course notes tell youwhere to find them.
Do you want other books about industry economics related to many subjects inthe course? Two related texts are Mike Scherer’s Industrial Market Structure andEconomic Performance (Bedford Library 338.758 SCH), an impressive and widely-usedcompendium of empirical facts and some theoretical models in industry economics, andMike Scherer’s Industry Structure, Strategy, and Public Policy (338.973 SCH), whichillustrates principles of industry economics with analyses of nine industries. Also usefulare Jean Tirole’s The Theory of Industrial Organization (338.6 TIR), Stephen Martin’sAdvanced Industrial Economics (338 MAR), and David Brewster’s Business Economics:Decision-Making and the Firm (338.751 BRE).
Project and AssignmentsSee the Project Guide for information about the course project and assignments.Two copies of your project report are due in the Economics Department Office by
Friday 28 March at 12:00 noon. The department has taken the policy that lateassignments receive grades of zero, so it is critical to finish your project well in advance!The project report must be completed by you, not by your team. The report may includesections written by the team as long as the authors are clearly identified; however, expectto receive a grade of zero if you submit only a team-written part of a report. Don’t forgetto put your name on the front of your report.
Industrial Growth and Competition K. Simons, 2003
10
2. Quick Reference to Readings
The following codes are used for where you can find each reading:B Bedford Library main collection.R Bedford Library, restricted (short) loan section.O Bedford Library, offprint collection in the restricted (short) loan section.J Bedford Library, journals shelves.E Electronic journal collection accessible from the Royal Holloway library web site.W Web, accessible via the internet at the address specified.U Available elsewhere in the University of London system (LSE or, in one case,Imperial). Ask the Bedford Library enquiry desk before going, in case you need anofficial admission document.
Week 1. Technological Change and Economic Growth
Look at These Readings (in order of importance)
Walker, William. “National Innovation Systems: Britain.” In Nelson, Richard R., ed.National Innovation Systems. New York: Oxford University Press, 1993. Chapter 5,pp. 158-191. O B R 338.06 NAT. Gives an overview of industrial innovation inBritain. If you are from another country, the book might have a chapter about yourcountry too.
Yates, Ivan. “An Industrialist’s Overview of Manufacturing and Economic Growth.” InYates, Ivan, ed. Innovation, Investment and Survival of the UK Economy. London:Royal Academy of Engineering, 1992. Chapter 1, pp. 5-24. B check call number incatalog (new addition). Argues the importance of manufacturing industry, and theinnovative change that drives its growth, for the UK economy. Useful though at pointssloppy (e.g., the triangle drawn on fig. 3 is unnecessary and inappropriate: why shouldit point at 0 instead of –3 or +0.2?).
Walker, John. “Service Sector Adjustment and the Implications for Manufacturing.” InYates, Ivan, ed. Innovation, Investment and Survival of the UK Economy. London:Royal Academy of Engineering, 1992. Chapter 3, pp. 45-51. B check call number incatalog; same as above. Presents evidence that service industries are unlikely toprovide a strong growth impetus for the UK economy (unless unanticipated growthareas in services can be created through innovative approaches to service industries).
Further Readings
Chandler, Alfred D. The Visible Hand: The Managerial Revolution in AmericanBusiness. Cambridge: Belknap (Harvard University Press), 1977. B 338.75 CHA. Amonumental document that provided for the first time an integrated history ofAmerican industry from the 1700s into the 1900s.
Chandler, Alfred D., Jr. Scale and Scope. Cambridge, MA: Harvard University Press,1990. B R 338.644 CHA. Another monumental document, analyzing industrial historyin the United States and Europe during the 20th century.

Industrial Growth and Competition K. Simons, 2003
11
Hounshell, David A. From the American System to Mass Production, 1800-1932.Baltimore: Johns Hopkins University Press, 1984. B 338.644 HOU.
Landes, David S. The Unbound Prometheus: Technological Change and IndustrialDevelopment in Western Europe from 1750 to the Present. Cambridge: CambridgeUniversity Press, 1969. B 338.94 LAN. The key history of European industrialdevelopment from 1700 until shortly after World War II.
Mokyr, Joel. The Lever of Riches: Technological Creativity and Economic Progress.Oxford, 1990. R 338.06 MOK. A seminal history and analysis of technologicaladvance, mostly in the western world, over more than two millennia; illustrates thefundamental role of technical change in economic growth.
Mowery, David C. and Nathan Rosenberg. Technology and the Pursuit of EconomicGrowth. Cambridge: Cambridge University Press, 1989. B 338.06 MOW.
Pratten, Clifford F. “The Manufacture of Pins.” Journal of Economic Literature 18(March), 1980, pp. 93-96. E.
Rosenberg, Nathan. Inside the Black Box: Technology and Economics. Cambridge:Cambridge University Press, 1982. B 338.06 ROS. Chapter 1 is an excellent overviewof the role of technological progress in economic growth over a long time span.
Scherer, F.M. and David Ross. Industrial Market Structure and Economic Performance,3rd ed. Boston: Houghton-Mifflin, 1990. R 338.758 SCH. Chapter 17 considerstechnological change; focus on the earlier parts of the chapter, pages 613-630 in thebook’s third edition.
Solow, Robert M. “Technical Change and the Aggregate Production Function.” Reviewof Economics and Statistics 39 (August), 1957, pp. 312-320. O J E. This paper, whichin part led to Solow’s Nobel prize, analyzes the extent to which US labor productivitygrowth from 1909 to 1949 stemmed from increased capital intensity. The answerstunned many economists of the time: capital apparently was of little relevance toproductivity growth; technological advances and increased skill of workers apparentlycontributed over 80% of the labor productivity growth.
von Tunzelmann, G. N. Technology and Industrial Progress: The Foundations ofEconomic Growth. Aldershot, UK: Edward Elgar, 1995. B 338.06 VON.
Week 2. Sources of Invention — Small Firms and Innovative Networks
Look at These Readings (in order of importance)
Saxenian, AnnaLee. Regional Advantage: Culture and Competition in Silicon Valley andRoute 128. Cambridge, Mass.: Harvard University Press, 1994. B R 338.4762 SAX.Argues for the importance of a culture of cooperation and openness in order to makeregional agglomerations of firms as beneficial as possible to the firms involved.
Jacobs, Jane. The Economy of Cities. New York: Random House, 1969. B R338.091732. Describes regional circumstances that affect innovation by firms, andrelates these patterns to the growth and stagnation of cities.
Jewkes, John, David Sawers, and Richard Stillerman. The Sources of Invention, 2nd ed.New York: W.W. Norton & Co., 1969. B 608.7 JEW. Points out that, among thoseinnovations that take the form of new products, many originate from individuals orsmall firms.
Industrial Growth and Competition K. Simons, 2003
12
Further Readings: Importance of Small Firms
Jacobs, Jane. Cities and the Wealth of Nations: Principles of Economic Life. 1985. R301.36 JAC.
Schumpeter, Joseph A. The Theory of Economic Development: An Inquiry into Profits,Capital, Credit, Interest, and the Business Cycle. 1912. Translated from the Germanby R. Opie, Harvard University Press, 1934. B 338.5 SCH. The author became a verycontroversial leading economist, as you will see from his later book Capitalism,Socialism, and Democracy next week. Because this earlier book considers theimportance of small firms for creating technological ferment and advance, it is valuableto consider it along with the later book which relatedly argues for the importance oflarge firms to technological advance.
Further Readings: Agglomerative Networks & Economic Growth
Glaeser, Edward L., Hedi D. Kallal, José A. Scheinkman, Andrei Shleifer. “Growth inCities.” Journal of Political Economy 100 (6), 1992, pp. 1126-1152. E.
Jaffe, Adam, Manuel Trajtenberg, and Rebecca Henderson. “Geographic Localization ofSpillovers as Evidenced by Patent Citations.” Quarterly Journal of Economics, 108,1993, pp. 577-98. E.
Krugman, Paul. “Increasing Returns and Economic Geography.” Journal of PoliticalEconomy 99 (3), 1991, pp. 483-499. E.
Further Readings: Where Firms Get Innovative Ideas
Gibbons, Michael, and Ron Johnston. “The Roles of Science in TechnologicalInnovation.” Research Policy 3, 1974, pp. 220-242. U Imperial College central library,level 3 periodicals 351.85.
Johnston, Ron and Michael Gibbons. “Characteristics of Information Usage inTechnological Innovation.” IEEE Transactions on Engineering Management, EM-22(1: February), 1975, pp. 27-34. U Imperial College central library, level 2 periodicals62 IEEE.
von Hippel, Eric. The Sources of Innovation. Oxford: Oxford University Press, 1988. R338.06 HIP.
Week 3. Sources of Improvement and Efficiency — Big Firms and StreamlinedStructure
Look at These Readings (in order of importance)
Cohen, Wesley. “Empirical Studies of Innovative Activity.” In Stoneman, Paul, ed.,Handbook of the Economics of Innovation and Technological Change, Oxford: BasilBlackwell, 1995, pp. 182-264. O B 338.06 HAN. A dense review of empiricalresearch on industrial innovation and technological change. Learn the main conceptsand points, not the many minute details.
Schumpeter, Joseph. Capitalism, Socialism, and Democracy. New York: Harper, 1942.B R 320.531 SCH. Examine especially chapters 7 and 8, which contain a core idea thattriggered much heated debate and research, because Schumpeter argued that theclassical economic focus on highly-competitive markets full of small firms was
Industrial Growth and Competition K. Simons, 2003
13
completely backward from the focus most relevant to understanding the processes ofeconomic growth.
Further Readings
Cohen, Wesley and Steven Klepper. “A Reprise of Size and R&D.” Economic Journal106, 1996, pp. 925-951. O J E. Argues for a re-interpretation of the evidence on firmsize and R&D. Explains how observed empirical patterns, of roughly constant R&Dspending per employee for firms of varying sizes and of lower returns to R&D forlarger firms, in fact may result from larger firms exploiting R&D possibilities morefully and hence accomplishing more overall innovation than a group of smaller firmsthat add up to the same size as a large firm would accomplish.
Chandler, Alfred D. The Visible Hand: The Managerial Revolution in AmericanBusiness. Cambridge: Belknap (Harvard University Press), 1977. B 338.75 CHA. Amonumental document that provided for the first time an integrated history ofAmerican industry from the 1700s into the 1900s.
Chandler, Alfred D., Jr. Scale and Scope. Cambridge, MA: Harvard University Press,1990. B R 338.644 CHA. Another monumental document, analyzing industrial historyin Europe and the United States during the 20th century.
Levin, Richard C., Alvin K. Klevorick, Richard R. Nelson, and Sidney G. Winter.“Appropriating the Returns from Industrial Research and Development” (includingcommentary by Richard Gilbert). Brookings Papers on Economic Activity 3, 1987, pp.783-831. U LSE library journals HC101. This paper investigates to what extent firmscan “appropriate,” or receive, the economic value of their inventions, through patentsand other means.
Week 4. Evolution of New Industries
Look at These Readings (in order of importance)
Klepper, Steven, and Elizabeth Graddy. “The Evolution of New Industries and theDeterminants of Market Structure.” RAND Journal of Economics 21 (1: Spring), 1990,pp. 27-44. O J. Focus on the first half of the paper, to gain an understanding of someimportant empirical patterns in the dynamics of product industries.
Hannan, Michael T., and John Freeman. Organizational Ecology. Cambridge, Mass.:Harvard University Press, 1989. R 338.74 HAN. This book argued for analysis ofindustries (and other “populations of organizations”) using models similar to those inecology that describe populations of animals; it started a large trend in sociologyresearch that is also pertinent to industry economists. Get the main ideas and a sense ofthe methods used by the authors.
Geroski, Paul A. Market Dynamics and Entry. Oxford: Blackwell, 1991. R 338.6 GER.Use chapters 1-3, which give you a sense of the bulk of economic research that hasgone on — mostly at an economy-wide level or for very aggregated industry groupsrather than for specific products — regarding the entry of new firms.

Industrial Growth and Competition K. Simons, 2003
14
Further Readings
Audretsch, David B. Innovation and Industry Evolution. Cambridge, Mass.: MIT Press,1995. B 338.06 AUD.
Audretsch, David B. “New-Firm Survival and the Technological Regime.” Review ofEconomics and Statistics (August), 1991, pp. 441-450. E. Audretsch characterizesdifferent industries as belonging to different “technological regimes,” with alternativepatterns of new-firm survival.
Baldwin, John R. The Dynamics of Industrial Competition: A North AmericanPerspective. Cambridge: Cambridge University Press, 1998. B 338.70971 BAL.
Carroll, Glenn R., and Michael T. Hannan, eds. Organizations in Industry: Strategy,Structure, and Selection. Oxford: Oxford University Press, 1995. R 338.74 ORG.This book investigates some organizational ecologists’ notions of the dynamics ofindustries, through a series of industry case studies.
Davis, Steven J., John C. Haltiwanger, and Scott Schuh. Job Creation and Destruction.Cambridge, Mass.: MIT Press, 1996. B 331.12 DAV. Entry and exit of firms, or theirgrowth or contraction, coincide with the creation and destruction of jobs. The authorsanalyze these patterns in the US using a new census dataset, and argue for explanationsof some important economic patterns.
Gort, Michael, and Steven Klepper. “Time Paths in the Diffusion of ProductInnovations.” The Economic Journal, 92, Sept. 1982, pp. 630-653. O E. This paper isa forebear of Klepper and Graddy’s paper cited above; the main differences are that thisone has a somewhat smaller dataset to work from and a different (one could say lessadvanced) theoretical model.
Krugman, Paul. “Technological Change in International Trade.” In Stoneman, Paul, ed.,Handbook of the Economics of Innovation and Technological Change, Oxford: BasilBlackwell, 1995, pp. 342-365. B 338.06 HAN. This literature review is unusuallywell-written and hence readable. Section 3 pertains to the product life cycle theory as ithas been applied to international trade, and is why I’m suggesting this reading. But thewhole article may be of interest.
Porter, Michael E. Competitive Strategy: Techniques for Analyzing Industries andCompetitors. New York: Free Press, 1980. B 338.6048 POR (also O chapter 1).Porter, the guru of strategic management, collects important impacts on competitivedynamics and provides a framework to think about them.
Simons, Kenneth L. “Product Market Characteristics and the Industry Life Cycle.”Working paper, Royal Holloway, University of London, 2002. Early version at Wwww2.rhul.ac.uk/~uhss021, or ask me for the full updated version. Shows thatunderlying technological or other characteristics drive industry outcomessystematically. Part of the paper compares the US industries studied by Klepper andGraddy (and previously Gort and Klepper) with the same industries in the UK, to verifythe idea that underlying product- or technology-specific traits of industries are primedeterminants of the industries’ evolutionary processes.
Industrial Growth and Competition K. Simons, 2003
15
Week 5. Turnover of Corporate Leadership
Look at These Readings
Tushman, Michael L., and Philip Anderson. “Technological Discontinuities andOrganizational Environments.” Administrative Science Quarterly 31, 1986, pp. 439-465. O. This paper has generated much interest about how existing producers of aproduct might have trouble adapting to technological changes in the product or itsmanufacturing methods, hence allowing new producers a chance to break into themarket.
Further Readings
Anderson, Philip and Michael L. Tushman. “Technological Discontinuities andDominant Designs: A Cyclical Model of Technological Change.” AdministrativeScience Quarterly 35, 1990, pp. 604-633. O. In part, this paper argues thattechnology-related turnover in corporate leadership results from new technologies thatrequire firms to have new “core competencies” — R&D-related skills, personnel,equipment, and organizational and managerial traits.
Christensen, Clayton M., and Richard S. Rosenbloom. “Explaining the Attacker'sAdvantage: Technological Paradigms, Organizational Dynamics, and the ValueNetwork.” Research Policy 24 (2), March 1995, pp. 233-257. O J. This paper arguesthat technology-related turnover in corporate leadership may result because companiesare blinded by their customers. The desires of customers may not match with theadvantages of new technologies, so the companies may not adopt the new technologies.These companies may be surprised that they lose their market because the newtechnologies have improved and become much better than the old technologies.However, see the article by King and Tucci, which shows that Christensen andRosenbloom apparently got their results completely wrong.
Foster, Richard N. Innovation: The Attacker’s Advantage. New York: Summit Books,1986. U LSE Library HD45 F75. A management consultant argues that new firmsbreak into market positions and triumph over incumbents by coming up with innovativenew products.
Henderson, Rebecca M. and Kim B. Clark. “Architectural Innovation: TheReconfiguration of Existing Product Technologies and the Failure of EstablishedFirms.” Administrative Science Quarterly 35, 1990, pp. 9-30. U LSE library journalsJA1.A3. This paper argues that technology-related turnover in corporate leadershipmay result because companies are blinded by their mindset about the technology.Scientists, engineers, and managers may be used to how to work with one technology,but a new technology may require a new way of thinking and working that they do notrecognize. This problem may occur despite that the company and its employeesotherwise have all the right skills and equipment and know-how to pursue the newapproach to the industry’s technology.
King, Andrew A., and Christopher L. Tucci. “Incumbent Entry into New Market Niches:The Role of Experience and Managerial Choice in the Creation of DynamicCapabilities.” Management Science 48 (2), 2002, pp. 171-186. J. Christensen andRosenbloom seem to have gotten the story wrong in the hard disk drive industry: earlierentrants did better than later entrants.

Industrial Growth and Competition K. Simons, 2003
16
Reinganum, Jennifer F. 1983. “Uncertain Innovation and the Persistence of Monopoly.”American Economic Review 73(4), 1983, pp. 741-748. O J. This classic articledevelops a simple economic model in which an incumbent and an entrant can try toinnovate, reducing their costs when they succeed. For sufficiently drastic innovations,the incumbent has less incentive to innovate than the entrant.
Schnaars, Steven P. Managing Imitation Strategies: How Later Entrants Seize Marketsfrom Pioneers. Free Press (Macmillan), 1994. B 338.758 SCH. This book describes alarge number of cases of specific products to prove that small, late entrants often canseize markets; in many products, the early movers do not necessarily win and laterentrants may even have an advantage.
Simons, Kenneth L. “Information Technology and Dynamics of Industry Structure: TheUK IT Consulting Industry as a Contemporary Specimen.” Working paper, 2002b. Wwww2.rhul.ac.uk/~uhss021. Checks for evidence of whether the internet (and earlierthe PC) might yet have caused disruptive technology effects among UK ITconsultancies.
Week 6. Shakeouts
Look at These Readings
Klepper, Steven and Kenneth L. Simons. “Technological Extinctions of Industrial Firms:An Inquiry into their Nature and Causes.” Industrial and Corporate Change 6, 1997,pp. 379-460. O J. Investigates four products with extremely severe shakeouts in theirnumbers of producers, as a means to understand the reasons for shakeouts and howtechnological change can create highly-concentrated industries.
Further Readings
Phillips, Almarin. Technology and Market Structure: A Study of the Aircraft Industry.D.C. Heath, 1971. U LSE library HD9711.U5 P55. A classic study of the rich-get-richer phenomenon in industry.
Jovanovic, Boyan, and Glenn M. MacDonald. “The Life Cycle of a CompetitiveIndustry.” Journal of Political Economy, 102, 1994, pp. 322-347. O E. Captures theidea that new technology may contribute to competition and shakeouts.
Klepper, Steven. “Entry, Exit, Growth, and Innovation over the Product Life Cycle.”American Economic Review, 86, 1996, pp. 562-583. O J E. A particularly tellingmodel of shakeouts, this seems to come much closer to empirical fact than otherauthors’ theories have come.
Klepper, Steven and Kenneth L. Simons. “The Making of an Oligopoly: Firm Survivaland Technological Change in the Evolution of the U.S. Tire Industry.” Journal ofPolitical Economy, 108 (4: August), 2000, pp. 728-760. J E. Uses rich data from theUS tire industry to probe processes of industry evolution and how they involvetechnological change.
Klepper, Steven and Kenneth L. Simons. “Dominance by Birthright: Entry of PriorRadio Producers and Competitive Ramifications in the U.S. Television ReceiverIndustry,” Strategic Management Journal, 21 (10-11: October-November), 2000, pp.997-1016. J. Shows how prior experience can matter to competitive success.

Industrial Growth and Competition K. Simons, 2003
17
Suárez, Fernando F. and James M. Utterback. “Dominant Designs and the Survival ofFirms.” Strategic Management Journal, 16 (5), June 1995, pp. 415-430. J.
Nelson, Richard R. and Sidney G. Winter. 1978. “Forces Generating and LimitingConcentration under Schumpeterian Competition.” Bell Journal of Economics 9, pp.524-548. J, or see their classic book which contains the same article: Nelson, RichardR. and Sidney G. Winter. An Evolutionary Theory of Economic Change. HarvardUniversity Press (Cambridge, Mass.), 1982. B 338.09 NEL.
Week 7. Alternative Reasons for Shakeouts and Industry Concentration
Look at These Readings (in order of importance)
Scherer, F.M. and David Ross. Industrial Market Structure and Economic Performance,3rd ed. Boston: Houghton-Mifflin, 1990. R 338.758 SCH. Use the section of chapter4 pertaining to economies of scale and scope (pages 97-141 in the 3rd edition). Theevidence suggests that firms and their manufacturing plants face long-run cost curvesthat involve minimum scales necessary to be efficient. In some industries, plants seemto face diseconomies of scale above some size because of transportation costs and(rarely) other reasons, but the notion of long-run U-shaped cost curves for firms isunproven and is likely pure fiction. Make sure you gain a knowledge of commonly-discussed reasons for advantages or disadvantages to plant size and firm size.
Sutton, John. Sunk Costs and Market Structure: Price Competition, Advertising, and theEvolution of Concentration. Cambridge, Mass.: MIT Press, 1991. B R 338.6 SUT.This book escapes the problem that theories of market competition and productdifferentiation generate almost any result depending on the particular assumptions; itdoes so by predicting bounds on the results instead of specific results. It argues thatadvertising cost spreading and other sources of sunk costs or increasing returns — suchas the R&D cost spreading considered earlier in this course — can cause a market tobecome tightly concentrated among a few producers, whereas markets without theseinfluences need not become tightly concentrated. I suggest you not worry aboutunderstanding the mathematical model – which some people argue has drawbacksanyway – but get the notion of bounds and look at how Sutton uses empirical evidenceto support his case.
David, Paul. “Clio and the Economics of QWERTY.” American Economic AssociationPapers and Proceedings 75 (2), May 1985, pp. 332-337. O J E. Illustrates how aparticular technology, not necessarily the most efficient technology, can become lockedin place as a result of historical accident.
Further Readings
Achi, Zafer, Andrew Doman, Olivier Sibony, Jayant Sinha, Stephan Witt. “The Paradoxof Fast Growth Tigers.” McKinsey Quarterly, (3), 1995, pp. 4-17. O J. An easy-reading managerial-audience article on firm growth with increasing returns dynamics.
Arthur, W. Brian. “Competing Technologies, Increasing Returns, and Lock-In byHistorical Events.” Economic Journal 99 (March), 1989, pp. 116-131. J E.
Liebowitz, S. J. and Stephen E. Margolis. “The Fable of the Keys.” Journal of Law andEconomics 33 (1: April), 1990, pp. 1-25. W http://www.utdallas.edu/~liebowit/

Industrial Growth and Competition K. Simons, 2003
18
keys1.html. Shows that the QWERTY keyboard seemingly is no worse than Dvorak, toargue that there is little evidence that the technology that gets locked in is of poorquality relative to technologies that don’t get locked in.
Week 8. Product Differentiation and Market Niches
Look at These Readings (in order of importance)
Shaw, R.W. “Product Proliferation in Characteristics Space: The UK FertilizerIndustry.” The Journal of Industrial Economics 31 (1/2: September/December), 1982,pp. 69-91. O. Examines the differences between the varieties of fertilizer offered forsale by UK manufacturers, and examines how the varieties changed over time in orderto test what theories of product differentiation seem to hold up in practice.
Further Readings
Hannan, Michael T., and John Freeman. Organizational Ecology. Cambridge, Mass.:Harvard University Press, 1989. R 338.74 HAN. Use chapter 5, which discusses atheory of competition for niches of products with fast versus slow market changes.
Tirole, Jean. The Theory of Industrial Organization. Cambridge, Mass: MIT Press,1988. O (chapter 7) B 338.6 TIR. Examine chapter 7 to see some common theoreticalmodels of product differentiation, as used in industrial economics. Don’t try to learn allthe details, but do try to learn the main concepts about how these models portrayindustries working.
Week 9. Firm Growth
Look at These Readings (in order of importance)
Mansfield, Edwin. “Entry, Gibrat’s Law, Innovation, and the Growth of Firms.”American Economic Review 52 (5), 1962, pp. 1023-1051. O J E. This small classicreviews patterns of entry, growth, and innovation in several manufacturing industries.
Dunne, Timothy, Mark J. Roberts, and Larry Samuelson. “The Growth and Failure ofU.S. Manufacturing Plants.” Quarterly Journal of Economics 104 (4: November),1989, pp. 671-698. O E. Reviews how average growth and exit rates vary according tothe size and age of plants in the US.
Ijiri, Yuji and Herbert A. Simon. Skew Distributions and the Sizes of Business Firms.Amsterdam: North-Holland, 1977. Introduction. O. Although Herbert Simon won theNobel primarily for his work on bounded rationality and human decision making, hiswork on skew distributions also probably played a part. This book, from which you’reonly expected to look at the introduction, describes how skew distributions are commonin a wide range of phenomena, and shows how some very simple assumptions yieldskew distribution results. Notably, random entry combined with random percentagegrowth independent of firm size yields, in the long run, a skew distribution of firmsizes.

Industrial Growth and Competition K. Simons, 2003
19
Further Readings
Scherer, F.M. and David Ross, Industrial Market Structure and Economic Performance,3rd ed., Boston: Houghton-Mifflin, 1990. Selected pages on mergers. R 338.758 SCH.
Mueller, Dennis C. Profits in the Long Run. 1986. R 338.516 MUE. Shows evidencethat in some markets, certain firms have long-lasting advantages that let them maintainunusually high profits for long periods of time. (By the way, John Sutton has recentlyformulated an argument against this view, by using a simple depiction of changing sizeplus evidence on firm size to show that the leading firms maintain high market shares inno more industries than would be expected by random chance; thus the observed long-term profitability might be just firms that were the lucky ones without them having anylong-lasting advantage.)
Ravenscraft, David J., and F.M. Scherer. Mergers, Sell-Offs, and Economic Efficiency.1987. B 338.83 RAV.
Lichtenberg, Frank R. Corporate Takeovers and Productivity. Cambridge, Mass.: MITPress, 1992. B 338.83 LIC.
Sutton, John. Technology and Market Structure: Theory and History. Cambridge, MA:MIT Press, 1998. B 338 SUT.
Week 10. Firm Technological Success and National Development
Look at These Readings
There are no required readings for week 10.
Further Readings
Sutton, John. “Rich Trades, Scarce Capabilities: Industrial Development Revisited.”Economic and Social Review 33 (1), Spring 2002, pp. 1-22.
Lu, Qiwen. China’s Leap into the Information Age: Innovation and Organization in theComputer Industry. Oxford: Oxford University Press, 2000. B 338.4700164 LU.
Hobday, Michael. Innovation in East Asia: The Challenge to Japan. Cheltenham:Edward Elgar, 1995. B 338.06095 HOB.

Industrial Growth and Competition K. Simons, 2003
20
IndustrialGrowth &
Competition

Industrial Growth and Competition K. Simons, 2003
21
3. Technological Change and Economic Growth(Week 1)
After completing this section of the course, you should understand the greatimportance of technological change for economic growth:1. The relation of aggregate growth to technological change. 1. A small (e.g. 2.6%)
annual improvement yields great advance over decades or centuries. 2. Solow’smeasurement of technology contributing to growth. 3. Consumer price indices andhedonic price indices.
2. Gross product per person, compared across countries and time. 1. GWP.2. Leading countries. 3. Convergence. 4. R&D expenditures nationwide.5. Military R&D. 6. Why did Britain lose its lead in the industrial revolution?
3. The European Industrial Revolution, as described in The Unbound Prometheus. 1.Britain’s industrial revolution. 2. The continental surge ahead. 3. Late 1800s to early1900s.
4. Schumpeter and industrial technology as the source of growth.5. British national policy and industrial development. 1. Services versus manufacturing.
2. Two strong manufacturing industries. 3. Military industry. 4. Little engineeringand science in university education. 5. An anti-engineering culture. 6. Old boynetworks. 7. Limited government R&D support.
6. The basic economic growth model. 1. Structure of the model. 2. Growth withouttechnological advance. 3. Growth with technological advance.
Improving Technology Contributes Enormously to Economic Growth.An example of the importance of technological advance for economic growth is
the manufacture of pins. Pins are the subject of Adam Smith’s classic analysis of thevalue of division of labor in his book The Wealth of Nations. Yet for reducing the cost ofpins, technological advance, not division of labor, has been critical for the modernmanufacturing industry. In the 1770s, the average worker produced 4,800 pins per day,but by the 1970s the output per worker per day had risen to 800,000 (despite a decreasednumber of hours worked). This implies a 2.6% annual growth in productivity, a rateoften matched or exceeded by other industries (Pratten, 1980).
Robert Solow won the Nobel prize in large part for showing how importanttechnology is to economic growth. Most economists in past had thought of growth asdriven by the accumulation of capital, and by other changes besides technologicalimprovements (e.g. increased division of labor). But, Solow (1957) found that only12.5% (later corrected to 19%) of measured growth in output per hour worked (in the USeconomy excluding farms during 1909-1949) could be attributed to increased use ofcapital equipment. The rest of the productivity gain was attributed to improvedproduction practices and equipment (technological advance in the strict sense) and toincreased ability of the labor force (technological advance via the skills of workers).1
1 For a brief summary, see Scherer and Ross (1990, pp. 613-614).

Industrial Growth and Competition K. Simons, 2003
22
Moreover, the output growth figures used by Solow do not adequately account fortechnological improvements in the form of new products and improved product quality.It is very difficult to reflect new products in consumer price indexes and some othereconomic measures, and these measures include few aspects of quality. So, technologyseemingly has even more impact on growth than Solow estimated.
To analyze growth, economic output must somehow be compared across differentyears, despite that the value of money has changed because of inflation. To correct forinflation, economists use a consumer price index. The index compares similar goods indifferent years, and shows how much prices have changed. For example, if aMacDonald’s Big Mac costs £1 in year 1 and £1.50 in year 2, a consumer price indexbased on Big Mac prices would rise from 100 to 150. Divide a country’s economicoutput by the index in the current year, and multiply by 100, to get figures measured inconstant (or “inflation-adjusted”) monetary units. Price decreases caused bytechnological change are also part of the index: if a consumer price index were basedsolely on the price of computers in the US, the price index would fall 26% per year in1995-1999, implying a 50% drop in price every two years.2 Thus from 1997 to 1999 thehypothetical consumer price index could have fallen from 100 to 50. If the same realdollar value of computers were sold in both 1997 and 1999, dividing by the consumerprice index (technically, dividing by the consumer price index over 100) would indicatecorrectly that twice as much output of computers was produced in 1999 compared to1997.
The problem arises because actual consumer price indexes do not measure theprices of all goods, but only of an established “basket” of goods for which past priceshave been available. New kinds of products tend to have the highest rate of price decline,but they are not included in the basket.3 Therefore, the consumer price index does notfall enough (or grows too quickly) to be able to adjust for the actual amount of pricedecline among the average good in the economy. Dividing by the consumer price indexyields growth figures that are too low. A similar problem arises in terms of the quality ofproducts. The consumer price index “basket” includes computers, but the price indexdoes not adjust for the increase in processing power of computers. In part becausesuccessive generations of computer chips carry out increasingly rapid computation, thevalue of computers to users has grown over time. Treating the typical computer of 1999as being the same as the typical computer of 1997 is misleading. The same problems aretrue for most goods, because the quality of most goods increases over time. An idealprice index would need to adjust for the quality of goods, measuring not the price per unitof each good, but the price per unit of quality. Quality is exceedingly difficult tomeasure. If computers double in speed, it is easy to measure the change in speed, but it isnot so easy to know how much the average consumer is benefiting from the change inspeed. And how can one measure the quality improvement associated with, say, moreeasy-to-use mouse controls or trackballs built into portable computers? There areattempts to adjust for improved quality of goods, by constructing “hedonic price
2 The fall in US computer prices was a lesser 12% per year in 1987 to 1994. See US Department ofCommerce (2000, p. v).3 For one careful analysis of retail price indices and the inclusion merely of new brands, including genericpharmaceuticals, see Berndt, Coburn, and Griliches (1996).

Industrial Growth and Competition K. Simons, 2003
23
indexes,” but consumer price indices have until recently not accounted for quality at all,and now do so in only limited ways.
Economic Growth and Technology: Some FactsHow quickly does economic growth occur? And how quickly does output per
worker hour grow? Ignoring some of the problems with the data, consider the grossworld product (GWP) after adjusting for inflation. The GWP rose from $4.9 trillion in1950 to $26.9 trillion in 1995, as measured in constant 1995 US dollars. The GWP perperson has risen from $1,925 to $4,733 over the same period. In terms of rates of growth,these figures imply a 1.6% average annual growth rate in world economic output, and a0.9% average annual growth rate in output per person. Output per worker hour has alsogrown dramatically, as shown below.
Growth in some nations has been far faster than growth in other nations, withindustrialized and newly-industrializing nations such as the US, Japan, the UK, Germany,France, Italy, and Korea having the highest growth rates. Their rapid growth has helpedkeep these economies booming. Some countries’ per capita growth rates have been ashigh as 3-6% per year, implying a doubling of economic output in only 10 or 5 years!4
Growth rates have also varied over time, and for example economists have beenextremely concerned to find the cause of the “slowdown” in productivity growth duringthe 1970s and 1980s (surprisingly, it has proved extremely difficult to pin down a cause).
Faster growth has enormous benefits for an economy over a period of time!Suppose that government agencies, such as the British Monopolies and MergersCommission or the US Federal Trade Commission, can crack down on anti-competitivepractices to reduce prices by 10%, on average, for an economy. (This sort of governmentpolicy has been followed in Britain and the US during the 1900s, although the percentageprice reduction that has resulted would be difficult to estimate.) In contrast, governmentpolicies that increase the productivity growth rate from 3.0 to 3.5% would yield just asstrong an improvement in prices within 20 years, and an increase from 3.0 to 4.0% wouldyield the same improvement in 10.6 years. Twice the improvement results in 40 or 21.2years, etc. Thus, especially over periods of multiple decades, improving productivitygrowth rates can be much more valuable than reducing anti-competitive practices.
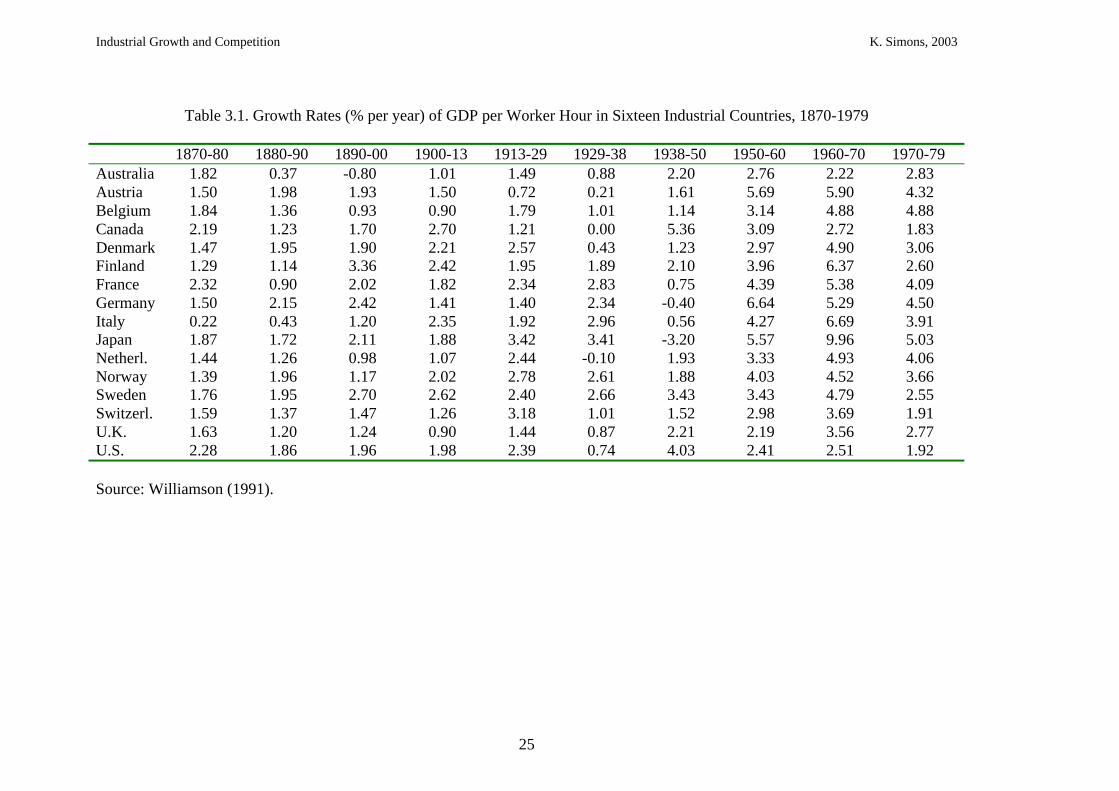
Growth in economic output per worker hour – that is, growth in labor productivity– is shown in table 3.1. The table records the percentage annual growth in GDP perworker hour for sixteen industrial countries over periods of 10-16 years from 1870 to1979. A number of patterns are apparent in the table. First, there are substantialdifferences between countries among their rates of labor productivity growth. Comparingcountries in the last (1970-1979) time period, productivity growth rates range from 1.83%to 5.03% per year. And there are large numbers of less-industrialized countries, notincluded in the table, that had far lower growth rates. Second, within individual countriesthere are substantial differences across time. Taking the UK as an example, productivitygrowth rates in the periods given ranged from 0.87% to 3.56% per year, depending on thetime period. Third, “convergence” tended to occur among this group of leading industrialnations. Countries that already had high productivity (such as the US, Canada, andAustralia) had relatively low productivity growth rates, and countries that had lower
4 See Barro and Sala-i-Martin (1995, pp. 330-381) for data on national and regional growth rates.

Industrial Growth and Competition K. Simons, 2003
24
productivity had relatively high productivity growth rates, leading to convergence inlabor productivity over time. Thus, amongst these industrialized countries, the less-
Industrial Growth and Competition K. Simons, 2003
25
Table 3.1. Growth Rates (% per year) of GDP per Worker Hour in Sixteen Industrial Countries, 1870-1979
1870-80 1880-90 1890-00 1900-13 1913-29 1929-38 1938-50 1950-60 1960-70 1970-79Australia 1.82 0.37 -0.80 1.01 1.49 0.88 2.20 2.76 2.22 2.83Austria 1.50 1.98 1.93 1.50 0.72 0.21 1.61 5.69 5.90 4.32Belgium 1.84 1.36 0.93 0.90 1.79 1.01 1.14 3.14 4.88 4.88Canada 2.19 1.23 1.70 2.70 1.21 0.00 5.36 3.09 2.72 1.83Denmark 1.47 1.95 1.90 2.21 2.57 0.43 1.23 2.97 4.90 3.06Finland 1.29 1.14 3.36 2.42 1.95 1.89 2.10 3.96 6.37 2.60France 2.32 0.90 2.02 1.82 2.34 2.83 0.75 4.39 5.38 4.09Germany 1.50 2.15 2.42 1.41 1.40 2.34 -0.40 6.64 5.29 4.50Italy 0.22 0.43 1.20 2.35 1.92 2.96 0.56 4.27 6.69 3.91Japan 1.87 1.72 2.11 1.88 3.42 3.41 -3.20 5.57 9.96 5.03Netherl. 1.44 1.26 0.98 1.07 2.44 -0.10 1.93 3.33 4.93 4.06Norway 1.39 1.96 1.17 2.02 2.78 2.61 1.88 4.03 4.52 3.66Sweden 1.76 1.95 2.70 2.62 2.40 2.66 3.43 3.43 4.79 2.55Switzerl. 1.59 1.37 1.47 1.26 3.18 1.01 1.52 2.98 3.69 1.91U.K. 1.63 1.20 1.24 0.90 1.44 0.87 2.21 2.19 3.56 2.77U.S. 2.28 1.86 1.96 1.98 2.39 0.74 4.03 2.41 2.51 1.92
Source: Williamson (1991).

Industrial Growth and Competition K. Simons, 2003
26
productive countries tended to catch up and gain a productivity more like that of themore-productive countries. However, convergence often has not occurred among less-industrialized countries; I only showed you the patterns among highly industrializedcountries.
Productivity growth stems in large part from spending on R&D and otherengineering improvements. Available figures are very imperfect, because it is difficult tomeasure R&D: many sorts of R&D and related engineering work are never recorded incorporate financial statistics. But the figures give a rough idea of the trends. In the early1960s, the US and UK spent about 2.5-2.7% of GDP on R&D, whereas France, WestGermany, and Japan spent less than 1.5% of GDP on R&D. By the mid-1970s throughthe mid-1980s, however, all five nations were spending around 2.5% of GDP on R&D(with France a bit lower, usually below 2%). However, much of the spending in the USand UK was on military or “defense” R&D, which may not benefit the economy as muchas nonmilitary R&D. West Germany and Japan were the biggest spenders on nonmilitaryR&D, with the US and UK nearly as low spenders as France after subtracting away themilitary-related R&D spending. So, the figures are definitely an undercount, but they tellus that many leading nations have increased R&D spending over time, catching up withthe US and the UK, and that much of US and UK R&D has been in the (lesseconomically beneficial) military category.
Differences between countries allowed industries to become efficient much morerapidly in some nations than in others. In this regard, for example, one might ask whyBritain lost its leadership in terms of productivity and economic power in the late 1800sand early 1900s, despite that it took the lead in the industrial revolution of the 1800s.Why did its industries improve so much less quickly that they were bettered by industriesin the US and Germany? The reasons are multiple and difficult to pin down, but variousresearchers have tried. Mowery and Rosenberg (1989), for example, attribute thefallback to three factors: the slow pace at which British firms adopted modern,hierarchical corporate structures; the country’s minimal financial support for technicaland managerial education and minimal encouragement of university-industry linkages;and the lack of curtailment of British cartels. Adoption of new corporate structures is asocial innovation, an organizational technological change that seemingly did yield bothhigher productivity and higher rates of other kinds of technological progress. Educationhas been and remains fundamental for workers to have skills used in innovative progress,and university-industry linkages have been particularly important in launching someindustries such as the early German chemical and dyestuffs industries. Cartel-bustingreduces price which yields short-term benefits as discussed above, although cartelssometimes retarded innovation so getting rid of cartels might have yielded moreinnovation. A fuller understanding of Britain’s leadership in the industrial revolution,and its subsequent loss of leadership, requires more detailed attention to its industries.
The Unbound PrometheusDavid Landes (1969), in his book The Unbound Prometheus: Technological
Change and Industrial Development in Western Europe from 1750 to the Present, relatesin detail how and why specific British industries fared relative to their continentalEuropean counterparts. This book is the key history of European industrial developmentfrom 1700 until shortly after World War II. The book first describes the Industrial

Industrial Growth and Competition K. Simons, 2003
27
Revolution in Britain, then the much slower Industrial Revolution in Continental Europe.Next it describes the “second industrial revolution” of the late 1800s and early 1900s, inwhich the German economy grew rapidly and the British economy fell behind relative tothe growth of other nations. Then it goes on to the interwar years, and finally to the post-1945 period. This section summarizes the book through its chapter on the secondindustrial revolution, excluding the period from 1914 on.
Chapter 2: “The Industrial Revolution in Britain.”The themes of British industrialization might be outlined in either of two ways.
First, the development of industry can be set in its broader social context, showing howthis context influenced industrial development and in turn how the industrial advanceshelped to transform society. Second, the development of industry can be understoodthrough a series of examples, showing the products and technologies involved and hencehow the processes of production were transformed through the Industrial Revolution.
The British Industrial Revolution is a story of how “change begat change” (p. 2), notmerely in the sense of new technology building upon old, but in terms of “a largecomplex of economic, social, political, and cultural changes, which have reciprocallyinfluenced the rate and course of technological development” (p. 5). Many historianshave debated what characteristics of Britain enabled it to undergo a sustained industrialrevolution before such a revolution occurred in any other country. Landes’ arguments,including the ones presented here, are by no means the end of the debate.5 But it seemssafe to summarize by saying that the economic and social milieu of Britain around theturn of the eighteenth century made possible a sustained industrial revolution. Britainwas probably the world’s most advanced economy at the time. It had a relatively openeconomy, without the trade barriers and business-limiting social customs that prevailed incontinental Europe. A large labor force was available in nearby Ireland and Scotland andelsewhere, and during the Industrial Revolution there was a large influx of workers fromthese regions (p. 116). Britain had an advanced system of banks and bank credit (pp. 74-76). Many of these enabling characteristics did not remain static during the industrialrevolution, but grew throughout. The banking system gradually expanded. Politicalpower initially held by the landed wealthy was gradually taken over by the new class ofmanufacturers. Cities and towns grew up around the new manufacturing centers such asLancashire and the Midlands (pp. 51-52, 122). A new transportation infrastructure wasinstalled at an exponentially increasing pace (pp. 46-47). Distribution structureswidened. The educational system expanded, and the government took on new functions.The Industrial Revolution resulted, not through any one leap but by a gradualtransformation, in an economic transformation. Labor and resources moved fromagriculture to industry. Many workers lost the work that had been their livelihoods, and,Landes claims, a widening gap developed between the rich and the poor (p. 7). Yetenough people had money to buy commodity goods, beyond just necessities, to create thedemand that, perhaps more than supply, made possible continuing industrial growth (pp.77-80). Also, growing exports to nations around the world reinforced the large demandfor standardized commodity products, produced with a mind toward large quantities asopposed to high quality (p. 53). Hiring became, more so than in the past, based upon
5 For more on Britain’s leadership in the industrial revolution, see among other sources Mokyr (1990).

Industrial Growth and Competition K. Simons, 2003
28
people’s skills rather than upon who knew whom (pp. 9-10). Labor became increasinglyspecialized (pp. 119-120). Perhaps most important, a new system of production, the“factory system,” developed in which workers served as “hands,” relatively unskilledlaborers who performed tasks assigned to them by their managers (pp. 114-123). Thefactory system made possible a rationalization of labor, including careful design ofworkplace layouts and organization; in a later era such rationalization would lead to theassembly line (p. 2). As to the contribution of the new factory system to the revolution ofindustry, Landes writes,
[T]he contribution of factory industry to the economy was out of proportion to its share of totalproduction. Thus the factory promoted a higher rate of investment, hence of growth, than otherforms of manufacture. (p. 121)
Landes apparently views the development of the factory system as a centraltransformation that enabled the rapid “change begat change” growth of the BritishIndustrial Revolution.
If this revolution is analyzed in terms of the exemplary products and technologiesthat made it happen, four such products and technologies stand out. These are textiles,iron, the steam engine (and the coal that fueled it), and chemicals. Textile manufacturingwas transformed initially for cotton textiles. While the wool industry was larger (p. 82),and while the first transforming inventions were designed for wool (p. 84), cottonproduction could be mechanized more easily because of its easier-to-handle plant fibers,and because for cotton the supply of raw material was more elastic (p. 83). The textileindustry became a first example of the new factory system. The iron and steel industrygreatly increased in productivity through advances in manufacturing methods. Thesetechnological improvements did not entail a transformation to the factory system, becausethe pace of human workers was driven more by human decisions than by the pace ofmachinery. The technological improvements in iron production came mostly fromgradual advances. These advances had to do with adaptation of existing smelting andrefining techniques to new ores and fuels, changes in furnace design to economize on theamount of fuel used, reduction of waste of metal, and increases in production volumes(pp. 89-95). The iron industry was fueled by coal, and digging ever-deeper into theground to get more coal led to problems with water flooding the mines (pp. 96-97). Tosolve this problem, steam engines were put to use, and thus began the development of atechnology that eventually came into use throughout many kinds of industry (pp. 100-104). Steam engines diffused gradually as the technology developed; for example waterpower continued to be used for a long time in the woolen textiles industry, because waterwheels provided smoother power than did steam engines (p. 104). Development of thesteam engine required revolutions in metallurgy and the construction of precisionmachinery (pp. 103-104). The chemical industry grew up largely in response to the needsof other manufacturing industries, notably, textiles, soap, and glass (p. 108). In thechemicals industry, “one compound leads to another” (p. 109), and continualtechnological advance occurred as manufacturers tried to create new chemicals in placeof old ones whose properties were not ideal. More in the chemical industry than in otherindustries, scientific research drove technological advance, although the research tendedto be trial-and-error in contrast to today’s rational chemical science (pp. 113-114). Theseproducts and technologies were the most outstanding of the period of Britishindustrialization.

Industrial Growth and Competition K. Simons, 2003
29
Of the changes that took place in Britain during the 1700s and early 1800s, whatthemes are most important? Landes summarizes the developments of the IndustrialRevolution with three “material changes” that he sees at the heart of the Revolution. Thefirst is the substitution of machines for handiwork. The second is the development ofsteam power. And the third is the improvement in getting and working raw materials, inparticular, metals and chemicals. While these themes cannot tell the whole story of theindustrial revolution, certainly they were inextricably enmeshed in the “change begatchange” processes of the British Industrial Revolution.
Chapters 3-4: “Continental Emulation” and “Closing the Gap.”The Industrial Revolution was a long time in coming to Continental Europe, but
when it came, it came swiftly. In the late 1700s and especially the early 1800s, themanufacturing techniques of Britain began to diffuse into the Continent, but by 1850 theContinent still had not achieved the industrial transformation seen in Britain. From 1850to 1873, however, Continental Europe experienced its own rapid industrialtransformation, bringing it into the same industrial league as Britain, though not quitemaking it an economic equal.
In the 1700s, Western Europe had the social and economic ingredients needed foran industrial transformation, but the social and economic milieus still could useimprovement. Western Europe was quite developed economically and culturally, thoughnot so much as Britain (p. 125). And its politics and cultures slowed down the area inbecoming more centralized (p. 125) and more open to the idea of profit-making industry.But its industries initially were small and fairly independent, spread geographicallyacross the Continent and the countrysides (p. 133). Worse, both the domestic industriesand the exporters began to be smothered by inexpensive imports from Britain (p. 138).This pressure not only confined producers to local markets, but gave them scaledisadvantages with the latest large-scale equipment. A series of wars beginning with theFrench Revolution set back technical advance in the Continent, destroyed capital, andgave Britain more time to advance still farther technologically (pp. 142-147). In relationto Britain, producers on the Continent were left in a poorer competitive position, and atthe end of the wars were reluctant to invest in expensive best-practice productiontechnologies (pp. 145-147). At least the wars accomplished one gain: they brought a newsense of freedom, which would help to make possible industrial development (pp. 144-145). Transfer of British equipment and production techniques to Europe was very slowas of 1800 (pp. 139-142), but throughout the 1800s the influx of technology, artisans, andequipment increased. British law forbade emigration of artisans until 1825 and export ofthe most valuable technology (e.g. major textile inventions) until 1842, but nonethelessartisans and technology leaked out (p. 148). A shortage of skilled mechanics inContinental Europe was remedied by transmission of skills from British immigrantworkers to European workers and thence to other European workers (pp. 147-151).Schools, fact-finding missions, and technical advice and assistance, all mainly providedby governments, also assisted in the diffusion of British manufacturing methods (pp. 150-151). In addition to technology diffusion, transportation improvements assisted thedevelopment of the Continental economy. Road, river, and canal travel increased infrequency, speed, and vehicle size (p. 153). Railroads were important not for anyimmediate revolutionary decrease in transportation costs (some key rail connections were

Industrial Growth and Competition K. Simons, 2003
30
not made until the 1850s and 1860s), but because they stimulated industrial growth (p.153). They created a great demand for iron and other raw materials, and they requiredpeople to work these materials into the relevant parts. Gradually, it became easier to getcredit for investment, partly because of an infusion of funds from investors in Britain (pp.154-158). These changes led to some limited transformations of the Continentalindustries by 1850.
The story of the transformation of these industries is best told through adiscussion of the industries. A cotton textile industry grew up that was moretechnologically progressive than in the past, and to a much lesser extent the samehappened in the woolens industry, but neither compared to Britain either in its state oftechnology or in its overall volume of production (pp. 158-174). The heavy industries ofiron and coal were the leading industrial sector to drive the Continental economic growth(p. 174). Cheap ore and coal in some regions, combined with high transport costs, gavean advantage to local manufacturers and helped to remove competition from Britain (p.174). The industries saw a considerable diffusion of new manufacturing techniques, butalso, with little competitive pressure to enforce low-cost manufacture, manymanufacturers simply expanded their use of old techniques (p. 175). Improvements inthe iron industry came from a shift to mineral fuel (coal) instead of plant fuels, and fromimprovements in the construction and operation of plant and equipment (pp. 175-180).Higher fuel costs than in Britain stimulated technological innovations that had not yetoccurred in Britain, but the British iron industry still used larger equipment and achievedlower costs (p. 180). Steam engines in the 1700s almost all came from Britain, but by the1820s a Continental industry developed first in France and then in Belgium. Anemphasis on fuel economy led to faster technological advance than in Britain (pp. 181-182), and the Continental industry did more “improvisation,” and hence came up withmore inventive ideas, than the British industry (p. 184). However, production quantitieswere low and there was no standardization of the finished goods (p. 183). Production ofsteam engines and other machines was driven by demand from at first mining andmetallurgy and then the construction of the railroads (p. 184). But most Continentalmanufacturers relied on water power rather than steam power (p. 182). The chemicalsindustry in Continental Europe was small, in part because of the small demand fromtextile manufacturers (p. 185). The small demand, combined with high transportationcosts for both raw materials and output resulted in small-scale, high-cost production (p.185). Thus, the transformation of Continental industry by 1850 was limited.
Continental Europe was still about a generation behind British industrial methods(p. 187). As a result, it was more rural; in 1851, about half of the English and Welshpopulation lived in towns, but only about a quarter of the French and German population(p. 187). Industry was dispersed throughout the countryside, first to take advantage ofrivers for water power, and second to support the metallurgy and mining industries whichhad to be close to the sources of their raw materials (p. 188). The old putting-out methodof work increased with the proliferation of cheap materials and with a ready supply ofcheap rural labor (pp. 188-190). In the Continent, as opposed to Britain, labor unrest anda revolution by the underclass were seen as reasonably likely, factory owners felt aresponsibility for the welfare of their workers, and governments intervened (especially inFrance) to regulate hiring and firing (pp. 190-192). The biggest transformation was yet tocome.

Industrial Growth and Competition K. Simons, 2003
31
Between about 1850 and 1873, rapid economic changes took place on theContinent. Key industrial indicators such as railroad mileage and steam-power capacitygrew at an average rate of about 5-10% per year (pp. 193-194). There were many stimulito this rapid growth (pp. 196-210). First, there was a temporary break with socialtraditions that had hindered industrial development, and Western Europe experiencedentrepreneurial freedom (pp. 196, 200). Laws were passed to allow the easy formation ofcompanies and to otherwise smooth economic processes (pp. 197-199). Internationaltrade was eased by the elimination or reduction of traffic restrictions and levies forwaterway traffic, a simplification of profligate varieties of currency, and treaties whichlowered tariffs (pp. 199-200). The final key railroad links were finally installed. Therailroads decreased transportation costs, and hence they increased competitive pressurebetween regions and helped to force producers to become efficient (pp. 196-197, 201-202). New coal beds were brought into production, and new raw materials were imported(guano for fertilizer, wool and hides, vegetable oils for producing soap and candles,sulfides, and pyrites) (pp. 202-204). An increased money supply made it easier forentrepreneurs to get loans (pp. 204-205). In what Landes calls the “financial revolution”of the 1800s, demand for and supply of banking services increased (pp. 205-210). Smalltradesmen and people from rural areas entered the money market for the first time (p.206). And larger, richer investment banks grew up to seek out large investors; thesebanks were especially useful where there were many opportunities for investment but fewsources of funds, as in Germany (pp. 206-210). These stimuli resulted in importantchanges in Continental industry.
Important industrial advances occurred, along with production by every-largerfirms and a new regionalization of industry. The textile manufacturing industry finallymechanized (pp. 211-215). The iron and steel industries completed their conversion fromvegetable to mineral fuels (pp. 215-219). Steam power came into widespread use (pp.220-221). The scale and concentration of industrial production increased steadily,particularly in the heavy industries such as iron (pp. 222-225). And industries relocatedand manufacturing centers grew up, often near the sources of raw materials or atconvenient rail locations (pp. 226-228). By 1873, most industries in Continental Europehad still not achieved the same technological status as comparable industries in Britain,but they were much closer, and the Continental economy had completed a revolutionarystep forward.
Chapter 5: “Short Breath and Second Wind.”Landes addresses specific growth industries and technologies that were key
determinants of the new balance of European industrial competitiveness emerging fromthe second industrial revolution. Developments in steel, chemicals, and electrical powerhelped to drive a shift in relative industrial power away from Britain and towardGermany. This is not to say that the stories of these industries entirely explains this shiftin national competitive advantage. But these industrial developments are a key tounderstanding the overarching reasons for the shift in industrial competitiveness.
Steel, a variety of iron, had been produced for centuries, but as of the mid-1800smost production was of other types of iron (pp. 251-254). Steel had advantages overthese other types. It was (and is) stronger, more plastic, harder, and, in many ways, moreeasily worked (p. 251). But it was also difficult to produce, so its high cost limited its

Industrial Growth and Competition K. Simons, 2003
32
application mainly to small, high-cost items such as watches and to weapons (pp. 251-254). Two technological advances that cut costs radically, the Bessemer and Siemens-Martin processes, came in the 1850s and 1860s (pp. 255-257). However, since thesemethods were only useful with non-phosphoric ores, and since non-phosphoric ores wererare in Europe, use of these techniques grew slowly. In 1878-1879, Thomas and Gilchristdevised a method to put limestone into the molten iron, resulting in a slag which formedby the combination of the limestone with any phosphorous in the ore (pp. 257-259). Theslag could be drawn off, leaving the metal free of phosphorous. For the first time, thephosphorous-rich ores of Europe could be used to efficiently produce steel. The resultwas a rapid rise in steel production, largely replacing wrought iron by around 1900.Germany developed a competitive advantage over Britain in the industry. Britain, withits different ores, tended to use the Siemens-Martin process, which placed it on asomewhat different technological front from the Continent (p. 262). On the Continent,continual innovation led to a high-quality product, while British steel remained irregularin quality (p. 263). German firms integrated blast furnaces with smelting operations andin turn with rolling, but in Britain these operations remained separate, so the Germanfirms gained cost advantages over British producers (p. 263). Automation also reducedcosts, especially in Germany (pp. 265-268). Germany developed much larger steel plantsthan Britain, with for example blast furnaces that were two-thirds larger than Britishfurnaces in 1910, and firms that were four times larger on average around 1900 (pp. 263-265). Landes writes, “The whole situation was self-reinforcing” (p. 263). Over theperiod 1870-1914, the British lost their leadership in steel to Germany.
Similar developments occurred in chemicals. Of the chemical industries in theperiod, two involved key technological advances and played major roles in overalleconomic development. The first industry is alkalis. Demand for alkalis grew rapidly, asthey were used in the manufacture of textiles, soap, and paper (p. 270). From 1852 to1878, output in Britain, initially the leading producer of alkalis, tripled (p. 270). Butproduction of alkalis was expensive because it required an expensive ingredient,ammonia (p. 271). It was clear that it should be possible to recover ammonia from theproduction process, and much work had been done to try to devise a method of recovery,but not until the early 1860s was the problem solved by Ernest Solvay (pp. 271-272).The process took a decade to perfect, but by the mid-1870s it began to be used inContinental Europe, and resulted in soda (alkali) that could undersell soda from theBritish industry by about 20%, mostly because of lower materials costs (p. 272). Thenew technique spread rapidly in France and Germany (p. 272). But Britain laggedbehind. British producers had large investments in their existing Leblanc soda industry,and they did not want to abandon these investments (p. 272). They managed to cut costswhile using existing equipment, among other ways by introducing more efficientequipment and by recovering and selling chlorine as a by-product (p. 272). In the 1890s,though, new electrolytic production methods, used mainly in the US and Germany,competed with the British industry and made it less profitable, and profits were hurt stillmore by growing foreign protectionism (pp. 272-273). For the first time since thebeginning of the Industrial Revolution, output in the British industry decreased (p. 273).German output rose at the same time (p. 273). By 1920, Britain’s Leblanc soda industrywas shut down (p. 273).

Industrial Growth and Competition K. Simons, 2003
33
The second chemical industry is organic compounds. Germany and Britain bothdid the initial theoretical and experimental groundwork for this industry throughout the1800s (p. 274). At first, Britain, and to some extent France, led the industry (p. 275).British manufacturers had the advantage of a good location for supply of raw materials,and the French benefited from a large demand because of that country’s “emphasis onhighly coloured, imaginatively designed fabrics” (p. 275). Again, though, Britain lost itsindustrial dominance. British firms had to compete against the strong science andenterprise present in Germany, and in a “spiral of decline” the British were outcompetedin cost by the Germans and venture capital was scared away from the British industry (p.275). In France, a costly patent war in the 1860s ruined many firms. German dyestuffsproduction was small as of the late 1860s, but by the late 1870s German firms had abouthalf the world market, and by 1900 about 90%. In practical terms, the German influencein the market was even higher, because German firms had subsidiaries and affiliates inother countries. Switzerland managed to carve out niches of the dyestuffs market byconcentrating on tints requiring especially careful production, by helping customers withthe latest technical advice for dyeing, and by importing raw chemicals and intermediatesfrom nearby Germany (and perhaps France also) (p. 276). Germany’s new lead indyestuffs gave it yet another industry to help it rise to economic preeminence.
The new electrical power industry also assisted in this rise to preeminence.Around 1880-1900, central power generation and electrical power networks developed(p. 285). Initially, incandescent lighting provided a demand for electrical power, butlighting was soon surpassed by industrial uses of electricity: railway traction, electro-chemistry, electro-metallurgy, and electric motors (pp. 287-288). The first public powerstation in Europe was built in 1881 at Godalming, England (p. 285). Initially, apatchwork of different standards sprang up, and especially in Britain the individual powernetworks were costly to interconnect (p. 285). The Germans took the lead in large-scaleelectrical generation, at first using waste heat from blast furnaces (pp. 286-287). Largerscale gave production economies and meant a smoother demand since more users (andmore diverse users) were involved (p. 286). Germany again started late, but quicklydeveloped as the industry leader, in part because of its “technical excellence” and“rational organization” (pp. 289-290). Not only did the German steel industry assist inthe development of large-scale power generation, and the German chemical industryassist in creating demand, but also the availability of electrical power led to atransformation of the factory and further economic growth (p. 288). Electricity madepossible more home and shop industries and small plants. In addition, new uses forelectricity and cheaper power led to new economic investment. Thus the Germanexperience of electrical power generation illustrates how one industrial development ledto another in the burgeoning of the German economy during the second industrialrevolution.
In addition to this story of industrial development, other themes are relevant toexplaining the advance of Germany and the decline of Britain during the “secondindustrial revolution.” It is very well to say that Britain got onto a downward spiral, andGermany onto an upward one, but what other influences were involved, and mostimportantly, how did the spirals get started? One can only speculate on the reasons, andLandes (pp. 326-358) does just that. Here are many of his speculations, with a bit of myown commentary. Britain was developing its service sector at the expense of

Industrial Growth and Competition K. Simons, 2003
34
manufacturing (pp. 329-330), presumably because demand shifted to services as people’sincomes increased. The service industries did not have the same potential for efficiencyimprovements as did manufacturing industries. There may have been some resistance tochanging manufacturing methods because of “interrelatedness,” the way a wholeeconomic structure grows up to support and rely upon each method (pp. 334-335).Perhaps the owners of British firms were relatively complacent, since they were merelythe well-off grandchildren of the people who created Britain’s Industrial Revolution (pp.336-337). Apparently, though, at least some British manufacturers reacted withimagination and vigor to foreign competition just before World War I (p. 338). Britishindustry may have grown less competitive inside the country (pp. 338-339) and hence,with less threat of failure, had less incentive to innovate and become more efficient. Ascarcity of skilled workers, engineers, and scientists, in part caused by poor attendance inBritain’s schools, might have contributed to Britain’s downslide relative to Germany (pp.339-348). Indeed, this would explain why Germany managed so readily to take the leadat scientific innovations important in the development of industry. Britain’s relativescarcity of skills and knowledge contributed to an inadequate supply of venture capital(pp. 348-354). The scarcity of skills and knowledge also could have contributed toBritain’s slow progress in adopting methods of standardization, compared to Germany’srapid progress (pp. 315-317). In summary, a great many possible reasons are availableto explain why the spiral advance of Germany and decline of Britain got started, but thereis no clear right answer. The point is simply that Britain exchanged its economic leadwith the US, Germany, and other parts of the Continent through the process of the secondindustrial revolution, and industries and technologies including steel, chemicals, andelectricity were essential to the transformation.
Joseph Schumpeter and the Schumpeterian HypothesisJoseph Schumpeter, in the 1940s, likewise pointed to the importance of
productivity growth and new products in driving economic advance, and argued that thetraditional focus on reducing anti-competitive practices was misplaced. In fact, he wenteven further, and argued that large firms and monopolies (by which he also meantoligopolies) are the primary source of rapid economic progress! By trying to stop anti-competitive practices, Schumpeter argued, economists and governments were irreparablydamaging the economy! Economic growth and the creation of new products weresupposedly being harmed by governments limiting the power of monopolists. IfSchumpeter was right, we could have been living today in a world with much cheaperprices, and far more new and useful technologies than exist, if past governments had beensupportive of large corporations and monopolies. (Schumpeter’s arguments appeared inchapters 7-8 of his book Capitalism, Socialism, and Democracy.)
Was Schumpeter right? Yes and no. Judging from the best available evidence todate, it seems that large firms are best for innovation in some situations and small firmsare best in others. To characterize crudely, part 2 of this course will address situations forwhich small firms are either better or okay, and part 3 will address situations for whichlarge firms are better.
Some of Schumpeter’s notions were labeled “the Schumpeterian hypothesis” byother economists. In particular, the Schumpeterian hypothesis is that larger firms arebetter at producing innovations than small firms. Specifically, the hypothesis is often

Industrial Growth and Competition K. Simons, 2003
35
defined by empirical researchers in terms of a firm’s amount of successful innovation perunit of its size. For example, a researcher might measure a firm’s number of patents in ayear divided by its number of employees, or count the innovative changes appearing inthe firm’s products and divide by its capital value. The researchers then test the so-calledSchumpeterian hypothesis by seeing whether large firms tend to have higher values thansmall firms of (R&D output) / (firm size).
British Industry and Technological ProgressBritain, like other countries, has some traits that support rapid technological
progress, and other traits that harm progress. The chapter assigned to you by WilliamWalker (1993) makes several conclusions, as listed below.6 [Possible policy conclusions,my own rather than Walker’s, are noted in brackets.]1. Britain in past had strong manufacturing industries, but by the 1900s it had begun to
cede much of its international leadership to other nations. It remains strong in serviceindustry, but not so strong in manufacturing. [Unless the British government expectsto be able to depend on service industries to sustain its economy and internationaltrade in future, successful ways of improving Britain’s manufacturing industries – tothe extent they can be found – would be useful. Service industries may turn out to bea quite productive economic sector in future, but a better understanding is needed ofhow much and how productivity growth can be achieved, as compared tomanufacturing.]
2. Britain has strengths in a few manufacturing industries, including pharmaceuticalsand military aerospace.
3. Large percentages of UK government budgets have been devoted to the military, andthis has benefited Britain’s arms industry, including aerospace. However, channelingfunds and top researchers into the relatively secretive arms industry may havedamaged other British industries, which benefit from neither substantial spin-offinnovations nor the top-notch researchers who have been sucked up by the armsindustry. [Reallocate government funds appropriately, paying for researchers to workin other, more commercially productive industries or in universities, rather than inarms industry. This might be done through incentive schemes to firms, tax breaks,funded R&D centers, or increased funding to research grant schemes. Ideally, find away to do this that does not compromise national security needs, perhaps in part byfunding industries or R&D areas that can benefit key technologies that relate to thenation’s ability to continue economically should war break out, or by fundingtechnology areas in which skills might eventually prove critical.7]
4. University education has recently been providing adequate skills for many careers,but few students in Britain gain the skills needed for engineering work or for appliedsciences – other nations train many more such students as a percentage of theirstudent-age populations. Thus, there is a shortage of computer programmers,electrical engineers, industrial engineers, etc. [Target additional funding to
6 See other chapters in the same book for similar analyses of other nations.7 The government’s recent moves to privatize much of its military R&D may greatly diminish informationexchange flows with US military R&D laboratories, because British R&D personnel (as opposed tobureaucrats with less direct knowledge of technologies) will be in private companies with which the USmilitary limits information exchange to retain US firms’ competitiveness.

Industrial Growth and Competition K. Simons, 2003
36
educational programs that train these sorts of people, at least as long as there are notsubstantial percentages of people with these skills who are unable to find jobs whenthey enter the workforce. Woo greater student interest especially at pre-universityeducational levels, to give students relevant skills and motivation.]
5. There is a British culture that looks down on engineers and up on bankers and literati.This discourages youths from pursuing engineering careers, relative to other nationswhere engineering is seen as valuable to society, intelligent, creative, and a sign ofpersonal eminence. [Politicians should change their mindsets and seize opportunitiesto project a new and better image of engineering through speeches, education,funding opportunities, national museums, etc.]
6. British politics has a large old-boy network of Oxbridge graduates who are stuck inthe mindset that bankers and literati are good, while engineers with greasy overallsare bad. Government has been relatively supportive of some industries such asfinancial services, but the lack of politicians’ understanding of manufacturingindustry needs has led to poor government support for most manufacturing industry.[Government should consult industry representatives more closely about policy (I’mnot addressing unions here) and try to be supportive.]
7. Government funding for R&D has been modest compared to other leading industrialnations, and has been quite low in non-military sectors. [Put more money intoappropriate non-military R&D in Britain, through grants, research institutes, fundingof universities, or other means.]
The Basic Model of Economic GrowthA large sub-field of macroeconomics analyzes economic growth. Growth models
for countries or the world almost always fit the form:y = A(t)׃(k),
where y is the amount produced per person, A(t) is a productivity measure that increasesover time, ƒ() is a production function, and k is the amount of capital per person. It iscommonly assumed that the production function ƒ() involves decreasing returns to scale;suppose this is the case.
The amount of capital per person changes over time because of (a) “depreciation”of machinery, buildings, and other goods when it wears out or breaks down; (b)investment in new capital to be used for future production; and (c) change in the numberof people. Assume the number of people remains constant. An equation for the changein capital per person then might be:
dkdt
h y k= − −( )1 δ ,
where h is the fraction of production that is consumed and δ is the fraction of capital thatdepreciates per year.8
8 Note how the units of measurement are consistent. k is measured as a dollar value of goods, so dk/dt ismeasured as a dollar value of goods per year. 1 and h are dimensionless, so (1-h) is dimensionless, but y ismeasured as a dollar value of goods per year; hence (1-h) times y is measured as a dollar value of goods peryear. δ is measured in units of “per year,” so δ times k is measured as a dollar value of goods per year.Hence the left-hand side, and the terms added together on the right-hand side, have identical units ofmeasurement. Were the units of measure not identical, there would clearly be something wrong with theequation.

Industrial Growth and Competition K. Simons, 2003
37
Figure 3.1. Production over Time in Growth Model with No Productivity Growth
0 2 5 5 0 7 5 1 0 0Years
0
5
1 0Product ion
Now, to understand a key fact about the results of the model, consider how themodel economy would develop if the production function ƒ() took the form k0.5, kstarted out at 1 at the beginning of year 0, half of production were invested (h = 0.5), andcapital depreciated at a (continuous) rate of 5% per year (δ = 0.05).
Consider first the case in which there is no technological progress, so that A(t) = 1for all t. It is easy to compute the results of the model by computer. I have done so(using a program called Stella to facilitate the process; if you so desire you can use thisprogram at the Royal Holloway Computer Center – look in the Economics directory ofprograms). Figure 3.1 shows the resulting amount of production over time.
After a short time, the decreasing returns to the production process cause annualgains in production to grow less. Nonetheless, there is a great increase in amountproduced over the 100-year time span shown in the graph: output rises by more than ninetimes, and it is heading toward an equilibrium level ten times the initial amount of output.Consumers can consume much more over time, and hence (it is generally presumed insuch models) grow happier.
What if there is ongoing productivity growth? Consider a growth rate of 3% peryear, so that A(t) = exp(0.03×t). As seen earlier in this chapter, this productivity growthrate has been typical for developed countries in the 1900s. How much does theproductivity growth matter to production?
Figure 3.2 shows a graph of production versus time similar to the one justpresented. In just 18.6 years, production exceeds the equilibrium of 10 that would resultwithout productivity growth. And production continues to shoot up thereafter. After 100years, production has grown by a multiple of 1,827! As you can tell, productivity changeis enormously important to economic growth in the basic macroeconomic growth model.

Industrial Growth and Competition K. Simons, 2003
38
Figure 3.2. Production over Time in Growth Model with 3% Annual Productivity Growth
0
91 4 .06
1 82 7 .12
Product ion
1 11
1
0 2 5 5 0 7 5 1 0 0Years
ConclusionTechnological advance, broadly defined, has been the primary source of economic
growth. To stimulate economic growth, therefore, the most promising policies are anymeans that yield greater rates of technological progress. There are many means to suchinnovation, and this chapter has touched on several, including: transfer of skills betweennations, education, social attitudes that support innovation, and national R&D funds. Inthe end what matters of course is the productivity improvements within the myriadcompanies (and government and nonprofit organizations) that compose a productiveeconomy. The coming sections of the course will have much to say about how thesecompanies operate in their respective industries, and how competition affects and isaffected by technological change.
Study Guide
Terms to KnowRobert Solowconsumer price indexinflation-adjustedhedonic price indexconvergenceThe Unbound PrometheusJoseph SchumpeterCapitalism, Socialism, and Democracydepreciation

Industrial Growth and Competition K. Simons, 2003
39
Key Reading with QuestionsWalker, William. “National Innovation Systems: Britain.” In Nelson, Richard R., ed.
National Innovation Systems. New York: Oxford University Press, 1993. Chapter 5,pp. 158-191. O B R 338.06 NAT. Gives an overview of industrial innovation inBritain. If you are from another country, the book might have a chapter about yourcountry too.
1. After Britain’s industrial revolution, why might the country have lost its industrialleadership and begun an economic decline? Describe the three explanations that Walkermentions.
2. How important is manufacturing in the British economy? First, explain with referenceto specific percentages of GDP or employment. How does this compare with othercountries? Second, Walker seems to imply that manufacturing is especially important forthe country’s future. What reasons might he have for saying so? Are there other reasonsfor or against this idea?
3. What are the main sectors of manufacturing in Britain, and (as of a decade ago) whatfraction of national production did they constitute? Which of these sectors were thebiggest exporters? To what extent were they under British ownership versus ownershipby people or companies outside Britain? Be specific.
4. Table 5.6 in W. Walker’s paper gives you some idea of the distribution of (US) patentsgranted to firms in different UK manufacturing sectors. For example, whateverpercentage of patents are granted to UK chemicals manufacturers (the table doesn’tindicate what the percentage is), the percentage is only about half as much as that amongUK aerospace firms. In contrast, the percentage of patents granted to Japanese chemicalsmanufacturers is about five times the percentage granted to Japanese aerospacemanufacturers. This seems to suggest that the aerospace industry is much more importantin the UK economy than in the Japanese economy. What other differences are therebetween the UK and other countries?
5. How did UK R&D in 1986, as a percentage of GNP, compare with that in othercountries? How did government R&D spending per person compare? What has been thetrend over time in R&D spending? On what have the R&D funds been spent?
6. What weaknesses does W. Walker identify in Britain’s innovation system? Whatchanges does he recommend for government policies?
Yates, Ivan. “An Industrialist’s Overview of Manufacturing and Economic Growth.” InYates, Ivan, ed. Innovation, Investment and Survival of the UK Economy. London:Royal Academy of Engineering, 1992. Chapter 1, pp. 5-24. B check call number incatalog (new addition). Argues the importance of manufacturing industry, and theinnovative change that drives its growth, for the UK economy. Useful though at points

Industrial Growth and Competition K. Simons, 2003
40
sloppy (e.g., the triangle drawn on fig. 3 is unnecessary and inappropriate: why shouldit point at 0 instead of –3 or +0.2?).
1. How important is manufacturing to the UK economy, and to the economies of othernations?
2. Why does Yates think that Britain’s manufacturing sector is below its optimal size?
3. Is R&D funding high or low in the UK compared to France, Germany, Japan, and theUS?
4. How does Britain’s annual value added per employee compare with that of othernations?
5. Why does Yates think that there is “short-termism” in UK R&D investment?
Walker, John. “Service Sector Adjustment and the Implications for Manufacturing.” InYates, Ivan, ed. Innovation, Investment and Survival of the UK Economy. London:Royal Academy of Engineering, 1992. Chapter 3, pp. 45-51. B check call number incatalog; same as above. Presents evidence that service industries are unlikely toprovide a strong growth impetus for the UK economy (unless unanticipated growthareas in services can be created through innovative approaches to service industries).
1. What two arguments are commonly invoked for why the UK does not need a strongmanufacturing industry?
2. How does J. Walker refute the first of these arguments?
3. How does J. Walker refute the second of these arguments?
4. What does J. Walker argue can be done to help the manufacturing sector propeleconomic growth in the UK?
Further ReadingsChandler, Alfred D. The Visible Hand: The Managerial Revolution in American
Business. Cambridge: Belknap (Harvard University Press), 1977. B 338.75 CHA. Amonumental document that provided for the first time an integrated history ofAmerican industry from the 1700s into the 1900s.
Chandler, Alfred D., Jr. Scale and Scope. Cambridge, MA: Harvard University Press,1990. B R 338.644 CHA. Another monumental document, analyzing industrial historyin the United States and Europe during the 20th century.
Hounshell, David A. From the American System to Mass Production, 1800-1932.Baltimore: Johns Hopkins University Press, 1984. B 338.644 HOU.
Landes, David S. The Unbound Prometheus: Technological Change and IndustrialDevelopment in Western Europe from 1750 to the Present. Cambridge: Cambridge

Industrial Growth and Competition K. Simons, 2003
41
University Press, 1969. B 338.94 LAN. The key history of European industrialdevelopment from 1700 until shortly after World War II.
Mokyr, Joel. The Lever of Riches: Technological Creativity and Economic Progress.Oxford, 1990. R 338.06 MOK. A seminal history and analysis of technologicaladvance, mostly in the western world, over more than two millennia; illustrates thefundamental role of technical change in economic growth.
Mowery, David C. and Nathan Rosenberg. Technology and the Pursuit of EconomicGrowth. Cambridge: Cambridge University Press, 1989. B 338.06 MOW.
Pratten, Clifford F. “The Manufacture of Pins.” Journal of Economic Literature 18(March), 1980, pp. 93-96. E.
Rosenberg, Nathan. Inside the Black Box: Technology and Economics. Cambridge:Cambridge University Press, 1982. B 338.06 ROS. Chapter 1 is an excellent overviewof the role of technological progress in economic growth over a long time span.
Scherer, F.M. and David Ross. Industrial Market Structure and Economic Performance,3rd ed. Boston: Houghton-Mifflin, 1990. R 338.758 SCH. Chapter 17 considerstechnological change; focus on the earlier parts of the chapter, pages 613-630 in thebook’s third edition.
Solow, Robert M. “Technical Change and the Aggregate Production Function.” Reviewof Economics and Statistics 39 (August), 1957, pp. 312-320. O J E. This paper, whichin part led to Solow’s Nobel prize, analyzes the extent to which US labor productivitygrowth from 1909 to 1949 stemmed from increased capital intensity. The answerstunned many economists of the time: capital apparently was of little relevance toproductivity growth; technological advances and increased skill of workers apparentlycontributed over 80% of the labor productivity growth.
von Tunzelmann, G. N. Technology and Industrial Progress: The Foundations ofEconomic Growth. Aldershot, UK: Edward Elgar, 1995. B 338.06 VON.

Industrial Growth and Competition K. Simons, 2003
42
4. Sources of Invention: Small Firms and InnovativeNetworks(Week 2)
As economists, we’d like to find ways to (1) encourage the creation of newproducts, (2) improve the features and quality of existing products, and (3) reduce costsof production. As part of finding ways to spur technological improvement, it helps toknow some of the determinants of invention and innovation:1. Firm size: Do large or small firms innovate more? Why?2. Individuals who create innovations: Do inventions and improvements come from
people within a firm? Or do they come from customers, suppliers, or outsideinventors? What types of inventions/improvements come from which people?
3. Regional agglomerations of firms: How does the local community around a firmaffect that firm’s innovative success?
Just as firm size, individuals, and regional traits affect the amount and type of inventionand innovation, so do successful invention and innovation affect the sizes of firms, thecharacter of individuals, and the fortunes of regions. An important example is howinnovative success or failure may result in the growth or stagnation of whole regions, asanalyzed by Jane Jacobs (1969) in her book The Economy of Cities.9
After completing this section of the course, you should understand the abovebasic influences on innovation or invention in firms, and you should understand JaneJacobs’ main point about the role of innovative ideas in affecting the growth of cities. Anexception is firm size, which will be covered mostly in week 3.
Firm SizeStudies of innovation by firms have checked to see whether small or large firms
innovate more. Some of the conclusions we’ll discuss next week, but for this week notethat:1. Lots of issues are more important than size in determining which firms innovate
more.a) The industry in which firms participate. Suppose you compare the aerospace
industry versus the soft drinks industry. It’s no surprise that aerospace firms havebigger R&D budgets, in absolute terms or as a percent of sales or profits, than softdrink firms.
b) The culture of the firm, how it’s organized, and the skills of people in the firm.Some firms have a belief in being technology leaders, while others pay moreattention to costs or marketing. Some firms involve factory workers in coming up
9 It is easy to imagine the effects of innovation and invention on firm sizes and on individuals’ characters.Firms that succeed as innovators may expand. Individual inventors whose ideas are commercialized maybecome wealthy and skilled and invent more (as with Thomas Edison, who harnessed his profits to fund alaboratory full of workers who steadily developed further inventions), or may instead spend decades inunsuccessful legal battles to try to capture some of the profits from their inventions (as with John Sheehan,whose MIT laboratory developed synthetic methods to make and modify penicillin).
Industrial Growth and Competition K. Simons, 2003
43
with ideas to improve the production line, while others separate the jobs of theirengineering staff and line workers. Some firms have executives, scientists, andengineers with the necessary skills to succeed with a technology; others don’t.
2. Consider firms in the same industry with similar culture, organization, and employeeskills. Among these firms, large size seems beneficial for some types of innovation:a) Firms with large market shares seemingly have the advantage for the many
incremental changes that improve a product and reduce its manufacturing cost.(We’ll discuss this next week.)
b) Small firms, however, are relatively free of bureaucratic problems and incentiveproblems that may get in the way of major inventions. The managers of largefirms are often charged with blocking important inventions that have little to dowith a firm’s existing products or markets, or especially those that would replacethe firm’s existing products, because they want to focus on what the firm alreadydoes.
3. In a classic book entitled The Sources of Invention, Jewkes, Sawers, and Stillerman(1959) discussed some of the issues that help to determine which firms andindividuals are the sources of invention. They considered only major new products,not incremental improvements in technology. Through a series of case histories, theypointed out that major inventions come from many sources – large firms, small firms,and individuals. Thus, they argued, it would be wrong to think that large firms arenecessary for invention to occur.
4. Often, the term invention is used to mean the initial creation or discovery of an idea,while innovation is used to mean the commercialization of the idea. In practice, theinnovation part of the work almost always requires far more money, and far morework by scientists and engineers, than the initial invention. For example, thediscovery of penicillin by an individual – Alexander Fleming in 1928 – did not leadto a commercial product until a massive development program during World War II,when thousands of scientists and engineers came up with viable, affordableproduction methods. Large firms, not small firms or independent inventors, madecommercial production of penicillin a success.10 Large firms seemingly dominatecommercial innovation more than initial invention. And the large firms, not theinitial inventors, generally make most or all of the profit.
Individuals who Create InnovationsThe ideas for an invention or innovation often come from outside the firm that
puts the innovation into practice. Thus, a firm’s contacts with customers and suppliers,and its openness to ideas from those sources, may influence its rate of innovation. Also,of course, the specific individuals involved in companies help determine how successfula company can be at innovation. Johnston and Gibbons (1975), and later von Hippel (1988), analyzed the sources of
innovation (and invention), and found that often the ideas for innovations came notfrom the company that put the innovations into products, but from customers orsuppliers of the company.
10 A government laboratory, the Northern Regional Research Laboratory in Peoria, Illinois, also played animportant role in early development of penicillin production methods.

Industrial Growth and Competition K. Simons, 2003
44
An important concept in theories of industry concentration is that of heterogeneitybetween firms. The term heterogeneity simply means differences, which couldinvolve differences in size, research skills, managerial capabilities, etc. Sometheories assume that heterogeneity in terms of the capabilities of managers and ofengineers / researchers remains fixed over time -- that is, a rating could be assigned toeach firm when it starts up, telling how good that firm is in terms of the capability ofits personnel, and the rating remains over time. Such fixed heterogeneity ofpersonnel can explain some interesting facts about industrial competition, as we’lldiscuss later.
Regional Agglomerations of FirmsA regional agglomeration occurs when firms locate near each other.
Agglomerations might have many advantages for the success of companies at R&D andat competition more generally. Nearness by itself, however, may not guarantee anadvantage. In a fascinating analysis of two high-tech areas involving electronicsindustries, AnnaLee Saxenian (1994) contrasts Silicon Valley with the Route 128 areanear Boston, in the process showing some of the characteristics that seem to be necessaryfor regional agglomeration to give an advantage. Saxenian points out the followingdifferences between the two region’s cultures:1. Openness and interchange of ideas among engineers and managers in Silicon Valley
(SV), versus very little interaction around Boston.2. Normality of rapid job-change in SV, versus job change taken as a danger sign about
a potential employee around Boston.3 . Readily available start-up money, especially from previously successful
entrepreneurs, in SV, versus difficulty of obtaining loans from conservative Bostonbanks. Close involvement and assistance from SV investors. Past failures not abarrier to getting start-up money in SV. Targeted (to a particular technology area)venture capital firms in SV.
4. Close links between university research and educational programs in SV, versus moredistant university-corporate relationships around Boston.
5. Firms in SV working closely with local government and volunteering executives’time to try to resolve regional problems, versus more combative and politicalcorporate-government relations in the Boston area.
6. Even willingness of firms in SV to let startups use computers overnight when theowning firm doesn’t need to use them, or for competitors across the street to loaneach other lab equipment when special needs arose; this didn’t happen in the Bostonarea.
Thus, in all these ways, Silicon Valley had a culture that encourage openness,communication, and interchange, whereas the Boston area did not. It is this culture ofopenness, communication, and interchange to which Saxenian attributes Silicon Valley’ssuccess.
The Economy of CitiesJane Jacobs (1969), in her book The Economy of Cities, describes agglomeration
economies related to innovation. She argues that cities with diverse economies may tendto grow, whereas cities focused primarily on a single industry may stagnate if the single

Industrial Growth and Competition K. Simons, 2003
45
industry ceases to grow or collapses. In her view, diverse economies have more ability tospin off new kinds of business when profit opportunities exist. For example, SiliconValley may have been an especially likely and supportive environment for spin-off ofnew businesses, because the diversity of businesses there made available so manydifferent skills, ideas, interests, and resources needed to start many different types of newbusinesses. Diversity of knowledge and assets allows people to come up with newbusiness approaches. In contrast, if almost all firms in a city were specialized in, say,cotton spinning and weaving, then it may be very hard to create new kinds of non-cottonbusiness when the UK cotton industry becomes unable to compete with producers inother nations.
What evidence is there in favor of this view?1. Two key types of case study evidence are in Jacobs’ book. First, Jacobs counters the
theory of agricultural primacy with stories of how ancient cities developed before thegrowth of sophisticated agriculture. According to the theory of agricultural primacy,it is only once agricultural improvements made enough excess food available that partof the population could live in cities and perform non-agricultural trades. But Jacobsargues that agglomeration economies, related to ongoing innovation, made cities formearly, and even that with interchange of goods and techniques from distant lands,cities were the sources of major improvements in agriculture. Second and moreimportantly, Jacobs discusses cities in Britain such as Manchester, Birmingham, andLondon and how they fit with her theory.
2. Empirical studies by Glaeser et al. (1992) and Jaffe et al. (1993), among others,analyze city growth/stagnation and technological change, and find support for Jacobs’view. (Empirical articles related to agglomeration economies in specific industriesalso provide indirect evidence for and against Jacobs’ view.)
Study Guide
Terms to Knowinvention (comes up with the initial idea)innovation (… turns the initial idea into a marketable product, feature, or method)radical / major invention (establishes a new product)incremental innovation (… improves an existing product or reduces costs)product innovation (creates a product or improves an existing product)process innovation (… improves manufacturing methods)heterogeneityagglomeration
Key Readings with QuestionsSaxenian, AnnaLee. Regional Advantage: Culture and Competition in Silicon Valley and
Route 128. Cambridge, Mass.: Harvard University Press, 1994. B R 338.4762 SAX.Argues for the importance of a culture of cooperation and openness in order to makeregional agglomerations of firms as beneficial as possible to the firms involved.
1. Why might geographic agglomeration help companies that are located near each other?

Industrial Growth and Competition K. Simons, 2003
46
2. Why did geographic agglomeration help electronics companies in California’s SiliconValley area more than it helped companies in Boston’s Route 128 area? List Saxenian’sreasons.
3. Based on Saxenian’s findings, what policies could you use as a company executive toencourage the prosperity of your company? Why might you have trouble achievingpolicies that help your company because of agglomeration? What competitivedisadvantages might you suffer?
4. Based on Saxenian’s findings, what policies might you use as a regional planner? Andwhat policies might you use as a university executive officer? Why?
Jacobs, Jane. The Economy of Cities. New York: Random House, 1969. B R338.091732. Describes regional circumstances that affect innovation by firms, andrelates these patterns to the growth and stagnation of cities.
1. What is the main point that Jacobs makes about why cities grow or stagnate?
2. What are Jacobs’ main reasons for thinking that cities grow or stagnate this way?
3. If you were a city planner and you believed Jacobs’ arguments, what could you do toensure that your city’s economy remained healthy? Explain why your policies wouldmake sense on the basis of Jacobs’ logic.
Jewkes, John, David Sawers, and Richard Stillerman. The Sources of Invention, 2nd ed.New York: W.W. Norton & Co., 1969. B 608.7 JEW. Points out that, among thoseinnovations that take the form of new products, many originate from individuals orsmall firms.
1. What is the main point of the book?
2. What evidence do the authors use to make this point?
3. Do the authors talk about (a) who comes up with the idea of an invention, or (b) whodevelops it as a product? In the context of the rest of what you learned in the course, whymight this distinction matter?
Further Readings
Importance of Small Firms
Jacobs, Jane. Cities and the Wealth of Nations: Principles of Economic Life. 1985. R301.36 JAC.
Schumpeter, Joseph A. The Theory of Economic Development: An Inquiry into Profits,Capital, Credit, Interest, and the Business Cycle. 1912. Translated from the German
Industrial Growth and Competition K. Simons, 2003
47
by R. Opie, Harvard University Press, 1934. B 338.5 SCH. The author became a verycontroversial leading economist, as you will see from his later book Capitalism,Socialism, and Democracy next week. Because this earlier book considers theimportance of small firms for creating technological ferment and advance, it is valuableto consider it along with the later book which relatedly argues for the importance oflarge firms to technological advance.
Agglomerative Networks & Economic Growth
Glaeser, Edward L., Hedi D. Kallal, José A. Scheinkman, Andrei Shleifer. “Growth inCities.” Journal of Political Economy 100 (6), 1992, pp. 1126-1152. E.
Jaffe, Adam, Manuel Trajtenberg, and Rebecca Henderson. “Geographic Localization ofSpillovers as Evidenced by Patent Citations.” Quarterly Journal of Economics, 108,1993, pp. 577-98. E.
Krugman, Paul. “Increasing Returns and Economic Geography.” Journal of PoliticalEconomy 99 (3), 1991, pp. 483-499. E.
Where Firms Get Innovative Ideas
Gibbons, Michael, and Ron Johnston. “The Roles of Science in TechnologicalInnovation.” Research Policy 3, 1974, pp. 220-242. U Imperial College central library,level 3 periodicals 351.85.
Johnston, Ron and Michael Gibbons. “Characteristics of Information Usage inTechnological Innovation.” IEEE Transactions on Engineering Management, EM-22(1: February), 1975, pp. 27-34. U Imperial College central library, level 2 periodicals62 IEEE.
von Hippel, Eric. The Sources of Innovation. Oxford: Oxford University Press, 1988. R338.06 HIP.

Industrial Growth and Competition K. Simons, 2003
48
5. Sources of Invention: Big Firms & StreamlinedStructure, Improvement & Efficiency
(Week 3)
Section III of the course continues to address how the structure of an industry –the sizes and other characteristics of its firms – affects R&D in the industry. Thefollowing three sections of the course will examine how R&D, and other factors, affectstructure.
After completing this section, you should:1. Understand the relevance of issues including technological opportunity, demand,
appropriability, and absorptive capacity for determining amounts of innovation.2. Know the results of empirical research on the so-called “Schumpeterian hypothesis”
about firm size, industry concentration, and innovation. These results have beenwidely interpreted as suggesting that small firms are better or no worse innovatorsthan large firms.
3. Be able to explain the assumptions behind a cost-spreading model of firm size andR&D.
4. Be able to explain why this model predicts exactly the empirical results that haveemerged about the “Schumpeterian hypothesis,” yet it implies that large firms are in asense better innovators, are as a result more competitive, and are better for society.
5. Be able to step back and think about when small versus large firms are better, basedon the assumptions that go into the cost-spreading theory.
You should also make some attempt to master the mathematics used in the cost-spreadingmodel. This will stretch your skills, in a way useful for other economic theories.
Firm Size and R&DWhy might bigger or smaller firms tend to do more R&D? To begin answering
the question, consider some of the factors that affect how much R&D a firm does:1. Technological opportunity. In different industries or product markets, there are
different amounts of opportunity to create important new technologies. For example,there seems to be more technological opportunity today in the biotechnology orsoftware industries than in the cloth manufacturing industries. Technologicalopportunity is sometimes known as a “technology push” factor.
structure
R&D
advertising,distribution, …

Industrial Growth and Competition K. Simons, 2003
49
2. Demand for technology. Regardless of technological opportunity, progress may slowwhen there is little economic demand for a technology. For example, with the switchfrom horse and carriage travel to automobile travel, the development of new patentsrelated to horseshoes plummeted. (A horseshoe is a U-shaped metal bar nailed to thebottom of horses’ hooves, so that the hooves don’t wear out.) People’s willingness topay for a new technology is sometimes known as a “demand pull” factor.
3 . Appropriability. Can firms “appropriate” the monetary returns to R&D?Webster’s dictionary definition of “appropriate”:
verb: 1. “… to claim or use as by an exclusive right…”2. “To set apart for, or assign to, a particular person or use, inexclusion of all others…”
If patent rights are strong, both small and large firms should be able to appropriate thereturns to R&D, i.e. capture the profits that could come from the inventions andinnovations created during the R&D. If patent rights are weak, either (1) other firmscopy the invention or innovation; (2) other firms develop minor variations of the newtechnology and patent the variations instead, thus “patenting around” another firm’spatent and continuing down the path of development; or (3) large firms with stronginvestments in the technology can maintain dominance by having large numbers ofpatents and copyrights, and by defending them legally, so that new firms are kept outof the market and find it impractical to develop new technologies.
4. Availability of financing. Do firms have enough money to fund R&D?5. Absorptive capacity. Do firms have the capacity to “absorb” information about new
technologies developed in other firms or by academic researchers? The extent towhich a firm has the relevant R&D personnel and other resources needed to absorbnew technologies from outside the firm is called its “absorptive capacity.”
6. Incentives from cost-spreading. Consider two firms, producing 100 and 10,000automobiles per year respectively. Suppose a project to design a new productionmachine, thus cutting production cost per car by £1, costs £10,000. For the smallerfirm, the project would not be worthwhile, because it would take 100 years ofproducing 100 cars per year to pay back the development cost of £10,000. But for thelarge firm, the project pays for itself in one year, and in future years saves £10,000per year. Thus, the fixed cost of R&D may be spread over the number of units sold,giving an advantage to larger firms.
7. … [There are lots of other possible influences on the rate of innovation.]
In addition to which firms do more R&D, with empirical data it helps to ask whysome firms may seem to do more R&D. In particular, a firm’s “propensity to patent”, orrelatedly its potential to publish the results of R&D, influences how much it seems to doR&D. In some industries, firms need to patent a lot, whereas in other industries it makesmore sense to keep R&D results secret. Also, different firms may have managers whoare more or less keen on patenting or restrictive about publishing.
Larger firms tend to have more incentives than smaller firms to improve andstreamline existing technologies. Hence, large firms often pursue large numbers of minorimprovements to products and manufacturing processes. If an invention comes fromsmaller firms, commercialization (or “innovation”) still takes a lot of effort, which maybe carried out with help from larger firms.
Industrial Growth and Competition K. Simons, 2003
50
Empirical Findings about Firm Size, Industry Concentration, and R&DThe Schumpeterian hypothesis, remember, is that in some sense larger firms and
monopolies are better than small firms as a source of innovation and invention. Inpractice, to test the hypothesis, economists have usually found some measures of R&Dspending or R&D output and of firm size, computed (R&D spending or output) / (firmsize) for each firm, and compared the resulting figures. The notion is that, if thehypothesis is right, the values of [(R&D spending or output) / (firm size)] should bebigger for larger firms. The name “R&D intensity” is used to mean (R&D spending) /(firm size), since firms with higher values are in a sense doing research and developmentmore intensively.
Many empirical studies were carried out in which data on the sizes and R&Dspending of firms, along with data on industry concentration, were used to test theSchumpeterian hypothesis. Not surprisingly, these studies found that bigger firms tend tohave bigger R&D budgets and more R&D results (such as patents). The real questionthey posed was, however, whether R&D intensity increases with firm size.
It turns out that R&D intensity varies a lot from company to company for reasonsthat seem to have little relation with size. Specifically, most of the variance incompanies’ R&D/size measures can be attributed to variables other than size.Characteristics of particular industries, such as the nature of the technology and itsappropriability, explain much of the variance. And for other reasons, individual firmshave enormous differences in R&D intensity that cannot be explained by their sizes.
Examining what little relationship remains between R&D intensity and firm size,R&D intensity seems roughly unrelated with size: specifically, above a low threshold insize, R&D intensity seems to be roughly constant regardless of firm size.
Similarly, in more concentrated industries (which typically have bigger firms),there tend to be higher R&D budgets, but there is little relationship between industryconcentration and R&D intensity, and R&D intensity seems roughly unrelated withindustry concentration. (There was a slight upside-down U-shape found in therelationship; this pattern has become known as “Scherer’s inverted-U” after its discovererMike Scherer. But this pattern is not very strong.)
Finally, it was found that the R&D output of firms per unit of size actually seemsto decline with firm size! For example, the number of patents produced each year peremployee in a company or per £ spent on research actually seems to be smaller in thebigger companies! Thus, it seemed, perhaps the bigger companies are actually lessefficient than the smaller companies!
With this sort of empirical evidence, many researchers took the view thatSchumpeter’s notions were wrong, and small companies are better sources of R&D.Even people who had originally been champions of the Schumpeterian view (such asMike Scherer) seemed to adopt this view. But, surprisingly, there are reasons to thinkthis view is wrong, at least for many kinds of technological advance. One reason comesin the form of a theoretical model of R&D cost-spreading.
R&D Cost-Spreading – A Model that Explains the Empirical PatternsThe empirical tests of how innovation patterns vary with firm size and with
industry concentration have often been interpreted as suggesting that Schumpeter waswrong. However, this is not the only possible interpretation. Cohen and Klepper (1996)

Industrial Growth and Competition K. Simons, 2003
51
argue that indeed, the patterns observed between firm size and R&D, and also betweenfirm size and R&D productivity, may be exactly what one should expect if large firmsindeed pursue R&D more intensively than smaller firms. While Schumpeter was vagueabout just how and why the large firms were to be most innovative, the Schumpeterianhypothesis may be much closer to the truth than most economists have believed.11
The following model and discussion is adapted from that presented by Cohen andKlepper. Suppose that a firm spends an amount of money R on research (R ≥ 0). (Theterm “research” as used here is intended to mean R&D in general, thus includingdevelopment activities and production line engineering as well as fundamental research.)Research allows it to lower its unit production cost, to charge a higher price for itshigher-quality product, or both. Therefore, research increases its price-cost margin, PC =price - cost. (The higher the price-cost margin, the more profit the firm makes per unitproduced.) Firms do the most promising research first and the least promising researchlast, so that the first research project done yields the biggest increase in PC.12 Thus, therelationship between PC and the firm’s research spending takes a form such as thatillustrated below.
PC
research spending R
price-cost margin
Stated mathematically, these assumptions imply that:PC R′( ) > 0 PC R′′( ) < 0
If this is gobbledygook to you, read the “Interpreting Derivatives” section in the chapter“Mathematical Skills Related to the Text,” before going on.If the firm will produce and sell Q units of its product, it makes a profit of
Π = PC(R) * Q - R.For an introduction to Greek letters such as Π, read the “Greek Letters” section in thechapter “Mathematical Skills Related to the Text.” 11 Indeed, Cohen and Klepper’s argument serves as a cautionary reminder. Simply examining empiricalevidence and interpreting it to mean what it seems by surface appearance to mean, without thinking throughjust what underlying processes may be involved, gives a danger of making a completely wronginterpretation. Evidence cannot be interpreted without a theory, and if no theory is explicitly invoked, thenimplicitly the theory assumed is that the only processes with a substantial effect on the empirical findingsare the processes that are assumed from surface appearances. Just as economic models developed withinsufficient attention to real-world facts are usually wrong, so empirical facts interpreted without referenceto an underlying theory often yield incorrect interpretations.12More generally, the model can be framed in terms of expected increases in PC. The expected increase,E(PC), resulting from research is defined roughly speaking as the average increase that could occur.
Industrial Growth and Competition K. Simons, 2003
52
That is, the firm’s profit equals its price times the number of units it produces, minus itsper-unit cost times the number of units it produces, minus the amount of money it spendson research.
Two key assumptions have been made above:1. Research results cannot be sold to other producers. (If they could be, the profit from
such sales would have to be included in the profit equation.)2. Output Q is a fixed constant.The first assumption states that the “returns” to research are not “appropriable” exceptthrough the firm’s own sales. “Returns” to research means the total profits that theinventor and all other firms using the invention get because of the invention.“Appropriability” describes an inventor’s (or an inventing firm’s) ability to capture theseprofits. In reality, is this assumption realistic? For most industries, it is a quite goodapproximation. Firms typically can “invent around” their competitors’ patents, thuscoming up with alternative innovations and patents rather than paying competitors forrights to use patents. Sometimes firms manage to force others to pay royalties, but thereis a long history of involved lawsuits in which firms demanding royalties for patents canhave their patents ruled invalid, or can be forced to settle out of court for relatively smallamounts of money. Firms that demand anything more than a tiny royalty payment areprime targets for other firms to come up with alternative inventions. In many industries,such as the US automobile industry of the early 1900s, patent pools are established sothat every firm in the industry has the right to use any technology invented by anyproducer. Such patent pools have the advantage of avoiding excessive lawsuits and alsohelp to reduce the amount of duplicative research. The kinds of patents that have provedmost defensible are new chemicals and drugs, because there is often no way to “inventaround” a patented chemical formula. Thus, assumption 1 is for most industries quiterealistic, though it is not appropriate for some industries such as new chemicals anddrugs.
The second assumption says that output Q is a fixed constant. For example, ifoutput of the firm today is qtoday, then perhaps future output is Q = k * qtoday. Thisassumption says that the firm is limited in how much it can expand in the time before itsells the product. Is this assumption reasonable? It is very unusual compared to theassumptions of most theoretical models in industry economics, because such modelstypically assume that firms can choose to produce any amount of output. Butrealistically, firms cannot instantly adjust their size to produce whatever amount of outputmanagement pleases. Increasing size requires that capital expenditures be raised to meetthe costs of expansion, and it leads to a broad range of problems related to productionengineering; shipping; purchase, construction, and renovation of buildings; and hiringand training of employees. The typical rapidly-expanding firm, judging from companyhistories, is hard-pressed to deal with these sorts of helter-skelter changes. And even asthe personnel involved would be too hard-pressed to deal with all the attendant problemsat an excessive rate of expansion, new personnel with the skills needed to help with theexpansion are often difficult to hire and in any case generally require large amounts oftheir time and of existing personnel’s time in order to do their jobs effectively. Thus,treating Q as a fixed constant seems a reasonable first approximation.

Industrial Growth and Competition K. Simons, 2003
53
Based on the simple model that has been discussed, it is possible to show thatprofit-maximizing firms generate exactly the empirical patterns we have seen.13
Moreover, the model implies that society is better off with large firms than with smallerfirms, that large firms go farther in the pursuit of research, and that large firms are moreable competitors. The discussion below will address the following three points in turn:1. Larger firms do more research than smaller firms.
But, larger firms do not necessarily do more research per unit of firm size.2. Larger firms achieve a greater PC (i.e., increase in price and decrease in cost) from
their research than smaller firms. Thus, society is better off with larger firms, becausethey produce better goods more cheaply than smaller firms.Also, those larger firms are better competitors than smaller firms; they achieve greaterprofit per unit of output.
3. The research results (in terms of an increase in PC) per unit of research are less forlarger firms. Thus, larger firms seem to accomplish less for every dollar they spend onR&D. But this is a good thing — it means they do the relatively low-value researchtoo, instead of focusing exclusively on the very promising research as small firms do.
These points will be both discussed and proved mathematically.You should learn to understand the mathematical proofs well enough to do them yourself,as they involve fundamental skills that economists (and economics students) should have.Before going on, read the “Computing Derivatives” and “Maximizing a Function”sections of the appendix.
Before seeing the proof of points 1-3, consider how much research a profit-maximizing firm chooses to do. At the profit maximum, the firm chooses to do the
amount of research R for which ddRΠ
= 0. So,
ddRΠ
= PC R′( ) Q - 1 = 0.
I.e., PC R′( ) = 1Q
.
To show that this yields the maximum profit, not the minimum profit, it must be the case
that ddR
2
2
Π < 0.
ddR
2
2
Π = PC R′′( ) Q < 0 because PC R′′( ) < 0 and Q > 0.
So, choosing the amount of research R that sets PC R′( ) equal to 1/Q indeed yields themaximum profit.
13 While of course no real firm can be expected to be truly profit-maximizing, in the way profitmaximization is used here, it seems a reasonable approximation within existing industries. (For researchthat would create entirely new industries, one might argue that the potential outcomes of the research areparticularly difficult to estimate, hence making it difficult for firms to optimize the amounts of suchresearch they carry out. Even so, the variation in research budgets with firm size would surely follow asimilar pattern to that observed in existing industries, though perhaps with greater random variation.) Themanagers of a firm that expends far more or less on R&D than the optimal amount generally perceive theirerror quickly, because the huge expenses involved tend to lead to much consideration of the prospects foroutcomes of the R&D. And furthermore, even if they should want to do so, small firms rarely have budgetsto pursue amounts of research comparable to that of large firms.
Industrial Growth and Competition K. Simons, 2003
54
The first point made above is that (a) larger firms do more research than smallerfirms, but (b) larger firms do not necessarily do more research per unit of firm size.
A. If larger firms do more research than smaller firms, then it must be the case thatdRdQ
> 0. That is, the amount of research done by firms must increase with their
size (where size is represented by their amount of output Q).
Proof: From the profit-maximizing condition, you know that PC R′( ) = 1Q
.
Taking the total derivative of both sides (using derivative rule 8 on the left-handside and rule 5 on the right-hand side) with respect to Q tells you that
PC R′′( ) dRdQ
= −1
2Q.
Rearranging by dividing both sides by PC R′′( ) tells you thatdRdQ
= −
′′1 12Q PC R
*( )
.
Since Q > 0 and PC R′′( ) < 0 (as assumed at the beginning), multiplying togetherthe -1 divided by a positive number divided by a negative number tells you thatdRdQ
has to be a positive number. That is, dRdQ
> 0. QED.14
B. If larger firms don’t necessarily do more research per unit of firm size, then it must
be the case that d R Q
dQ( / )
is not unambiguously greater than zero. That is, the
amount of research done per unit of firm size need not increase or decrease withfirm size.
Proof: If PC(R) = k log(R), that is, if it just happens to be the case that the graphof PC versus R takes exactly a form given by a constant times the logarithm of R,then PC R′( ) = k / R, so the profit-maximizing condition states that
kR
= 1Q
.
Using this, you can see that R = k Q, so that R / Q = k. Taking the derivative withrespect to Q, you get
d R QdQ
( / ) = 0.
In other words, in this special case, R&D per unit of firm size is exactly the samefor all firms.
With other possible forms of PC(R), such as 1 - exp(-R), smaller firms domore R&D per unit of firm size. And I am sure that for other forms of PC(R),larger firms do more R&D per unit of firm size, though I haven’t written out anexample or a proof yet (if you come up with one, let me know).
14QED is a way of concluding mathematical proofs that essentially means, “Hah; I told you so.”

Industrial Growth and Competition K. Simons, 2003
55
The second point made above is: (a) Larger firms achieve a greater PC (i.e.,increase in price and decrease in cost) from their research than smaller firms. Thus,society is better off with larger firms, because they produce better goods more cheaplythan smaller firms. (b) Also, those larger firms are better competitors than smallerfirms; they achieve greater profit per unit of output.
A. For larger firms to achieve a greater PC than smaller firms, it is simply necessarythat they do more research than smaller firms. This is because PC R′( ) > 0; thatis, the price-cost margin only goes up with the amount of R&D a firm carries out.And you know from point 1a that larger firms do indeed carry out more researchthan smaller firms.
B. Consider two firms, a smaller firm and a larger firm, with outputs Qsmaller andQlarger. Their amounts of research and profit will be represented similarly, byRsmaller, Rlarger, Πsmaller, and Πlarger. If the larger firm did not maximize itsprofit but instead only did the same amount of research, Rsmaller, as a profit-maximizing smaller firm, even so the larger firm would still achieve the greateramount of profit per unit of output. The profits per unit of output for the twofirms would then be:
Πsmaller / Qsmaller = [PC(Rsmaller) * Qsmaller - Rsmaller] / Qsmaller = PC(Rsmaller) - Rsmaller / Qsmaller
Πnm,larger / Qlarger = [PC(Rsmaller) * Qlarger - Rsmaller] / Qlarger= PC(Rsmaller) - Rsmaller / Qlarger
Here, the subscript “nm” on the variable Πnm,larger indicates a non-maximizingamount of profit. The only difference in profit per unit is that the larger firmsaves more money by dividing its research cost by a greater amount.
A profit-maximizing larger firm can do much better. Choosing a largeramount of research spending (Rlarger > Rsmaller), as you know from point 1a(which was found for profit-maximizing firms), lets the larger firm increase itsprofit. Since this causes Πlarger to be greater than Πnm,larger, and since Qlarger is aconstant, Πlarger / Qlarger is even greater than Πnm,larger / Qlarger.
The third point made above is that research results, in terms of an increase in PCper unit of research, are less for larger firms. Thus, larger firms seem to accomplish lessfor every dollar they spend on R&D. This is a good thing, since it means they do therelatively low-value research too, as well as focusing on the very promising research assmall firms do.
• From the graph shown earlier, it is easy to see that [PC(R) – PC(0)] / R is lower forlarger amounts of research. Mathematically, this property follows from theassumptions that PC R′( ) > 0 but PC R′′( ) < 0; it is a property of any concaveincreasing function.
Thus, it is possible to prove mathematically that the empirical patterns of R&Dand firm size are just what one should expect if large firms are the best loci for society’sinnovation. Contrary to common interpretations of these patterns, larger firms may beboth more competitively able and better for society. For a country’s producers to farewell against international competition, according to this model, they must be comparable

Industrial Growth and Competition K. Simons, 2003
56
in size to, or larger than, their foreign competitors. And more importantly, for society ingeneral, the rapid technological improvement brought by large firms cannot be equaledby their smaller brethren.
These conclusions have depended upon assumptions that mean they do not applyto certain kinds of industries. If firms can appropriate returns to innovation, as chemicaland drug firms do with defensible patents, or if firms can rapidly expand to any amountof output, as multi-product chemical firms might do for some new products, then smallfirms would be expected to have the same incentive as large firms to do R&D. Theremay be other reasons why larger firms may have the upper hand at R&D, for exampleeconomies of scope in the research of chemical and drug firms, but the so-called “R&Dcost-spreading” argument given here does not apply.
Another issue not addressed yet is diversity. All firms in this model wereassumed to pursue exactly the same sorts R&D. And in practice, manufacturersproducing similar products do seem to carry out duplicative R&D. But, oligopolisticfirms may be limited in their desire to develop radical changes in a product technology,given their “cushy” established position and their investment in the establishedtechnology. Perhaps, then, society would be better off to have a combination of largefirms and some mechanism that guarantees continued innovativeness with radicalinventive ideas. For example, a nation could establish a small percentage-of-salescorporate and import tax to pay for research grants for university and corporateresearchers with successful R&D proposals.
Study Guide
Terms to Knowindustry structuretechnological opportunitytechnology pushdemand pullappropriabilitypatenting aroundabsorptive capacityR&D cost-spreadingpropensity to patentR&D intensity(Scherer’s) inverted-U
Key Readings with QuestionsCohen, Wesley. “Empirical Studies of Innovative Activity.” In Stoneman, Paul, ed.,
Handbook of the Economics of Innovation and Technological Change, Oxford: BasilBlackwell, 1995, pp. 182-264. O B 338.06 HAN. A dense review of empiricalresearch on industrial innovation and technological change. Learn the main conceptsand points, not the many minute details.

Industrial Growth and Competition K. Simons, 2003
57
1. Based on Cohen’s paper, how do firm size and innovation seem to be related?Describe the major research findings. Sum up the major arguments for and against theSchumpeterian hypothesis.
2. Based on Cohen’s paper, how do market concentration and innovation seem to berelated? Describe the major research findings. Does this have any more to say about theSchumpeterian hypothesis?
3. Pick one feature described in Cohen’s section 3, on how the characteristics of firmsaffect their innovative activities. Explain what this feature is and how it is supposed toaffect innovation by firms. If there is empirical evidence on the matter, describe what theevidence has to say.
4. What are demand-pull and technology-push? What does Cohen mean when he says,“The consensus... is that the Marshallian scissors cuts with two blades.” (p. 212)?
5. What is technological opportunity? How does it matter? How does technologicalopportunity change over time, in general and within a given industry?
6. What is appropriability? Why might the profits from innovations be appropriable ornot? How does the nature of appropriability vary from one industry to another?
Schumpeter, Joseph. Capitalism, Socialism, and Democracy. New York: Harper, 1942.B R 320.531 SCH. Examine especially chapters 7 and 8, which contain a core idea thattriggered much heated debate and research, because Schumpeter argued that theclassical economic focus on highly-competitive markets full of small firms wascompletely backward from the focus most relevant to understanding the processes ofeconomic growth.
1. What does Schumpeter argue in Capitalism, Socialism, and Democracy, and why did itattract so much attention among economists?
2. List the specific reasons Schumpeter gave for why the largest firms and monopoliesare supposedly more innovative than other firms.
3. Argue against Schumpeter and demolish his work. Form your argument in four parts:(A) Make the case that his reasons for larger / more monopolistic firms being innovativeare just plain wrong. (B) Claim that the evidence is against him, and bring lots ofexamples (and numbers, if you have them) to bear against him. (C) Express every othergood argument you can think of to make your case. Try to layer your arguments, e.g.,“even if the reader does not agree with the argument I have just made, then here isanother argument which also proves beyond a doubt that Schumpeter is wrong.... Andeven if the reader does not agree with this argument, there are yet more reasons to knowthat Schumpeter is wrong.” (D) Explain why, therefore, the world of small firmscompeting with each other á la Adam Smith is the best way for industries to be.
Industrial Growth and Competition K. Simons, 2003
58
Make sure you construct your argument with an additional paragraph at thebeginning that captures the reader’s interest and introduces the point. And make sureyour argument ends in a conclusive statement that ties together all of your arguments.
4. Argue against your essay of question 3 and demolish your own work. Go about this inthree parts: (A) Briefly review the evidence and arguments that might work in your favorto demolish your former essay. (B) Lay out, on paper or in your mind in a way youwon’t lose track, the broad outlines of your argument to demolish your former case. (C)Grab your pen and dash out all those arguments into a coherent essay that demolishesyour former case (as before, make sure to begin and end your essay appropriately).
It might help to pretend you are in a class exam from years past, and you have ahalf-hour to complete this task after which your paper must be handed in and graded by amerciless English teacher.
Further ReadingsCohen, Wesley and Steven Klepper. “A Reprise of Size and R&D.” Economic Journal
106, 1996, pp. 925-951. O J E. Argues for a re-interpretation of the evidence on firmsize and R&D. Explains how observed empirical patterns, of roughly constant R&Dspending per employee for firms of varying sizes and of lower returns to R&D forlarger firms, in fact may result from larger firms exploiting R&D possibilities morefully and hence accomplishing more overall innovation than a group of smaller firmsthat add up to the same size as a large firm would accomplish.
Chandler, Alfred D. The Visible Hand: The Managerial Revolution in AmericanBusiness. Cambridge: Belknap (Harvard University Press), 1977. B 338.75 CHA. Amonumental document that provided for the first time an integrated history ofAmerican industry from the 1700s into the 1900s.
Chandler, Alfred D., Jr. Scale and Scope. Cambridge, MA: Harvard University Press,1990. B R 338.644 CHA. Another monumental document, analyzing industrial historyin Europe and the United States during the 20th century.
Levin, Richard C., Alvin K. Klevorick, Richard R. Nelson, and Sidney G. Winter.“Appropriating the Returns from Industrial Research and Development” (includingcommentary by Richard Gilbert). Brookings Papers on Economic Activity 3, 1987, pp.783-831. U LSE library journals HC101. This paper investigates to what extent firmscan “appropriate,” or receive, the economic value of their inventions, through patentsand other means.

Industrial Growth and Competition K. Simons, 2003
59
6. Evolution of New Industries(Week 4)
This chapter introduces the industry evolutionary processes discussed in the nextfour chapters. After completing this part of the course, you should:1. Understand that commonly-used industry data at the 2-digit and 4-digit SIC levels are
too aggregated to see many important competitive patterns.2. Have an initial knowledge of some common industry evolution processes, and how
they relate to patterns of entry, exit, and the presence or lack of early-moveradvantages.
Types of Competitive EvolutionThis course focuses on competitive processes that operate within industries at the
product level, or simply within “products.” Industries can be defined more or lessnarrowly, and often are categorized using Standard Industrial Classification (SIC) codes.SIC codes were developed by national statistical agencies to organize the data theycollect. The codes also are often used to organize directories of company information.At the broadest level, SIC codes define different industries using a 1-digit number,classifying all companies in an economy into one of up to 9 different industries using thenumbers 1-9. Extra numerical digits can be added thereafter to classify industries inincreasing detail. National statistical data tend to be available to researchers at 1-, 2-, or4-digit levels.15 Unfortunately, the 4-digit level tends to be quite aggregated in terms ofindividual products. For example, 4-digit industries using US SIC codes include all typesof motor vehicles classed together, or all types of prepackaged software classed together.Competitive dynamics of the sort discussed in this course take place at a much narrowerlevel of industry, such as automobiles, motorcycles, or trucks; word processors, computergames, or drawing software. Looking at data using 4-digit SIC level industries can bemisleading! Aggregating individual product markets can cover up patterns such as“shakeouts” and “turnover in corporate leadership,” discussed in the next two sections ofthe course, thus giving the false impression that competition is relatively constant andmundane. Competition, however, is more rich and complex when analyzed at the morerelevant level of individual products.16
15 At more detailed levels, the data must be kept secret for confidentiality reasons. Selected researchers canuse the data at national statistical offices, either by being employed there or by special agreements subjectto legal restrictions, and using these data it has been possible to carry out some of the more importantstudies in macroeconomics, industry economics, and labor economics.16Definitions of product markets are used differently depending on researchers’ purposes. Microeconomistsgenerally define product markets to pertain to goods, regions, and buyers for whom the price of an identicalgood is identical for all the buyers. Antitrust authorities generally consider markets in terms of the abilityof oligopolies to influence prices. Business strategists consider markets in terms of relevant strategicconcerns, and market definition may depend on the business or competitive issues analyzed. Geroski(1998) contrasts these three viewpoints in a recent article. In this course, the relevant groups of products,technologies, regions, and buyers depends on the topic analyzed. Shakeouts and turnover of corporateleadership occur within products that serve (fairly) identical needs, and they may be analyzed at national orinternational levels with somewhat different conclusions. Market niches, in contrast, restrict competition

Industrial Growth and Competition K. Simons, 2003
60
What patterns do competitive processes follow at the level of individual products?In general, different product industries follow different patterns. Attempts by industryeconomists to find patterns that transcend all or most industries have met with onlylimited success, uncovering a few robust empirical patterns without necessarilyexplaining why those patterns arise (Schmalensee, 1989). A new approach, however,seems likely to work much better. A few common patterns seem to play out over timeacross most product industries. By grouping product industries according to thecompetitive patterns that occur in them, it should be possible to categorize most productsinto a few types. Each type involves different competitive processes. Each competitiveprocess is a dynamic process, and occurs typically over some number of decades. Indifferent alternative processes, leading companies do or do not benefit from a spiral ofadvantage that helps secure their competitive position, small firms or startups can or cannot take advantage of major technological changes to wrest leading market shares fromincumbents, and the market is or is not divided into many parts or “niches” betweenwhich there is relatively little competition. Eventually, it is hoped, these alternativeprocesses can be traced to their ultimate causes in terms of characteristics of the product,its technology, and its consumers. Chapters 7 and 8 of the course notes consider patternsinvolving corporate leadership turnover and shakeouts respectively, chapter 9 elaborateson forces that may yield shakeouts, and chapter 10 considers the effect of market nicheson competitive processes. One important force in all product industries is the growth offirms, and chapter 11 discusses firm growth through internal investment and merger.
A First Comparison of Some Industry Evolutionary PatternsTo gain a sense of different competitive dynamics, one useful measure is how the
number of companies changes over time. This is by no means the only relevant measure!Also important are the changing sizes of firms and the distribution of market shares (andhence industry concentration), the changing extent to which product differentiationmatters and the effect of product differentiation on prices, the changing nature ofconsumer demand, the changing technological strengths of firms and their innovation,and other issues such as entry, exit, advertising, distribution networks, and technologylicensing agreements. Nonetheless, the number of firms is one important measure – forexample it is often thought that with more firms there are more diverse approaches totechnological improvement and hence more benefits for consumers, and industries withfew firms tend to be quite concentrated in terms of market shares. Changes in thenumber of firms will also be an important theme in upcoming chapters.
Figure 6.1 provides a preview by exhibiting diverse patterns in how the number offirms changes over time, across a range of narrowly-defined product manufacturingindustries. The figure also provides a sense of how such patterns compare betweencountries, since data for both the US and the UK are exhibited. The data shown werecollected from a variety of trade registers and have varying levels of error. Some data arequite clean (as for tires in the US), while others have problems such as lack of clarity inproduct definition (phonograph records). For most of the products, data are available
between producers in different market segments only when there is a substantial degree of separationbetween the characteristics of products demanded. Theories related to technological core competency ofcompanies, and advantages of experience in related product markets, involve notions of advantages ofscope that may span multiple products while remaining within one or more technology types.

Industrial Growth and Competition K. Simons, 2003
61
from near the inception of the product market, although in a few products such astypewriters the product market began before 1900 and data for the earlier years have notbeen obtained. For further information on the data, see Simons (2002a).
From inspection of the graphs, you can see that one common pattern is an initialgradual increase in the number of producers followed by a sharp decrease or “shakeout”in the number of producers. Some industries such as tires appear to have experiencedvery severe shakeouts, while others such as phonograph records appear to haveexperienced less shakeout or perhaps no shakeout at all in one or the other country. Thusshakeouts are not universal, although most industries (narrowly-defined productindustries, that is) that have existed for some number of decades have experienced at leastsome degree of shakeout.
What might account for these differences in the evolution of firm numbers, andhow are they related to the evolution of other industry characteristics that matter such asconcentration and technological change? The next chapters will help understand thesequestions. A common underlying cause of shakeouts will be suggested in chapter 8, andthe theory of shakeouts described there will be shown to fit better than other theories withthe available evidence. Three reasons why shakeouts might not occur are: (1) technology(or possibly distribution networks and other aspects of industry competition) may havelittle role to play, (2) technology (or etc.) may differ in industries with shakeouts versusother industries where corporate leadership turnover may occur and may replenish thenumber of firms (see chapter 7), or (3) product differentiation may mean that firms in an“industry” in fact are not in competition with each other so that competition cannot drivedown the number of firms (see chapter 10).
Finally, note that not only do both countries experience a similar range ofpatterns, but moreover the patterns are similar between matched pairs of industries acrossthe two countries. The timing of the peak number of producers and the severity ofdecrease in the number of producers is similar, with a large and statistically significantcorrelation, across countries (Simons, 2002a). This suggests that common underlyingtechnology- or market-traits and dynamic competitive processes have yielded commoncompetitive dynamics across the two countries. The dynamic patterns occurring inindustries appear not to be merely a matter of chance, but to be a matter of systematicunderlying processes. The next chapters will analyze some of the key processes.
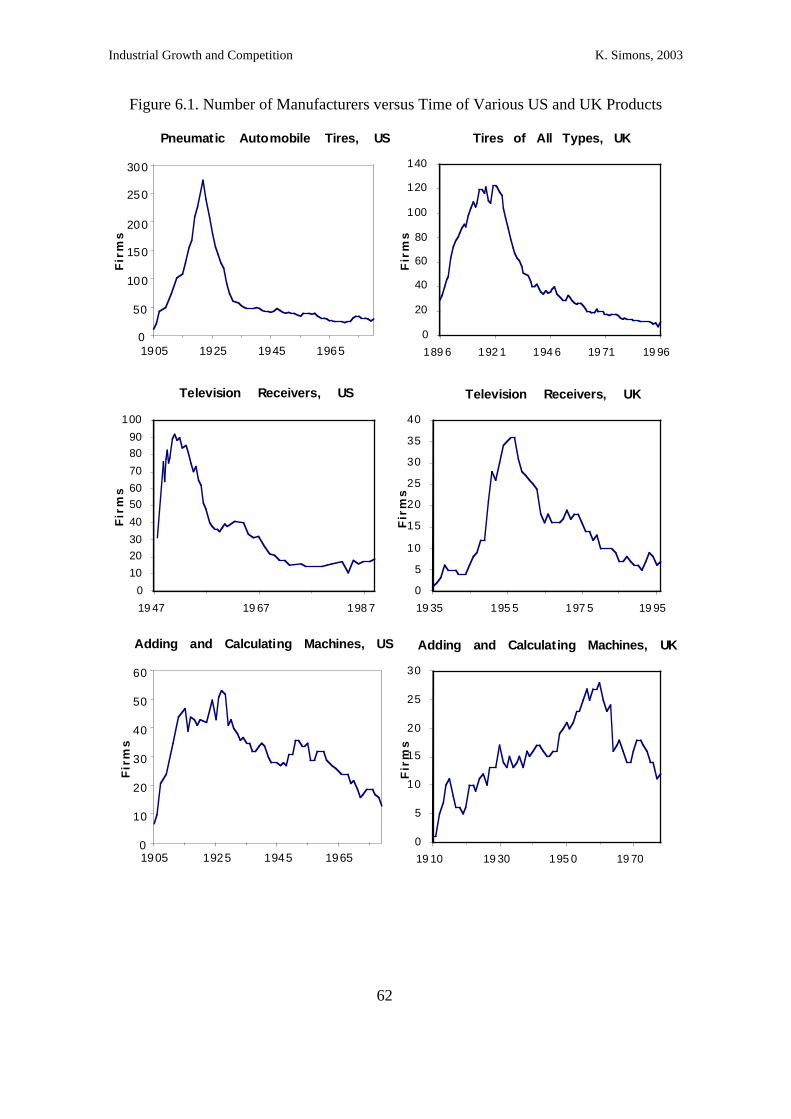
Industrial Growth and Competition K. Simons, 2003
62
Figure 6.1. Number of Manufacturers versus Time of Various US and UK Products
0
10
20
30
40
50
60
70
80
90
100
19 47 19 67 198 7
Fir
ms
Television Receivers, US
0
5
10
15
20
25
30
19 10 19 30 195 0 19 70
0
5
10
15
20
25
30
35
40
19 35 195 5 197 5 19 95
0
20
40
60
80
100
120
140
189 6 192 1 194 6 19 71 19 96
Fir
ms
Tires of All Types, UKF
irm
s
0
10
20
30
40
50
60
1905 1925 1945 1965
Adding and Calculating Machines, US
Fir
ms
Adding and Calculating Machines, UK
Fir
ms
Television Receivers, UK
Pneumatic Automobile Tires, US
0
50
100
150
200
250
300
1905 1925 1945 1965
Fir
ms
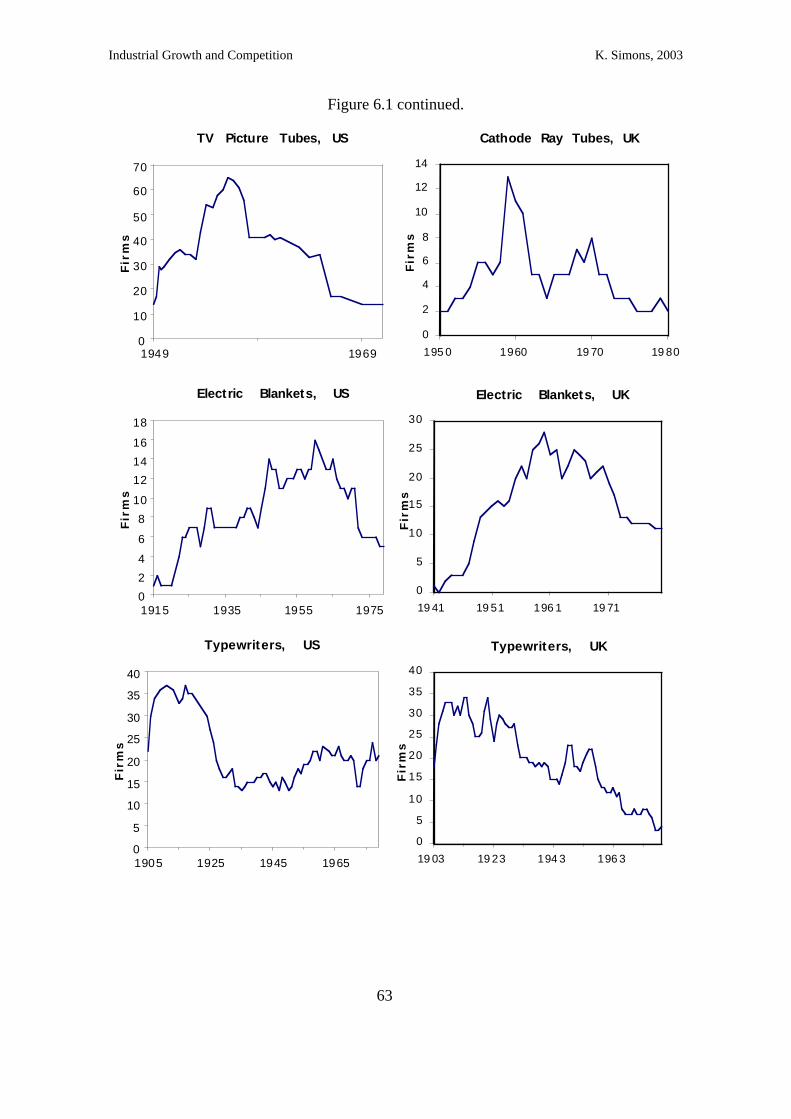
Industrial Growth and Competition K. Simons, 2003
63
Figure 6.1 continued.
0
5
10
15
20
25
30
19 41 19 51 196 1 19 71
Fir
ms
Electric Blankets, UK
0
5
10
15
20
25
30
35
40
19 03 19 23 194 3 196 3
Fir
ms
Typewriters, UK
0
2
4
6
8
10
12
14
195 0 1960 19 70 19 80
Fir
ms
Cathode Ray Tubes, UK
Fir
ms
Typewriters, US
0
5
10
15
20
25
30
35
40
1905 1925 1945 1965
Fir
ms
Electric Blankets, US
0
2
4
6
8
10
12
14
16
18
1915 1935 1955 1975
Fir
ms
TV Picture Tubes, US
0
10
20
30
40
50
60
70
1949 1969

Industrial Growth and Competition K. Simons, 2003
64
Figure 6.1 continued.
0
5
10
15
20
25
30
35
40
1913 1933 1953 1973
Fir
ms
Phonograph Records, UK
0
5
10
15
20
25
1948 1968
Fir
ms
Ball-Point Pens, UK
0
5
10
15
20
25
30
35
40
1933 1953 1973
Fir
ms
Zippers, UKF
irm
s
Phonograph Records, US
0
10
20
30
40
50
60
1905 1925 1945 196 5
Fir
ms
Zippers, US
0
10
20
30
40
50
60
70
80
90
1928 1948 196 8
Fir
ms
Ball-Point Pens, US
0
20
40
60
80
100
120
1946 1966

Industrial Growth and Competition K. Simons, 2003
65
Study Guide
Terms to KnowindustryproductStandard Industrial Classification (SIC) codes4-digit SIC codes
Key Readings with QuestionsKlepper, Steven, and Elizabeth Graddy. “The Evolution of New Industries and the
Determinants of Market Structure.” RAND Journal of Economics 21 (1: Spring), 1990,pp. 27-44. O J. Focus on the first half of the paper, to gain an understanding of someimportant empirical patterns in the dynamics of product industries.
1. What empirical phenomenon do Klepper and Graddy describe? How common is it?How strong is it? Does it seem to be more common, or stronger, in some industries ortime periods than in others?
Hannan, Michael T., and John Freeman. Organizational Ecology. Cambridge, Mass.:Harvard University Press, 1989. R 338.74 HAN. This book argued for analysis ofindustries (and other “populations of organizations”) using models similar to those inecology that describe populations of animals; it started a large trend in sociologyresearch that is also pertinent to industry economists. Get the main ideas and a sense ofthe methods used by the authors.
1. What model do Hannan and Freeman use to describe how the number of organizationsin a population (e.g., the number of companies in an industry) changes over time? Writedown the mathematical equation they use, and explain roughly why they use it. Explainwhat they mean by legitimacy and competition, and how those concepts relate to themodel.
2. The authors do statistical studies of particular populations of organizations to analyzepatterns of entry and exit. What populations do they study? What do they conclude?
Geroski, Paul A. Market Dynamics and Entry. Oxford: Blackwell, 1991. R 338.6 GER.Use chapters 1-3, which give you a sense of the bulk of economic research that hasgone on — mostly at an economy-wide level or for very aggregated industry groupsrather than for specific products — regarding the entry of new firms.
1. In the UK, about how many businesses start up each year, and about how many shutdown? What are the comparable figures in the US? Be sure to distinguish betweenfigures that apply to the country as a whole, and figures that apply only to certainindustries (e.g. the 87 three-digit industries discussed by Geroski on page 12).
Industrial Growth and Competition K. Simons, 2003
66
2. Does more or less entry of new businesses occur when the economy is doing well orbadly? I.e., can entry be called pro-cyclical or counter-cyclical? And in specific numberterms, how much does the health of the economy seem to matter?
3. How important are most entrants? About what percentages of entrants are of whatsize? What does Geroski mean by “entry penetration”? What evidence does he have tosay (p. 18) that “the ‘bark’ made by the large number of entrants that appear each year farexceeds their ‘bite.’”? Thus, he seems to find that there is a revolving door of entry:small firms revolve into business through the revolving doors, but they rarely make itinside to the lobby where the big firms are making money; instead they just revolveoutside (and out of business) again through the revolving door. Do the conclusions seemto change when one looks at data that span many countries?
4. Explain the difference between gross entry and net entry.
5. How long do companies typically survive in the UK, before they go out of business?Do larger companies seem to survive longer or shorter, relative to smaller companies(describe the evidence)?
6. Geroski’s evidence pertains almost entirely to very broad industries, such aspharmaceuticals or antibiotics rather than penicillin, or automotive vehicles and partsrather than windshield-wiper manufacturers or final automobile manufacturers. If onelooked at narrowly-defined industries such as penicillin, windshield wipers, orautomobiles (excluding parts), do you suppose the conclusions would change? Why orwhy not? If narrowly-defined industries behave as found by Klepper & Graddy andKlepper & Simons, what patterns would one observe when many such industries areaggregated into one broad industry?
Further ReadingsAudretsch, David B. Innovation and Industry Evolution. Cambridge, Mass.: MIT Press,
1995. B 338.06 AUD.Audretsch, David B. “New-Firm Survival and the Technological Regime.” Review of
Economics and Statistics (August), 1991, pp. 441-450. E. Audretsch characterizesdifferent industries as belonging to different “technological regimes,” with alternativepatterns of new-firm survival.
Baldwin, John R. The Dynamics of Industrial Competition: A North AmericanPerspective. Cambridge: Cambridge University Press, 1998. B 338.70971 BAL.
Carroll, Glenn R., and Michael T. Hannan, eds. Organizations in Industry: Strategy,Structure, and Selection. Oxford: Oxford University Press, 1995. R 338.74 ORG.This book investigates some organizational ecologists’ notions of the dynamics ofindustries, through a series of industry case studies.
Davis, Steven J., John C. Haltiwanger, and Scott Schuh. Job Creation and Destruction.Cambridge, Mass.: MIT Press, 1996. B 331.12 DAV. Entry and exit of firms, or theirgrowth or contraction, coincide with the creation and destruction of jobs. The authorsanalyze these patterns in the US using a new census dataset, and argue for explanationsof some important economic patterns.
Industrial Growth and Competition K. Simons, 2003
67
Gort, Michael, and Steven Klepper. “Time Paths in the Diffusion of ProductInnovations.” The Economic Journal, 92, Sept. 1982, pp. 630-653. O E. This paper isa forebear of Klepper and Graddy’s paper cited above; the main differences are that thisone has a somewhat smaller dataset to work from and a different (one could say lessadvanced) theoretical model.
Krugman, Paul. “Technological Change in International Trade.” In Stoneman, Paul, ed.,Handbook of the Economics of Innovation and Technological Change, Oxford: BasilBlackwell, 1995, pp. 342-365. B 338.06 HAN. This literature review is unusuallywell-written and hence readable. Section 3 pertains to the product life cycle theory as ithas been applied to international trade, and is why I’m suggesting this reading. But thewhole article may be of interest.
Porter, Michael E. Competitive Strategy: Techniques for Analyzing Industries andCompetitors. New York: Free Press, 1980. B 338.6048 POR (also O chapter 1).Porter, the guru of strategic management, collects important impacts on competitivedynamics and provides a framework to think about them.
Simons, Kenneth L. “Product Market Characteristics and the Industry Life Cycle.”Working paper, Royal Holloway, University of London, 2002. Early version at Wwww2.rhul.ac.uk/~uhss021, or ask me for the full updated version. Shows thatunderlying technological or other characteristics drive industry outcomessystematically. Part of the paper compares the US industries studied by Klepper andGraddy (and previously Gort and Klepper) with the same industries in the UK, to verifythe idea that underlying product- or technology-specific traits of industries are primedeterminants of the industries’ evolutionary processes.
Industrial Growth and Competition K. Simons, 2003
68
7. Turnover of Corporate Leadership(Week 5)
One common process in the dynamics of product markets involves turnover ofcorporate leadership. Existing or “incumbent” market leaders may lose their large marketshares when new or small firms surpass them by using better products or otheradvantages. The most common explanation for corporate leadership turnover involvestechnological change: the new leaders, but not incumbents, successfully use technologicalchanges to take over the leading market shares. The times of such major technologicalchange may be marked by the entry of new firms and exit of unsuccessful firms.
After completing this section of the course, with its required readings, you should:1. Understand what is meant by corporate leadership turnover.2. Be able to describe at least several examples of corporate leadership turnover, and
how they relate to relevant technological changes.3. Explain the three groups of industry patterns that Tushman and Anderson argue
correspond to corporate leadership turnover caused by technological changes.4. Explain at least the following theories of why incumbents lose their market leadership
to new firms: Tushman and Anderson theory based on core competencies, Hendersonand Clark’s theory based on R&D mindsets and organization, and Christensen andRosenbloom’s theory involving customer demand.
5. Discuss corporate strategies that may help incumbents to prevent leadership turnover,as well as strategies that may help entrants to become market leaders.
ExamplesExamples of corporate leadership turnover are listed in table 7.1. The examples
are drawn from a series of articles and books in which the authors analyze thephenomenon of leadership turnover or broader competitive processes. Some of theexamples were developed with limited factual evidence, so further research could help toclarify their validity. Consider the manufacture of cement, for which existing kilns withfires underneath were improved based on two innovations that occurred at about the sametime. First, rotating kilns were used in place of existing fixed kilns, and second, coal dustwas sprayed mechanically and burned underneath the kilns to provide a more evendistribution of heat. Tushman and Anderson (1986) argue that the new technologies weresubstantially different from the old and led to the replacement of leading producers withnew firms. In their original article and a later one (Anderson and Tushman, 1990), theymake similar arguments for other new technologies in cement, microcomputers, and(container and flat) glass. Other authors have made similar claims either as part ofarticles analyzing the process of leadership turnover or in broader studies of industriessuch as electronic switches or calculators. And Schnaars (1994) documents furtherexamples in a book analyzing how later entrants may take over markets from the leadingincumbents. All the examples mentioned here come from the US, since the phenomenonapparently has received little study for other countries, although it would seem thatsimilar patterns should occur in any capitalist economy.

Industrial Growth and Competition K. Simons, 2003
69
Table 7.1. Examples of Corporate Leadership Turnover in the USproduct new technology datecement rotary kiln & coal dust c1892
suspension preheating 1972minicomputers solid state & integrated circuitry 1960scontainer glass semiautomation 1893
Owens machine 1903flat glass drawing machines 1917
continuous forming 1923float glass 1963
aligners for semiconductormanufacturing
proximity (vs. contact) alignersscanner (vs. proximity) alignersstep & repeat (vs. scanner) aligners
hard disk drives 8-inch (vs. 14-inch)5.25-inch (vs. 8-inch)3.5-inch (vs. 5.25-inch)
electronic switches transistor (vs. vacuum tube)calculators electronic (vs. mechanical) calculatorsSources: Tushman and Anderson (1986), Anderson and Tushman (1990), Henderson andClark (1990), Christensen and Rosenbloom (1995), Majumdar (1982), Schnaars (1994).
Detecting and Analyzing Corporate Leadership TurnoverHow can one detect and analyze corporate leadership turnover? Tushman and
Anderson (1986) suggest a number of methods. A first approach is to identify whethernew or old firms constitute the bulk of firms that introduce a new innovation. Forexample, consider the use of powdered coal for making cement. Of the five innovatorsthat appear to have been the first US firms to use powdered coal in cement manufacture,4 of the 5 were new innovators, and only 1 of 5 was an incumbent, according to Tushmanand Anderson (1986). The extremely high proportion of new firms among the innovators(80%) suggests that incumbents either could not or would not take advantage of the newtechnology as readily as new firms. Thus, if reliable data can be obtained about whichfirms were first to use an important new technology, the data provide a test of whetherold firms were lax at adopting the technology and hence might lose their positions ofleadership or be forced out of business. Ideally the market shares of the incumbentinnovators would be examined as well, to determine whether they were leading firms.However, when market share data are unavailable (as is usually the case), examiningwhether firms are new or old still provides a useful test.
A second approach focuses on the “era of ferment” that the new technologies arelikely to introduce. With new product or process technology as well as old technology,diversity of types of the product or of manufacturing techniques is likely to increase.This increased diversity should remain temporarily, until the new technology and thefirms that use it outcompete the old. In addition to increased diversity, the improvementto the product or reduction in cost (cost reduction presumably yields at least some pricereduction) should increase demand for the product, so unit sales should grow. Inparticular, sales should grow more quickly than from the usual trends (sales may growperpetually even without technological advance as the number of consumers grow,
Industrial Growth and Competition K. Simons, 2003
70
consumers gain more money to spend, etc.). And finally, sales growth should becomeharder to forecast. With the reasons for growth in sales hinging on new product traits andlower costs, forecasters have little information to use to help determine buyers’ reactionsto these changes, so errors in published forecasts should become greater on averageduring an era of ferment.
A third approach uses industry-wide data on entry, exit, and market share offirms. After the new technology is introduced, entry should occur by firms takingadvantage of the new technology, and thereafter exit should rise as some firms are forcedout of the market. (Tushman and Anderson, contrary to my depiction, suggest that theentry/exit ratio should rise, rather than entry rising earlier and exit later. However, theirsuggestion is casual, and entry preceding exit would seem to fit more appropriately withtheir story.) In terms of market shares, they should become more dispersed as the newmarket leaders take over market share from incumbent leaders. So dispersion in marketshares should rise temporarily, and at least many of the firms with leading market sharesshould lose their leading positions to new or formerly small firms.
Why Does Leadership Turnover Occur?Why should turnover in corporate leadership occur? In particular, given that
incumbent firms presumably would like to retain their market leadership, why do theylose their dominant positions to new or small firms? And is this switch of leadershiplikely to occur for any inattentive or poorly managed firms regardless of the nature of theproduct and its associated technology, or are some products and technologies more proneto corporate leadership turnover than others? At least four theories have been advancedto explain why incumbent firms would lose their market dominance:
1. New technology makes obsolete firms’ previous core competencies. For example,makers of mechanical calculators had considerable expertise at creating precisionarithmetical machinery made of cogs, gears, levers, and springs, but little or noskill at making similar machines with electronic components instead of mechanicalparts. The switch in technology may matter because (1a) incumbents do not havethe necessary skills and resources to use and manage the new technology even ifthey have the desire to do so, or (1b) incumbents’ managers do not realize that thenew technology is important even if they have the necessary skills and resources touse it. Theory 1 is suggested by Tushman and Anderson (1986) and Anderson andTushman (1990).
2. Firms are blinded by prior technological views and organizational filters. Giventhe way R&D employees are used to thinking about the technology, and given theway a company and its employees are used to gathering and organizinginformation about new technological ideas, the firm becomes stuck with an oldapproach. Its personnel, and in a sense the whole organization, are stuck in amindset that is soon to be outdated, and they cannot grasp the concepts behind thenew technology. Theory 2 is suggested by Henderson and Clark (1990) in ananalysis of competition in semiconductor manufacturing alignment equipment.
3. Firms are blinded by their customers. Firms are used to providing for the needs ofan existing group of customers, and they may not pay attention to new markets thatinvolve new (and often seemingly smaller) groups of customers. Suppose thatother firms meet the needs of these customers, and the technology that best meets

Industrial Growth and Competition K. Simons, 2003
71
the needs of the new customers (perhaps unexpectedly) turns out to yield muchmore rapid improvements than using the existing technology, so that the newtechnology used for the new group of customers ends up taking over the marketthat had been served by the original technology! Then the companies that used thenew technology to serve the new customers end up taking over the market of theoriginal incumbent firms. Theory 3 is suggested by Christensen and Rosenbloom(1995) in an analysis of competition in the hard disk drive industry.
4. Differing incentives may have differential effects on incumbents versus new firms,so that new firms are more likely to break into new markets and incumbents aremore likely to stick with existing markets. If the new markets turn out to replacethe existing markets, perhaps because the new technology turns out to be better,then the new firms may take over the market from incumbents. R&D costspreading could explain why large incumbents firms would innovate most forexisting markets, whereas for new markets incumbents might have no moreincentive to innovate than new firms. Theory 4 is suggested speculatively at theend of Klepper and Simons’s (1997) analysis of extinctions of industrial firms.
It is unclear how often these different reasons for loss of leadership occur in practice.Even the validity of the individual theories for the industries in which the theories weredeveloped rests on very little factual evidence. Further research is necessary to resolvethe reasons.
Does Leadership Turnover Occur?Christensen and Rosenbloom’s (1995) study of the hard disk drive gained a lot of
interest in management strategy research, and Christensen went on to write a top-sellingbusiness book on the subject. Unfortunately, their analysis of the hard disk drive industryappears to be misleading, perhaps dead wrong. King and Tucci (2002) used the samedata source studied by Christensen and Rosenbloom to do another, very thorough studyof the hard disk drive industry. They were shocked to find that the evidence gave quitethe opposite conclusion from Christensen and Rosenbloom’s conclusion! In their paperis a politic statement that their statement holds for one kind of analysis whereasChristensen and Rosenbloom used another; I haven’t spoken with either set of authors todisentangle quite what this statement means. Christensen and Rosenbloom seem to haveat least done a shoddy analysis of the facts. It seems the hard disk drive industry is not,after all, a compelling example of corporate leadership turnover.17
However, reasonably compelling evidence of leadership turnover does seem toexist in other industries. Technology-driven corporate leadership turnover is for real, butit remains to be seen just how common this phenomenon really is. The answer may be,major leadership turnover is less common than many people have argued, notably lessthan management consultants (including Christensen) who earn money by advising firmsabout the issue. More careful scientific research is needed to better understand thisimportant matter.
17 Similarly, Simons (2002b) shows that in the UK computer consultancy industry, the personal computerand the internet did not cause disruptive competitive effects. He also points out reasons why the personalcomputer and the internet are frequently likely to have only limited disruptive competitive effects. Thiscontrasts with arguments by Hobijn and Jovanovic (2001) for the PC and, for example, Evans and Wurster(2001) for the internet.
Industrial Growth and Competition K. Simons, 2003
72
Possible Firm StrategiesGiven that turnover in corporate leadership occurs, one might wonder how to
prevent it (for incumbent firms that would like to retain their hold on the market) or howto take advantage of it successfully (for firms that would like to take over the market).Schnaars (1994) suggests relevant strategies at the end of his book Managing ImitationStrategies. For incumbents who wish to defend their markets against newcomers, hesuggests:
1. Sell out. While the company is doing very well and hence is worth a lot of moneyin terms of its share prices or potential value to investors, sell the company. Ifcompetitors then take over the market, you’re still rich and the new buyers arepoor.
2. License your technology and set up joint ventures. Perhaps you can arrange amutually agreeable plan with a large firm that has some advantages in relatedmarkets and technologies, thus (a) helping to keep that firm from being yourcompetitor, and (b) strengthening your advantage against other competitors. Also,licensing widely at reasonable charges can keep your competitors happy so theydon’t try to challenge your legal rights to the technology or develop alternativetechnologies.
3. Fight off copycats. Do this in several ways: 3a. Use legal measures, based oncopyrights and patents, to secure your position and harass competitors withlawsuits. 3b. Introduce low-end generic products to preclude competitors breakinginto the low-price high-volume market and perhaps advancing more rapidly as aresult. (Here, Schnaars is vague, suggesting that an alternative strategy might be tofocus on the high-price end of the market.) 3c. Perpetually innovate. Remain aleader in technology, so that competitors do not surpass you. 3d. Create aproprietary standard. Get your technology “locked in,” just as technologies likethe VHS video system and the Windows computer operating system have becomeproprietary standards that benefit certain companies.
For new firms, or for large existing firms who have not yet entered a market, Schnaarssuggests that profitable opportunities may exist to copy a product and enter the market.The opportunities for imitation are greatest, he suggests, when:
1. Small firms have pioneered the new market. Beat them while they’re still weak.2. Patents are absent or can be circumvented. You might: (2a) Show that previous
patents or use of technology preceded the date when firms applied for patents, andthus their patents have no legal validity. (2b) Come up with an alternative designfor the same purpose as a patent, thus getting around (“patenting around”) thepatent. (2c) Use your previous patents defensively and offensively, to protect yourposition and to challenge the rights of incumbents to produce their goods.
3. Related experience in other products or technology give you an advantage. Use therelevant skills of your engineers and scientists, your distribution channels, yourbrand image with consumers, and other advantages.
4. New market segments can be created. Open up the new market segment inaddition to the existing market, thus vastly expanding your sales over that ofcompetitors. Be creative at identifying relevant market segments.
Firms that choose to imitate can follow a number of strategies that, Schnaars argues, canhelp them succeed:
Industrial Growth and Competition K. Simons, 2003
73
1. Anticipate unlikely threats. You are an unlikely threat when you break intosomeone else’s market, and there are probably unforeseen threats facing you too.Brainstorm for possible threats and dangerous situations you might not haveconsidered, and perhaps plan how to preempt or react to these situations.
2. Do concurrent R&D. Remain a leader in technology, so that competitors do notsurpass you.
3. Challenge the pioneer(s), your competitors, through whatever legal and regulatorymeans are possible. For example, you might point out to federal agencies thatapprove drugs (and perhaps even to the public) that a competitor’s drug could havea potential harmful effect.
4. Enter quickly after a substantial market has formed, but do not worry aboutentering early in terms of time or order of entry. Early entry may be irrelevant if,because of the tiny market and its nascent stage, the form of the product is stillevolving and little of the product is being sold. But once the market becomes big,relatively early entry may be important.
5. Don’t copy too closely. If your product is too similar to that of competitors, youmay expose yourself to lawsuits on the basis of patents or copyrights held by thecompetitors.
6. Give continuity to consumers, not too much change. You may have a radicallynew and better version of the product, but if customers don’t want to switch toyour version because it is too different from what they’re used to, then you won’tget many customers.
These competitive strategies may not seem very nice, and certainly anti-trust lawsuits(such as those pending now for Microsoft and Intel, plus past suits that have led to thebreakup of businesses such as General Motors’ bus business) provide some cause forcaution and attention to ethics. But the world of business can at times be a cutthroatworld, and it is unwise to ignore these sorts of competitive concerns and strategies.
Technological and Non-Technological Causes of TurnoverAlthough the reasons discussed above for corporate leadership turnover have all
involved technological change, it is important to recognize that leadership turnover mayoccur for non-technological reasons as well. For example, new companies may targetnew markets that had been overlooked by incumbents. In the UK, Golden Wonderbecame the major producer of potato crisps after it targeted women, children, andfamilies as the end consumers, instead of targeting men in bars as the previous marketleader, Smith’s, had done. In the US, Bic took over the market for ball-point pens byintroducing inexpensive throw-away pens instead of the high-priced stylish pens that hadbeen produced by incumbents. Both Golden Wonder and Bic succeeded in part becauseof technical innovation, but redefinition of the market was key to their success.
Study Guide
Terms to Knowturnover of corporate leadershipincumbentTushman and Anderson
Industrial Growth and Competition K. Simons, 2003
74
era of fermentdiversity of product / manufacturing techniquessales growth forecastingdispersion in market sharescore competencyprior technological viewsorganizational filtersblinded by customersSchnaarsManaging Imitation Strategiessell outlicensingcopyrightsgeneric productslocked inimitationpatenting around
Key Readings with QuestionsTushman, Michael L., and Philip Anderson. “Technological Discontinuities and
Organizational Environments.” Administrative Science Quarterly 31, 1986, pp. 439-465. O. This paper has generated much interest about how existing producers of aproduct might have trouble adapting to technological changes in the product or itsmanufacturing methods, hence allowing new producers a chance to break into themarket.
1. What phenomenon do the authors describe?
2. The authors examine data from several industries. Which industries do they study?And in which of the industries, at what dates specifically, do they observe apparentturnover of corporate leadership? How specifically do they tell when turnover ofcorporate leadership seems to have occurred?
3. What empirical tests do they use to examine whether their theory makes sense? Why?What are the authors’ conclusions from the empirical tests?
4. For what reasons do Tushman and Anderson seem to think that turnover of corporateleadership occurs? Why don’t incumbent firms do something to keep the market insteadof letting new entrants take over the business? (“Incumbent firms” means firms that arealready in the industry.)
Further ReadingsAnderson, Philip and Michael L. Tushman. “Technological Discontinuities and
Dominant Designs: A Cyclical Model of Technological Change.” AdministrativeScience Quarterly 35, 1990, pp. 604-633. O. In part, this paper argues thattechnology-related turnover in corporate leadership results from new technologies that

Industrial Growth and Competition K. Simons, 2003
75
require firms to have new “core competencies” — R&D-related skills, personnel,equipment, and organizational and managerial traits.
Christensen, Clayton M., and Richard S. Rosenbloom. “Explaining the Attacker'sAdvantage: Technological Paradigms, Organizational Dynamics, and the ValueNetwork.” Research Policy 24 (2), March 1995, pp. 233-257. O J. This paper arguesthat technology-related turnover in corporate leadership may result because companiesare blinded by their customers. The desires of customers may not match with theadvantages of new technologies, so the companies may not adopt the new technologies.These companies may be surprised that they lose their market because the newtechnologies have improved and become much better than the old technologies.However, see the article by King and Tucci, which shows that Christensen andRosenbloom apparently got their results completely wrong.
Foster, Richard N. Innovation: The Attacker’s Advantage. New York: Summit Books,1986. U LSE Library HD45 F75. A management consultant argues that new firmsbreak into market positions and triumph over incumbents by coming up with innovativenew products.
Henderson, Rebecca M. and Kim B. Clark. “Architectural Innovation: TheReconfiguration of Existing Product Technologies and the Failure of EstablishedFirms.” Administrative Science Quarterly 35, 1990, pp. 9-30. U LSE library journalsJA1.A3. This paper argues that technology-related turnover in corporate leadershipmay result because companies are blinded by their mindset about the technology.Scientists, engineers, and managers may be used to how to work with one technology,but a new technology may require a new way of thinking and working that they do notrecognize. This problem may occur despite that the company and its employeesotherwise have all the right skills and equipment and know-how to pursue the newapproach to the industry’s technology.
King, Andrew A., and Christopher L. Tucci. “Incumbent Entry into New Market Niches:The Role of Experience and Managerial Choice in the Creation of DynamicCapabilities.” Management Science 48 (2), 2002, pp. 171-186. J. Christensen andRosenbloom seem to have gotten the story wrong in the hard disk drive industry: earlierentrants did better than later entrants.
Reinganum, Jennifer F. 1983. “Uncertain Innovation and the Persistence of Monopoly.”American Economic Review 73(4), 1983, pp. 741-748. O J. This classic articledevelops a simple economic model in which an incumbent and an entrant can try toinnovate, reducing their costs when they succeed. For sufficiently drastic innovations,the incumbent has less incentive to innovate than the entrant.
Schnaars, Steven P. Managing Imitation Strategies: How Later Entrants Seize Marketsfrom Pioneers. Free Press (Macmillan), 1994. B 338.758 SCH. This book describes alarge number of cases of specific products to prove that small, late entrants often canseize markets; in many products, the early movers do not necessarily win and laterentrants may even have an advantage.
Simons, Kenneth L. “Information Technology and Dynamics of Industry Structure: TheUK IT Consulting Industry as a Contemporary Specimen.” Working paper, 2002. Wwww2.rhul.ac.uk/~uhss021. Checks for evidence of whether the internet (and earlierthe PC) might yet have caused disruptive technology effects among UK ITconsultancies.

Industrial Growth and Competition K. Simons, 2003
76

Industrial Growth and Competition K. Simons, 2003
77
8. Shakeouts(Week 6)
A second common process in the dynamics of product markets is industryshakeouts. In many products, the number of producers has been shown to increase overtime following the introduction of a new type of product, reach a peak, and then drop off.Judging from a sample of US products studied by Gort and Klepper (1982), with reviseddata analyzed by Klepper and Graddy (1990), most products that have been around for atleast several decades have had some degree of shakeout in their number ofmanufacturers. In some cases, the shakeouts can be quite severe, with a decrease of 80-90% or more in the number of firms. Not surprisingly, industries with severe shakeoutstend to become quite concentrated, which suggests that an understanding of shakeoutscan help us understand why and how the market shares in industries sometimes becomequite concentrated.18 Shakeouts happen despite expansion of industry output; hence, theyare not (generally) the result of markets drying up.
After completing this section of the course with its required reading, you shouldknow:1. What an industry shakeout is.2. How common industry shakeouts are.3. Typical patterns over time of price and industry-wide production, in industries with
shakeouts.4. Be able to explain the theory of shakeouts discussed in this chapter.5. Know what the theory predicts about survival curves for cohorts of entrants from
different times, and why.6. Know how actual survival curves look for cohorts of entrants from different times in
industries with severe shakeouts.7. How typical survival curves look for cohorts of entrants from different times in
industries with little or no shakeouts.8. Empirical evidence regarding the theory of shakeouts discussed in this chapter.
PrevalenceTable 8.1 conveys a sense of how strong shakeouts typically may be. In
conjunction with Klepper, I refined Gort and Klepper and Klepper and Graddy’s sample.Errors in the original data have been corrected, and the table is limited to products that (a)seem to have particularly valid data and (b) attain at least 40 firms (to reduce randomnoise) at the peak.
As can be seen from the table, judging from the data sample, it appears that mostproducts for which at least several decades of data are available have experienced at leastsome amount of shakeout. Twelve of the 28 products in the table had at least a 50% dropin number of manufacturers from the year with the peak number of firms to the year withthe lowest number of firms thereafter. Some products, however, do not appear to
18 This understanding could also lead to improved understanding about the advantages and benefits ofconcentration and about appropriate market policy.

Industrial Growth and Competition K. Simons, 2003
78
experience substantial shakeouts. For example, despite having been produced for manydecades, ballpoint pens and phonograph records do not appear to have had substantialshakeouts.
Table 8.1. Degree of Shakeout in a Sample of US Manufactured Products
Product Severity of Shakeout First Year in Sample Year of Peak # FirmsDDT 90% 1945 1952Tires, Pneum. Auto 90% 1905 (1896) 1922Television Receivers 89% 1948 1949Saccharin 78% 1905 1918Windshield Wiper
Mechanisms76% 1911 1925
Electric Shavers 74% 1936 1938TV Picture Tubes 74% 1949 1956Adding Machines 70% 1905 1927Radio Transmitters 70% 1922 1962Penicillin 67% 1943 1952Freezers 64% 1944 1954Paints, with Rubber 53% 1933 1966Radar 49% 1945 1962Gyroscopes 43% 1913 1970Artificial Xmas Tree 26% 1924 1965Photocopiers 26% 1939 1968Styrene 26% 1937 1980Shampoo 17% 1905 1949Cryogenic Tanks 16% 1960 1977Piezo Crystals 13% 1935 1963Zippers 12% 1928 1977Ballpoint Pens 4% 1946 1975Microfilm Readers 2% 1939 1978Heat Pumps 0 1953 1979Lasers 0 1962 1979Phonograph Records 0 1905 1979Recording Tapes 0 1951 1979Gas Turbines 0 1940 1979Source: K. Simons’s analysis of data collected from industrial trade registers.
CausesWhy do shakeouts occur? One strategy to answer this question is to choose
products that had particularly severe shakeouts and then to learn about those industries.This is augmented by other strategies, such as using existing theories about shakeouts toguide an analysis of any patterns the theories predict should or should not occur inindustries with shakeouts. For example, one pattern commonly predicted by theories isthat the annual probability of exit among surviving firms should rise during a shakeout,as the rise in exit is often expected to be much of the reason for the shakeout.
To analyze the causes of shakeouts, Klepper and I used a sample of four productsthat had severe shakeouts and for which it was possible to gather large amounts of dataover periods covering a substantial time span. All four products are US manufacturedproducts. The figures on the next page plus one show the number of firms, entry, andexit in each product. Examine first the bottom panel of each figure. The number of firms
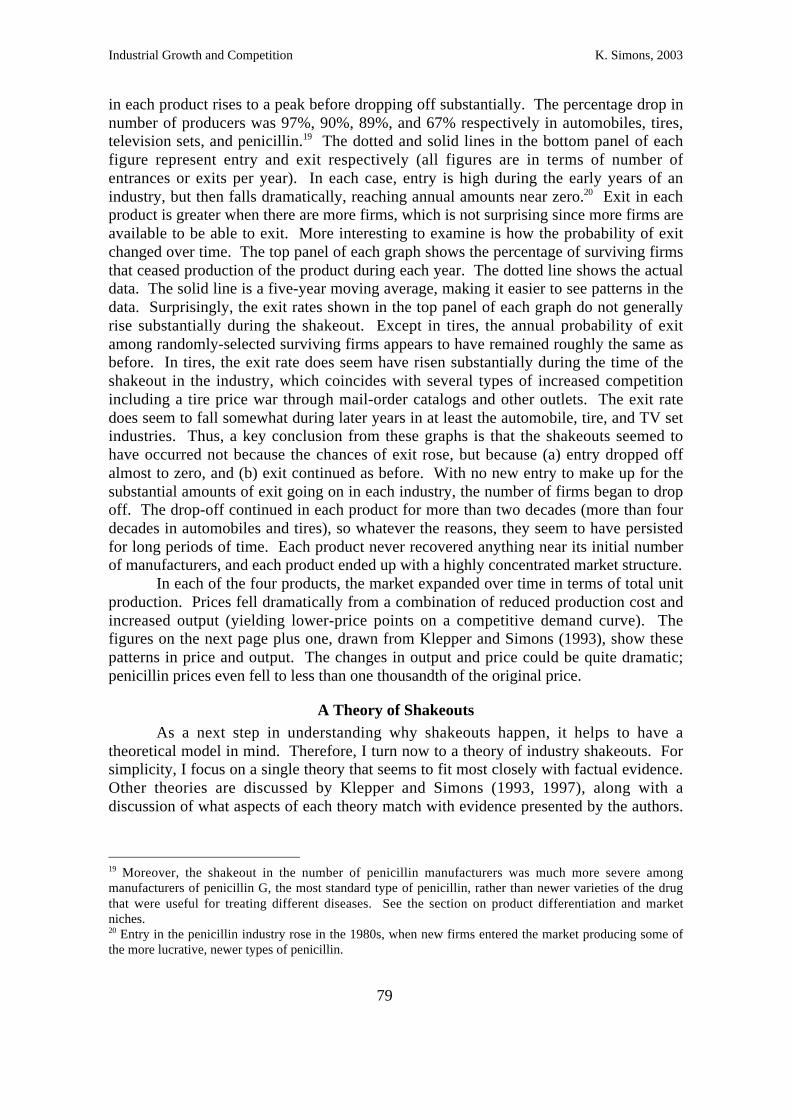
Industrial Growth and Competition K. Simons, 2003
79
in each product rises to a peak before dropping off substantially. The percentage drop innumber of producers was 97%, 90%, 89%, and 67% respectively in automobiles, tires,television sets, and penicillin.19 The dotted and solid lines in the bottom panel of eachfigure represent entry and exit respectively (all figures are in terms of number ofentrances or exits per year). In each case, entry is high during the early years of anindustry, but then falls dramatically, reaching annual amounts near zero.20 Exit in eachproduct is greater when there are more firms, which is not surprising since more firms areavailable to be able to exit. More interesting to examine is how the probability of exitchanged over time. The top panel of each graph shows the percentage of surviving firmsthat ceased production of the product during each year. The dotted line shows the actualdata. The solid line is a five-year moving average, making it easier to see patterns in thedata. Surprisingly, the exit rates shown in the top panel of each graph do not generallyrise substantially during the shakeout. Except in tires, the annual probability of exitamong randomly-selected surviving firms appears to have remained roughly the same asbefore. In tires, the exit rate does seem have risen substantially during the time of theshakeout in the industry, which coincides with several types of increased competitionincluding a tire price war through mail-order catalogs and other outlets. The exit ratedoes seem to fall somewhat during later years in at least the automobile, tire, and TV setindustries. Thus, a key conclusion from these graphs is that the shakeouts seemed tohave occurred not because the chances of exit rose, but because (a) entry dropped offalmost to zero, and (b) exit continued as before. With no new entry to make up for thesubstantial amounts of exit going on in each industry, the number of firms began to dropoff. The drop-off continued in each product for more than two decades (more than fourdecades in automobiles and tires), so whatever the reasons, they seem to have persistedfor long periods of time. Each product never recovered anything near its initial numberof manufacturers, and each product ended up with a highly concentrated market structure.
In each of the four products, the market expanded over time in terms of total unitproduction. Prices fell dramatically from a combination of reduced production cost andincreased output (yielding lower-price points on a competitive demand curve). Thefigures on the next page plus one, drawn from Klepper and Simons (1993), show thesepatterns in price and output. The changes in output and price could be quite dramatic;penicillin prices even fell to less than one thousandth of the original price.
A Theory of ShakeoutsAs a next step in understanding why shakeouts happen, it helps to have a
theoretical model in mind. Therefore, I turn now to a theory of industry shakeouts. Forsimplicity, I focus on a single theory that seems to fit most closely with factual evidence.Other theories are discussed by Klepper and Simons (1993, 1997), along with adiscussion of what aspects of each theory match with evidence presented by the authors.
19 Moreover, the shakeout in the number of penicillin manufacturers was much more severe amongmanufacturers of penicillin G, the most standard type of penicillin, rather than newer varieties of the drugthat were useful for treating different diseases. See the section on product differentiation and marketniches.20 Entry in the penicillin industry rose in the 1980s, when new firms entered the market producing some ofthe more lucrative, newer types of penicillin.
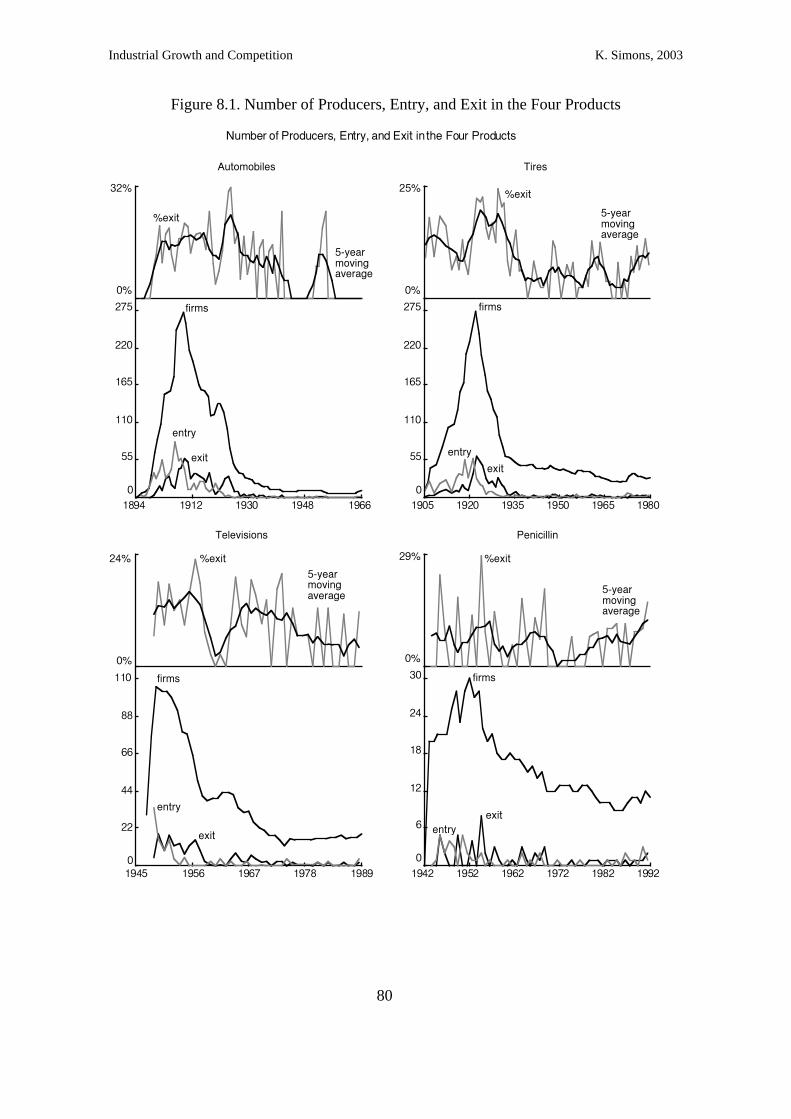
Industrial Growth and Competition K. Simons, 2003
80
Figure 8.1. Number of Producers, Entry, and Exit in the Four Products
1894 1912 1930 1948 1966
0
55
110
165
220
275
0%
32%
Automobiles
firms
exit
entry
%exit
5-yearmovingaverage
1905 1920 1935 1950 1965 1980
0
55
110
165
220
275
0%
25%
Tires
firms
exit
entry
%exit
5-yearmovingaverage
1945 1956 1967 1978 19890
22
44
66
88
110
0%
24%
Televisions
firms
exit
entry
%exit
5-yearmovingaverage
1942 1952 1962 1972 1982 1992
0
6
12
18
24
30
0%
29%
Penicillin
firms
exit
entry
%exit
5-yearmovingaverage
Number of Producers, Entry, and Exit in the Four Products
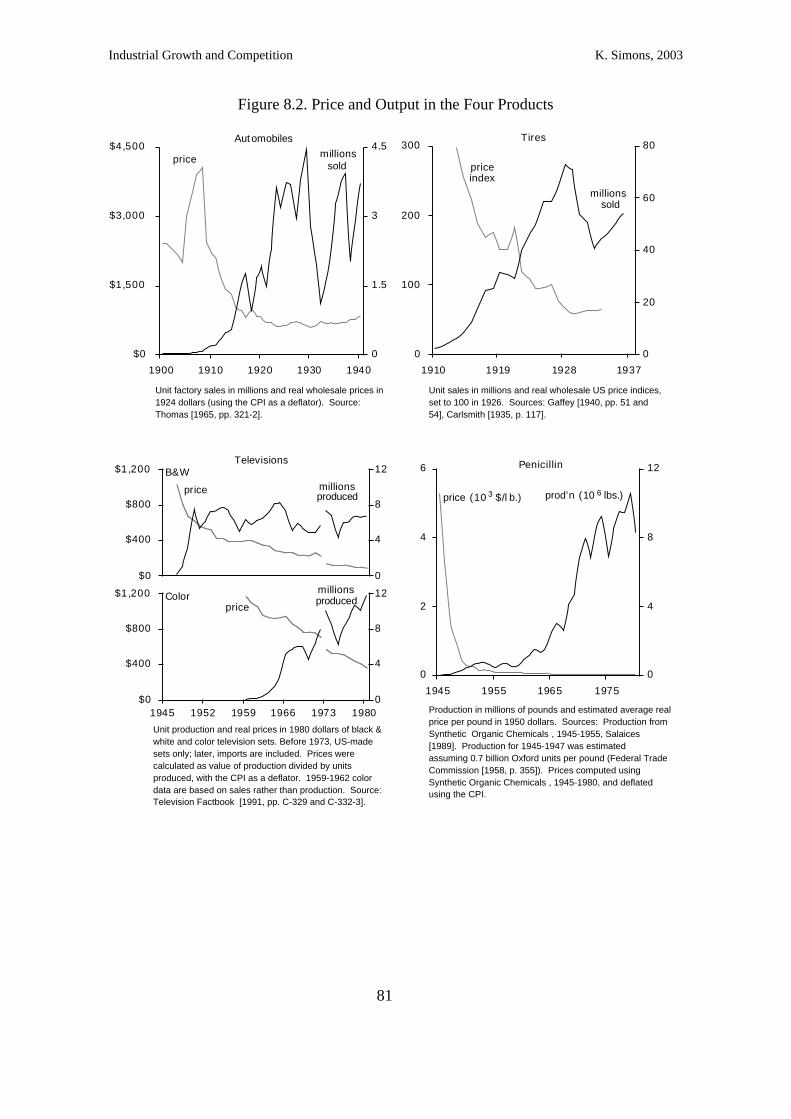
Industrial Growth and Competition K. Simons, 2003
81
Figure 8.2. Price and Output in the Four Products
1945 1952 1959 1966 1973 1980
$0
$400
$800
$1,200
0
4
8
12
millionsB&W
priceproduced
Production in millions of pounds and estimated average realprice per pound in 1950 dollars. Sources: Production fromSynthetic Organic Chemicals , 1945-1955, Salaices[1989]. Production for 1945-1947 was estimatedassuming 0.7 billion Oxford units per pound (Federal TradeCommission [1958, p. 355]). Prices computed usingSynthetic Organic Chemicals , 1945-1980, and deflatedusing the CPI.
Unit production and real prices in 1980 dollars of black &white and color television sets. Before 1973, US-madesets only; later, imports are included. Prices werecalculated as value of production divided by unitsproduced, with the CPI as a deflator. 1959-1962 colordata are based on sales rather than production. Source:Television Factbook [1991, pp. C-329 and C-332-3].
Televisions
$0
$400
$800
$1,200
0
4
8
12millionsColor
priceproduced
0
2
4
6
1945 1955 1965 1975
0
4
8
12Penicillin
price (10 $/l b.)3 prod’n (10 lbs.)6
Unit sales in millions and real wholesale US price indices,set to 100 in 1926. Sources: Gaffey [1940, pp. 51 and54], Carlsmith [1935, p. 117].
$1,500
$3,000
$4,500
$0
1900 1910 1920 1930 1940
0
1.5
3
4.5Aut omobiles
price millionssold
Unit factory sales in millions and real wholesale prices in1924 dollars (using the CPI as a deflator). Source:Thomas [1965, pp. 321-2].
0
100
200
300
1910 1919 1928 1937
0
20
40
60
80
price
millions
Tires
sold
index

Industrial Growth and Competition K. Simons, 2003
82
Figure 8.3. One Theory (that Seems to Fit with Facts) About Shakeouts
low highcompetence of managers
% ofpotentialentrants
incompetent :higher costs
competent:lower costs
(Potent ial) Ent rants 1895-1904
low highcompetence of managers
% ofpotent ialent rants
(Potential) Ent rants 1905-1909
low highcompetence of managers
% ofpotentialentrants
(Potent ial) Ent rants 1910-1916
(By mid-1920s,entry becomesimpossible.)
How big are f irms that entered in 1895-1904? How big... entered in 1905-1909? How big... entered in 1910-1916?
circa 1904
circa 1909
circa 1916
small
medium (but 80% have exited)
large (but 90% have exited)
small
medium (but 80% have exited) small
Firms always enter at small sizes.As t ime goes on, surviving f irms grow.At any point in t ime, earlier ent rants are larger than later entrants.
Size and competence reduce a f irm's costs. Because ofsurvival of t he f it test, f irms in each group are forcedout unt il only competent early entrants remain.

Industrial Growth and Competition K. Simons, 2003
83
The model discussed here is based loosely on two papers by Klepper (1996, 1998). Iintentionally ignore some features of the earlier model that are not essential to such amodel and that do not always fit with the evidence. Also, I intentionally generalizethe approach taken by Klepper to encompass a range of size-related advantages offirms and a range of reasons for varying competency of personnel among differentfirms. For a formal mathematical treatment, consult the papers by Klepper.
Figure 8.3 illustrates the theory. Over time, entrepreneurs and otherindividuals and firms gain the necessary expertise and interests to be able to enter anindustry as producers. This people and firms could choose to enter the industry asproducers, and hence they are called “potential entrants.” Consider for example theUS automobile industry, where commercial production began at about the year 1895.The top left of the figure describes potential entrants in the years 1895-1904. Themanagers of the potential entrants have a range of skills and abilities, so that some ofthem are extremely competent at designing and building cars, and at managing acompany more generally, while others have far less competence. This is shown onthe graph as a distribution, with managerial competence ranging from low to highalong the bottom axis, and with the density function (percentage of firms) appearingon the vertical axis. Even the least-competent potential entrant could choose to enterif desired. The exact shape of the competence distribution is arbitrary, but the resultsdiscussed here hold regardless of the shape.
Potential entrants choose to enter if they expect they can make a profit in theindustry. They know the price at the current point in time, and they also know (atleast roughly) the level of manufacturing cost and product quality they expect (onaverage) to be able to achieve by doing a given amount of research. Thus, they knowtheir expected profit from entering production. (In practice they probably do notknow exactly, but at least they can guess roughly how they are likely to fare. Surveysof actual entrepreneurs seem to indicate they are generally overconfident, but takingthis into account in the model would not alter the general conclusions.) Sincemanufacturing cost and product quality depend on managers’ competence, morecompetent entrants have a greater expected profit than less-competent entrants. As aresult, extremely incompetent potential entrants choose not to enter, while competentpotential entrants do enter. This is shown in the graph by a dashed vertical line.Potential entrants to the left of the line are not competent enough to enter profitably,and therefore choose not to enter, while potential entrants to the right of the line arecompetent enough and do enter. The entrants all make a profit initially, with the mostcompetent entrants making the greatest profit.
Over time, more firms enter the industry, and incumbent firms expand. As aresult, the total industry output rises, causing the price (per unit of quality) to fall. Toshow that shakeouts and related patterns can happen even with a constant demandcurve, the demand curve is assumed to be constant. Similarly, the distribution of newpotential entrants at each point in time is assumed to remain the same over time. Thefalling price makes it harder and harder for new entrants to make a profit in theindustry. Examine the next two graphs at the top of the page. They indicate that thesame distribution of competence applies to potential entrants in the periods 1905-1909and 1910-1916 (however the number of potential entrants is not shown on the graphand may differ over time). In these later periods, potential entrants must beincreasingly competent in order to enter profitably, and hence the dashed line isfarther to the right in the 1905-1909 graph and even farther in the 1910-1916 graph.Eventually, the price falls sufficiently that even the most competent potential entrants
Industrial Growth and Competition K. Simons, 2003
84
cannot profitably enter, and entry ceases entirely. In this example, the comment to theright indicates that entry ceases entirely by the mid-1920s.
At their times of entry, all firms start out small. Over time, they choose toexpand production. The rate of expansion is limited because it costs money toexpand, and the expansion costs are assumed to be convex, that is, the expansion costsgrow more and more rapidly as the rate of expansion increases. Firms chooseamounts of expansion necessary to maximize their profits. The earliest entrants startout small circa 1904, but by circa 1909 the surviving early entrants have grown to amedium size, and by circa 1916 the survivors have grown to a large size. In contrast,entrants in the second group (1905-1909) are small just after they entered, circa 1909,and are medium-sized circa 1916. The third group of entrants, in 1910-1916, arestill small circa 1916. Therefore, by 1916, there is a range of different sizes amongsurviving firms. The earliest entrants are large, the middle group of entrants ismedium-sized, and the last group of firms (which just entered) is small.
In addition to competence, size also gives firms an advantage. The advantagemay exist for many reasons, one of which is R&D cost-spreading (discussed earlier inthe course). Therefore, firms that are both large and highly competent are able toachieve lower costs and better product quality than other firms. As expansion andentry continue to drive up total industry output, and hence drive down the price (perunit of quality), competition becomes increasingly fierce. Unless firms are able toreduce costs and improve quality sufficiently, they become unable to remainprofitable given the decreasing price. Gradually the smallest and least capable firmsare forced out of the market. Note that the relatively small size of later entrants givesthem a disadvantage. Once prices fall sufficiently, even the most competent laterentrants eventually cannot compete, and all of the later entrants are driven toextinction. By a similar process, eventually even the most competent entrants in themiddle entry cohort can no longer make a profit. Thus the cohorts are driven toextinction in reverse order of entry. Eventually, only the most competent earlyentrants are left dominating the market.
Note that, once firms have been in the market for many years, their rates ofexit differ dramatically according to time of entry. Among the earliest entrants, somefirms manage to survive and dominate the industry. In contrast, later entrants aredriven to extinction. Therefore, at old “ages” (years of participation in the industry),the probabilities of exit are especially high for late entrants, but relatively low forearly entrants. In contrast, the theory predicts that at young ages the probabilities ofexit should not depend so much on time of entry. While late entrants are at adisadvantage because of their smaller sizes relative to earlier entrants, they also havean advantage in that only the more competent potential entrants enter during late entryperiods. The disadvantage of size tends to be counteracted by the advantage ofcompetence, helping to equalize the probabilities of exit at young ages. Thus, theheterogeneity (differences) in potential entrants’ and firms’ capabilities has animportant effect on survival rates at young ages. The contrasting effects of entry timeon survival at young versus old ages is an important prediction of the theory anddistinguishes it clearly from other shakeout theories that yield opposite predictions.
Actual Survival PatternsThe figures on the next page examine actual survival patterns of entrants at
different times. The four figures pertain to automobiles, tires, television sets, andpenicillin respectively. The vertical axis of each graph indicates the percentage of

Industrial Growth and Competition K. Simons, 2003
85
Figure 8.4. Survival over Time in the Four Products
0 14 28 42 56 70
100%
0.1%
Automobiles
Years of Production
Firms Surviving
Entrants in 1895-1904
1905-09
1910-66
31.6%
10.0%
3.2%
1.0%
0.3%
S1S2
0 20 40 60 80
100%
31.6%
10.0%
3.2%
1.0%
Tires
Years of Production
Firms Surviving
Entrants in 1901-1906
1907-16
1917-22
1923+
S1
S2
S3
0 9 18 27 36 45
100%
31.6%
10.0%
3.2%
1.0%
Televisions
Years of Production
Firms Surviving
Entrants in 1946-1948
1949-1951
1952+
S2
S1
0 10 20 30 40 50
100%
31.6%
10.0%
3.2%
1.0%
Penicillin
Years of Production
Firms Surviving
Entrants in 1943
1945-52
1953+
S1
S2
Source: Author’s analysis of data from multiple sources; see Simons (1995).
firms surviving. The horizontal axis indicates the age of firms, in terms of the numberof years for which production of automobiles had continued. In each graph, firms aredivided into three or four cohorts or groups. Earlier entrants are indicated usingthicker lines, and later entrants using thinner lines. Dates of entry are indicated besideeach line. Because the vertical axis on each graph is logarithmic, going from 100% to10% to 1% (and to 0.1% in automobiles), a rate of exit can be read from each graph asthenegative of the slope of a line on the graph. Thus, a straight line drawn on thegraph would imply a constant exit rate. The denotations S1, S2, and S3 denote theaverage age of each cohort of entrants at the time each shakeout began, for cohortsthat entered before the shakeout began. These denotations facilitate comparison ofthe probabilities of exit before and after each shakeout began.
Examine the slopes of the graphs – the exit rates – at young ages for eachcohort in each product. At young ages, the exit rates are similar for all cohorts, exceptin penicillin where the earliest entrants have the lowest chances of exit at young ages.At older ages, in all cases the exit rates of the earliest entrants diverges dramaticallyfrom the exit rate of later entrants. The later cohorts of entrants in automobiles andtelevisions are driven to extinction, approximately in reverse order of entry. In tires, asimilar pattern is apparent, except that a few later-entering firms manage to survive inthe long term; and even among the long-lasting late entrants none of them gainedsubstantial market shares or became very important producers in the industry. Inpenicillin, the late entrants also seem to have been driven to extinction, except that afew entrants from the late 1960s (which is part of the 1953+ cohort) were still
Industrial Growth and Competition K. Simons, 2003
86
producing at the date from which data are most recently available. Thus, in all theproducts, the early entrants seem by old ages to have gained a substantial advantage interms of lower probabilities of exit, and except in penicillin no advantage appeared atyoung ages. These data fit closely with the theory, and they differ dramatically frompatterns apparent in other products, such as ballpoint pens or shampoo, thatexperienced little or no shakeouts. The figures on the next page show comparablesurvival curves for US manufacturers of ballpoint pens and shampoo. For these non-shakeout products, the survival curves of early and late entrants are similar at all ages,and in fact if anything the earliest cohort seems to have had a slightly higher rate ofexit compared to later entrants in the ballpoint pen industry.
Finally, consider the source of the apparent advantage enjoyed by some of theearliest entrants into each product industry. Many reasons could exist why earlierentrants had an advantage. However, there is reason to think that R&D cost-spreading, or some similar R&D-related advantage to size, had an important role. Allfour products had enormous rates of technological advance, increasing product qualityand lowering costs. And it turns out that the largest firms led in the great majority ofimprovements to the products and to manufacturing methods, leaving other firmstrailing with regard to quality and cost. Consider counts of major innovations bymanufacturers of each product, as analyzed by Klepper and Simons (1997) based onsources of innovations data that could be gathered. In automobiles, the top twoproducers were responsible together for 43% of such product innovations, and 95% ofprocess innovations, after the year 1902. In tires, the top four firms were responsiblefor 98% of product innovations and, to the extent data are available, all of the processinnovations. The top five TV producers were responsible for 84% of productinnovations and nearly all substantial process innovations. And the top four penicillinproducers were responsible for all of the major product innovations and, to the extentdata are available, seem to have led at process innovation. It appears that the leadingfirms dominated innovation in each product, and that smaller firms were simplyunable to sustain research programs of the magnitude necessary to remain leaders incost and quality. The results of their R&D programs are apparent in their betterproducts and, to the extent data are available, lower manufacturing costs.
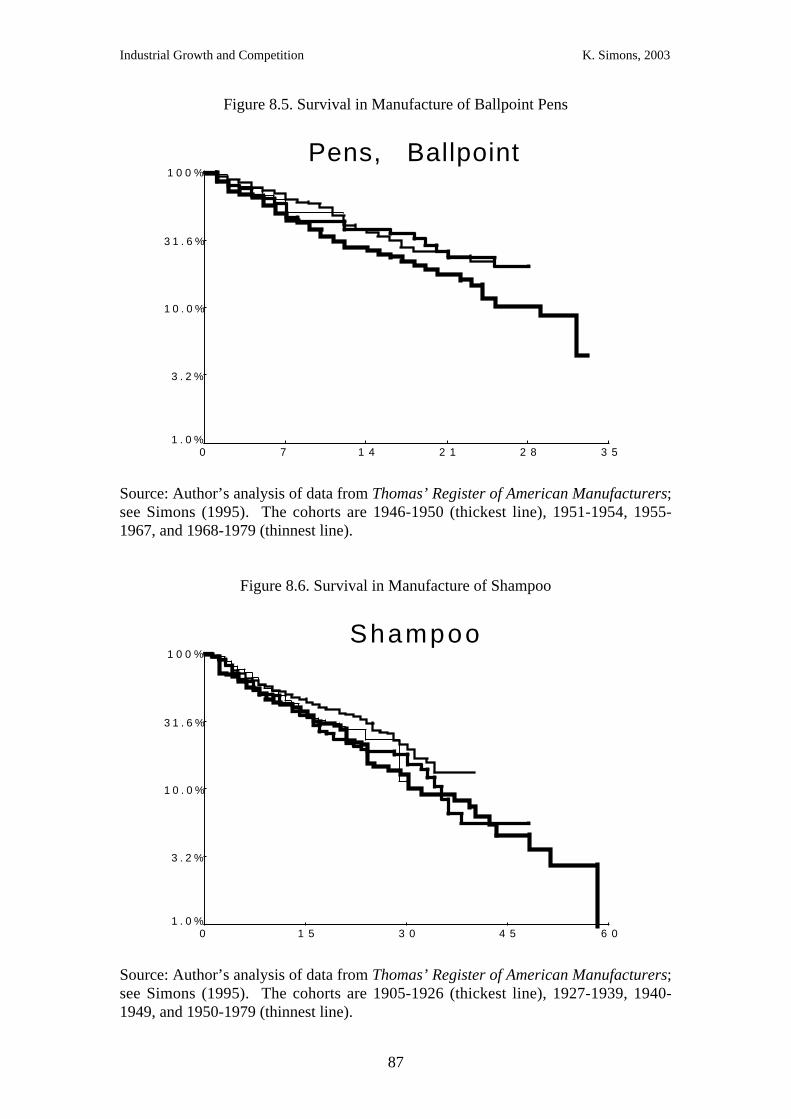
Industrial Growth and Competition K. Simons, 2003
87
Figure 8.5. Survival in Manufacture of Ballpoint Pens
0 7 1 4 2 1 2 8 3 5
1 0 0 %
3 1 . 6 %
1 0 . 0 %
3 . 2 %
1 . 0 %
Pens, Ballpoint
Source: Author’s analysis of data from Thomas’ Register of American Manufacturers;see Simons (1995). The cohorts are 1946-1950 (thickest line), 1951-1954, 1955-1967, and 1968-1979 (thinnest line).
Figure 8.6. Survival in Manufacture of Shampoo
0 1 5 3 0 4 5 6 0
1 0 0 %
3 1 . 6 %
1 0 . 0 %
3 . 2 %
1 . 0 %
Shampoo
Source: Author’s analysis of data from Thomas’ Register of American Manufacturers;see Simons (1995). The cohorts are 1905-1926 (thickest line), 1927-1939, 1940-1949, and 1950-1979 (thinnest line).

Industrial Growth and Competition K. Simons, 2003
88
Summary of Evidence Regarding the TheoryKlepper and Simons (1997, 1999) analyzed products with severe shakeouts to
probe the causes of shakeouts. They collected evidence for the four US industriesdiscussed earlier: automobiles, tires, televisions, and penicillin. The evidence theycollected suggests that the theory described above explains shakeouts quite well. Ofcourse, some aspects of the evolution of these industries are not explained by thetheory, as discussed below. Consider first the evidence in support of the theory:1. Industry output continued to grow dramatically during the shakeouts. So, the
shakeouts did not result from markets drying up.2. Entry dropped to negligible levels at some point, within a few years after the
shakeouts began in tires, TVs, and penicillin, and 10-15 years later inautomobiles. So, entry declined as this theory and most theories of shakeoutspredict.
3. Exit continued over long periods, with the number of firms falling throughoutmultiple decades in each product. So, the shakeouts were not simply theconsequence of some short-term change.
4. Overall rates of exit did not systematically rise at the times of the shakeouts.21 So,the shakeouts do not seem to have resulted from some process that caused atemporary jump in the chances of exit; rather, a more continual process seems tohave been at work.
5. Survival curves for cohorts of entrants from different times show similar rates ofexit across cohorts at very young ages (except in penicillin where the USgovernment discouraged less-able firms from entering the earliest cohort). [Byage I mean years of production in the relevant market.] So, at young ages therising ability requirement for entrants seems to counter any disadvantagesassociated with size or age, confirming theoretical predictions of what wouldhappen if both factors are at work.
6. Survival curves for cohorts of entrants from different times show diverging ratesof exit across cohorts at older ages. In all products, some earlier entrants come todominate the market, while later entrants have much higher exit rates. Indeed, inall products except tires, literally all the later entrants are driven out of the marketby the time they reach fairly old ages.
7. One theory has been that a major invention leads to a shakeout, as firms mustadapt the new technology to their product or manufacturing process if they are toremain competitive. Successful adopters of the technology gain lower costs andexpand, while unsuccessful firms are forced to exit to avoid having their expectedprofits fall below zero. Klepper and Simons collect data on innovations and theirimpacts and show that the major innovations did not cluster around the times ofthe shakeouts, and that when innovations did occur around these times they didnot have the competitive ramifications to be able by themselves to have caused theshakeouts. So, individual major innovations do not seem to have triggered theshakeouts.
8. Another theory has been that the emergence of a dominant product design leads toa shakeout, as firms must switch from competing based on innovative productdesigns to competing by producing the standardized product at the lowest possiblecost. The transition yields a rise in exit as firms must adapt to the new
21 Overall rates of exit rose in tires, and there is evidence of a possible slight rise in penicillin, but inautomobiles and televisions the rate of exit remained constant.

Industrial Growth and Competition K. Simons, 2003
89
technological regime, while entry falls because new product features can nolonger serve as a basis for entry. Klepper and Simons used data on product versusproduct innovation and quality and cost indicators to analyze technologicalprogress over time, and found that the shift from product to process innovationpredicted by the theory did not occur at the times of the shakeouts. Moreover, keyfeatures of eventual product designs did not emerge until well after each shakeoutbegan. So, dominant designs do not seem to have triggered the shakeouts.
9. The leading firms dominated at innovation, giving them leadership in cost andproduct quality.22 So, the evidence fits what would be expected if leading firms’dominance stemmed from R&D.
10. Progressive technological accumulation (“learning”) may also have been relevant,but its competitive relevance was limited by the often rapid diffusion of keytechnologies.
11 . Economies of production scale do not seem to have been the source ofconcentration, as firms tended to employ multiple identical machines.23
12. Patent rights did not give firms dominant positions that kept other firms out of themarket. In automobiles and televisions, patent pools legally guaranteed the rightof firms to share each other’s patents. In the few cases where firms tried to usepatents to deny access to critical technology, other firms generally inventedaround the relevant patents, eventually outcompeting the firm that tried to denyaccess.24
13. Few imports reached the US in the years studied for each product, and there waslittle impact of producers from other nations setting up production in the US, atleast over the first decade of each shakeout.25
14. For further evidence in support of the theory, see the papers by Klepper andSimons.
The theory does not explain some patterns of evolution in the four products:15. The rate of exit rose at the time the shakeout began in tires (and maybe penicillin
slightly), and this concurrent rise in the rate of exit is not explained by the theory.In tires the rise in the exit rate – though not the falloff in entry – has beenattributed by historians mainly to a price war that began when discount catalogretailing chains started selling tires. This finding suggests that the rate of exit maysometimes rise at the time of a shakeout, or at any time, for reasons not describedby the theory.
16. The number of firms stabilized or even rose, beginning at some time long aftereach shakeout began, in all the products. The theory by itself, in contrast,suggests the shakeout would continue indefinitely. One might speculate that the
22 Their leadership in terms of innovation even substantially exceeded their market shares except forautomobiles product innovation.23 In automobiles scale might have mattered, but even considering the oft-discussed body presses,bodies were available from third-party suppliers and even major firms such as Ford continued tooutsource much of their body production.24 The exception was semisynthetic types of penicillin, created after 1958, which treated different kindsof diseases than the earlier “natural” penicillins. Dividing the penicillin market up by types, the naturalpenicillin market experienced a much more severe shakeout than the penicillin market overall, whilenewer types of semisynthetic penicillin were tightly controlled by patents and experienced little or noshakeout.25 Only in televisions was there much impact of international competition during the years studied –eventually all the US producers either ceased production or sold their television manufacturing to firmsbased in other countries, mainly Japan – but non-US firms had little impact for the first decade of theshakeout.
Industrial Growth and Competition K. Simons, 2003
90
advantages to R&D weaken in many products following many decades ofimprovement to the product and its manufacturing methods. Alternatively, as inpenicillin, later entrants might get into new niche markets that are sheltered fromcompetition in the main market.
17. A small number of US-based firms entered in the later years of each product.These firms had tiny market shares and/or participated in niche markets differentfrom the original market.
18. In three of the four products (all except penicillin), there was a gradual shifttoward a more standardized product. Thus dominant product designs oftendevelop over extended periods of time.
19. For further industry patterns not explained by the theory, see the papers byKlepper and Simons.
Technological and Non-Technological Causes of ShakeoutsShakeouts need not only occur in products for which technological advance is
so extreme and R&D cost-spreading provides an advantage to firm size. Advantagesto size or age can stem from other sources such as advertising cost-spreading, brandreputation, and distribution networks. Sutton argues in his analysis of food productsindustries that concentration resulted from advertising cost-spreading, and that R&Dis unlikely to have played a major role. Indeed, shakeouts are apparent in data onfood product industries collected by a fellow student in your course.
Study Guide
Terms to KnowshakeoutKleppercohortheterogeneitydominant design
Key Readings with QuestionsKlepper, Steven and Kenneth L. Simons. “Technological Extinctions of Industrial
Firms: An Inquiry into their Nature and Causes.” Industrial and Corporate Change6, 1997, pp. 379-460. O J. Investigates four products with extremely severeshakeouts in their numbers of producers, as a means to understand the reasons forshakeouts and how technological change can create highly-concentrated industries.
1. What products do Klepper and Simons examine and why? In what eras were theseproducts produced? Do shakeouts seem to occur because of contracting demand?
2. An early-mover advantage seems to exist in the products with severe shakeoutsresearched by Klepper and Simons. What does this mean? How is this advantageseen to exist? What does it mean for late entrants, and is it worthwhile for a firm toenter late in the industry if it knows it almost certainly won’t last long?
3. List all the possible reasons you can think of why earlier entrants might have acompetitive advantage. Which seem more likely to be important, in your own view?How could you gather evidence, and what kinds of evidence might you gather, to testthe relative importance of these different possible sources of advantage?

Industrial Growth and Competition K. Simons, 2003
91
Further ReadingsPhillips, Almarin. Technology and Market Structure: A Study of the Aircraft Industry.
D.C. Heath, 1971. U LSE library HD9711.U5 P55. A classic study of the rich-get-richer phenomenon in industry.
Jovanovic, Boyan, and Glenn M. MacDonald. “The Life Cycle of a CompetitiveIndustry.” Journal of Political Economy, 102, 1994, pp. 322-347. O E. Capturesthe idea that new technology may contribute to competition and shakeouts.
Klepper, Steven. “Entry, Exit, Growth, and Innovation over the Product Life Cycle.”American Economic Review, 86, 1996, pp. 562-583. O J E. A particularly tellingmodel of shakeouts, this seems to come much closer to empirical fact than otherauthors’ theories have come.
Klepper, Steven and Kenneth L. Simons. “The Making of an Oligopoly: FirmSurvival and Technological Change in the Evolution of the U.S. Tire Industry.”Journal of Political Economy, 108 (4: August), 2000, pp. 728-760. J E. Uses richdata from the US tire industry to probe processes of industry evolution and howthey involve technological change.
Klepper, Steven and Kenneth L. Simons. “Dominance by Birthright: Entry of PriorRadio Producers and Competitive Ramifications in the U.S. Television ReceiverIndustry,” Strategic Management Journal, 21 (10-11: October-November), 2000,pp. 997-1016. J. Shows how prior experience can matter to competitive success.
Suárez, Fernando F. and James M. Utterback. “Dominant Designs and the Survival ofFirms.” Strategic Management Journal, 16 (5), June 1995, pp. 415-430. J.
Nelson, Richard R. and Sidney G. Winter. 1978. “Forces Generating and LimitingConcentration under Schumpeterian Competition.” Bell Journal of Economics 9,pp. 524-548. J, or see their classic book which contains the same article: Nelson,Richard R. and Sidney G. Winter. An Evolutionary Theory of Economic Change.Harvard University Press (Cambridge, Mass.), 1982. B 338.09 NEL.

Industrial Growth and Competition K. Simons, 2003
92
9. Alternative Reasons for Shakeouts and IndustryConcentration
(Week 7)
Earlier, this course focused on one source of advantage to large firms – R&Dcost spreading – that can help explain why a few early entrants come to dominate inindustries with shakeouts. This section of the course describes other reasons whylarge firms may experience an advantage, leading possibly to shakeout andconcentration of market shares. Alternative reasons include economies of scale inproduction machinery or methods, progressive cost reduction by some firms beforeother firms reduce their manufacturing costs, lock-in of one firm’s technology ornetwork competition that leads customers to choose one firm’s technology,advertising cost spreading, and sunk costs of entry.
After completing this section of the course and its required readings, youshould be able to explain the following concepts:1. First-mover advantage and early-mover advantage.2. Minimum efficient production scale.3. Alternative shapes of production cost curves.4. Experience (or learning) curves.5. Lock-in of technologies.6. Network economies.7. Advertising cost spreading.8. Sunk costs.9. Sutton’s bounds on industry concentration, and why concentration has a higher
bound when advertising (or R&D) cost spreading is relevant.
Reasons for Advantages to Large Firms / Early EntrantsAny of these reasons can give successful early entrants some sort of advantage
in the market. The most advantage may accrue to the very first firm to enter a market,in which case the firms is said to have a first-mover advantage. Or, because ofrandomness in the capabilities of firms that enter and in how they fare in the market,the firms with the best competitive advantage may be some of many firms thatentered relatively early, in which case the advantaged firms (or all the early entrantsput together) are said to have an early-mover advantage. People often use the term“first-mover advantage” when they mean “early-mover advantage,” but please don’tconfuse the two terms yourself.
Economies of scale in production occur when firms’ unit production costs fallas output rises because of advantages of larger machinery or larger plants. Typicallyunit production costs fall and then eventually level off above a so-called minimumefficient scale. The steel industry is a classic example of economies of productionscale, and in the mid-1970s had a minimum efficient scale of perhaps 4-12 milliontons of steel per year, or 3-8% of 1967 US demand (Scherer and Ross, 1990, pp. 102-103, 115). In practice, economies of production scale have not been found to havemuch relation to measures of market concentration, suggesting that scale economiesin practice generally are not the reason for actual industry concentration (Bain 1956,Scherer et al. 1975).

Industrial Growth and Competition K. Simons, 2003
93
Theoretical economic models often make assumptions about the shape ofmarginal production cost curves. For example, one plausible assumption that issometimes made is that marginal production costs decline up to minimum efficientscale and remain constant thereafter. Another assumption often made is that marginalcost curves are U-shaped or convex, but given available evidence for long-run costcurves this assumption appears to be incorrect; be wary of theoretical arguments thatrely on U-shaped or convex long-run firm cost curves. Let C(Q) be the marginal costof production as a function of the quantity produced. Increasing returns to scale occurwhen C falls as Q increases, so that C'(Q) < 0. This gives firms lower marginal costs,and lower average costs, as output increases. Constant returns to scale occur when Cremains constant as Q increases, so that C'(Q) = 0. Decreasing returns to scale, whichseem almost never to happen for long-run marginal cost curves, occur when Cincreases as Q increases, so that C'(Q) > 0. The rate of change of C'(Q) is C''(Q), sothat C' rises with Q if C'' is positive, C' remains constant if C'' is zero, and C'decreases with Q if C'' is negative. If it were the case that C'(Q) < 0 and C''(Q) < 0,marginal costs would fall as Q increases (since C' < 0) and they would fall at a greaterand greater rate (since C'' < 0, causing C' to be a bigger and bigger negative numberas Q increases); this would probably not be realistic. More realistic would be theassumption that C'(Q) < 0 and C''(Q) > 0, so that marginal costs fall as Q increases(since C' is a negative number) but they fall less and less quickly (since the positivevalue of C'' adds to the negative number C' bringing it closer to zero, so that thechange in marginal cost as output increases could eventually approach zero).
Progressive cost reduction occurs when a firm’s manufacturing costs declineover time. Specifically, researchers have often characterized costs as declining as afunction of cumulative output to date. Thus, if a firm has produced n-1 units of theproduct in past, its cost of producing the nth unit might be D(n). The function D(n)traces out a decreasing curve when graphed. Such a cost reduction curve is oftencalled an experience curve or learning curve. They might occur for many differentreasons. The term “learning” suggests that workers on the plant floor learn to do theirjobs more rapidly and efficiently, but in practice progressive cost reduction usuallyseems to stem from other sources such as continual engineering improvements toproduction methods and machinery.
Lock-in of a technology occurs when the technology becomes a standard thatall producers use. The standard may exist because customers (or possibly firms)demand it or because industry committees or government require it. Consider forexample the layout of keys on a typewriter or on a computer keyboard. Almostcertainly you use a keyboard beginning “QWERTY” in the top row of letters. Thiskey layout emerged in the late 1800s, when typewriters used metal bars to press inkonto the page each time the user pressed a key.26 At first companies used different
26 Why was the keyboard laid out this way? One myth has been that the metal type bars would easilyrun into each other and get stuck, jamming the typewriter, if users typed too quickly, and that thereforethe QWERTY keyboard arrangement was chosen to keep commonly used letters far apart from eachother. This explanation is wrong. For example, “er” and “re” are the most frequently used pairs ofletters in English, but they are placed next to each other on the keyboard; similarly the most commonlyused letters in English are not particularly far apart on the keyboard. Another theory, that the keoboardwas arranged to be able to spell out TYPEWRITER quickly and impress customers, also seems strangebecause although all the necessary keys are in the first row of letters, it would have been faster to typealternate letters on different hands, in which case every other letter should be on opposite sides of thekeyboard. Nor does the key layout correspond to the order of letters used in a printer’s tray. Adler(1997, p. 61) concludes, after reviewing these and other theories, “[I]t seems likely that most of theletters were simply arranged at random in the order they were extracted from a box…. [T]here were so

Industrial Growth and Competition K. Simons, 2003
94
keyboard layouts. But as more and more typists trained to use the QWERTY layout,and as more and more users acquired typewriters using the QWERTY keyboard, itincreasingly made sense for companies to buy QWERTY typewriters and for typiststo learn to type with the QWERTY keyboard. QWERTY became a de facto standardfor typewriter keyboards. It is not clear that the QWERTY keyboard is the bestarrangement, and indeed more recent typing methods are available, such as the so-called Dvorjak keyboard layout, or finger holes in which users move multiple fingersside-to-side in different directions to indicate different letters. In some cases, morerecent standards may be better, but there is a high cost to companies and typists thatswitch away from the standard that everyone else uses, tending to hamper the switchto new and better methods. Indeed, Paul David and other writers about lock-in haveargued that technologies other than the best tend to become locked-in, althoughapparently no evidence exists to support this claim – in particular David’s argumentthat the Dvorjak keyboard is inherently better than QWERTY was based onmisleading evidence; see Liebowitz and Margolis (1990).
Lock-in in some cases gives much of the market value to one company andtakes it away from other companies, as happened when the VHS standard forvideocassette records won out over the competing Betamax standard. With storescarrying more VHS movies, consumers had an incentive to buy VHS video machines,and with consumers having VHS machines, video stores had an incentive to stockfilms in VHS format. The locked-in VHS format has lower recording quality thanBetamax, but offers longer recording times (the longer recording times wereespecially important in the early years of videos, as they allowed full recording of afilm or sports event on a single tape). A similar lock-in process has led to marketdominance by Sony in video game machines that attach to televisions.
Lock-in often involves network economies, in which the “network” of peopleor companies using a standard gives benefits (“economies”) to each person orcompany in the network. For example, users of the Microsoft Word word processorbenefit from the network of other users with whom they can readily exchangedocuments and who can help each other understand how to use the program.
Advertising cost-spreading can operate much like R&D cost-spreading.Companies choose national advertising budgets, and advertising affects consumers’willingness to buy. If there are decreasing marginal returns to advertising, as wasassumed for R&D, companies with larger outputs will choose to spend more onadvertising and will achieve lower price-cost margins. You can work out themathematics identically to the earlier model of R&D cost-spreading, but substitutingadvertising in place of R&D. The earlier model assumes that growth in firm size islimited. Sutton (1991), in his book Sunk Costs and Market Structure, develops asteady-state model in which he assumes that firms can grow to any size they desire,but the number of firms is limited because only a few firms can be large enough toremain profitable given that advertising cost-spreading gives an advantage to thelargest firms.27 In his model, firms pay a sunk cost in order to establish theiradvertising reputation.
many more important things to worry about, such as whether the project would even succeed in gettingoff the ground.”27 In Sutton’s model with advertising cost spreading, you might expect that only one firm could exist,because if one firm is responsible for the entire market output, it will have a lower cost than two firmseach with half the market output, so that whichever firm becomes larger can outcompete the other firm.Whether this is predicted to happen depends on the nature of competition between firms. UnderBertrand competition, prices must be driven as low as possible, leaving only one firm which supplies
Industrial Growth and Competition K. Simons, 2003
95
Sunk costs can take many forms, but all involve investing a substantial sum ofmoney that must be paid before a firm is able to produce a product. In the case ofadvertising, the sunk cost involves establishing a reputation with consumers. Othersunk costs involve paying for (a) plant and equipment required to achieve a minimumacceptable production scale, (b) R&D, or (c) approval by government regulatoryagencies. Because sunk costs come in discrete chunks, it is possible for a limitednumber of firms to enter an industry and remain profitable. Perhaps two firms couldprofitably enter an industry, but entry by a third firm would reduce the profits of allfirms below zero. If the third firm is profit-maximizing, it will choose not to enter,leaving two firms that each earn positive profits.
How Assumptions Affect Conclusions in Models of Industry CompetitionAnalysis of competition in industries is complicated by the fact that different
conclusions can result depending upon the assumptions put into a model. This isespecially true for two of the main themes of past research in industry economics, (a)the nature of competition (in particular to what extent firms can receive the benefits ofcollusion either intentionally or unintentionally), and (b) product differentiation. Themodels are generally based on simple static assumptions, rather than focusing on thedynamics of industries, and they are usually developed without much attention toempirical evidence. Basic competitive models include those of monopoly, Cournotcompetition (firms choose quantities), and Bertrand competition (firms chooseprices). Product differentiation models vary according to the “space” over whichfirms can differentiate, such as a line segment (as for soft drink sellers located along abeach), a circle, a plane, the surface of a sphere, etc. The space can representdifferent product characteristics, such as the speed of a car, the color of wallpaper, orthe sweetness and crunchiness of breakfast cereal. Product differentiation modelsalso vary according to the number of firms allowed to participate and the specificways in which their competition affects each other. In general, the predictions ofmodels depend on the nature of competition and the characteristics of productdifferentiation assumed in the models, and the outcomes predicted by the models varyenormously depending on the assumptions.
Bounds on Predicted Industry ConcentrationJohn Sutton’s Sunk Costs and Market Structure is highly regarded by industry
economists for his elegant treatment of how, despite the huge variation in predictionsresulting from these different assumptions, some characteristics of industrycompetition might be predictable. He develops a model (which stems from joint workwith Avner Shaked) in which an industry either does or does not have opportunitiesfor advertising cost-spreading. He allows for a great range of possible forms ofcompetition and product differentiation, and shows that market concentration may bemore or less depending on the form of competition or differentiation. However, hepoints out, if advertising cost-spreading matters, then there is a lower bound on howconcentrated an industry can be – the industry must be at least as concentrated as apredictable lower bound. This conclusion is illustrated in Figure 9.1. Thus, his modelpredicts that advertising cost-spreading can lead to concentrated industries, much asKlepper’s model of shakeouts predicts eventual market concentration as (in part) a
the whole market at a price equal to average manufacturing cost, and which therefore does not makeany profit. But under other types of competition, such as Cournot competition, multiple firms mayshare the market, with each firm being less efficient than would be possible were it to expand.
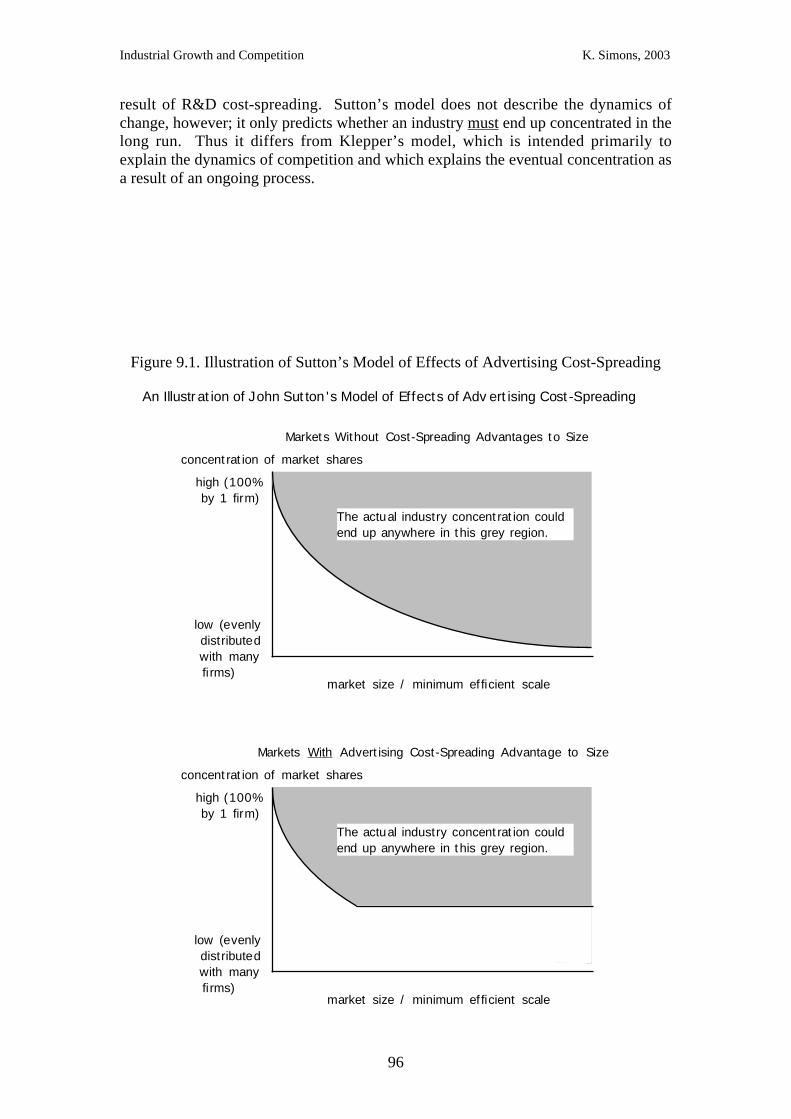
Industrial Growth and Competition K. Simons, 2003
96
result of R&D cost-spreading. Sutton’s model does not describe the dynamics ofchange, however; it only predicts whether an industry must end up concentrated in thelong run. Thus it differs from Klepper’s model, which is intended primarily toexplain the dynamics of competition and which explains the eventual concentration asa result of an ongoing process.
Figure 9.1. Illustration of Sutton’s Model of Effects of Advertising Cost-Spreading
concent rat ion of market shares
high (100% by 1 firm)
low (evenly distributed with many firms)
market size / minimum ef ficient scale
Markets With Advert ising Cost-Spreading Advantage to Size
The actual industry concent rat ion couldend up anywhere in t his grey region.
concent rat ion of market shares
high (100% by 1 firm)
low (evenly distributed with many firms)
market size / minimum ef ficient scale
Markets Without Cost-Spreading Advantages to Size
The actual industry concent rat ion couldend up anywhere in t his grey region.
An Illustr at ion of John Sut ton 's Model of Effects of Adv ert ising Cost -Spreading

Industrial Growth and Competition K. Simons, 2003
97
Study Guide
Terms to Knoweconomies of scaleminimum efficient scalemarginal cost of productionincreasing returns to scaleconstant returns to scaledecreasing returns to scaleprogressive cost reduction
experience curvelearning curvelock-inQWERTYnetwork economiesadvertising cost-spreadingsunk cost
first-mover advantageearly-mover advantagemonopolyCournot competition
Bertrand competitionproduct differentiationSuttonSunk Costs and Market Structure
Key Readings with QuestionsScherer, F.M. and David Ross. Industrial Market Structure and Economic
Performance, 3rd ed. Boston: Houghton-Mifflin, 1990. R 338.758 SCH. Use thesection of chapter 4 pertaining to economies of scale and scope (pages 97-141 in the3rd edition). The evidence suggests that firms and their manufacturing plants facelong-run cost curves that involve minimum scales necessary to be efficient. In someindustries, plants seem to face diseconomies of scale above some size because oftransportation costs and (rarely) other reasons, but the notion of long-run U-shapedcost curves for firms is unproven and is likely pure fiction. Make sure you gain aknowledge of commonly-discussed reasons for advantages or disadvantages to plantsize and firm size.
1. Draw two graphs, one showing economies of scale and economies of scope, theother showing economies of scale and diseconomies of scope. Provide examples ofsituations in which each graph could be correct.
2. Think of at least a dozen distinct reasons why companies’ cost, or laborrequirements per unit of output, might go down over time on a so-called “learningcurve.” If you were working as a consultant for Boeing’s Wichita plant when it builtits B-29 bombers, how could you measure the relative importance of these differentreasons?
3. In what industries are transportation costs likely to be especially important? Do theexistence of transportation costs cause economies of scale, or diseconomies of scale?Draw example total and marginal cost curves for companies in an industry with hightransportation costs, and for companies in an industry with low transportation costs.Write down a mathematical equation that could fit the general shape of each costcurve.
4. What approaches might one use to measure economies of production scale?Explain using an example how you would go about each approach.
Industrial Growth and Competition K. Simons, 2003
98
5. How important, in practice, do minimum efficient scales of production seem to be?Provide an answer in specific, concrete terms, using some actual numbers.
5. On one sheet of paper, write at the top “Advantages of Large Size,” and on another,write at the top “Disadvantages of Large Size.” Brainstorm and write down everyreason you can think of (however wild it might be) for large companies to havecompetitive advantages or disadvantages.
6. If a company in the industry you’re studying hired you as a consultant, how mightyou test to see, in that industry, whether the advantages to being large outweigh thedisadvantages, or vice versa? How would you resolve the company’s question to findout how important are the various possible sources of advantage or disadvantage (aslaid out in your answer to question 5), and what kinds of information would youcollect in order to answer the question?
7. How might advertising yield economies of scale and scope? What evidence doesthe book use, and how, to get at whether or not these reasons are important?
— To answer questions 8 and 9, you will need to read the remainder of chapter 4 inthe Industrial Market Structure and Economic Performance. —
8. “Gibrat’s law” proposes that in a given year, the percentage growth or contractionof a firm’s size is a randomly chosen number that has nothing to do with how big thecompany is. If Gibrat’s law is right, even with no economies of scale, industries willstill become very concentrated over time. Why? If this is true, does it have to be thecase that chance alone determines corporate success, and there is nothing companiescan do to make themselves more successful? Why or why not?
9. Have government policies affected economies of scale or scope? Explain.
Sutton, John. Sunk Costs and Market Structure: Price Competition, Advertising, andthe Evolution of Concentration. Cambridge, Mass.: MIT Press, 1991. B R 338.6SUT. This book escapes the problem that theories of market competition andproduct differentiation generate almost any result depending on the particularassumptions; it does so by predicting bounds on the results instead of specificresults. It argues that advertising cost spreading and other sources of sunk costs orincreasing returns — such as the R&D cost spreading considered earlier in thiscourse — can cause a market to become tightly concentrated among a fewproducers, whereas markets without these influences need not become tightlyconcentrated. I suggest you not worry about understanding the mathematical model– which some people argue has drawbacks anyway – but get the notion of boundsand look at how Sutton uses empirical evidence to support his case.
1. What are the differences between Cournot and Bertrand competition? (Recall whatyou did from Tirole’s book.) How do you think real firms compete?
2. In what way does Sutton analyze a continuum ranging from a monopoly to Cournotcompetition to Bertrand competition?

Industrial Growth and Competition K. Simons, 2003
99
3. What does Sutton mean when he says that, in models in which “firms are permittedto produce more than one product..., multiple equilibria are endemic” (p. 40)?
4. Explain the meaning of both graphs in Sutton’s Figure 2.4 (p. 42).
5. What is a sunk cost (p. 46)?
6. Sutton considers a wide range of ways that industries might be (p. 47). Describethis range.
– You may wish to skip Sutton’s sections 3.2 through 3.5, if you are short on time. –
7. From Sutton’s section 3.6 (pp. 77-81), explain Figure 3.9.
8. Why could advertising cost-spreading lead to the pattern shown by the solid line inFigure 3.9? Specifically, why wouldn’t there be lots of companies (and hence lowconcentration) — even though total industry sales may be gigantic — in advertising-intensive industries?
9. What industries does Sutton analyze, in what countries (pp. 84-90)? Why?
10. How does Sutton measure market size and concentration (pp. 90-91)?
11. How does Sutton measure setup costs (pp. 93-99)?
12. Explain the point of Figure 5.4 (p. 118), which shows two graphs, for industriesthat aren’t and are advertising-intensive.
David, Paul. “Clio and the Economics of QWERTY.” American EconomicAssociation Papers and Proceedings 75 (2), May 1985, pp. 332-337. O J E.Illustrates how a particular technology, not necessarily the most efficienttechnology, can become locked in place as a result of historical accident.
1. Recount from your memory the history of the QWERTY keyboard. Why is itargued not to be the ideal keyboard design? (The article by Liebowitz and Margolisbelow presents compelling evidence that Paul David is wrong about its inefficiency.)How did it come to be the standard? Why don’t people just switch to a better design?
2. What does Paul David mean by the terms “path-dependent,” “historical accidents,”and “lock-in”?
Further ReadingsAchi, Zafer, Andrew Doman, Olivier Sibony, Jayant Sinha, Stephan Witt. “The
Paradox of Fast Growth Tigers.” McKinsey Quarterly, (3), 1995, pp. 4-17. O J.An easy-reading managerial-audience article on firm growth with increasing returnsdynamics.
Arthur, W. Brian. “Competing Technologies, Increasing Returns, and Lock-In byHistorical Events.” Economic Journal 99 (March), 1989, pp. 116-131. J E.

Industrial Growth and Competition K. Simons, 2003
100
Liebowitz, S. J. and Stephen E. Margolis. “The Fable of the Keys.” Journal of Lawand Economics 33 (1: April), 1990, pp. 1-25. W http://www.utdallas.edu/~liebowit/keys1.html. Shows that the QWERTY keyboard seemingly is no worse thanDvorak, to argue that there is little evidence that the technology that gets locked inis of poor quality relative to technologies that don’t get locked in.

Industrial Growth and Competition K. Simons, 2003
101
10. Product Differentiation and Market Niches(Week 8)
In practice when you analyze competition in industries, it is rarely the casethat industries for which you obtain information will have a single type of product (ofpossibly varying quality) produced by all firms.28 Rather, different products will beavailable to meet the needs of different groups of consumers. Therefore, it may beimportant to consider the effects of product differentiation on competition.
After completing this section of the course, you should be able to:1. Explain the three reasons discussed below for how product differentiation matters
for competition and industry analyses.2. Explain the concept of market niches.3. Discuss product differentiation in the US penicillin and UK fertilizer industries,
including how each industry fits with the above concepts regarding productdifferentiation.
How Product Differentiation Matters for Competition and Industry AnalysesProduct differentiation matters to competition and to industry analyses for at
least three reasons:1. Competition takes place primarily at the level of product industries. Specifically,
shakeouts and turnover of corporate leadership should be expected to occuramong firms providing products that meet the same (or at least similar) needs forthe same (at least partly the same) group of consumers. By aggregating theseproduct industries, you change the patterns you might expect to see. For example,suppose you analyze the motor vehicle industry, combining together theautomobile, truck, bus, and motorcycle industries as well as all the industriesproducing parts for such vehicles. Although shakeouts and early-moveradvantages occurred for at least the automobile and bus industries, the data for thewhole motor vehicle industry may not necessarily show much of a shakeout normuch early-mover advantage. Also, the aggregated data obscure the times whenshakeouts occurred in each product, the differing extent to which there was anearly-mover advantage, etc. A similar issue would be arise when analyzing thewhole of the electronics industry versus individual sub-markets of the industry.
2. Having a substantially different product from the products of other firms canprovide some degree of protection from competition with those other firms. Forexample, sports car makers may be nearly unaffected by a major firm reducing itsprice for a low-cost family car, whereas other makers of low-cost family carswould experience greater competition.
3. Advantages to size (or to other characteristics of firms) may span multiple nichesor multiple product markets. For example, economies of scope in the productionprocess imply that the costs of producing one product decrease when substantialamounts of another product are produced. Similarly, R&D work may be relevantto multiple products or their manufacturing processes, and brand reputation maybenefit a firm for all the different products it sells.
28 Variations of quality of a product are known as vertical product differentiation, whereas variations tomatch different consumers’ tastes are known as horizontal product differentiation.

Industrial Growth and Competition K. Simons, 2003
102
Market Niches DefinedMarket niches are natural differences in the market according to major
differences in product differentiation that could fit consumer demands. For example,it might be said that the market for automobiles has market niches for family-sizecars, sports cars, luxury cars, and off-road vehicles. Each sub-market of theautomobile industry is somewhat independent of the others in terms of consumerdemand and competition.
Examples of Product Differentiation and its EffectsTwo examples of product differentiation are Klepper and Simons’ (1997) data
on US penicillin producers and Shaw’s (1982) analysis of the UK fertilizer industry.In penicillin, the so-called “natural” penicillin varieties, especially penicillin G, werecommodity products with fierce competition as prices plummeted over time. Incontrast, most of the “semisynthetic” penicillin varieties, introduced after newtechniques were pioneered circa 1958, were patented and closely held, and prices forsemisynthetic penicillins were much higher than for natural penicillins. Table 10.1lists US penicillin manufacturers from 1948 to 1993 for which the types of penicillinmanufactured could be determined. The table shows for each type of penicillin thefirms that made that type and their dates of production. Penicillin G and the naturalpenicillins in general (G, O, and V in the table) experienced a sharp shakeout in theirnumbers of manufacturers.
With the advent of the semisynthetics, a few of the major natural penicillinproducers also began to produce semisynthetic varieties, along with some new firmswhich entered semisynthetic production. Beecham from the UK (which had beenlicensing some firms) eventually entered US production also. While patents remainedin force, the number of firms in semisynthetic markets remained small. A few morefirms entered after patent expiration.29
Thus, firms that innovated in the development and patenting of new types ofpenicillin were able to reap the substantial profits associated with these new marketniches. The US penicillin industry is also an example of how a shakeout may impactmanufacturers in part of the market, while in other market segments firms areunaffected by competition. Indeed, the different types of penicillin were useful fortreating different diseases, so the advent of new types generally did not take awaysales from old types – although other antibiotics were competitors – and unit salescontinued to grow over time in each major market segment.
In UK fertilizers as analyzed by Shaw (1982), firms typically producedmultiple kinds of fertilizers. It makes sense to define the product space in simplifiedform as having two dimensions, (1) nitrogen and (2) potassium and phosphorous.Firms had multiple products at different points in the product characteristics space,which is the space over which products were differentiated. (A productcharacteristics space might take on different forms in different cases. For soft drinksellers locating at different places along a beach, the space would be a line segmentrepresenting locations on the beach. In this case the product characteristics space is a
29 Some of the semisynthetic producers eventually began some natural penicillin production. The twotypes of production were closely related, so this pattern suggests that, decades after the introduction ofpenicillin, the semisynthetic producers were able to achieve competitive costs in natural penicillinproduction. (Natural production is, roughly, a step in the production process for semisyntheticpenicillin.)

Industrial Growth and Competition K. Simons, 2003
103
Table 10.1. Penicillin Types and Their Manufacturers, 1948-1993
Penicillin G† [Innovation dated as 1942 by Achilladelis]Abbott 1948-1964Baker 1948-1952Bristol 1948-1959, 1961, 1974, 1977, 1981-1983Commercial Solvents 1948-1959Cutter 1948-1954Heyden 1948-1953Hoffman LaRoche 1948-1949Lederle 1948-1949, 1954-1955Lilly 1948-1969, 1972, 1976-1981Merck 1948-1986Pfizer 1948-1992Schenley 1948-1953Squibb 1948-1982X 1948-1953, Upjohn 1954-1957Wyeth 1948-1993U.S. Rubber 1949Monsanto 1954Penick, S.B. 1954-1955
Penicillin O X 1951-1953, Upjohn 1954-1964, 1966Pfizer 1968-1975
Penicillin V† *Lilly 1955-1990Abbott 1956-1974Wyeth 1956-1976, 1983-1985Bristol 1958, 1970-1985, 1987, 1989-1993Squibb 1968-1976Pfizer 1976-1988[*Also developed by Glaxo (UK).]
Phenethicillin† *Bristol 1959-1975Pfizer 1960-1965, 1967-1971Squibb 1960-1961, 1963-1964Wyeth 1962-1966[*Also developed by Beecham (UK).]
Ampicillin† Bristol 1963-1993Wyeth 1966-1993*Beecham 1968-1990Squibb 1968-1976Trade Enterprises 1971-1981Biocraft 1972-1993Kanasco 1986-1992
NEP penicillin Merck 1963Methicillin Bristol 1961-1985
Beecham 1972-1982Wyeth 1991

Industrial Growth and Competition K. Simons, 2003
104
Table 10.1 (contined)
Oxacillin Bristol 1961-1985Beecham 1969-1992Biocraft 1979-1992
Cloxacillin Bristol 1964-1985Beecham 1968-1993Biocraft 1980-1988, 1990-1993Kanasco 1991-1992
Nafcillin Wyeth 1964-1990Beecham 1975-1976, 1984-1988, 1990-1991Bristol 1975-1977, 1979-1985, 1987
Dicloxacillin Bristol 1966-1979, 1981-1985Beecham 1968-1992Wyeth 1968, 1970-1975, 1977-1989Biocraft 1983-1993Kanasco 1990, 1992
Hetacillin Bristol 1966-1979, 1981-1991Carbenicillin† [Innovation dated as 1969 by Achilladelis]
*Beecham 1970-1985, 1987, 1989††*Pfizer 1972-1986, 1988Biocraft 1986
Amoxicillin Beecham 1973-1993Biocraft 1976-1993Bristol 1977-1993Trade Enterprises 1978-1979Wyeth 1980-1985Kanasco 1986-1992
Ticarcillin Beecham 1976-1993Azlocillin† [*Developed 1978 by Bayer (Germany)]Cyclacillin Wyeth 1978-1985
Bristol 1984-1985Biocraft 1986, 1988
Epicillin Trade Enterprises 1978-1982Kanasco 1986
Piperacillin Bristol 1982-1993Amdinocillin† [*Developed 1984 by Roche (Switzerland)]Sulbactam† [*Developed 1986 by Pfizer]Floxacillin Beecham 1989††
*Innovating firm.†Major innovation according to Achilladelis (1993).X Identity of producer kept confidential in Synthetic Organic Chemicals.††Beecham may have continued production of carbenicillin and floxacillin after 1989.After 1987, Synthetic Organic Chemicals does not specify all of the semisyntheticpenicillins produced solely by Beecham.
Sources: Synthetic Organic Chemicals, FTC (1958), and Achilladelis (1993).Reprinted based on Klepper and Simons (1997).

Industrial Growth and Competition K. Simons, 2003
105
square in which firms choose percentage concentrations of (1) nitrogen and (2)potassium and phosphorous.
Competitively, firms did not spread out across this two-dimensional space assome theories would imply – instead they clumped together, with almost identicalproducts sold by multiple firms. Some theories would also suggest that leapfroggingbehavior might occur over time, jumping over each other’s positions to move to moreadvantageous places (given their competitors’ current locations) in productcharacteristics space. Over time, there was no leapfrogging in product characteristicsspace. More concentrated fertilizers did become available over time, and when onefirm would introduce a more concentrated variety, this was quickly (within a fewyears) matched by competitors.
Thus, in the UK fertilizer industry, while products were differentiated, thisdoes not seem to have had much competitive impact. Unlike in penicillin, new formsof fertilizers were not radically new products with protected market niches. It is inindustries where different firms participate in different niches that productdifferentiation can make a big competitive difference. And it is where the creation ofnew, protected product niches depends on the development of new technologies thattechnology has the most major impact through product differentiation. In otherindustries such as automobiles, firms’ products are affected by continual innovation,causing an increase in quality but not generating a new market niche, at least not aniche that will be separated for long from that of other firms. Innovation creates newmarket niches only in some industries, and not all innovation results in new marketniches.
Study Guide
Terms to Knoweconomies of scopemarket nicheproduct characteristics spaceleapfrogging
Key Readings with QuestionsShaw, R.W. “Product Proliferation in Characteristics Space: The UK Fertilizer
Industry.” The Journal of Industrial Economics 31 (1/2: September/December),1982, pp. 69-91. O. Examines the differences between the varieties of fertilizeroffered for sale by UK manufacturers, and examines how the varieties changed overtime in order to test what theories of product differentiation seem to hold up inpractice.
1. What is Shaw’s paper about?
2. Describe the theories of product differentiation that he comments on.
3. What are Shaw’s conclusions with regard to these theories of productdifferentiation?

Industrial Growth and Competition K. Simons, 2003
106
Further ReadingHannan, Michael T., and John Freeman. Organizational Ecology. Cambridge, Mass.:
Harvard University Press, 1989. R 338.74 HAN. Use chapter 5, which discusses atheory of competition for niches of products with fast versus slow market changes.
Tirole, Jean. The Theory of Industrial Organization. Cambridge, Mass: MIT Press,1988. O (chapter 7) B 338.6 TIR. Examine chapter 7 to see some commontheoretical models of product differentiation, as used in industrial economics. Don’ttry to learn all the details, but do try to learn the main concepts about how thesemodels portray industries working.

Industrial Growth and Competition K. Simons, 2003
107
11. Firm Growth(Week 9)
After completing this chapter and its required readings, you should be familiarwith the following issues:1. Limits to firm growth rates in Penrose’s theory of firm growth.2. Gibrat’s “Law.”3. The approximate firm size distribution in the US tire manufacturing industry, as it
changed over time.4. How growth rates of US manufacturing plants have varied with plant size and age,
and how the figures are affected by the inclusion or exclusion of exiting plants.5. The skew distribution of sizes of firms and of other phenomena.
The Myth of the U-Shaped Long-Run Firm Cost CurveEconomic models have often used the simple, mathematically convenient
assumption of the U-shaped long-run firm cost curve. That is, the marginal cost of anadditional unit produced by the firm is assumed to vary with the size of the firm,falling at small sizes, but rising again at large sizes.30 Figure 11.1 illustrates thisassumption as it is often shown in introductory microeconomics texts. The bottomaxis in the figure is the quantity produced, and the vertical axis is the unit cost ofproduction. Two types of unit costs are shown in the figure, the marginal cost ofproducing an additional unit, and the average cost of production. In the examplegiven by the figure, a firm that produces 48 units has the lowest possible marginalcost, of $4 per each additional unit produced. The U-shape of the marginal cost curveimplies a U-shaped average cost curve as well. In the example, a firm that produces73 units has the lowest possible average cost of $95 per unit.
U-shaped cost curves are a convenient assumption because firms can beassumed to locate at the bottom of the U: specifically, they can be assumed to choosea quantity of output such that they have the lowest possible average cost ofproduction. If all firms have identical long-run cost curves, and if any number offirms can enter production, then competition forces firms to locate at the bottom ofthe U in average cost, because the firms set prices at (or near in some competitivemodels) their average cost of production. Thus all firms have identical outputs, withquantity chosen to coincide with the bottom of the U in the average cost curve, andprice equal to (or near) the lowest possible average cost. This is the long-run outcomein the sense that it is what happens after firms enter and adjust their productioncapacities.
Unfortunately, this convenient assumption is generally wrong. Real long-runmarginal and average firm cost curves seem not to be U-shaped, but to decline orflatten out with continual increases in output. You can sense a problem with theassumption by reflecting on the following facts: Giant firms like Microsoft, Sony, and IBM manage to survive and do fine, over a
lengthy period of time (no firm succeeds forever), despite their enormous size. Even if management did impose excessive inefficiencies for large firms, they
could (and sometimes do) break up into divisions managed like separate firms.
30 Specifically, the marginal cost curve typically is assumed to be convex, falling initially, but thenrising without bound.

Industrial Growth and Competition K. Simons, 2003
108
Figure 11.1. U-Shaped Marginal and Average Cost Curves
$ 0
$ 1 0 0
$ 2 0 0
$ 3 0 0
$ 4 0 0
0 2 0 4 0 6 0 8 0 1 0 0
Quantity Produced
Average Cost
Marginal Cost
The firms in a given industry virtually never have identical sizes, even manydecades after the start of the industry. Despite having had a long time to adjust,including to gain technology and streamline management to make their cost curveas good as possible, somehow actual firms are not converging on the bottom of ahypothetical U-shaped best cost curve.
Regional U-shaped cost curves for plants or branches do not yield U-shaped costsfor firms, because firms may own many plants or branches. Thus even thoughconcrete plants face U-shaped cost curves because of the high cost of shipping wetconcrete, an overall concrete firm may own many plants and have steadilydecreasing marginal costs.
Nobel prizewinner Hebert Simon, in the introduction to his book Skew Distributionsand the Sizes of Business Firms with Yuji Ijiri (Ijiri and Simon, 1977), points out howthe bulk of economists have been unwilling to eschew the misleading assumption ofU-shaped long-run firm costs. In some models the assumption of U-shaped costs maybe of minor importance and may aid in making a valid point, but in many models thiserroneous assumption may yield misleading conclusions and damaging policysuggestions. Clearly a more appropriate working assumption is needed for whatdetermines firm size.
Major Theories of Firm GrowthIn this section we shall be concerned not with the initial sizes of firms, but
with the growth of firms over time. The initial sizes of firms presumably aredetermined by practical matters including immediate demand, resources in hand, andfinancing, at the time a company is founded and as experienced by the people whofounded the company. Once the initial size of a firm has been determined, the growthrate of the firm determines its size at each point in time. In explaining patterns infirms’ (internal) growth, two views have been especially prevalent. The first view
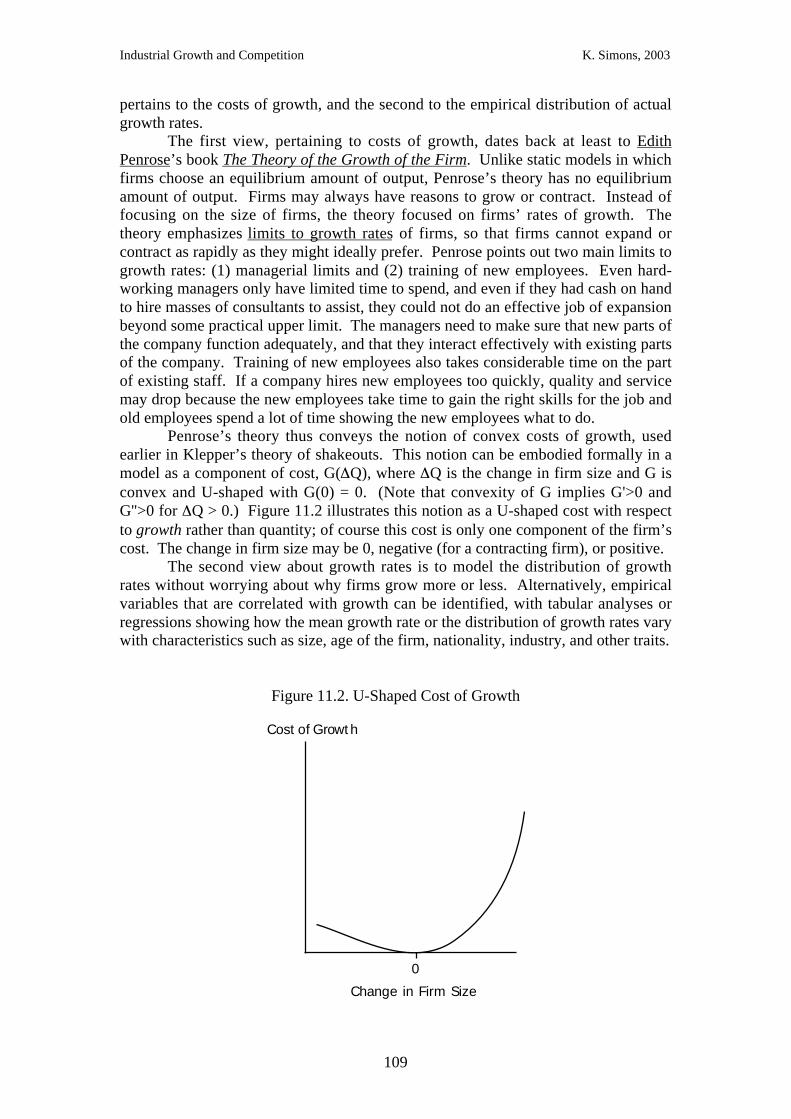
Industrial Growth and Competition K. Simons, 2003
109
pertains to the costs of growth, and the second to the empirical distribution of actualgrowth rates.
The first view, pertaining to costs of growth, dates back at least to EdithPenrose’s book The Theory of the Growth of the Firm. Unlike static models in whichfirms choose an equilibrium amount of output, Penrose’s theory has no equilibriumamount of output. Firms may always have reasons to grow or contract. Instead offocusing on the size of firms, the theory focused on firms’ rates of growth. Thetheory emphasizes limits to growth rates of firms, so that firms cannot expand orcontract as rapidly as they might ideally prefer. Penrose points out two main limits togrowth rates: (1) managerial limits and (2) training of new employees. Even hard-working managers only have limited time to spend, and even if they had cash on handto hire masses of consultants to assist, they could not do an effective job of expansionbeyond some practical upper limit. The managers need to make sure that new parts ofthe company function adequately, and that they interact effectively with existing partsof the company. Training of new employees also takes considerable time on the partof existing staff. If a company hires new employees too quickly, quality and servicemay drop because the new employees take time to gain the right skills for the job andold employees spend a lot of time showing the new employees what to do.
Penrose’s theory thus conveys the notion of convex costs of growth, usedearlier in Klepper’s theory of shakeouts. This notion can be embodied formally in amodel as a component of cost, G(∆Q), where ∆Q is the change in firm size and G isconvex and U-shaped with G(0) = 0. (Note that convexity of G implies G'>0 andG''>0 for ∆Q > 0.) Figure 11.2 illustrates this notion as a U-shaped cost with respectto growth rather than quantity; of course this cost is only one component of the firm’scost. The change in firm size may be 0, negative (for a contracting firm), or positive.
The second view about growth rates is to model the distribution of growthrates without worrying about why firms grow more or less. Alternatively, empiricalvariables that are correlated with growth can be identified, with tabular analyses orregressions showing how the mean growth rate or the distribution of growth rates varywith characteristics such as size, age of the firm, nationality, industry, and other traits.
Figure 11.2. U-Shaped Cost of Growth
Change in Firm Size
0
Cost of Growt h

Industrial Growth and Competition K. Simons, 2003
110
The starting point to analyze the distribution of growth rates is Gibrat’s law.Gibrat’s law is not a theory because it just assumes a mathematical formula withoutexplanation, and it is not a law either because it does not fit perfectly with the data. Itis, however, a useful point of comparison for thinking about firm growth rates.Gibrat’s law simply states that firms of any size have exactly the same probabilitydistribution for their percentage growth rate. For example, according to Gibrat’s law,firms with 10 employees and firms with 10,000 employees have exactly the sameprobability to grow by 50% or more in a given year. As will be seen in the nextsections, Gibrat’s law is not exactly right. It is furthest from being right for small,new companies (and even more so for plants or branches) in particular productmarkets. But among large multiproduct companies, such as the leading UScompanies recorded in the annual Fortune 500 list, Gibrat’s law is very close to beingcorrect.
Empirical Patterns in Product IndustriesGrowth within a product industry is different from growth in multiple
industries. Large modern firms participate in many industries, and they can grow andchange over time by entering new markets and leaving old ones. When consideringcompetition in a particular industry, however, you often want to consider only growthwithin the industry. Growth within an industry is obviously limited in some ways –once a passenger bus manufacturer gains a 100% share of passenger bus production, itis difficult for the firm to expand its passenger bus business further. (Some relatedexpansion is possible: It may be able to expand internationally, to create greaterdemand in its home market, or to grow in related industries.)
Table 11.1 shows the distribution of firm sizes, as measured by capitalizationin contemporaneous US dollars, for US tire manufacturers from 1909 through 1964.All surviving manufacturers are shown, and each column tells the number of firms ina given year that had a particular size. Size 4A is the largest, and denotes firms withat least $1 million of capitalization. The following size categories are increasinglysmaller, with size F representing the smallest category of $2,500-5,000. The Xcolumn gives the number of firms of unknown size; size X producers appear to havebeen generally very small. The size data pertain to the size of the whole company,not just its tire manufacturing business, but in the sample tires tended to be the largestpart of the business, so that firm sizes give a good approximation to sizes of firms’units dealing with tire production specifically. The shaded cells indicate the mediansize producer in each year, among firms of known size. As you can see, following aninitial dip in firm sizes driven by small entrants in the early 1910s, the sizes ofsurviving producers rose dramatically over time.
Table 11.1 does not show whether surviving firms grew over time, or whetherthe firms that survived happened to be larger firms. Both influences on the sizedistribution turn out to be relevant: successful firms grew over time, and larger firmswere more likely to survive. Survival is perhaps the more dominant influence. Table11.2 examines all firms that were size 4A producers in 1930, to see whether they werealways so large or whether they grew over time. As the table indicates, most of themstarted out with at least $1 million of capitalization, although at least a quarter of themgrew to that size after starting out in much smaller size categories. Table 11.3examines all firms that were size B producers in 1915, to see how they changed sizeover time. The bulk of them remained at the same size, but the firms that managed tosurvive for a decade or more were mostly firms that expanded quite dramatically.
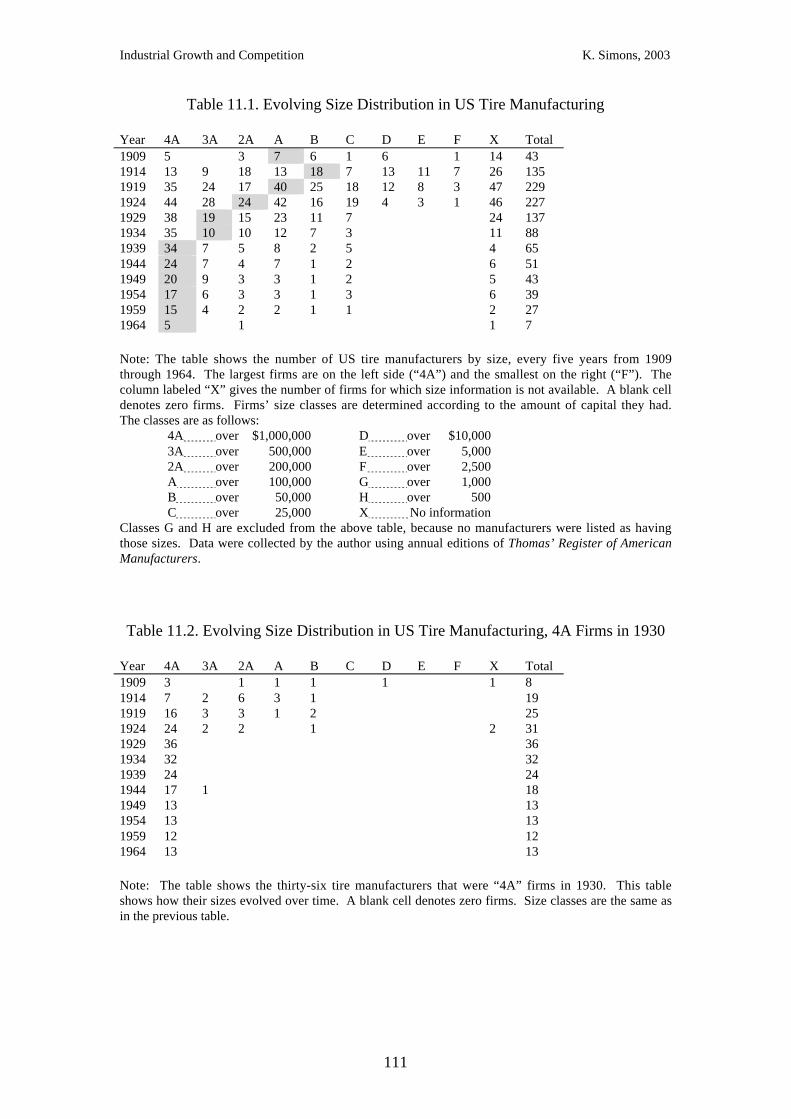
Industrial Growth and Competition K. Simons, 2003
111
Table 11.1. Evolving Size Distribution in US Tire Manufacturing
Year 4A 3A 2A A B C D E F X Total1909 5 3 7 6 1 6 1 14 431914 13 9 18 13 18 7 13 11 7 26 1351919 35 24 17 40 25 18 12 8 3 47 2291924 44 28 24 42 16 19 4 3 1 46 2271929 38 19 15 23 11 7 24 1371934 35 10 10 12 7 3 11 881939 34 7 5 8 2 5 4 651944 24 7 4 7 1 2 6 511949 20 9 3 3 1 2 5 431954 17 6 3 3 1 3 6 391959 15 4 2 2 1 1 2 271964 5 1 1 7
Note: The table shows the number of US tire manufacturers by size, every five years from 1909through 1964. The largest firms are on the left side (“4A”) and the smallest on the right (“F”). Thecolumn labeled “X” gives the number of firms for which size information is not available. A blank celldenotes zero firms. Firms’ size classes are determined according to the amount of capital they had.The classes are as follows:
4A over $1,000,000 D over $10,0003A over 500,000 E over 5,0002A over 200,000 F over 2,500A over 100,000 G over 1,000B over 50,000 H over 500C over 25,000 X No information
Classes G and H are excluded from the above table, because no manufacturers were listed as havingthose sizes. Data were collected by the author using annual editions of Thomas’ Register of AmericanManufacturers.
Table 11.2. Evolving Size Distribution in US Tire Manufacturing, 4A Firms in 1930
Year 4A 3A 2A A B C D E F X Total1909 3 1 1 1 1 1 81914 7 2 6 3 1 191919 16 3 3 1 2 251924 24 2 2 1 2 311929 36 361934 32 321939 24 241944 17 1 181949 13 131954 13 131959 12 121964 13 13
Note: The table shows the thirty-six tire manufacturers that were “4A” firms in 1930. This tableshows how their sizes evolved over time. A blank cell denotes zero firms. Size classes are the same asin the previous table.

Industrial Growth and Competition K. Simons, 2003
112
Table 11.3. Evolving Size Distribution in US Tire Manufacturing, B Firms in 1915
Year 4A 3A 2A A B C D E F X Total1909 3 31914 16 1 1 181919 2 9 111924 1 2 3 2 81929 3 1 41934 3 1 41939 1 1 21944 1 1 21949 1 1 21954 1 1 21959 1 1 21964 1 1 2
Note: The table shows the twenty-three tire manufacturers which were “B” firms in 1915.This table shows how their sizes evolved over time. A blank cell denotes zero firms. Sizeclasses are the same as in previous tables.
Empirical Patterns for Firms/Plants in Multiple IndustriesIf you consider firms participating across many industries, growth patterns
might be expected to differ, given that size is not limited by the size of a particularproduct market. Whether that is true remains to be seen in future empirical work, butat least we can examine patterns of growth rates among firms and plants in multipleindustries. A lot of work has been done looking at such growth rates, often using datacollected by government censuses of manufacturers.
What do the data show? Among surviving firms, growth rates decline bothwith age and with size. The same pattern is true among plants (factory sites)belonging to various firms. Exit is also related to age and size, with the oldest andlargest firms/plants having the lowest rates of exit. If firms/plants that exit arecounted as having -100% growth rates (given that their size in the next year is in somesense zero), these empirical patterns are less strong and among some age/size classeseven appear to be reversed. Table 11.4 shows these patterns among a sample ofplants, using US census data that include most US manufacturing plants.
Herbert Simon, working with colleagues Ijiri and Bonini, examined growthamong Fortune 500 firms (Ijiri and Simon, 1977). They started with a basic model ofgrowth following rules similar to Gibrat’s law. Under these very simple assumptions,it is possible to show (in their case through some fairly complex mathematics) that askew distribution of firm sizes results: firms end up with different sizes, and mostfirms are relatively small while a tiny fraction of firms have much larger sizes. Asyou look farther to the right at the extreme tail of very large sizes, the number of firmsat those sizes gets increasingly miniscule. Simon and his co-authors went through aseries of steps that made the model more realistic, and showed that predictions of themodel fit increasingly well with size patterns among Fortune 500 firms as the modelis made more realistic.
Firm sizes are by no means the only measure that follows a skew distributionpattern. City population sizes, the number of times different words appear in books,and many other phenomena have skew distributions. A similar process, such as thatproposed by Simon and his colleague, may underlie all these situations.
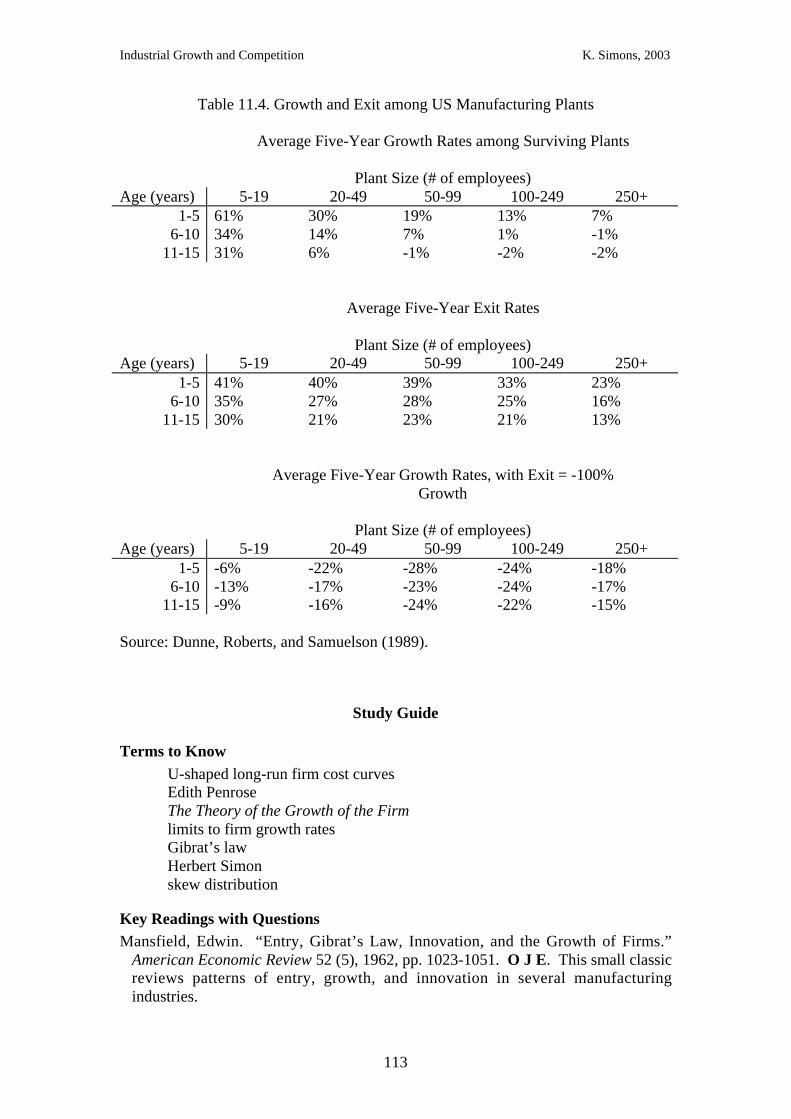
Industrial Growth and Competition K. Simons, 2003
113
Table 11.4. Growth and Exit among US Manufacturing Plants
Average Five-Year Growth Rates among Surviving Plants
Plant Size (# of employees)Age (years) 5-19 20-49 50-99 100-249 250+
1-5 61% 30% 19% 13% 7%6-10 34% 14% 7% 1% -1%
11-15 31% 6% -1% -2% -2%
Average Five-Year Exit Rates
Plant Size (# of employees)Age (years) 5-19 20-49 50-99 100-249 250+
1-5 41% 40% 39% 33% 23%6-10 35% 27% 28% 25% 16%
11-15 30% 21% 23% 21% 13%
Average Five-Year Growth Rates, with Exit = -100%Growth
Plant Size (# of employees)Age (years) 5-19 20-49 50-99 100-249 250+
1-5 -6% -22% -28% -24% -18%6-10 -13% -17% -23% -24% -17%
11-15 -9% -16% -24% -22% -15%
Source: Dunne, Roberts, and Samuelson (1989).
Study Guide
Terms to KnowU-shaped long-run firm cost curvesEdith PenroseThe Theory of the Growth of the Firmlimits to firm growth ratesGibrat’s lawHerbert Simonskew distribution
Key Readings with QuestionsMansfield, Edwin. “Entry, Gibrat’s Law, Innovation, and the Growth of Firms.”
American Economic Review 52 (5), 1962, pp. 1023-1051. O J E. This small classicreviews patterns of entry, growth, and innovation in several manufacturingindustries.
Industrial Growth and Competition K. Simons, 2003
114
1. What issues does Mansfield analyze?
2. What conclusions does Mansfield reach?
Dunne, Timothy, Mark J. Roberts, and Larry Samuelson. “The Growth and Failure ofU.S. Manufacturing Plants.” Quarterly Journal of Economics 104 (4: November),1989, pp. 671-698. O E. Reviews how average growth and exit rates varyaccording to the size and age of plants in the US.
1. What issues do Dunne, Roberts, and Samuelson address?
2. What conclusions do they reach?
Ijiri, Yuji and Herbert A. Simon. Skew Distributions and the Sizes of Business Firms.Amsterdam: North-Holland, 1977. Introduction. O. Although Herbert Simon wonthe Nobel primarily for his work on bounded rationality and human decisionmaking, his work on skew distributions also probably played a part. This book,from which you’re only expected to look at the introduction, describes how skewdistributions are common in a wide range of phenomena, and shows how some verysimple assumptions yield skew distribution results. Notably, random entrycombined with random percentage growth independent of firm size yields, in thelong run, a skew distribution of firm sizes.
1. What empirical regularity do Ijiri and Simon focus on?
2. Why do they think it is interesting to examine this empirical regularity?
3. What could cause this regularity?
4. Why do Ijiri and Simon think that firm sizes can be better explained by their theorythan by “classical” theories of firm size?
5. In what sense do Ijiri and Simon “proceed by successive approximations”? That is,as they introduce successive changes to their model of firm growth, what changes dothey introduce?
Further ReadingScherer, F.M. and David Ross, Industrial Market Structure and Economic
Performance, 3rd ed., Boston: Houghton-Mifflin, 1990. Selected pages on mergers.R 338.758 SCH.
Mueller, Dennis C. Profits in the Long Run. 1986. R 338.516 MUE. Showsevidence that in some markets, certain firms have long-lasting advantages that letthem maintain unusually high profits for long periods of time. (By the way, JohnSutton has recently formulated an argument against this view, by using a simpledepiction of changing size plus evidence on firm size to show that the leading firmsmaintain high market shares in no more industries than would be expected by

Industrial Growth and Competition K. Simons, 2003
115
random chance; thus the observed long-term profitability might be just firms thatwere the lucky ones without them having any long-lasting advantage.)
Ravenscraft, David J., and F.M. Scherer. Mergers, Sell-Offs, and EconomicEfficiency. 1987. B 338.83 RAV.
Lichtenberg, Frank R. Corporate Takeovers and Productivity. Cambridge, Mass.:MIT Press, 1992. B 338.83 LIC.

Industrial Growth and Competition K. Simons, 2003
116
12. Firm Technological Success and NationalDevelopment
(Week 10)
The first part of the course, in weeks 1-2, dealt with the broader impacts oftechnological change on regional and national growth. Weeks 2-3 examined how thestructure of industries – the sizes, numbers, and locations of firms – affectstechnological change. Weeks 4-7 then spent even more time on the reverse part of theprocess – how technological change affects common competitive processes inindustries. To understand the competitive processes involved, weeks 8-9 dealt withrelated issues concerning product differentiation and firm growth. Week 10, the finalweek of the course, ties together perspectives ranging from the levels of the individualfirm and its industry to the level of a whole nation. The focus is on how nationalgovernments have sought to aid the success of firms and industries in order to aidentire nations’ economies.
After completing this chapter and its associated lecture, you should be familiarwith the following issues:1. Linear versus leapfrog technology development models.2. How catching-up of firms technologically might be viewed in terms of firms’
quality and efficiency of firms, and benchmarking as a way to measure therequirements of catching up.
3. Some approaches to national technology policy.
Linear versus Leapfrog Models of Technology DevelopmentTechnology development models for developing countries have fallen into two
broad classes: linear versus leapfrog views. The successful linear approach isillustrated by the experience of Korea’s Anam Industrial, the world’s largestsemiconductor packaging company. As Hobday (1995) characterizes based oninterviews with senior staff, Anam went through successive phases of lineartechnology growth. Anam began packaging computer chips into plastic and ceramiccases in 1968-1980 with considerable help from US clients, which providedmachinery, engineering assistance, product design information, and materials. By1980-1985, the firm set up greater in-house process engineering, again aided by UScompanies such as Texas Instruments. With its new Engineering R&D Department,in the late 1980s into the 1990s Anam increasingly took charge of incremental processengineering and began to develop its own new approaches for production processesand designs for semiconductor packages. The gradual technology diffusion intoAnam, followed by steady growth in in-house engineering capabilities, helped Anamto reach US $1.8 billion of export sales by 1992.
The successful leapfrogging approach, in contrast, promises to allow firmsrapidly to become internationally competitive. The chief designer of aninternationally successful Chinese language printing system, developed by Founder ofChina, put it this way:
In high-tech areas, there are big lags between our country and advanced countries. Manynew ideas and methods originate abroad…. However, we should not be satisfied withmerely catching up because this would not come up with competitive products. It wasinevitable that we would catch up for quite a long time. However, it was possible to leapforward based on our indigenous innovative capabilities. (Quoted in Lu, 2000, p. 132)
Industrial Growth and Competition K. Simons, 2003
117
Founder succeeded at leapfrogging ahead of its potential competitors, indeed takingon the role of a pioneer in the industry. If Founder had caught up more slowly, itlikely would have failed, or at least been constrained by lack of funds, in the face ofintense competition versus firms from the US, UK, and Japan. Founder was able tosucceed at leapfrogging because an opportunity existed for a disruptive newtechnology with sizeable potential market demand, and because it entered quickly anddeveloped the leading-edge technology in the field.
Whether linear or leapfrog approaches can best succeed depends on theindustry in question and the kinds of technological change ongoing. Where ongoingtechnological changes reinforce the strengths of incumbent firms, the leapfrogapproach typically would require a daunting effort far too expensive to be worthwhile.Instead, market niches are often available to make a profit in some part of theindustry, perhaps aided by low labor costs, national incentive schemes, oradvantageous geography. Catching-up firms in lower-income countries may becomeloci of technology transfer, spurring growth as for Anam Industrial. Where ongoingtechnological changes are disruptive or create entirely novel markets, opportunitiesexist for firms to take a lead in pioneering new technologies.31 In lower-incomecountries, pockets of specialized knowledge and skill may provide the crucial headstart to succeed at developing an internationally competitive version of the newtechnology. Founder, for example, benefited from early university research as well asunusual access to talented engineering graduate students at China’s leading university.Financial investments for new firm development, when directed according to theseprinciples, need not be large and can be arranged in ad-hoc ways so long as the firmretains the right incentives and freedoms.
Catching Up in the Face of International CompetitionTo varying degrees, firms compete against international competitors.32
Protectionism in the form of tariffs, predatory pricing laws, national politics, andother means may keep competitors at bay only to some degree. Firms must be able toprovide a good enough product at a low enough cost that they are at least ascompetitive as their international competitors can be after coping with theprotectionist barrier. And if firms are to be able to compete internationally, they mustbe competitive enough that they no longer need a protectionist barrier in order tosurvive.
To illustrate this point, consider an industry with firms making a product in ahome-country. Different firms labelled i = 1 to N have different levels of efficiency(the inverse of unit cost) and quality. Firms have a range of per-unit profitabilitylevels, indicated by the symbol Π. If competition within the home-country is weak(competition may be weaker in the early decades of an industry’s history and if firms’strategies are relatively cooperative with each other), then the difference between themost profitable and least profitable firms can be large. If competition is severe, thenthe least profitable firm must be nearly as profitable as the most profitable firm inorder to survive. Figure 10.1 illustrates the concept. In the figure, the vertical axisindicates quality and the horizontal axis indicates efficiency. Firms are indicatedusing + symbols, with the position of each + indicating the firm’s quality and
31 Recall that disruptive technologies may lead to corporate leadership turnover.32 This section is inspired by a related talk given by John Sutton at the 2001 meetings of the EuropeanAssociation for Research in Industrial Economics, published as Sutton (2002).

Industrial Growth and Competition K. Simons, 2003
118
Figure 12.1. Firm Positions and Profits in Quality-Efficiency Space
Qualit y
Eff iciency
Equiprof it line Π = Π2
Equiprof it line Π = Π1
efficiency. The higher are a firm’s quality and efficiency, the greater its profitability.Of course, firms with greater quality and efficiency, to the upper right of the diagram,have greater profitability. The sloping lines inside the diagram are equiprofit curves,with all firms on the line having the same profits. The upper equiprofit curvecorresponds to a profitability of Π2, and the lower equiprofit curve corresponds to aprofitability of Π1=0, with Π 2 > Π1. The difference, Π 2 - Π 1 , indicates howcompetitive is the industry; a more competitive industry has a smaller value of Π2 -Π1. The companies with the best technology in the country are at the equiprofit linewhere Π=Π2.
In this discussion, it is supposed that the home-country firms currently surviveonly because of the protectionist trade barriers. International firms with greaterquality and efficiency exist, but they must pay a protectionist fee of Πp for each unitthey sell in the home country (Πp may consist of a tariff and/or other kinds of costs).Among home-country firms, the least profitable firms, which are barely able tosurvive, must be able to compete with international competitors. Suppose the worstinternational competitors have sufficient quality and efficiency to yield themprofitability Π3 (> Π1) if they were producing within the home country. However,they must pay the protectionist fee and hence, when selling goods in the homecountry, have an actual profitability of Π3 - Πp. If Π3 - Πp < 0 then they cannot sellthe product at all, and only firms with greater quality and efficiency can sell theproduct. Let Π4 (≥ Π3) be such that Π4 - Πp = 0, such that firms at equiprofit line Π4
are barely willing to sell to the home country.33
This situation is illustrated in Figure 10.2. The quality and efficiency levels ofinternational and home-country producers are indicated using o symbols forinternational producers and + symbols for home-country producers. As before, profitlevels are indicated according to the profitability an in-country producer would have,
33 It may be necessary, however, for the home country to set its tariffs such that Π4 ≤ Π3 if internationalfirms are to be induced to sell within the country, since with limited quantities produced theinternational firms may prefer to sell to other more profitable markets.

Industrial Growth and Competition K. Simons, 2003
119
Figure 12.2. International and Home-Country Producers in Quality-Efficiency Space
Qualit y
Eff iciency
Internat ional producers
Home-count ry producers
Protecti vegap Πp
Minimumcatch-up Πc
Π1 Π2 Π3
Π4 Π5
selling the product in-country, if it had the specified quality and efficiency levels.Because the home-country producers are assumed to be bad at quality and efficiency,there is a gap between even the best home-country producers and the worstinternational producers. This gap, denoted Πc, is the minimum catch-up necessary forthe best home-country producers to be able to sell their product on the internationalmarket. That is, to be internationally competitive, they must improve their qualityand/or efficiency enough to move them from curve Π2 to at least curve Π2 + Πc = Π3.
Firms that seek to catch up must aim for a moving target. The rising qualityand efficiency of international firms, as well as any other changes in competitiveness,mean that curve Π3 shifts toward the upper right over time. Thus, when a firmbenchmarks its abilities relative to competitors to see how much it needs to improveto be internationally competitive, it is important for it to realize that the competitorswill be getting better too.34
Benchmarking is a serious business. It is the task undertaken by firms to seehow their quality and efficiency compare with other firms. Products and processesmay be compared to see how much a low-technology firm lags behind higher-technology firms, with many very specific aspects compared. Once benchmarkinghas been completed, firms can consider which aspects of the product and process arewithin their means to improve substantially. If a firm can afford to improve its 34 Of course, the saving grace of firms in low-technology countries may often be low – and perhapsfalling – labor costs relative to other countries, helping to improve efficiency in the low-technologycountries.

Industrial Growth and Competition K. Simons, 2003
120
product and process such that it moves to the upper right of (the new) curve Π3, thenit can become a profitable international producer. The process of benchmarking is inpart fits within the definition of absorptive capacity, as benchmarking usesinformation about other firms to help find fruitful ways to make improvements in theproduct and process (benchmarking thus can help spur the diffusion of technology).However, benchmarking also is an attempt to determine quantitative measures ofgains that might be made. These quantitative measures can be used to aid decisionsabout what technology areas are worthwhile for investment, as well as whetherinvestments have a reasonable chance of taking firms to internationally competitivelevels of technology.35
National Technology PolicyNations have tried various policies to help their industries become competitive
and thus aid the national economy. In various cases, national governments have triedto pick key technologies or industries as focal points and invest huge amounts ofnational funds into these industries. Often prestigious industries such assemiconductors are chosen, with little regard for whether the choice was appropriate.Now, with the worldwide glut in semiconductor production following from apparentnational over-investment, analysts tend to label semiconductors as an example of whynations should not pick key technologies as a focus for industrial activity.
An alternative approach is for a government to allocate funds to broadtechnology areas, allowing a substantial government agency to disburse those funds toindustry projects that seem especially worthy. In the US, the Advanced TechnologyProgram channels funds to promising industrial projects that are developing newtechnology. Japan’s Ministry of International Trade and Industry, or “MITI” (nowcalled the Ministry of Economy, Trade, and Industry, “METI”) became renowned forits attempts not only to manage particular areas of technology development, but alsoto manage other aspects of firms’ development and their international trade.36 And itis commonplace for governments to have a range of other agencies that fundtechnology development: in the UK, government research councils provideuniversities with competitive research funds to spur research nationwide, withprojects part-funded by industry given favorable consideration.
Technology is largely a social good, since individuals firms usually captureonly a small part of the returns to invention and innovation. Firms do not have thefinancial incentive to do a socially optimal amount of R&D, and hence firms naturallytend to underinvest in R&D. To help generate more appropriate levels of R&D
35 In many industries there may be little chance of catching up to leading international competitors. Inthe television receiver manufacturing industry, for example, US and UK producers met a similar fate inthe face of international competition. Despite substantial investments by some of the US firms(notably Zenith) and despite eventual high labor costs in Japan, the technological lead of Japanese andother international firms proved overwhelming. The Japanese firms consistently led US producers by1-2 generations in the development of integrated electronic circuitry, which made TV sets morereliable and cheaper to manufacture; UK firms seemingly lagged at least as much as their US brethren.Eventually literally all of the original US and UK producers of TV sets either exited or sold out to theirinternational competitors.36 While it is clear that MITI has not always operated effectively, nonetheless the government fundinginvolved in MITI, Nippon Telephone and Telegraph, the Ministry of Education, and other governmentactivities has helped to move forward the competitive abilities of Japanese firms and the skill andtechnology bases of Japanese scientists and engineers. For a careful analysis of MITI’s inefficienciesin major electronics projects, see Callon (1995). Johnson (1982), however, argues that MITI wasimportant to Japan’s growth in the period through 1975.

Industrial Growth and Competition K. Simons, 2003
121
investment, government funding of science helps develop technology that may benefitall people in all nations. In some cases, such as the Advanced Technology Programand MITI, the funding is aimed at building the expertise of firms within a country,which may help the country’s producers gain in size and technology leadership. As aresult, in some industries – roughly, in industries with shakeouts and withoutcorporate leadership turnover – the technology investments provided at a nationallevel may be rewarded by lasting economic success, causing the nation’s producers tobecome entrenched as the leading international firms in those industries. In eithercase, national or international funding of technology development can havesubstantial net social benefits.37 Nations and the world benefit from investments intechnology.
Study Guide
Terms to Knowlinear technology developmenttechnology leapfroggingbenchmarkingtechnology policyMITIAdvanced Technology Program
Key Readings with QuestionsThere are no required readings for week 10.
Further ReadingSutton, John. “Rich Trades, Scarce Capabilities: Industrial Development Revisited.”
Economic and Social Review 33 (1), Spring 2002, pp. 1-22.Lu, Qiwen. China’s Leap into the Information Age: Innovation and Organization in
the Computer Industry. Oxford: Oxford University Press, 2000. B 338.4700164LU.
Hobday, Michael. Innovation in East Asia: The Challenge to Japan. Cheltenham:Edward Elgar, 1995. B 338.06095 HOB.
37 Harmful impacts of technology, such as the use of new weapons of war and global climate change,have to date seemingly been substantially less than the beneficial impacts of technology. But that is asubject for other pages than these.

Industrial Growth and Competition K. Simons, 2003
122
EducationalTools

Industrial Growth and Competition K. Simons, 2003
123
13. Mathematical Skills Related to the Text
Interpreting DerivativesWhen you read about an economic theory, you might see:
PC R′( ) > 0 PC R′′( ) < 0The above line is read, “PC-prime of R is greater than zero, and PC-double prime ofR is less than zero.” The prime and double-prime are compact ways in which peoplewrite first and second derivatives. The “(R)” just serves as a reminder that PC (or itsfirst or second derivative) may have different values depending on what R is. Thus,the expressions are equivalent to:
dPC RdR
( ) > 0
ddR
dPC RdR
( )
< 0
A derivative is a slope. It tells you how quickly one variable changes as asecond variable increases. So the first expression says that if you draw a graph of PCversus R, such as the above graph, the slope is everywhere greater than zero (i.e., theslope is everywhere positive). As more money R is spent, the price-cost margin PCincreases. The second expression involves the derivative of the derivative, or theslope of the slope. In the graph above, the slope starts out very steep, but gets lessand less steep. Thus, the slope is decreasing, so the slope of the slope is a negativenumber. This simply reflects the assumption that firms first do research that promisesa high gain for each research dollar spent, and only later do research that promisesrelatively low gain. This is known as an assumption of “decreasing marginal returnsto R&D.”
Greek LettersEconomists and other scientists often use Greek letters to represent variables.
For example, the Greek letter Π, pronounced “pi” (as in “apple pie”), is generallyused to represent a firm’s profit. Here is the Greek alphabet, in lower- and upper-caseletters:
α, Α alpha ι, Ι iota ρ, Ρ rhoβ, Β beta κ, Κ kappa σ, Σ sigmaγ, Γ gamma λ, Λ lambda τ, Τ tauδ, ∆ delta µ, Μ mu υ, Υ upsilonε, Ε epsilon ν, Ν nu φ, Φ phiζ, Ζ zeta ξ, Ξ xi (“zi”/“ksi”) χ, Χ chiη, Η eta ο, Ο omicron ψ, Ψ psiθ, Θ theta π, Π pi ω, Ω omega
Computing Derivatives
When you compute the derivative of Π with respect to R, ddRΠ
, start with the
formula Π = PC(R) * Q - R, shown earlier. The derivative of two items summedtogether is simply the sum of the derivatives of the two items. Thus,
Industrial Growth and Competition K. Simons, 2003
124
ddRΠ
= d
dR[PC(R) * Q] +
ddR
[-R].
Then to take the derivative of the first item, remember that Q is a constant. Thederivative of a constant times anything is equal to the constant multiplied by thederivative of the anything. Thus,
ddR
[PC(R) * Q] = Q * d
dR[PC(R)] = Q * PC R′( ) = PC R′( ) * Q.
(Recall that PC R′( ) is a way of writing the derivative of PC(R) with respect to R, andmeans the same thing.) The derivative of the second item works similarly, but youalso use the fact that the derivative of a variable (such as R) with respect to itself is 1.(I.e., if you plotted R versus R on a graph, the slope would be 1 everywhere.) Thus,
ddR
[-R] = d
dR[-1 * R] = -1 *
ddR
[R] = -1 * 1 = -1.
Combining the two items, you getddRΠ
= PC R′( ) * Q + (-1) = PC R′( ) Q - 1.
(When two variables are placed next to each other, it means that they are multipliedtogether.) This is exactly the result found in the main text. If you set this result equal
to zero, then rearrange, you get PC R′( ) = 1Q
.
The second derivative, ddR
2
2
Π, is the derivative of the first derivative. So it is
ddR
2
2
Π =
ddR
ddRΠ
= d
dR[ PC R′( ) Q - 1] =
ddR
[ PC R′( ) Q] + d
dR[-1].
= PC R′′( ) Q + 0 = PC R′′( ) QHere, you take the derivative just like you did above, but also using the fact that thederivative of any constant number, in this case -1, is always 0.
Practice computing these derivatives, covering up the solution while youcompute, until you can do them quickly and easily. You should know the followingrules for derivatives, most of which were used above. These rules are expressed usingx rather than R; in fact, any letter or even a whole name for a variable can besubstituted in place of the x’s. The letter k below means any constant number (suchas -1, or 3, or Q above.) The A(x) and B(x) can be replaced by absolutely anything.
1. ddx
A x B xddx
A xddx
B x( ) ( ) ( ) ( )+[ ] = [ ] + [ ].
2. ddx
k[ ] = 0 .
3. ddx
kA x kddx
A x( ) * ( )[ ] = [ ].
4. ddx
A x B x A xddx
B xddx
A x B x( ) * ( ) ( ) * ( ) ( ) * ( )[ ] = [ ] + [ ] .
5. ddx
x nxn n[ ] = −1 . Here, n is any constant number.
A special case is ddx
xddx
x x[ ] = [ ] = = =1 01 1 1 1* . To see this, note
that xn is x multiplied by itself n times (and x-n = 1/xn), and that x0 = 1except when x = 0 (00 is “undefined,” that is, it’s some number but youdon’t know what it is).

Industrial Growth and Competition K. Simons, 2003
125
6. ddx
x xexp( ) exp( )[ ] = .
Note that exp(x) means ex, i.e. e raised to the power x, and “e” is anumber, approximately 2.71828, with infinitely many digits.
7. ddx
xx
log( )[ ] =1
.
Note that log(x), or the “logarithm of x,” answers the question “thenumber e raised to what power equals x?” It is the opposite of exp(x),so that exp(log(x)) = x, or log(exp(x)) = x.
8. ddx
A B xd
dBA B x
ddx
B x( ( )) ( ( )) * ( )[ ] = [ ] [ ].
This last one is called the “chain rule.” It is simpler than it looks, andvery powerful. For example, suppose someone asks you what’s thederivative of exp(xn). Let A(.) be the exp(.), and let B(x) be xn. Then
ddB
A Bd
dBB B xn( ) exp( ) exp( ) exp( )[ ] = [ ] = = , and
ddx
B xddx
x nxn n( )[ ] = [ ] = −1 .
Plugging these two parts into the formula tells you that ddx
x x nxn n nexp( ) exp( ) *[ ] = −1.
By successively applying the chain rule, you can even take thederivatives of things like A(B(C(D(x)))).
Maximizing a FunctionOnce you are used to using derivatives, you can use them to find the high and
low points of a function. For example, consider the function graphed below.
x
y
At the high and low points of the function, as indicated by the dashed lines, the slopeof the function is zero. Since a derivative is the same as a slope, if you take thederivative of y(x) with respect to x, than set it equal to zero, that tells you where thehigh and low points are. All you have to do is solve the resulting equation for x, andyou will find out all the values of x that have high and low points. Note that if oneside of the function increases or decreases forever, that side will never have a slopethat equals zero, so you have to check you’re not missing this critical fact! (For

Industrial Growth and Competition K. Simons, 2003
126
example, if y represented profit and as x increased y increased infinitely, the profit-maximizing decision is an infinitely large value of x (or, just as large as a firm couldbe in practice).
If you find a value of x that has a zero slope, how can you tell whether it is aminimum or a maximum? One way is to solve for the second derivative, that is, thederivative of what you found the first time you took the derivative, or the slope of theslope. If the second derivative is negative when you plug in the value of x thatcorresponds to the point, the point yields a maximum; if the second derivative itpositive, the point yields a minimum. You can see this from the illustration below.Around the part of the graph where there is a minimum, the slope starts out morenegative, then becomes zero, then becomes positive. Thus, the slope is increasing, sothe slope of the slope — the second derivative — is positive.
x
y
negativeslope
zeroslope
positiveslope
A high point or low point that is one of many such points is often called a “localmaximum” or “local minimum.” The highest part of the function is called the “globalmaximum,” and the lowest part is called the “global minimum.”

Industrial Growth and Competition K. Simons, 2003
127
14. Course Quiz
This quiz is for your own use, to help you study for the course and ensure thatyou have covered major topics. This is a multiple-choice quiz, unlike the essay examat the end of the year.
Write your answers below. The correct answers are attached at the end of thequiz. Do not look at the answers until you have made a serious attempt at all thequestions!
Answers:
1.
2.
3.
4.
5.
6.
7.
8.
9.
10.
11.
12.
13.
14.
15.
16.
17.
18.
19.
20.

Industrial Growth and Competition K. Simons, 2003
128
Quiz Questions
1. Which of the following is true:A. Britain gained its international economic leadership in the 1900s.B. Britain became Europe’s largest oil producer in the 1950s.C. In Britain, compared to France, pharmaceutical firms are responsible for a smaller
percentage of the patents created by all the country’s firms.D. Engineers generally have a higher social status in Britain than in Germany.E. Military research absorbs the efforts of many of Britain’s best engineers.
2. Jane Jacobs has argued that:A. Improvements in agriculture caused the formation of cities.B. Cities can be sources of innovation which spurs economic growth.C. Too much focus of an economy on one industry can cause stagnation.D. A and B.E. B and C.
3. In the electronics industry of Silicon Valley, compared to the same industry in theBoston area:
A. Venture capital has been more easily available to start new companies.B. Engineers and corporate executives have exchanged information more freely.C. Employees have switched jobs more frequently.D. All of the above.E. None of the above.
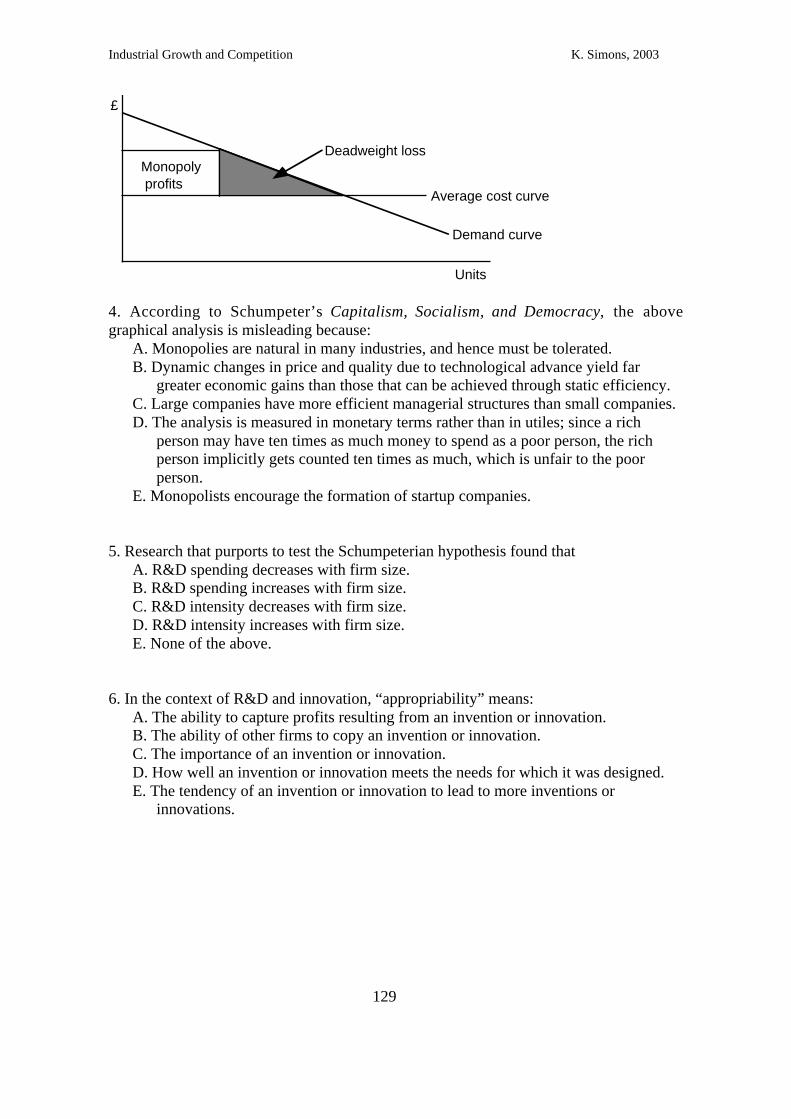
Industrial Growth and Competition K. Simons, 2003
129
Monopoly profits
Deadweight loss
Demand curve
Average cost curve
Units
£
4. According to Schumpeter’s Capitalism, Socialism, and Democracy, the abovegraphical analysis is misleading because:
A. Monopolies are natural in many industries, and hence must be tolerated.B. Dynamic changes in price and quality due to technological advance yield far
greater economic gains than those that can be achieved through static efficiency.C. Large companies have more efficient managerial structures than small companies.D. The analysis is measured in monetary terms rather than in utiles; since a rich
person may have ten times as much money to spend as a poor person, the richperson implicitly gets counted ten times as much, which is unfair to the poorperson.
E. Monopolists encourage the formation of startup companies.
5. Research that purports to test the Schumpeterian hypothesis found thatA. R&D spending decreases with firm size.B. R&D spending increases with firm size.C. R&D intensity decreases with firm size.D. R&D intensity increases with firm size.E. None of the above.
6. In the context of R&D and innovation, “appropriability” means:A. The ability to capture profits resulting from an invention or innovation.B. The ability of other firms to copy an invention or innovation.C. The importance of an invention or innovation.D. How well an invention or innovation meets the needs for which it was designed.E. The tendency of an invention or innovation to lead to more inventions or
innovations.
Industrial Growth and Competition K. Simons, 2003
130
7. In a recent reinterpretation of the evidence on the Schumpeterian hypothesis, Cohenand Klepper argued that the evidence may indicate an R&D-related advantage to largerfirms, in which in some ways larger firms are best for the economy. They argued that
A. Large firms have better managers.B. There are economies of scale in R&D, so that the cost or quality improvement per
each dollar spent on R&D is higher for larger-scale R&D.C. The cost of R&D per unit of output is smaller for firms that produce more output,
and as a result, large firms have an incentive to do more R&D than small firms.D. The greater market power of large firms lets them affect politics to their benefit.E. None of the above.
8. In models of industries, if the unrealistic assumption about U-shaped long-run costcurves is dropped, which of the following assumption(s) can be used instead in order todetermine firms’ sizes:
A. When firms first produce the product, they produce a small amount Q0 (say, Q0 =100 units per year).
B. Firms’ growth over time is limited, because of a cost of growth, G(Qt - Qt-1), whereG > 0 and G' > 0 for Qt - Qt-1 > 0. For example: G(Q) = £100 * ([Qt - Qt-1] / 10units per year)2.
C. Firms maximize their profits.D. All of the above can be used together to determine firms’ sizes, but any one
assumption is insufficient.E. None of the above.
9. Which of the following statements is wrong:A. Sometimes market leaders in particular product markets have lost their leadership
to new entrants.B. In the manufacture of “photolithographic alignment equipment” used to make
semiconductors, firms that had the highest market share in one type of equipmentoften did not have the highest market share in newer types of equipment.
C. In cement manufacturing in the US, it has been claimed that a new type of kiln,used to manufacture the cement, was developed around the time when a change inmarket leadership occurred.
D. Turnover of corporate leadership has been found to occur most when marketgrowth is least.
E. Technological discontinuities have been associated with difficulty in forecastingmarket growth, according to a paper by Tushman and Anderson.

Industrial Growth and Competition K. Simons, 2003
131
10. Which of the following explanations has not been proposed (at least not in ourcourse) to explain why leading producers of a product may lose their leadership:
A. Firms are blinded by attention to the needs of their existing customer base.B. Firms are blinded by the past experiences of their researchers or engineers.C. Firms’ past research and development work causes them to move into new
products and abandon the old.D. Firms’ past technological competencies are of limited relevance when major new
technologies begin to be used for the product or its manufacturing methods.E. None of the above.
11. Shakeouts in the number of firms manufacturing a product:A. Typically occur while the number of units produced continues to increase.B. Seem to have occurred, to some degree, in most products that have been produced
for at least several decades.C. Sometimes involve a decrease of more than 75% in the number of producers.D. All of the above.E. None of the above.
12. Shakeouts in the US automobile, tire, television, and penicillin industries appear tohave occurred because
A. Demand for the products dropped off.B. A major change in technology caused an increase in minimum efficient scale.C. A dominant design forced firms to adapt to new product characteristics.D. A dominant design forced firms to become suddenly more proficient at
manufacturing methods, or be out-competed.E. Some early entrants gained an advantage that grew over time, eventually giving the
other firms a severe competitive disadvantage.
13. Nearly all the major innovations in the US automobile, tire, television, and penicillinindustries were developed by
A. The smallest firms.B. The largest firms.C. Suppliers that did not manufacture the final product.D. The smallest firms as well as some suppliers.E. The largest firms as well as some suppliers.
Industrial Growth and Competition K. Simons, 2003
132
14. The QWERTY keyboard has been used by Paul David as an example ofA. Lock-in of the best available technology.B. Lock-in of an inferior technology.C. The cause of a shakeout.D. How a new technology allows an entrant to take over market leadership from an
incumbent firm.E. How a new technology allows an incumbent firm to become a monopolist.
15. John Sutton, in his book Sunk Costs and Market Structure, compares industryconcentration versus market size / setup cost in food industries in Europe and NorthAmerica. He
A. Considers a range of different kinds of inter-firm competition, from monopoly toCournot competition to Bertrand competition.
B. Considers a range of different kinds of product differentiation patterns.C. Argues that national advertising costs sometimes make an industry much more
concentrated than it would otherwise be.D. All of the above.E. None of the above.
16. In answering an end-of-year exam question about the penicillin industry —specifically, about what some statistical evidence from the industry can tell you aboutcompetitive processes — which of the following strategies is likely to win the highestmark from an examiner:
A. Explain that there is not evidence to draw conclusions; better evidence is needed.B. Say that you are going to discuss what happened in the penicillin industry, then
discuss what happened, then point out that the penicillin industry is likely to bebig in the future.
C. Say that the evidence shows that the earliest types of penicillin experienced ashakeout in which some early entrants dominated in the long run, but later typesof penicillin apparently were dominated by new entrants; explain how theevidence proves the point; then sum up by explaining what you showed and whyit is important for understanding industries in general.
D. Explain that in many industries there are important patterns of change over time.Describe common patterns of change. Describe theories of why these patterns ofchange occur. Point out that there are ways to analyze statistical evidence aboutindustries. Show how the ways to analyze evidence can tell you whether theoriesare right or wrong. Say that these same methods could be applied to the penicillinindustry data.
E. Just leave the answer blank.

Industrial Growth and Competition K. Simons, 2003
133
17. Suppose you test whether early entrants in UK automobile manufacturing had higher10-year survival rates than later entrants. Suppose you find the following results in Stata:
| tenyear early| 0 1 | Total-----------+----------------------+---------- 0 | 88 4 | 92 1 | 55 15 | 70-----------+----------------------+---------- Total| 143 19 | 162
Fisher's exact = 0.001 1-sided Fisher's exact = 0.001
4 / 92 = 0.0415 / 70 = 0.21
These results prove beyond any doubt that:A. Later entrants had 1/1000 the chance of early entrants to survive at least ten years.B. Later entrants had a 4% chance of surviving at least ten years, versus a 21%
chance for early entrants.C. If later entrants had the same chance as early entrants of surviving at least ten
years, then there would be only a 1/1000 chance of seeing a disparity of at leastthis much between early entrants’ and later entrants’ survival rates.
D. Later entrants had the same chance as early entrants of surviving at least ten years.E. Later entrants had a greater chance than early entrants of surviving at least ten
years.
18. A common reason for using logarithmic numbers (100%, 10%, 1%, etc.) on thevertical scale of a survival plot, rather than linear numbers (100%, 50%, 0%) is:
A. Because statistical programs usually make graphs this way.B. To be able to see how exit rates (probabilities of exit per year) changed over time.C. To be able to compare different cohorts of entrants.D. To draw attention to the vertical axis.E. To confuse people seeing the graph.
19. To collect data on the number of companies that produced a product and their dates ofsurvival over the past five decades, likely sources of information are:
A. Trade registers, such as Kelly’s Directory, which can be found in GuildhallLibrary.
B. Old telephone books, which can be found in the British Telecomm Archives.C. Lists, sometimes found in trade magazines, of firms producing the product.D. All of the above.E. None of the above.

Industrial Growth and Competition K. Simons, 2003
134
20. Which of the following is a standard format for how to include an article in your listof references at the end of your project report:
A. Shaw, R.W. 1982. “Product Proliferation in Characteristics Space: The UKFertilizer Industry.” The Journal of Industrial Economics 31 (1/2:September/December), pp. 69-91.
B. Shaw, R.W. “Product Proliferation in Characteristics Space.” The Journal ofIndustrial Economics 31, pp. 69-91.
C. Shaw, R.W. 1982. “Product Proliferation in Characteristics Space: The UKFertilizer Industry.” The Journal of Industrial Economics 31 (1/2:September/December).
D. “Product Proliferation in Characteristics Space: The UK Fertilizer Industry.”Shaw, R.W. The Journal of Industrial Economics 31 (1/2: September/December).1982. Pp. 69-91
E. 1982. Shaw, R.W. “Product Proliferation in Characteristics Space: The UKFertilizer Industry.” The Journal of Industrial Economics 31 (1/2:September/December), pp. 69-91.
Answers:1. E 2. E 3. D 4. B 5. B 6. A 7. C 8. D 9. D 10. C 11. D12. E 13. E 14. B 15. D 16. C 17. C 18. B 19. D 20. A

Industrial Growth and Competition K. Simons, 2003
135
Referencesand ExtendedBibliographies

Industrial Growth and Competition K. Simons, 2003
136
15. References in the Main Text
Abernathy, William J., Kim B. Clark, and Alan M. Kantrow. Industrial Renaissance:Producing a Competitive Future for America. New York: Basic Books, 1983. U LSElibrary HC110.T4 A14.
Achi, Zafer, Andrew Doman, Olivier Sibony, Jayant Sinha, Stephan Witt. “The Paradoxof Fast Growth Tigers.” McKinsey Quarterly, (3), 1995, pp. 4-17. O J.
Achilladelis, Basil. “The Dynamics of Technological Innovation: The Sector ofAntibacterial Medicines.” Research Policy, 22, 1993, pp. 279-308. U LSE libraryperiodicals HD30.4.
Adler, Michael. Antique Typewriters: From Creed to QWERTY. Atglen, Penn.: SchifferPublishing, 1997.
Anderson, Philip and Michael L. Tushman. “Technological Discontinuities andDominant Designs: A Cyclical Model of Technological Change.” AdministrativeScience Quarterly 35, 1990, pp. 604-633. O.
Arthur, W. Brian. “Competing Technologies, Increasing Returns, and Lock-In byHistorical Events.” Economic Journal 99 (March), 1989, pp. 116-131. J E.
Audretsch, David B. “New-Firm Survival and the Technological Regime.” Review ofEconomics and Statistics (August), 1991, pp. 441-450. E.
Audretsch, David B. Innovation and Industry Evolution. Cambridge, Mass.: MIT Press,1995. B 338.06 AUD.
Bain, Joe S. Barriers to New Competition: Their Character and Consequences inManufacturing Industries. Cambridge: Harvard University Press, 1956. B 338.6048BAI.
Baldwin, John R. The Dynamics of Industrial Competition: A North AmericanPerspective. Cambridge: Cambridge University Press, 1998. B 338.70971 BAL.
Barro, Robert J. and Xavier Sala-i-Martin. Economic Growth. New York: McGraw-Hill,1995. R 339.5 BAR.
Berndt, Ernst R., Iain M. Cockburn, and Zvi Griliches. “Pharmaceutical Innovations andMarket Dynamics: Tracking Effects on Price Indexes for Antidepressant Drugs.”Brookings Papers on Economic Activity: Microeconomics, 1996, pp. 133-188. E.
Brewster, David. Business Economics: Decision-Making and the Firm. London:Dryden, 1997. B 338.751 BRE.
Callon, Scott. Divided Sun: MITI and the Breakdown of Japanese High-Tech IndustrialPolicy, 1975-1993. Stanford: Stanford University Press, 1995. B 338.952 CAL.
Carlsmith, Leonard E. The Economic Characteristics of Rubber Tire Production. NewYork: Criterion Linotyping and Printing, 1935.
Carroll, Glenn R., and Michael T. Hannan, eds. Organizations in Industry: Strategy,Structure, and Selection. Oxford: Oxford University Press, 1995. R 338.74 ORG.
Chandler, Alfred D. The Visible Hand: The Managerial Revolution in AmericanBusiness. Cambridge: Belknap (Harvard University Press), 1977. B 338.75 CHA.
Chandler, Alfred D., Jr. Scale and Scope. Cambridge, MA: Harvard University Press,1990. B R 338.644 CHA.

Industrial Growth and Competition K. Simons, 2003
137
Christensen, Clayton M., and Richard S. Rosenbloom. “Explaining the Attacker'sAdvantage: Technological Paradigms, Organizational Dynamics, and the ValueNetwork.” Research Policy 24 (2), March 1995, pp. 233-257. O J.
Cohen, Wesley and Steven Klepper. “A Reprise of Size and R&D.” Economic Journal106, 1996, pp. 925-951. O J E.
Cohen, Wesley. “Empirical Studies of Innovative Activity.” In Stoneman, Paul, ed.,Handbook of the Economics of Innovation and Technological Change, Oxford: BasilBlackwell, 1995, pp. 182-264. O B 338.06 HAN.
David, Paul. “Clio and the Economics of QWERTY.” American Economic AssociationPapers and Proceedings 75 (2), May 1985, pp. 332-337. O J E.
Davis, Steven J., John C. Haltiwanger, and Scott Schuh. Job Creation and Destruction.Cambridge, Mass.: MIT Press, 1996. B 331.12 DAV.
Dunne, Timothy, Mark J. Roberts, and Larry Samuelson. “The Growth and Failure ofU.S. Manufacturing Plants.” Quarterly Journal of Economics 104 (4: November),1989, pp. 671-698. O E.
Evans, Philip, and Thomas S. Wurster. Blown to Bits: How the Economics ofInformation Transforms Strategy. Boston, Mass.: Harvard Business School Press,2001. B 338.7505 EVA.
Federal Trade Commission. Report on the Motor Vehicle Industry. Washington, D.C.:US Government Printing Office, 1939.
Federal Trade Commission. Economic Report on Antibiotics Manufacture. Washington,D.C.: US Government Printing Office, 1958.
Foster, Richard N. Innovation: The Attacker’s Advantage. New York: Summit Books,1986. U LSE Library HD45 F75.
Gaffey, John D. The Productivity of Labor in the Rubber Tire Manufacturing Industry.New York: Columbia University Press, 1940.
Geroski, Paul A. Market Dynamics and Entry. Oxford: Blackwell, 1991. R 338.6 GER.Geroski, Paul A. “Thinking Creatively about Markets.” International Journal of
Industrial Organization, vol. 16 (6), Nov. 1998, pp. 677-695. J E.Gibbons, Michael, and Ron Johnston. “The Roles of Science in Technological
Innovation.” Research Policy 3, 1974, pp. 220-242. U Imperial College central library,level 3 periodicals 351.85.
Glaeser, Edward L., Hedi D. Kallal, José A. Scheinkman, Andrei Shleifer. “Growth inCities.” Journal of Political Economy 100 (6), 1992, pp. 1126-1152. E.
Gort, Michael, and Steven Klepper. “Time Paths in the Diffusion of ProductInnovations.” The Economic Journal, 92, Sept. 1982, pp. 630-653. O E.
Hannan, Michael T., and John Freeman. Organizational Ecology. Cambridge, Mass.:Harvard University Press, 1989. R 338.74 HAN.
Henderson, Rebecca M. and Kim B. Clark. “Architectural Innovation: TheReconfiguration of Existing Product Technologies and the Failure of EstablishedFirms.” Administrative Science Quarterly 35, 1990, pp. 9-30. U LSE library journalsJA1.A3.
Hobday, Michael. Innovation in East Asia: The Challenge to Japan. Cheltenham:Edward Elgar, 1995. B 338.06095 HOB.

Industrial Growth and Competition K. Simons, 2003
138
Hobijn, Bart, and Boyan Jovanovic. 2001. The Information-Technology Revolution andthe Stock Market: Evidence. American Economic Review, vol. 91 (5), Dec. 2001, pp.1203-1220. J.
Hounshell, David A. From the American System to Mass Production, 1800-1932.Baltimore: Johns Hopkins University Press, 1984. B 338.644 HOU.
Ijiri, Yuji and Herbert A. Simon. Skew Distributions and the Sizes of Business Firms.Amsterdam: North-Holland, 1977. O (introduction).
Jacobs, Jane. The Economy of Cities. New York: Random House, 1969. B R338.091732.
Jacobs, Jane. Cities and the Wealth of Nations: Principles of Economic Life. 1985. R301.36 JAC.
Jaffe, Adam, Manuel Trajtenberg, and Rebecca Henderson. “Geographic Localization ofSpillovers as Evidenced by Patent Citations.” Quarterly Journal of Economics, 108,1993, pp. 577-98. E.
Jewkes, John, David Sawers, and Richard Stillerman. The Sources of Invention, 2nd ed.New York: W.W. Norton & Co., 1969. B 608.7 JEW.
Johnson, Chalmers. MITI and the Japanese Miracle: The Growth of Industrial Policy,1925-1975. Stanford: Stanford University Press, 1982. B 338.952 JOH.
Johnston, Ron and Michael Gibbons. “Characteristics of Information Usage inTechnological Innovation.” IEEE Transactions on Engineering Management, EM-22(1: February), 1975, pp. 27-34. U Imperial College central library, level 2 periodicals62 IEEE.
Jovanovic, Boyan, and Glenn M. MacDonald. “The Life Cycle of a CompetitiveIndustry.” Journal of Political Economy, 102, 1994, pp. 322-347. O E.
King, Andrew A., and Christopher L. Tucci. “Incumbent Entry into New Market Niches:The Role of Experience and Managerial Choice in the Creation of DynamicCapabilities.” Management Science 48 (2), 2002, pp. 171-186. J.
Klepper, Steven. “Entry, Exit, Growth, and Innovation over the Product Life Cycle.”American Economic Review, 86, 1996, pp. 562-583. O J E.
Klepper, Steven, and Elizabeth Graddy. “The Evolution of New Industries and theDeterminants of Market Structure.” RAND Journal of Economics 21 (1: Spring), 1990,pp. 27-44. O J.
Klepper, Steven and Kenneth L. Simons. “Technological Extinctions of Industrial Firms:An Inquiry into their Nature and Causes.” Industrial and Corporate Change 6, 1997,pp. 379-460. O J.
Klepper, Steven and Kenneth L. Simons. “The Making of an Oligopoly: Firm Survivaland Technological Change in the Evolution of the U.S. Tire Industry.” Journal ofPolitical Economy, 108 (4: August), 2000, pp. 728-760. J.
Klepper, Steven and Kenneth L. Simons. “Dominance by Birthright: Entry of PriorRadio Producers and Competitive Ramifications in the U.S. Television ReceiverIndustry,” Strategic Management Journal, 21 (10-11: October-November), 2000, pp.997-1016. J.
Klepper, Steven and Kenneth L. Simons. “Industry Shakeouts and TechnologicalChange.” Working paper, 2001. W www2.rhul.ac.uk/~uhss021.
Krugman, Paul. “Increasing Returns and Economic Geography.” Journal of PoliticalEconomy 99 (3), 1991, pp. 483-499. E.

Industrial Growth and Competition K. Simons, 2003
139
Krugman, Paul. “Technological Change in International Trade.” In Stoneman, Paul, ed.,Handbook of the Economics of Innovation and Technological Change, Oxford: BasilBlackwell, 1995, pp. 342-365. B 338.06 HAN.
Landes, David S. The Unbound Prometheus: Technological Change and IndustrialDevelopment in Western Europe from 1750 to the Present. Cambridge: CambridgeUniversity Press, 1969. B 338.94 LAN.
Levin, Richard C., Alvin K. Klevorick, Richard R. Nelson, and Sidney G. Winter.“Appropriating the Returns from Industrial Research and Development” (includingcommentary by Richard Gilbert). Brookings Papers on Economic Activity 3, 1987, pp.783-831. U LSE library journals HC101.
Lichtenberg, Frank R. Corporate Takeovers and Productivity. Cambridge, Mass.: MITPress, 1992. B 338.83 LIC.
Liebowitz, S. J. and Stephen E. Margolis. “The Fable of the Keys.” Journal of Law andEconomics 33 (1: April), 1990, pp. 1-25. W http://www.utdallas.edu/~liebowit/keys1.html.
Lu, Qiwen. China’s Leap into the Information Age: Innovation and Organization in theComputer Industry. Oxford: Oxford University Press, 2000. B 338.4700164 LU.
Majumdar, Badiul A. Innovations, Product Developments, and Technology Transfers:An Empirical Study of Dynamic Competitive Advantage, the Case of ElectronicCalculators. Washington, D. C.: University Press of America, 1982.
Mansfield, Edwin. “Entry, Gibrat’s Law, Innovation, and the Growth of Firms.”American Economic Review 52 (5), 1962, pp. 1023-1051. O J E.
Martin, Stephen. Advanced Industrial Economics. Oxford: Basil Blackwell, 1993. B R338 MAR. A second edition is to be published in 2001.
Mokyr, Joel. The Lever of Riches: Technological Creativity and Economic Progress.Oxford, 1990. R 338.06 MOK.
Mowery, David C. and Nathan Rosenberg. Technology and the Pursuit of EconomicGrowth. Cambridge: Cambridge University Press, 1989. B 338.06 MOW.
Mueller, Dennis C. Profits in the Long Run. 1986. R 338.516 MUE.Nelson, Richard R. and Sidney G. Winter. 1978. “Forces Generating and Limiting
Concentration under Schumpeterian Competition.” Bell Journal of Economics 9, pp.524-548. J, or see their classic book which contains the same article: Nelson, RichardR. and Sidney G. Winter. An Evolutionary Theory of Economic Change. HarvardUniversity Press (Cambridge, Mass.), 1982. B 338.09 NEL.
Penrose, Edith. The Theory of the Growth of the Firm. Oxford: Oxford University Press,1959. Revised edition with a new foreword, 1995.
Phillips, Almarin. Technology and Market Structure: A Study of the Aircraft Industry.D.C. Heath, 1971. U LSE library HD9711.U5 P55. A classic study of the rich-get-richer phenomenon in industry.
Porter, Michael E. Competitive Strategy: Techniques for Analyzing Industries andCompetitors. New York: Free Press, 1980. B 338.6048 POR (also O chapter 1).
Pratten, Clifford F. “The Manufacture of Pins.” Journal of Economic Literature 18(March), 1980, pp. 93-96. E.
Ravenscraft, David J., and F.M. Scherer. Mergers, Sell-Offs, and Economic Efficiency.1987. B 338.83 RAV.

Industrial Growth and Competition K. Simons, 2003
140
Rosenberg, Nathan. Inside the Black Box: Technology and Economics. Cambridge:Cambridge University Press, 1982. B 338.06 ROS.
Saxenian, AnnaLee. Regional Advantage: Culture and Competition in Silicon Valley andRoute 128. Cambridge, Mass.: Harvard University Press, 1994. B R 338.4762 SAX.
Scherer, F.M. Industry Structure, Strategy, and Public Policy. New York: HarperCollinsCollege, 1996. B 338.973 SCH.
Scherer, F.M. and David Ross. Industrial Market Structure and Economic Performance,3rd ed. Boston: Houghton-Mifflin, 1990. R 338.758 SCH.
Scherer, F. M., Alan Beckenstein, Erich Kaufer, and R. Dennis Murphy. The Economicsof Multi-Plant Operation. Cambridge: Harvard University Press, 1975. B 338.65ECO.
Schmalansee, Richard. “Inter-Industry Studies of Structure and Performance” (chapter16). In Richard L. Schmalensee and Robert D. Willig, eds., Handbook of IndustrialOrganization, vol. 2, Amsterdam: North Holland, 1989, pp. 951-1009.
Schnaars, Steven P. Managing Imitation Strategies: How Later Entrants Seize Marketsfrom Pioneers. Free Press (Macmillan), 1994. B 338.758 SCH.
Schumpeter, Joseph A. The Theory of Economic Development: An Inquiry into Profits,Capital, Credit, Interest, and the Business Cycle. 1912. Translated from the Germanby R. Opie, Harvard University Press, 1934. B 338.5 SCH.
Schumpeter, Joseph. Capitalism, Socialism, and Democracy. New York: Harper, 1942.B R 320.531 SCH.
Shaw, R.W. “Product Proliferation in Characteristics Space: The UK FertilizerIndustry.” The Journal of Industrial Economics 31 (1/2: September/December), 1982,pp. 69-91. O.
Simons, Kenneth L. Shakeouts: Firm Survival and Technological Change in NewManufacturing Industries. PhD dissertation, Carnegie Mellon University, 1995.
Simons, Kenneth L. “Product Market Characteristics and the Industry Life Cycle.”Working paper, Royal Holloway, University of London, 2002a. Early version at Wwww2.rhul.ac.uk/~uhss021, or ask me for the full updated version. Shows thatunderlying technological or other characteristics drive industry outcomessystematically. Part of the paper compares the US industries studied by Klepper andGraddy (and previously Gort and Klepper) with the same industries in the UK, to verifythe idea that underlying product- or technology-specific traits of industries are primedeterminants of the industries’ evolutionary processes.
Simons, Kenneth L. “Information Technology and Dynamics of Industry Structure: TheUK IT Consulting Industry as a Contemporary Specimen.” Working paper, RoyalHolloway, University of London, 2002b. W www2.rhul.ac.uk/~uhss021. Checks forevidence of whether the internet (and earlier the PC) might yet have caused disruptivetechnology effects among UK IT consultancies.
Solow, Robert M. “Technical Change and the Aggregate Production Function.” Reviewof Economics and Statistics 39 (August), 1957, pp. 312-320. O J E.
Suárez, Fernando F. and James M. Utterback. “Dominant Designs and the Survival ofFirms.” Strategic Management Journal, 16 (5), June 1995, pp. 415-430. J.
Sutton, John. Sunk Costs and Market Structure: Price Competition, Advertising, and theEvolution of Concentration. Cambridge, Mass.: MIT Press, 1991. B R 338.6 SUT.
Industrial Growth and Competition K. Simons, 2003
141
Television Factbook (or Television and Cable Factbook), vols. 5 to 59. Washington,D.C.: Warren Publishing, 1948 to 1991. These issues have lists of TV set producers.
Thomas, Robert Paul. An Analysis of the Pattern of Growth of the Automobile Industry,1895-1929. PhD dissertation, Northwestern University, 1965.
Tirole, Jean. The Theory of Industrial Organization. Cambridge, Mass: MIT Press,1988. O (chapter 7) B 338.6 TIR.
Tushman, Michael L., and Philip Anderson. “Technological Discontinuities andOrganizational Environments.” Administrative Science Quarterly 31, 1986, pp. 439-465. O.
US Department of Commerce. Digital Economy 2000. Washington: US Department ofCommerce, 2000. W www.esa.doc.gov/de2000.pdf.
US Tariff Commission, later US International Trade Commission. Synthetic OrganicChemicals. Washington, D.C.; US Government Printing Office, 1945 to 1993.
von Hippel, Eric. The Sources of Innovation. Oxford: Oxford University Press, 1988. R338.06 HIP.
von Tunzelmann, G. N. Technology and Industrial Progress: The Foundations ofEconomic Growth. Aldershot, UK: Edward Elgar, 1995. B 338.06 VON.
Walker, John. “Service Sector Adjustment and the Implications for Manufacturing.” InYates, Ivan, ed. Innovation, Investment and Survival of the UK Economy. London:Royal Academy of Engineering, 1992. Chapter 3, pp. 45-51. B check call number incatalog (new addition).
Walker, William. “National Innovation Systems: Britain.” In Nelson, Richard R., ed.National Innovation Systems. New York: Oxford University Press, 1993. Chapter 5,pp. 158-191. O B R 338.06 NAT.
Williamson, Jeffrey G. “Productivity and American Leadership: A Review Article.”Journal of Economic Literature, vol. 29 (1), March 1991, pp. 51-68.
Yates, Ivan. “An Industrialist’s Overview of Manufacturing and Economic Growth.” InYates, Ivan, ed. Innovation, Investment and Survival of the UK Economy. London:Royal Academy of Engineering, 1992. Chapter 1, pp. 5-24. B check call number incatalog (new addition).

Industrial Growth and Competition K. Simons, 2003
142
16. Bibliography - How Industries Work
This bibliography is out of date and by no means exhaustive, but it may give youinitial ideas about where to find some previous research on a topic.
AdvertisingNelson, Phillip. “Advertising as Information.” Journal of Political Economy, 82 (4:
July/August), 1974, pp. 729-754.Porter, Michael E. “Interbrand Choice, Media Mix and Market Performance.” American
Economic Review, 66 (2: May), 1976, pp. 398-406.
Firm Entry and Survival - Age and Size RelationshipsAmburgey, Terry L., Dawn Kelly, and William P. Barnett. “Resetting the Clock: The
Dynamics of Organizational Change and Failure.” Administrative Science Quarterly,38, 1993, pp. 51-73.
Audretsch, David B. “New-Firm Survival and the Technological Regime.” Review ofEconomics and Statistics, (August), 1991, pp. 441-450.
Barnett, William P., and Terry L. Amburgey. “Do Larger Organizations GenerateStronger Competition?” In Jitendra V. Singh, ed., Organizational Evolution: NewDirections, Newbury Park: Sage, 1990, pp. 78-102.
Brüderl, Josef, and Rudolf Schüssler. “Organizational Mortality: The Liabilities ofNewness and Adolescence.” Administrative Science Quarterly, 35, 1990, pp. 530-547.
Davis, Steven J., John C. Haltiwanger, and Scott Schuh. Job Creation and Destruction.Cambridge, Mass.: MIT Press, 1996. 331.12 DAV.
Dunne, Timothy, Mark J. Roberts, and Larry Samuelson. “The Growth and Failure ofU.S. Manufacturing Plants.” Quarterly Journal of Economics, 104 (4: November),1989, pp. 671-698. Examines patterns of plant failure and growth as a function of ageand size.
Evans, David. 1987. “Tests of Alternative Theories of Firm Growth.” Journal ofPolitical Economy 95 (4), pp. 657-674.
Geroski, Paul A. Market Dynamics and Entry. Oxford: Blackwell, 1991. 338.6 GER.Chapter 2 reviews empirical evidence on patterns of entry, and chapter 3 reviewsmodels of entry.
Mansfield, Edwin. “Entry, Gibrat’s Law, Innovation, and the Growth of Firms.”American Economic Review, 52 (5), 1962, pp. 1023-1051. Explores a number ofpatterns of industry evolution: effects on entry and exit, how well Gibrat’s law fits, theimpact of successful innovations on firm growth, and mobility between sizes.
Firm Entry and Survival - Organizational Ecology ModelsHannan, Michael T., and Glenn R. Carroll. Dynamics of Organizational Populations.
New York: Oxford University Press, 1992.Hannan, Michael T., and John Freeman. Organizational Ecology. Cambridge, Mass.:
Harvard University Press, 1989. 338.74 HAN. Known for the authors’ adaptation of
Industrial Growth and Competition K. Simons, 2003
143
an ecological model of organisms to apply to organizations, and for longitudinalanalyses of entry and survival patterns.
Carroll, Glenn R. “Concentration and Specialization: Dynamics of Niche Width inPopulations of Organizations.” American Journal of Sociology, 90 (6), 1985, pp. 1262-1283.
Firm Entry and Survival - Patterns of Leadership TurnoverAnderson, Philip and Michael L. Tushman. “Technological Discontinuities and
Dominant Designs: A Cyclical Model of Technological Change.” AdministrativeScience Quarterly, 35, 1990, pp. 604-633.
Christensen, Clayton M., and Richard S. Rosenbloom. "Explaining the Attacker'sAdvantage: Technological Paradigms, Organizational Dynamics, and the ValueNetwork." Research Policy, 24, 1995, pp. 233-257.
Foster, Richard N. Innovation: The Attacker’s Advantage. New York: Summit Books,1986. A management consultant argues that new firms break into market positions andtriumph over incumbents by coming up with innovative new products.
Henderson, Rebecca M. and Kim B. Clark. “Architectural Innovation: TheReconfiguration of Existing Product Technologies and the Failure of EstablishedFirms.” Administrative Science Quarterly, 35, 1990, pp. 9-30.
Tushman, Michael L., and Philip Anderson. “Technological Discontinuities andOrganizational Environments.” Administrative Science Quarterly, 31, 1986, pp. 439-465.
Firm Entry and Survival - Patterns of ShakeoutsAchi, Zafer, Andrew Doman, Olivier Sibony, Jayant Sinha, Stephan Witt. “The Paradox
of Fast Growth Tigers.” McKinsey Quarterly, (3), 1995, pp. 4-17. An easy-readingmanagerial-audience article on firm growth with increasing returns dynamics.
Christensen, Clayton M., Fernando F. Suárez, and James M. Utterback. “Strategies forSurvival in Fast-Changing Industries.” Working paper, MIT Sloan School, July 1996.
Gort, Michael, and Steven Klepper. “Time Paths in the Diffusion of ProductInnovations.” The Economic Journal, 92, Sept. 1982, pp. 630-653.
Hopenhayn, Hugo A. “The Shakeout.” Economics working paper 33, UniversitatPompeu Fabra, 1993.
Jovanovic, Boyan, and Glenn M. MacDonald. “The Life Cycle of a CompetitiveIndustry.” Journal of Political Economy, 102, 1994, pp. 322-347.
Klepper, Steven. “Entry, Exit, Growth, and Innovation over the Product Life Cycle.”American Economic Review, 86, 1996, pp. 562-583. A particularly telling model ofshakeouts, this seems to come much closer to empirical fact than other authors’ theorieshave come.
Klepper, Steven. “Evolution, Market Concentration, and Firm Survival.” Mimeo,Carnegie Mellon University, 1996.
Klepper, Steven, and Elizabeth Graddy. “The Evolution of New Industries and theDeterminants of Market Structure.” Rand Journal of Economics, 21, 1990, pp. 27-44.Presents an updated version of data shown by Gort and Klepper on industry shakeoutsin 46 manufactured products.
Industrial Growth and Competition K. Simons, 2003
144
Klepper, Steven, and Kenneth L. Simons. 1993. “Technological Change and IndustryShakeouts.” Mimeo, Carnegie Mellon University.
Klepper, Steven and Kenneth L. Simons. “Technological Extinctions of Industrial Firms:An Inquiry into their Nature and Causes.” Industrial and Corporate Change, 6, 1997,pp. 1-82.
Klepper, Steven and Kenneth L. Simons. “The Making of an Oligopoly: Firm Survivaland Technological Change in the Evolution of the U.S. Tire Industry.” Journal ofPolitical Economy, 108 (4: August), 2000, pp. 728-760. On the journal shelves atBedford Library, or available electronically via JSTOR. Uses rich data from the UStire industry to probe processes of industry evolution and how they involvetechnological change.
Klepper, Steven and Kenneth L. Simons. “Dominance by Birthright: Entry of PriorRadio Producers and Competitive Ramifications in the U.S. Television ReceiverIndustry,” Strategic Management Journal, 21 (10-11: October-November), 2000, pp.997-1016. On the journal shelves at Bedford Library. Shows how prior experience canmatter to competitive success.
Nelson, Richard R. and Sidney G. Winter. 1978. “Forces Generating and LimitingConcentration under Schumpeterian Competition.” Bell Journal of Economics 9, pp.524-548. Also see their classic book which contains the same article: Nelson, RichardR. and Sidney G. Winter. An Evolutionary Theory of Economic Change. HarvardUniversity Press (Cambridge, Mass.), 1982. 338.09 NEL.
Phillips, Almarin. “Patents, Potential Competition, and Technical Progress.” AmericanEconomic Review, 56 (May), 1966, pp. 301-310.
Phillips, Almarin. Technology and Market Structure: A Study of the Aircraft Industry.Lexington, Mass.: D.C. Heath and Company, 1971.
Shaked, Avner and John Sutton. “Product Differentiation and Industry Structure.”Journal of Industrial Economics, 36, 1987, pp. 131-146.
Simons, Kenneth L. “Product Market Characteristics and the Industry Life Cycle.”Working paper, Royal Holloway, University of London, 2002. Early version at Wwww2.rhul.ac.uk/~uhss021, or ask me for the full updated version. Shows thatunderlying technological or other characteristics drive industry outcomessystematically. Part of the paper compares the US industries studied by Klepper andGraddy (and previously Gort and Klepper) with the same industries in the UK, to verifythe idea that underlying product- or technology-specific traits of industries are primedeterminants of the industries’ evolutionary processes.
Suárez, Fernando F. and James M. Utterback. “Dominant Designs and the Survival ofFirms.” Strategic Management Journal, 16, 1995, pp. 415-430.
Sutton, John. Sunk Costs and Market Structure: Price Competition, Advertising, and theEvolution of Concentration. Cambridge, Mass.: MIT Press, 1991.
Firm GrowthDunne, Timothy, Mark J. Roberts, and Larry Samuelson. “The Growth and Failure of
U.S. Manufacturing Plants.” Quarterly Journal of Economics, 104 (4: November),1989, pp. 671-698.
Evans, David. 1987. “Tests of Alternative Theories of Firm Growth.” Journal ofPolitical Economy 95 (4), pp. 657-674.

Industrial Growth and Competition K. Simons, 2003
145
Ijiri, Yuji and Herbert A. Simon. Skew Distributions and the Sizes of Business Firms.Amsterdam: North-Holland, 1977. Examines a common distributional pattern thatrecurs in a great many circumstances, proposes an underlying probabilistic that canyield this distribution, and applies the methodology to distributions of firm sizes.
Jovanovic, Boyan. “Selection and the Evolution of Industry.” Econometrica, 50 (3:May), 1982, pp. 649-670.
Penrose, Edith. The Theory of the Growth of the Firm. Oxford: Basil Blackwell, 1959.338.741 PEN.
Firms - DefinitionAlchian, A. and Harold Demsetz. “Production, Information Costs, and Economic
Organization.” American Economic Review, 62, 1972, pp. 777-795.Coase, Ronald H. “The Nature of the Firm.” Economica, 4, 1937, pp. 386-405. A key
article that helped spur the idea that the size of firms, and what differentiates within-firm transactions from market (between-firm) transactions, is the cost of carrying outthe transactions.
Stigler, George J. “The Division of Labor is Limited by the Extent of the Market.”Journal of Political Economy, 59 (3: June), 1951, pp. 185-193.
Williamson, Oliver E. Markets and Hierarchies: Analysis and Antitrust Implications.New York: Free Press, 1975. 338.75402. The author has become the most widely-known proponent of models following from the Coase tradition. This book was hisfirst; later books may be a better read with the same content.
Firms - DiversificationBaumol, William J. “Contestable Markets: An Uprising in the Theory of Industry
Structure.” American Economic Review, 72 (1: March), 1982, pp. 1-15. Baumol andothers have developed a theory of industry structure in which firms can be forced toprice at marginal production cost even if they have almost no competition, as long asthere are potential “hit-and-run” entrants who can “contest” the market.
Streitwieser, Mary L. “The Extent and Nature of Establishment-Level Diversification inSixteen U.S. Manufacturing Industries.” Journal of Law and Economics, 34 (2 pt. 2:October), 1991, pp. 503-534. Uses Census of Manufactures data to analyzediversification within and between sixteen four-digit SIC industries.
Firms - Inter-Firm AlliancesGulati, Ranjay. “The Dynamics of Alliance Formation: Which Firms Enter into
Alliances with Each Other?” Chapter 3 of PhD dissertation, Harvard University, Jan.1993. Mimeo.
Mitchell, Will and Kulwant Singh. “Incumbents’ Use of Pre-Entry Alliances beforeExpansion into New Technical Subfields of an Industry.” Journal of EconomicBehavior and Organization, 18 (3: August), 1992, pp. 347-372. Examines alliancesformed between manufacturers of US-sold hospital diagnostic medical imagingequipment, before manufacturers became involved with a new class of equipment.
Industrial Growth and Competition K. Simons, 2003
146
Firms - Labor PracticesBarron, John M., Dan A. Black, and Mark A. Loewenstein. “Employer Size: The
Implications for Search, Training, Capital Investment, Starting Wages, and WageGrowth.” Journal of Labor Economics, 5 (1), 1987, pp. 76-89. Uncovers empiricalregularities between firm size and characteristics of the firm and its workforce.
Brown, Charles and James Medoff. “The Employer Size-Wage Effect.” Journal ofPolitical Economy, 97 (5), 1989, pp. 1027-1059. An impressive empirical analysis testsseven explanations for the observed increase in wages with employer size.
Oi, Walter Y. “Heterogeneous Firms and the Organization of Production.” EconomicInquiry, 21 (2: April), 1983, pp. 147-171. A theoretical model to explain empiricalregularities about firms and the labor force.
Firms - Vertical IntegrationAoki, Masahiko. “Toward an Economic Model of the Japanese Firm.” Journal of
Economic Literature, 28 (March), 1990, pp. 1-27.Klein, Benjamin, Robert G. Crawford, and Armen A. Alchian. “Vertical Integration,
Appropriable Rents, and the Competitive Contracting Process.” Journal of Law andEconomics, 21 (2: October), 1978, pp. 297-326.
Langlois, Richard N. and Paul L. Robertson. “Explaining Vertical Integration: Lessonsfrom the Automobile Industry.” Journal of Economic History 49 (2: June), 1989, pp.361-375.
Stigler, George J. “The Division of Labor is Limited by the Extent of the Market.”Journal of Political Economy, 59 (3: June), 1951, pp. 185-193.
Geographic Agglomeration of Firms and R&DJaffe, Adam, Manuel Trajtenberg, and Rebecca Henderson. “Geographic Localization of
Spillovers as Evidenced by Patent Citations.” Quarterly Journal of Economics, 108,1993, pp. 577-98.
Krugman, Paul. “Increasing Returns and Economic Geography.” Journal of PoliticalEconomy 99 (3), 1991, pp. 483-499.
Glaeser, Edward L., Hedi D. Kallal, José A. Scheinkman, Andrei Shleifer. “Growth inCities.” Journal of Political Economy 100 (6), 1992, pp. 1126-1152.
History of Industry and Technology (Key Works)Chandler, Alfred D. The Visible Hand: The Managerial Revolution in American
Business. Cambridge: Belknap (Harvard University Press), 1977. 338.75 CHA. Amonumental document that provided for the first time an integrated history ofAmerican industry from the 1700s into the 1900s.
Chandler, Alfred D., Jr. Scale and Scope. Cambridge, MA: Harvard University Press,1990. 338.644 CHA. Another monumental document, analyzing industrial history inthe United States and Europe during the 20th century.
Hounshell, David A. From the American System to Mass Production, 1800-1932.Baltimore: Johns Hopkins University Press, 1984. 338.644 HOU.
Landes, David S. The Unbound Prometheus: Technological Change and IndustrialDevelopment in Western Europe from 1750 to the Present. Cambridge: Cambridge
Industrial Growth and Competition K. Simons, 2003
147
University Press, 1969. 338.94 LAN. The key history of European industrialdevelopment from 1700 until shortly after World War II.
Mokyr, Joel. The Lever of Riches: Technological Creativity and Economic Progress.Oxford, 1990. 338.06 MOK. A seminal history and analysis of technological advance,mostly in the western world, over more than two millennia; illustrates the fundamentalrole of technical change in economic growth.
Industry Economics TextsBrewster, David. Business Economics: Decision-Making and the Firm. London:
Dryden, 1997. 338.751 BRE.Scherer, F.M. Industry Structure, Strategy, and Public Policy. New York: HarperCollins
College, 1996. 338.973 SCH. Covers many of the principles of industry economicsthrough analyses of nine industries.
Scherer, F.M. and David Ross. Industrial Market Structure and Economic Performance,3rd ed. Boston: Houghton-Mifflin, 1990. 338.758 SCH. An impressive, useful, andwidely-used compendium of empirical facts (especially) and theoretical models inindustry economics.
Tirole, Jean. The Theory of Industrial Organization. Cambridge, MA: MIT Press, 1988.338.6 TIR. A widely-used compendium of theoretical models used in industryeconomics, with a focus primarily on game-theoretic traditions.
Product DifferentiationEaton, B. Curtis and Richard G. Lipsey. “Product Differentiation.” In Handbook of
Industrial Organization, Volume I, ed. R. Schmalansee and R. D. Willig, Amsterdam:North Holland (Elsevier), 1989. Chapter 12, pp. 723-768. A summary of static modelsof product differentiation, this chapter discusses how well each model fits with seven“awkward facts.”
Shaw, R. W. “Product Proliferation in Characteristics Space: The UK FertilizerIndustry.” The Journal of Industrial Economics, 31 (1/2: September/December), 1982,pp. 69-91. Describes the evolution of product differentiation in the industry, anddiscusses how this fits with theoretical notions of product differentiation.
Production Cost - Cost Curves and Minimum Efficient Production ScaleBain, Joe S. Barriers to New Competition: Their Character and Consequences in
Manufacturing Industries. Cambridge: Harvard University Press, 1956. 338.6048 BAIScherer, F. M., Alan Beckenstein, Erich Kaufer, and R. Dennis Murphy. The Economics
of Multi-Plant Operation. Cambridge: Harvard University Press, 1975. 338.65 ECO.
Production Cost - Experience/Learning Curves, Progressive ReductionArgote, Linda, Sara L. Beckman, and Dennis Epple. “The Persistence and Transfer of
Learning in Industrial Settings.” Management Science 36 (2: February), 1990, pp. 140-154. In a re-analysis of Liberty ship construction data from World War II, shows thatshipyards’ previous learning depreciated with time, as costs rose while productionhalted temporarily.

Industrial Growth and Competition K. Simons, 2003
148
Boston Consulting Group. Perspectives on Experience. Boston: Boston ConsultingGroup, 1968.
Dasgupta, Partha, and Joseph Stiglitz. “Learning-by-Doing, Market Structure andIndustrial and Trade Policies.” Oxford Economic Papers, 40 (2: June), 1988, pp. 246-268.
Hollander, Samuel. The Sources of Increased Efficiency: A Study of DuPont RayonPlants. Cambridge, Mass.: MIT Press, 1965.
Itami, Hiroyuki. “Learning and Technology Accumulation by Japanese Firm.” Paperpresented at 1992 International Schumpeter Society Conference, Kyoto, Japan. Mimeo,Dept. of Commerce, Hitotsubashi University (draft). Discusses three routes throughwhich technology accumulates in Japanese firms: learning on the shop floor,information fusion, and interaction with customers. ******
Lieberman, Marvin B. “The Learning Curve and Pricing in the Chemical ProcessingIndustries.” RAND Journal of Economics, 15 (2: Summer), 1984, pp. 213-228.
Lieberman, Marvin B. “The Learning Curve, Diffusion, and Competitive Strategy.”Strategic Management Journal, 8 (5: Sept.-Oct.), 1987, pp. 441-452.
Lucas, Robert E., Jr. “Making a Miracle.” Econometrica 61 (2: March), 1993, pp. 251-272. Progressive cost reduction applied to the relative economic growth of differentnations.
Spence, Michael A. “The Learning Curve and Competition.” Bell Journal of Economics,12 (1: Spring), 1981, pp. 49-70.
Stern, Boris. Labor Productivity in the Automobile Tire Industry. Bureau of LaborStatistics Bulletin 585, Washington, D.C., US Government Printing Office, 1933.
R&D - AppropriabilityCaves, Richard E., Harold Crookell, and J. Peter Killing. “The Imperfect Market for
Technology Licensing.” Oxford Bulletin of Economics and Statistics, August, 1983,pp. 249-267.
Cohen, Wesley M., and Daniel A. Levinthal. “Innovation and Learning: The Two Facesof R&D,” Economic Journal 99 (Sept.), 1989, pp. 569-596. Develops the idea of“absorptive capacity” — the capability of firms to absorb new technologies or R&Dknow-how from other firms or researchers — which requires appropriate personnel,perhaps basic researchers, in firms.
Levin, Richard C., Wesley M. Cohen, and David C. Mowery. “R&D Appropriability,Opportunity, and Market Structure: New Evidence on Some SchumpeterianHypotheses.” American Economic Review Proceedings, 75, 1985, pp. 20-24.
Levin, Richard C., Alvin K. Klevorick, Richard R. Nelson, and Sidney G. Winter.“Appropriating the Returns to Industrial Research and Development.” BrookingsPapers on Economic Activity, 3, 1987, pp. 783-831.
R&D - Incentive StructureCohen, Wesley, and Steven Klepper. “The Anatomy of Industry R&D Intensity
Distributions.” American Economic Review 82 (4), 1992, pp. 773-799.

Industrial Growth and Competition K. Simons, 2003
149
R&D - Racing and Preemptive PatentingBarzel, Yoram. “Optimal Timing of Inventions.” Review of Economics and Statistics 50
(Aug.), 1968, pp. 348-355. Points out that when the first inventor gets the rights to aninvention, under some circumstances there may arise a sort of commons problem, andanalyzes the issue.
Gilbert, Richard and David Newberry. “Preemptive Patenting and the Persistence ofMonopoly.” American Economic Review 72 (3: June), 1982, pp. 514-526.
Reinganum, Jennifer. “Uncertain Innovation and the Persistence of Monopoly.”American Economic Review 73 (4: Sept.), 1983, pp. 741-748.
R&D - Sources of InnovationGibbons, Michael, and Ron Johnston. “The Roles of Science in Technological
Innovation.” Research Policy 3, 1974, pp. 220-242.Johnston, Ron and Michael Gibbons. “Characteristics of Information Usage in
Technological Innovation.” IEEE Transactions on Engineering Management, EM-22(1: February), 1975, pp. 27-34.
von Hippel, Eric. The Sources of Innovation. Oxford: Oxford University Press, 1988.
Technology - Demand-Pull versus Supply-PushAdams, James. “Fundamental Stocks of Knowledge and Productivity Growth.” Journal
of Political Economy, August 1990, pp. 673-702. Argues that basic scientific andengineering research in academia leads to productivity growth and hence to expansionof industrial output, with a lag of some decades.
Cohen, Wesley. “Empirical Studies of Innovative Activity.” In Stoneman, Paul, ed.,Handbook of the Economics of Innovation and Technological Change, Oxford: BasilBlackwell, 1995. Includes a basic review of the issue.
Technology - Diffusion / SpilloversJaffe, Adam B. “Technological Opportunity and Spillovers of R&D: Evidence from
Firms’ Patents, Profits, and Market Value.” American Economic Review 76 (5: Dec.),1986, pp. 984-1001.
Mansfield, Edwin. Industrial Research and Technological Innovation: An EconometricAnalysis. New York: Norton, 1968. Part IV. “Diffusion of Innovations.” Divided intochapters 7: “The Rate of Imitation,” 8: “The Speed of Response of Individual Firms,”and 9: “Intrafirm Rates of Diffusion.” Pages 133-191.
Spence, Michael. “Cost Reduction, Competition, and Industry Performance.”Econometrica 52 (1: January), 1984, pp. 101-121.
Technology - Dominant DesignsAbernathy, William J. The Productivity Dilemma: Roadblock to Innovation in the
Automobile Industry. Baltimore: Johns Hopkins University Press, 1978.Abernathy, William J., and James M. Utterback. “Patterns of Industrial Innovation.”
Technology Review, June/July 1978, pp. 40-47.Murmann, Johann Peter and Michael L. Tushman. “New Directions in Dominant Design
Research: Hierarchy of Technology Cycles as an Integrating Concept for the Study of

Industrial Growth and Competition K. Simons, 2003
150
Technical Change and Organizational Dynamics.” Manuscript, Columbia University,June 1996.
Klepper, Steven and Kenneth L. Simons. “Technological Extinctions of Industrial Firms:An Inquiry into their Nature and Causes.” Industrial and Corporate Change, 6, 1997,pp. 1-82.
Suárez, Fernando F. and James M. Utterback. “Dominant Designs and the Survival ofFirms.” Strategic Management Journal, 16, 1995, pp. 415-430.
Utterback, James M. Mastering the Dynamics of Innovation. Cambridge, Mass.:Harvard Business School Press, 1994.
Utterback, James M., and Fernando F. Suárez. “Innovation, Competition, and IndustryStructure.” Research Policy, 22, 1993, pp. 1-21.
Technology - Lock-In and Network ExternalitiesArthur, W. Brian. “Competing Technologies, Increasing Returns, and Lock-In by
Historical Events.” The Economic Journal 99 (March), 1989, pp. 116-131.David, Paul. “Clio and the Economics of QWERTY.” American Economic Association
Papers and Proceedings, 75 (2: May), 1985, pp. 332-337.Katz, Michael L., and Carl Shapiro. “Network Externalities, Competition, and
Compatibility.” American Economic Review 75 (3: June), 1985, pp. 424-440.Langlois, Richard N. “External Economies and Economic Progress: The Case of the
Microcomputer Industry.” Business History Review 66 (Spring), 1992, pp. 1-50.
Technology - Product Life CyclesAbernathy, William J. The Productivity Dilemma: Roadblock to Innovation in the
Automobile Industry. Baltimore: Johns Hopkins University Press, 1978.Abernathy, William J., and James M. Utterback. “Patterns of Industrial Innovation.”
Technology Review, June/July 1978, pp. 40-47.Christensen, Clayton M., Fernando F. Suárez, and James M. Utterback. “Strategies for
Survival in Fast-Changing Industries.” Working paper, MIT Sloan School, July 1996.Utterback, James M. Mastering the Dynamics of Innovation. Cambridge, Mass.:
Harvard Business School Press, 1994.Utterback, James M, and William J Abernathy. “A Dynamic Model of Process and
Product Innovation.” Omega, 3, 1975, pp. 639-656.Utterback, James M., and Fernando F. Suárez. “Innovation, Competition, and Industry
Structure.” Research Policy, 22, 1993, pp. 1-21.
Technology - Schumpeterian HypothesisAcs, Zoltan J., and David B. Audretsch. “Innovation, Market Structure, and Firm Size.”
The Review of Economics and Statistics, 71, 1987, pp. 567-574.Arrow, Kenneth J. “Economic Welfare and the Allocation of Resources for Invention.”
In Richard R. Nelson, ed., The Rate and Direction of Inventive Activity: Economic andSocial Factors, Princeton: Princeton University Press, 1962, pp. 609-625.
Bound, J., C. Cummins, Z. Griliches, B. H. Hall, and A. Jaffe. “Who Does R&D andWho Patents?” In Griliches, Zvi (ed.), R&D Patents and Productivity, Chicago:University of Chicago Press, 1984.
Industrial Growth and Competition K. Simons, 2003
151
Cohen, Wesley. “Empirical Studies of Innovative Activity.” In Stoneman, Paul, ed.,Handbook of the Economics of Innovation and Technological Change, Oxford: BasilBlackwell, 1995.
Cohen, Wesley and Steven Klepper. “A Reprise of Size and R&D.” Economic Journal,106, 1996, pp. 925-951. Argues for a re-interpretation of the evidence on firm size andR&D. Explains how observed empirical patterns, of roughly constant R&D spendingper employee for firms of varying sizes and of lower returns to R&D for larger firms, infact may result from larger firms exploiting R&D possibilities more fully and henceaccomplishing more overall innovation than a group of smaller firms that add up to thesame size as a large firm would accomplish.
Cohen, Wesley M., and Richard C. Levin. “Empirical Studies of Innovation and MarketStructure.” In Schmalansee, Richard and Robert D. Willig, Handbook of IndustrialOrganization, Volume II, Amsterdam: North-Holland, 1989, pp. 1059-1107. 338.6HAN.
Cohen, Wesley M., Richard C. Levin, and David C. Mowery. “Firm Size and R&DIntensity: A Re-examination.” Journal of Industrial Economics, 35, 1987, pp. 543-563.
Fisher, Franklin M., and Peter Temin. “Returns to Scale in Research and Development:What Does the Schumpeterian Hypothesis Imply?” Journal of Political Economy 81(1: Jan./Feb.), 1973, pp. 56-70. Also see: Rodriguez, Carlos Alfredo. “A Comment onFisher and Temin on the Schumpeterian Hypothesis.” Journal of Political Economy 87(2: April), 1979, pp. 383-385. Fisher, Franklin M., and Peter Temin. “TheSchumpeterian Hypothesis: Reply.” Journal of Political Economy 87 (2: April), 1979,pp. 386-389.
Futia, Carl A. “Schumpeterian Competition.” Quarterly Journal of Economics, 94,1980, pp. 675-695.
Galbraith, John K. American Capitalism: The Concept of Countervailing Power, Boston:Houghton Mifflin, 1952. 330.122 GAL.
Hamberg, D. “Size of Firm, Oligopoly, and Research: The Evidence.” CanadianJournal of Economics and Political Science, 30, 1964, pp. 62-75.
Horowitz, I. “Firm Size and Research Activity.” Southern Economic Journal, 28, 1962,pp. 298-301.
Jacobs, Jane. The Economy of Cities. New York: Random House, 1969.Jewkes, John, David Sawers, and Richard Stillerman. The Sources of Invention, 2nd ed.
New York: W.W. Norton & Co., 1969. Points out that, among those innovations thattake the form of new products, many originate from individuals or small firms. 608.7JEW.
Levin, Richard C., Wesley M. Cohen, and David C. Mowery. “R&D Appropriability,Opportunity, and Market Structure: New Evidence on Some SchumpeterianHypotheses.” American Economic Review Proceedings, 75, 1985, pp. 20-24.
Mansfield, Edwin. “Industrial Research and Development Expenditures: Determinants,Prospects, and Relation of Size of Firm and Inventive Output.” Journal of PoliticalEconomy, 72, 1964, pp. 319-340.
Meisel, J.B., and S.A.Y. Lin. “The Impact of Market Structure on the Firm’s Allocationof Resources to Research and Development.” Quarterly Review of Economics andBusiness, 23, 1983, pp. 28-43.

Industrial Growth and Competition K. Simons, 2003
152
Pavitt, K., M. Robson, and J. Townsend. “The Size Distribution of Innovating Firms inthe UK: 1945-1983.” Journal of Industrial Economics, 35, 1987, pp. 297-316.
Phillips, Almarin. Technology and Market Structure: A Study of the Aircraft Industry.Lexington, Mass.: D.C. Heath and Company, 1971.
Scherer, F. M. “Firm Size, Market Structure, Opportunity, and the Output of PatentedInventions.” American Economic Review, 55, 1965, pp. 1097-1125. Analyzes howpatent counts and R&D employment vary with technological opportunity, firm size,diversification into multiple SIC code categories, and monopoly power.
Scherer, F. M. “Size of Firm, Oligopoly, and Research: A Comment.” CanadianJournal of Economics and Political Science, 31, 1965, pp. 256-266.
Scherer, F.M. “Market Structure and the Employment of Scientists and Engineers.”American Economic Review, 57, 1967, pp. 524-530.
Scherer, F. M. Innovation and Growth: Schumpeterian Perspectives. Cambridge, Mass.:MIT Press, 1984. 338.06 SCH.
Schumpeter, Joseph A. The Theory of Economic Development. Oxford: OxfordUniversity Press, 1974. Originally published in German, 1911. 338.5 SCH.
Schumpeter, Joseph A. Capitalism, Socialism, and Democracy, 3rd ed. New York:Harper, 1950. 320.531 SCH.
Scott, J. T. 1984. “Firm versus Industry Variability in R&D Intensity.” In Griliches, Zvi(ed.), R&D Patents and Productivity, Chicago: University of Chicago Press.
Sutton, John. Technology and Market Structure: Theory and History. Cambridge, MA:MIT Press, 1998. B 338 SUT.
Williamson, Oliver E. 1965. “Innovation and Market Structure.” Journal of PoliticalEconomy 73, pp. 67-73.
Technology - TrajectoriesDosi, Giovanni. “Technological Paradigms and Technological Trajectories.” Research
Policy, 11, 1982, pp. 147-162.Evenson, Robert E. and Yoav Kislev. “A Stochastic Model of Applied Research.”
Journal of Political Economy 84 (2: April), 1976, pp. 265-281.
Comanor, W.S. “Market Structure, Product Differentiation, and Industrial Research.”Quarterly Journal of Economics, 81, 1967, pp. 639-657.
Dasgupta, Partha and Joseph Stiglitz. “Industrial Structure and the Nature of InnovativeActivity.” Economic Journal, 40, 1980, pp. 266-293. Analyzes technological changeand market structure changing endogenously over long time periods.
Ehrnberg, Ellinor, and Niklas Sjoberg. “Technological Transitions, Competition, andFirm Performance.” Mimeo, ******, 1992.
Flaherty, Therese. “Industry Structure and Cost-Reducing Investment.” Econometrica,48, 1980, pp. 1187-1209.
Griliches, Zvi. “Patent Statistics as Economic Indicators: A Survey.” Journal ofEconomic Literature, 28, 1990, pp. 1661-1707.
Iansiti, Marco and Tarun Khanna. “Technological Evolution, System Architecture andthe Obsolescence of Firm Capabilities.” Industrial and Corporate Change, 4, 1995, pp.333-361.

Industrial Growth and Competition K. Simons, 2003
153
Metcalfe, J. S., and M. Gibbons. “Technology, Variety and Organisation: A SystematicPerspective on the Competitive Process.” In Rosenbloom, Richard S. and Robert A.Burgelman, eds., Research on Technological Innovation, Management, and Policy, vol.4, Greenwich, Conn.: JAI Press, 1988.
Mueller, Dennis C., and John E. Tilton. “Research and Development Costs as a Barrierto Entry.” Canadian Journal of Economics, 2, 1969, pp. 570-579.
Nelson, Richard R. and Sidney G. Winter. “In Search of a Useful Theory of Innovation.”Research Policy, 5, 1977, pp. 36-76.
Nelson, Richard R. “Assessing Private Enterprise: An Exegesis of a Tangled Doctrine.”Bell Journal of Economics 12, 1981, pp. 93-111. Argues that a new approach, largelyR&D-based, is required to analyze the tradeoffs between capitalism and socialism; theneoclassical market efficiency-based approach is inappropriate.
Paich, Mark, and John D. Sterman. 1994. “Boom, Bust, and Failures to Learn inExperimental Markets.” Working paper D-4279, Sloan School of Management,Massachusetts Institute of Technology. ******
Romer, Paul M. “Increasing Returns and Long-run Growth.” Journal of PoliticalEconomy, 94, 1986, pp. 1002-1037.
Sahal, Devendra. Patterns of Technological Innovation. Reading, Mass.: Addison-Wesley, 1981.
Schmookler, Jacob. Invention and Economic Growth. Cambridge, Mass.: HarvardUniversity Press, 1966.