
Industrial Concentration in Assembly
104
Industrial Concentration in Assembly Production: The Case of the Maquiladora Sector in Mexico Ly Jose" Ernlesto Lo~pez C 6rdlova, Submitted to the Department of Urban Studies and Planning in partial fulfillment of the requirements for the degrees of Master in City Planning and Bachelor of Science in Economics at the MASSACHUSETTS INSTITUTE OF TECHNOLOGY May 1992 © Jose Ernesto L6pez C6rdova, MCMXCII. All rights reserved. The author hereby grants to MIT permission to reproduce and to distribute copies of this thesis document in whole or in part. MASSACHUSETTS INSTITUTF OF TFNIn' -r- [SEP 2 4 1992 A uth or ...................... . . 4 ..... ..... ........... ....... .... LIBRAHa::t D.part t of Urban Studies and Planning May 31, 1992 Certified by......... Karen R. Polenske Professor Accepted by . of R ional Political IVI/ Economy and Planning Thesis Supervisor Ralph Gakenheimer Chairman, Departmental Committee for Graduate Students, Department of Urban Studies and Planning 4
Transcript of Industrial Concentration in Assembly

Industrial Concentration in Assembly
Production: The Case of the Maquiladora Sector
in Mexico
Ly
Jose" Ernlesto Lo~pez C 6rdlova,
Submitted to the Department of Urban Studies and Planningin partial fulfillment of the requirements for the degrees of
Master in City Planning
and
Bachelor of Science in Economics
at the
MASSACHUSETTS INSTITUTE OF TECHNOLOGY
May 1992
© Jose Ernesto L6pez C6rdova, MCMXCII. All rights reserved.
The author hereby grants to MIT permission to reproduce andto distribute copies of this thesis document in whole or in part.
MASSACHUSETTS INSTITUTFOF TFNIn' -r-
[SEP 2 4 1992A uth or ...................... . . 4 ..... ..... ........... ....... .... LIBRAHa::t
D.part t of Urban Studies and PlanningMay 31, 1992
Certified by.........Karen R. Polenske
Professor
Accepted by .
of R ional Political
IVI/Economy and Planning
Thesis Supervisor
Ralph GakenheimerChairman, Departmental Committee for Graduate Students,
Department of Urban Studies and Planning
4

Industrial Concentration in Assembly Production: The
Case of the Maquiladora Sector in Mexico
)y
Jose Ernesto L6pez C6rdova
Submitted to the Department of Urban Studies and Planningon May 31, 1992, in partial fulfillment of the
requirements for the degrees ofMaster in City Planning
andBachelor of Science in Economics
Abstract
The number of offshore assembly plants in Mexico-locally called maquiladoraplants-has increased dramatically during the past decade. Today, the inaquiladorasector employs more than 460,000 workers and has become the second mostimportant source of foreign exchange for the country. Several authors, however,have questioned the sector's ability to serve as a springboard for long-term economicdevelopment. Maquiladoras have remained, for the most part, low-wage enclaveoperations that have established few linkages to the communities where they locate,and are, therefore, largely footloose. Moreover, as changes in the dynamics of globalindustry develop, the viability of sustained economic growth based on assemblyproduction seems ever more uncertain. Will automation and new managementtechniques translate into a reconcentration of production in the developedcountries? How are the maquiladoras adapting to those changes? Is it possible tospur economic growth based on assembly production?
In order to contribute in answering the above questions, in this thesis, Iexplore the spatial profile of maquiladora production. In particular, I try to identifyclusters of maquiladora industries where localization Cconomcs exist. Rather thanlocating in a city only because low-wage labor is available, the existence of localsuppliers and/or specialized labor skills becomes an important location factor aswell. Thus, localization economies offset the mnaquiladoras' footloose character.Through the use of econometric and statistical techniques, I conclude that there isindeed evidence of localization economies in some maquiladora industries.Nonetheless, my results are not conclusive, and future researchers must look atdetailed case-study data about the way in which maquiladoras interact with theirhost communities. Thus, I conclude by presenting an agenda, for future research.
Thesis Supervisor: Karen R. PolenskeTitle: Professor of Regional Political Economy and Planning

Acknowledgments
Many people, both in Mexico and the United States, were instrumental in my
completion of this thesis. Their help ranged from tracking down the data I needed,
to intellectual and academic guidance. Perhaps as important, my friends and
relatives were a source of moral support through never-ending days and nights of
study. I am indebted to all of them.
Five individuals in particular deserve special thanks. Prof. Karen R.
Polenske and Dr. Kelly Robinson, members of my thesis committee, and Dr. Leticia
Rivera-Torres, provided a well-balanced mix of academic advise and friendly
encouragement. In Mexico, Luis Manuel Aguirre and Jorge C6rdova, of INEGI,
helped me obtain my data set and provided much insight into the workings of the
maquiladora sector. These five people helped me produce a document that would
have otherwise been less rewarding. Needless to say, I am fully responsible for any
flaws or inaccuracies in my analysis.

Contents
1 Introduction 8
1.1 Background . . . . . . . . . . . . . . . . . . . . . . . . . . . . . . . .
1.2 Research description . . . . . . . . . . . . . . . . . . . . . . . . . . . 13
1.3 Thesis outline . . . . . . . . . . . . . . . . . . . . . . . . . . . . . . . 16
2 Literature review 17
2.1 The dynamics of assembly production . . . . . . . . . . . . . . . . . . 18
2.1.1 The Heckscher-Ohlin model . . . . . . . . . . . . . . . . . . . 19
2.1.2 The product life-cycle model.. . . . . . . . . . . . . . . . . 21
2.1.3 Structural theories . . . . . . . . . . . . . . . . . . . . .... 25
2.2 Maquiladoras and industrial location . . . . . . . . . . . . . . . . . . .. 2
2.2.1 Neoclassical location theory... . . . . . . . . . . . . . . . . 30
2.2.2 Agglomeration economies . . . . . . . . . . . . . . . . . . . . 32
2.3 Research implications . . . . . . . . . . . . . . . . . . . . . . . . . . . .34
3 Geographic profile of maquiladora production 36
3.1 Techniques . . . . . . . . . . . . . . . . . . . . . . . . . . . . . . . . . 36
3.1.1 The location quotient . . . . . . . . . . . . . . . . . . . . . . . 37
3.1.2 Shift-share analysis.. . . . . . . . . . . . . . . . . . . . . . 40
3.1.3 Use and limitations.. . . . . . . . . . . . . . . . . . . . . . 43
3.2 D ata . . . . . . . . . . . . . . . . . . . . . . . . . . . . . . . . . . . . 45
3.3 Geographic profile-results . . . . . . . . . . . . . . . . . . . . . . . . 46
3.3.1 Growth patterns . . . . . . . . . . . . . . . . . . . . . . . . . 46

3.3.2 Industrial concentration . . . . . . . . . . . . . . . . . . . . . 50
3.3.3 Regional specialization . . . . . . . . . . . . . . . . . . . . . . 59
3.4 Sum m ary . . . . . . . . . . . . . . . . . . . . . . . . . . . . . . . . . 61
4 Industrial Concentration and its Determinants 63
4.1 Model ..... .. ... ................................... 63
4.2 R esults . . . . . . . . . . . . . . . . . . . . . . . . . . . . . . . . . . . 68
4.3 Sum m ary . . . . . . . . . . . . . . . . . . . . . . . . . . . . . . . . . 73
5 Conclusions 75
5.1 Sum m ary . . . . . . . . . . . . . . . . . . . . . . . . . . . . . . . . . 75
5.2 Policy implications . . . . . . . . . . . . . . . . . . . . . . . . . . . . 77
5.3 Agenda for further research . . . . . . . . . . . . . . . . . . . . . . . 78
A Maquiladora industries 82
B Geographic profile 83
C Regression results 92
C.1 Regression equations . . . . . . . . . . . . . . . . . . . . . . . . . . . 92
C.1.1 Hypothesis testing criteria. . . . . . . . . . . . . . . . . . . . . 94
C .2 R esults . . . . . . . . . . . . . . . . . . . . . . . . . . . . . . . . . . . 95
Bibliography 98

List of Tables
3.1 Growth in the maquiladora sector (1979-1990) . . . . . . . . . . . . . 47
3.2 Growth in selected maquiladora industries (1981-1989) . . . . . . . . 48
3.3 Shift-share decomposition of naquiladora employment growth (1981-
1989)........ ... .................................... 50
3.4 LQ rank-correlation vis-a-vis city and industry characteristics. .... 53
3.5 Specialization coefficients . . . . . . . . . . . . . . . . . . . . . . . . . 59
4.1 Relevant agglonieration factors in five maquiladora industries . . . . . 73
B.1 Maquiladora sector's regional characteristics (1990 figures) . . . . . . 85
B.2 Location quotients . . . . . . . . . . . . . . . . . . . . . . . . . . . . 89
B.3 Localization coefficients . . . . . . . . . . . . . . . . . . . . . . . . . . 9
C.1 Regression results . . . . . . . . . . . . . . . . . . . . . . . . . . . . . 96

List of Figures
3-1 Growth in maquiladora employment (1979-1990) . . . . . . . . . . . 47
B-1 Cities considered in the study . . . . . . . . . . . . . . . . . . . . . . 84

Chapter 1
Introduction
Offshore assembly production in Mexico-locally called maquiladora
production-has increased in importance at an astonishing rate during the last ten
years.1 Maquiladoras have been a source of employment and foreign currency for
Mexico at a time of financial and economic duress. To(lay, maquiladoras emlhl)1oy
more than 460,000 workers-nearly twice as many as in 1986.
Aside from their positive impact on employment creation, analysts criticize
assembly plants on issues ranging from environmental degradation to their excessive
reliance on unskilled young women workers. In particular, maquiladoras have shown
little integration into the Mexican economy. Maquiladoras have establisled few
backward and forward linkages to domestic industries, i.e., they acquire a very small
percentage of its inputs from Mexican suppliers and do not sell their output in
Mexico; other types of linkages-technology transfer, skill upgrading-have also
been minuscule. As such, researchers view the naquiladoras-and, for the most
part, rightly so-as mere enclave operations that locate in Mexico to take advantage
of low labor costs and physical proximity to the United States.
The unintegrated character of the niaquiladora sector calls into question the
maquiladora's viability as a long-term development strategy. First, the lack of
1Henceforth, the word maquiladora will be used in various ways: naquiladoras al(d maquiadoraplants refer to assembly plants; maquiladora sector refers to all plants in the assembly sector;maquiladora industries are all of the industries comprised by the naquiladora sectors (see AppendixA for a listing of all the maquiladora industries).

linkages to the economies of those communities where maquiladoras locate has
favored a view of assembly production as a largely footloose sector. Secoid, the
conditions that gave rise and dynamism to maquiladora. production may be
changing. Automation and new forms of industrial organization may lea,(d to a
spatial relocation of production from low-cost developing countries to the old
industrial cores of the developed world. Accordingly, the comparative advantage of
maquiladora communities, namely, low wages, may become irrelevant to the needs
of global capital. Given that some communities depend heavily on maquiladora
employment, the footloose nature of the maquiladora sector is worrisome, as those
communities may be prone to mass unemployment and economic distress.
The above factors and events call for a better umnlerstanding of the way in
which mnaquiladoras relate to their host communities and of the overall spatial profile
of assembly production in Mexico. Such understanding is essential for assessing the
potential to spur economic growth based on maquiladora activities and for
minimizing the social costs related to them. In this thesis, we attempt to contribute
to the study of the maquiladora sector by identifying clusters of maquiladoras where
localization economies exist. Rather than locating in a city only because low-wage
labor is available, the existence of local suppliers and/or specialized labor skills
becomes an important location factor as well. As a result, localization economies
are important in offsetting the footloose character of assembly production.
1.1 Background
In 1964, the Mexican government introduced the Border Industrialization Program
(BIP). Following the experience of some Asian nations, the Mexican government
perceived the development of an export-processing zone located in a 20-mile band
along the Northern border as an effective strategy to promote in(ustrialization in
border localities. This strategy guaranteed no interference with import-suibstitution
industrialization, which the government strongly encouraged at tbe tini

(Grunwald,1990/91; Wilson, 1989).2 In addition, the BIP also attempted to prevent
widespread unemployment in border localities after the unilateral termination of the
'Bracero Program' (officially, the Mexican Labor Program) by the U.S. government
in 1964 (Fernandez-Kelly, 1987, 150).'
In addition to U.S. tariff-items 806.30 and 807.004 the BIP fostered an
explosion in assembly production along the Mexican border. In 1,970, there were 120
maquiladoras in the country, all of them located in border municipalities, employing
over 20,000 workers (Martinez, 1978, p. 133); by 1975, the number of maquiladoras
had reached 454 and employed more than 67,000 workers (Fernaindez, 1989, p. 94).
Today, there are approximately 1900 maquiladora plants employing over 460,000
Mexican workers. The maquiladora sector has become, after the oil industry, the
second most important source of foreign exchange for Mexico; in 1988, it, provided
$2.2 billion in foreign exchange earnings to Mexico (Biedermann, 1989, p. 539). The
expansion of maquiladora activities is not only notorious in absolute terms: relative
to other developing countries, in 1985, Mexico accounted for 40% of the value of all
exports to the United States under tariff items 806.30 and 807.00 (Fern6.ndez, 1989,
p. 94). Interestingly, in 1983, the state of Chihuahua's 806.30 and 807.00 exports to
the United States surpassed those of Mexico's major competitors (Singapore,
Taiwan, Malaysia, and Hong Kong)' (Haring, 1985, p. 68).
Thus, over the last 25 years, Mexico has experienced an impressive increase
in export assembly manufacturing. Nevertheless, maquil adoras have been criticized
on several grounds. First, analysts have pointed to the niaquiladoras' minimal
linkages to local firms or to domestic Mexican industry in general. The relative
weight of Mexican non-labor material inputs on value added in Mexico has remained
2Presently, maquiladora activities are allowed anywhere in Mexico.3The Bracero Program allowed Mexican nationals to work in the United States' agricultural sector
since 1942. At the end of the program an approximate 200,000 workers faced abrupt repatriationto Mexico. For a detailed overview of the Border Industrialization Program see Fernndez-Kelly(1983).
4 Tariff-items 806.30 and 807.00 are the legal statutes that allow maquiladora inputs into theUnited States. They allow for the importation of goods assembled from U.1. inputs, with a dutypaid only on value added in the assembling country.
'These figures, however, understate that, while virtually all of Mexico's maquiladora prodluctionis exported to the United States, Asian producers also export to Japan and Europe.
at a very low level. In June 1991, Mexican material in puts represented only 5.5% of
value added, in spite of increases over the last few years. Furthermore, the ratio of
Mexican to total material inputs has remained at around 2.0%. This ratio is even
lower in border localities, where proximity to the United States and low transport
costs bring it down to 1.0%, compared to 2.3% in hinterlan(d locations.
Second, observers have criticized the maquiladoras for their heavy reliance on
women workers. In a study of the maquiladora labor force in Jud(rez,Fernandez-Kelly found that women working in maquiladora plalnts are usually the
main source of income to their families. However, "the involvement of women in
paid industrial labor . . . does not necessarily represent [an] improvement, of their
alternatives as individuals and as members of families." (Ferna.ndez-Kelly, 1983, p.
192) Several studies argue that working women are subject to sexual harassment
and that they are liable to dismissal upon becoming pregnant (The Developnient
GAP, 1991). In addition, according to The Development GAP', a study in Nogales,
Sonora, maquiladora workers' babies were three times inore likely to have a low
birthweight than non-maquiladora workers' babies. (The Development GAP, 1991,
p. 7)
Third, critics have also accused the maquiladoras of environmental
degradation. "Maquiladora plants are notorious for disregarding envi ron ment al
regulations." (The Development GAP, 1991, p. 5) Even though Mexican
environmental laws are stringent, enforcement is poor due to budget limitations.
For instance, Kochan (1989, p. 3) reports that, in the state of Chihuahua, SEDUE T
has at most two inspectors to enforce environmental regulations regarding the
disposal and transportation of maquiladora wastes. Estimates indicate that Jlun.rez
maquiladoras alone generated 5,000 tons of waste a. year; nevertheless, the city "has
no sewage treatment system and no nearby state-of-the-art hazardous waste
disposal facilities."(Kochan, 1989, p. 12) Mexican law requires that maquila(loras
ship their raw chemical wastes back to the United States following production in
'The Development Group For Alternative Policies, Inc.7 Mexico's Secretariat of Urban Development and the Environment.

Mexico (Warner, 1991, p. 244). However, ineffective tracking of materials crossing
the border (in either direction) and lax enforcement in Mexico raise the possibility
that wastes are illegally being disposed of in Mexico. Furthermore, in the case of
solvents, companies have found ways to circumvent the requirement of returning
them to the United States. Solvents can be shipped temporarily to the Unite(
States and sold there to a Mexican recycling firm; the Mexican firm brings the
solvent back into Mexico, where it is recycled at a low cost; the recycled solvent is
then re-exported to the United States, and the resulting wastes become "Mexican
property." Inspectors found that one such recycling facility in Chihuahua lacked
appropriate safety training and equipient and caused solvent spills outside its
facilities. (Kochan, 1989, p. 5).
Finally, researchers have pointed out that maquiladoras place a heavy burden
on the infrastructure of those communities where they locate. Insufficient
infrastructure not only affects the populations of those cities; it has also prove(d
detrimental to the maquiladora industry itself. Financial limitations make it hard
for local governments to enhance infrastructure and to keep pace with rmaquiladora
growth. A study by George (1991) of Junrez and Chihuahua showed that
infrastructure in these cities is rapidly deteriorating. New immigrants find it
increasingly hard to obtain decent housing and basic services. "[T]here are
investment incentives that exempt these businesses from taxes that might fund
programs of housing, water, education or other necessary community projects."
(The Development GAP, 1991, p. 7) While some maquiladora associations have
tried to support infrastructure provision through ad hoc, voluntary contributions to
local governments, propositions for small tax treatment of maquiladoras have
encountered strong opposition (George, 1991, p. 230).
Thus, maquiladoras have created both opportunities and problems to those
communities where they locate. Job creation has been parallele(d by diseconomies of
scale: as the size of the maquiladora industry increases, social, environmental, and
financial costs have arisen. Nonetheless, the conditions that gave rise and dynamismn
to maquiladora production may be changing. Automation and new forms of

industrial organization may lead to a relocation of prodtction from low cost
developing countries to the old industrial cores of the develo)ed world in the near
future. Under this scenario, those communities and regions that rely heavily on
offshore production would be prone to mass inem.ploymeint aid economic dlistress.
These events call for a better understanding of the way in which imaquiladoras
relate to their host communities and to the overall spatial, profile of asseimlbly
production in Mexico. Such an understanding is essential for identifying the
potential to spur economic growth based on maquiladora activities and for
minimizing the social costs related to them.
1.2 Research description
We have argued thus far that an understanding of the spatial profile of asseibly
production is needed. Accordingly, we intend to study the geographical
characteristics of maquiladora production in Mexico. In particular, we try to
identify industrial clusters of maquiladora plants in Mexican cities, that is,
above-average concentrations of maquiladora industries at a parti cular location. At
the same time, we show the importance of industrial concentration and explore the
nature of clusters by looking for external economies of localization.
Hypothesis
In this thesis we test the hypothesis that industrial concentration results from the
existence of localization economics in some industries. Localization economies imply
that any and all firms in an industry benefit as the size of the industry in a,
particular location increases. Such benefits manifest themselves as a decrease in
average costs. Three factors have been identified as causing localization:
1. Firms benefit from a larger pool of workers with tie skills needed ly theindustry.
2. Firms benefit because a larger industry fosters the creation of more efficientand inexpensive suppliers at the local level.

3. Localization favors the flow of information among firms and facilitates a rapid
internalization of technological improvements and a(lda)tation to inark et
changes.
Alternatively, we can explain industrial concentration by the existence of
urbanization economies. Urbanization economies arise due to a greater availability
of diverse and specific services in larger cities. Similar to the effect of localization
economies, urbanization economies bring production costs down in the industry; the
reduction in costs, however, is independent from the size of the industry.
Significance
It is important to identify industrial clusters for three reasons. First, identifying
clusters helps pinpoint areas where external economies of agglomeration exist.
External economies result from economies of localization or urbanization, or a
combination of the two. Localization economies are important because, rather than
locating in a city simply because a large supply of inexpensive labor exists, firms
settle at a location because of the existence of local suppliers and/or specific
labor-skill characteristics. As a result, localization economies offset the footloose
character of maquiladoras.
Second, identifying clusters could also help local governments orient their
efforts to promote local development. Instead of fostering an increase in the overall
level of maquiladora employment or in the total nuiber of firms in their
communities, local governments may find it more efficient to target incentives to
those firms that present a larger development potential-that is, firms in industries
that purchase a larger fraction of domestic inputs and that can transfer technology
and skills to the local economy. Of course, such targeting of incentives reqires a
more careful look at the existing links between domestic and foreign-owned firms, or
at the interaction between the local labor force and maqiiiladoras. Identifying
industrial clusters and localization economies points to industries that could
potentially receive incentives.
Third, knowledge of the existence of industrial concentration helps analysts

structure a more systematic evaluation of the maquiladora's ability, or lack thereof,
to adapt to the technological and organizational changes in production that are
taking place in the global economy. Several authors (Hoffman and Kaplinlsky, 1988;
Sanderson, 1987; Womack 1987) argue that spatial concentration anl increased
cooperation among firms improves the firms' competitive edge. By focusing on
clustered industries, we can undertake an evabiation of interfirm cooperation
arrangements and transactional networks aniig niaquiladoras.
As stated above, in this thesis, we look at the existence of industrial clisters
and test for the presence of localization economies. It is not within the scope of this
thesis, nor is it possible for me at this moment, to provide a deeper understan(ling
of why maquiladoras may concentrate in space, that is, which characteristics in each
industry and city favor localization. To shed light on the factors that may foster an
industry's concentration in a given locality, future analysts would need detailed case
studies and enhanced data. We conclude, therefore, by presenting an agenda for
further research.
Methodology
We look at the five largest industries in the maquiladora sector, namely: (i) cctric
and electronic components; (ii) electric and electronic goods; (iii) franspor0taion
equipment; (iv) textiles; and (v) furniture assembly. We also analyze other
industries in some cases, but, since they are not well represented in all cities, we
were unable to undertake significant statistical and econometric analysis. In
addition, we use data on the maquiladora sector for 17 Mexican metropolitan areas.
The cities analyzed are the largest maquiladora production centers in the country
and account for 84% of all maquiladora employment and 63% of all planis. We
obtained the data under a special agreement with the Instiluto Nacional de
Estadi'stica, Geograf'a e Informdtica (INEGI) of Mexico. The agreement restricted
the use of the data for the purposes of this thesis, requiring that no information be
made available that would help identify any individual firi.
We applied several techniques to study the spatial characteristics of assembly

production and to identify industrial concentration; they include (i) the location
quotient, (ii) the specialization coefficient, (iii) the localization coefficient, and (iv)
shift-share analysis. In order to gather evidence for or against localization or
urbanization economies, we computed rank-correlation coeflicien ts betwcein
industrial concentration and city and industry characteristics. We then compared
rank-correlation results to results from a structural econometric mio(lel.
Findings
There is some evidence for localization economies in three industries: (textiles,
transportation equipment, and electric and electronic conponents). In contrast,
localization factors were negligible in the furniture industry and the data, were
inconclusive with regard to electric and ccronics goods im api iladoras.
Nevertheless, our results are not conclusive. Therefore, future researchers must
confront the results of this thesis against detailed case-study information in order to
determine what agglomeration factors, if any, might be at play.
1.3 Thesis outline
The thesis is organized as follows. In Chapter 2, we review the literature on offshore
assembly production and then proceed to sketch a theoretical framework for
analysis. In Chapter 3, we present the techniques used to analyze the spatial profile
of assembly production; we also present figures on the extent to which concentration
occurs and relates concentration to characteristics of the locality aid of the industry.
After that, we apply an econometric model to distingiiishi betweeni localization and
urbanization economies and the model's results (Chapter 4). Finally, in Chapter 5,
we present the thesis conclusions and set forth an agenda for future research.

Chapter 2
Literature review
An understanding of the origins, development, and geographic characteristics of the
maquiladora sector in Mexico, and of offshore assembly pro(uctioni in general,
requires an inquiry into the dynamics of the global industrial system an(l their
spatial manifestation. Nonetheless, because of the international character of
assembly production, analyst have paid little attention to the study of the
intra-national spatial impact of assembly production. In fact, the location (lecision
of assembly plants takes into account both international and intra-national aspects
and consists of several stages. First, a corporation must, decide whether to remain
producing in its home (industrialized) country or to ship production abroad; that is,
it weighs the viability of offshore assembly production vis-a-is productioi at home.
Second, if offshore assembly is selected, the corporation or parent firm umst choose
a country with appropriate conditions for assembly production-low wages,
macro-economic and political stability, a, passive or controllable labor force, etc.
Third, once the corporation has chosen a country, it must decide where in that
country assembly production will take place.
In the current chapter, we present a number of theories that canl be used to
explain the locational choices of assembly production. The analysis of such ilchoices
necessarily involves an examination of the origins of offshore production; hence, we
present an outline of the main theoretical currents attempting to explain offshore
assembly. Yet, in keeping with the general topic of the thesis, we focus on the

experience of the maquiladora sector in Mexico and analyze some theories that may
explain locational patterns of the maquiladora within Mexico. In particular, we look
at the rationale for and significance of industrial concentration.
2.1 The dynamics of assembly production
During the last three decades there has been a change in the type of prodlcts
exported from the developing countries to the industrialized world. Whereas, in the
past, developing nations and former colonies served as a source of raw materials to
the developed countries, at present, the export of manufacturing goods has become
increasingly important. Starting in the 1960s, a number of transnational
corporations moved to the developing world in search of inexpensive labor to
assemble simple manufactures for export to high-wage countries. This upsurge in
export assembly manufacturing was not restricted to the now so-called Asian
tigers-Taiwan, Korea, Hong Kong, and Singapore-which have since (leveloped at
a rapid pace. It was also present, with not so auspicious results, in other countries
as well (e.g., the Dominican Republic, Colombia, Morocco, Indonesia) (Frobel et al.,
1980; Wilson, 1989).
The nature of export assembly production has been a subject of ituch
academic debate since the 1960s. The debate has focused on the main determining
factors of assembly production. On the one hand, neoclassical economists have
emphasized production factor-endowment differentials as the most important
justification for offshore assembly production. Life-cycle theorists have added a
dynamic dimension to the neoclassical account by looking at how prodluction and
factor requirements vary over time. On the other hand, other authors have
explained assembly manufacturing in terms of the changes in the structure of the
global capitalist system; for the sake of discussion in the thesis, we group the
theories of these authors under the label of structural thcorics (Storper, 1981).

2.1.1 The Heckscher-Ohlin model
Early this century, Swedish economists Eli Heckscher and Bertil Ohlin proposed a.
model to explain international trade patterns. The model, which came to be known
as the Heckscher-Ohlin (H-0) model of international trade, has also been used to
explain differences in inter-regional industrial production. The leckscher-Ohlin
model assumes that relative factor endowments determine where indistri al
production takes place and, consequently, where firms and industries locate; for this
reason, the H-O model is also known as the factor proportions model. Accordingly, a,
country or region will produce and export products that, require the intenisive use of
the inputs in which the country (region) is richly endowed relative to other regions.
For example, a capital-abundant country will export capital-intensive coimmo(lities
(e.g., cars) and import labor-intensive goods (e.g., clothes) from other couintries.
Furthermore, the Heckscher-Ohlin model assumes that factor-cost differen tials
become smaller and eventually disappear as factors of production move to regions
where the returns to their use are higher; the same result holds even if factors are
immobile but trade is permitted.-
The H-0 model has been subject to much scrutiny. Among the strongest
challenges to its validity is the so-called Leontief Paradox. Wassily Leon tief (1953;
1956) examined the factor content of U.S. exports. To his surprise, he found that
the United States, considered to be a capital-abundant country, seemed to s)ecialize
in the export of labor-intensive products. Such findings contradicted the main
proposition of the H-O model, namely, that the capital-intensive American economy
would specialize in exporting capital-intensive goods. The paradox was explained by
Leontief as the result of the higher productivity of American workers (in the
post-World War II international economy) than worker productivity elsewhere.
Thus, a higher productivity makes labor the relatively abundant factor in the United
States. Other authors have argued that American exports are "iaterial capital plus
human capital" intensive (Moroney and Walker, 1966, p. 575). Thus, a. imiore skillful
'The equalization of factor prices due to trade was first suggested by Paul Sainimelson; thus, theH-O model is sometimes known as the Heckscher-Ohlin-Samuelson model.
American labor force exports products that embody a high capital conteit. 2 In
addition to international tests of the H-0 model, other authors have tested the
application of the model to interregional trade. For instance, Moroney and Walker
(1966, p. 584) found that "the H-0 hypothesis seems to have some value in
predicting regional patterns of industrial- development," but as factors niove to those
regions where their price is higher, initial endowment conditions lose relevance.
The Heckscher-Ohlin model rests on the assumption that the production
function for each commodity is the same across countries. In other words, the
production of any good requires the same proportion of input usage in any country.
However, it is both theoretically and empirically possible to produce the same good
using different proportions of inputs. Whereas in one country a commodity may be
produced capital-intensively, in another country the same commodity may be
produced using a higher proportion of labor; this is known as factor- in/ ensiI!y
reversal. Thus, the possibility of factor-intensity reversal undermines the H-0
description of trade patterns between countries or regions.
How does the H-0 model relate to niaquiladora production? Maquiladoras
are typically labor intensive. Thus, it is tempting to explain their origins using the
H-O model. Weintraub (1990, p. 1150), for example, has argued that. the H-0
model is the most appropriate theoretical model to analyze maquiladora production.
Nevertheless, the H-0 model is unable to explain changes in maquiladora
production across time. Although traditional maquiladoras-that is, those
maquiladoras with a high use of labor and low use of capital-may fit the H-0
model account, some new developments in the naquiladora sector indicate that
maquiladoras are increasing their use of capital-intensive, capital-intensive
technologies (Brown and Dominguez, 1989; Gonzalez-Arechiga and RamIirez, 1990,
p. 24; Wilson, 1991). Furthermore, the H-0 model does not explain why
maquiladora production was chosen over automated production in the United States
or Japan; that is, it ignores the possibility of factor-intensity reversal.
2Leontief's results have been further tested in other countries with mixed results. See Moroneyand Walker (1966, pp. 574-576) for a brief review of international tests of the H-0 model .

As an alternative to the H-O model, another model, the product-life cycle
model, has been proposed. The product-life cycle mo(lel attempts to explain some
of the shortcomings of the H-O model, in particular, the Leontief paradox. In
addition, the life-cycle model offers a richer description of assembly produlction than
the H-O model because it considers dynamic changes in the production process.
2.1.2 The product life-cycle model
The product life-cycle literature emerged from the works of Kuznets and Burns
(Storper, 1983, 1985; Markusen, 1987; Norton and Rees, 1979). Burns and Kuznets
observed that the "output of industries follows a pattern of intro(liction, rapid
expansion, maturity, and eventual decline." (Storper, 1985, p. 268) Burns and
Kuznets' ideas were later extended by other authors, most notably Vernon, to the
study of international and interregional trade, and to a description of industrial
locational patterns.
Storper and Walker (1989, pp. 119-122) describe two versions of the product
cycle: the product maturation and market expansion variant, and the production
process maturation variant.3 In the product maturation version, firms introduce
products as luxury or specialty items and are purchased by consumers with an
inelastic demand. As the market for the new product develops, it becomes a, mass
consumption commodity, until new substitutes are introduced and foreign
competition increases, thus bringing about an eventual decline in the pro(uction of
the good.4 The production-process-maturation variant analysts argue that, at first,
a commodity is produced in small batches using skilled labor in an artisanal fashion
(Storper, 1985, p. 268). The industry eventually standardizes the production
process by introducing mechanized technology and deskilling the labor
requirements, and producing large amounts of the good.
aMarkusen (1987) has presented an alternative version, the projit cycle model. Her model presentsimportant differences; nevertheless, its relationship to offshore assembly is essentially the same.Markusen's ideas are incorporated to the description presented here wheniever deelled necessary.
4Wells (1972) applies the logic of the product maturation version of the produlict cycle to explaininternational trade patterns.

Parallel to these stages in the production process, the product life-cycle
theorists consider changes in trade patterns across countries and in the locational
characteristics of industrial firms. Products are at first produced in developed
countries and regions where consumers are able to afford the high prices of
specialized, newly-developed products. As the produlction process standardizes and
special-purpose machinery is introduced-thus decreasing the need for skilled
labor-production can be shifted to low-wage regions. In. this account, therefore, a
correlation between geographic dispersion and mechanization exists; conseq(uently,
exports from high-wage countries will be produced using skilled-labor intensively,
and exports from low-wage regions will use more capital. Explained in this fashion,
the product cycle accounts for Leontief's paradox.' At the same time, there is a
need for market expansion to absorb the extra output generated as prodiction
standardizes. Moreover, given that many countries protect their markets from
foreign exports, production is also shifted to other countries in order to gain access
to their markets. As a result there is a process of industrial dispersion from
developed, high-wage countries (regions) to countries (regions) where wages are
lower.
The notion of industrial dispersal that stens from the product life-cycle
model has made the model quite attractive in explaining increased assembly
production in the developing countries. For example, Norton and Rees state:
With the product cycle in mind, one could view LDC's [less-developedcountries] as benefiting from a characteristic advan tage in standard ize(lmanufacturing activities. Just as with the American periphery, the lowlabor costs and favorable "business climates" of such LDC's a~s SouthKorea and Taiwan attract the branch plants of multinational firms-whose hallmark is the capacity to shift, production operations quickly(Norton and Rees, 1979, p. 147).
Furthermore, Grunwald and Flanun base their analysis of offtshore asseibly
5See section 2.1.1. The relationship between the process of in(ustrial dispersion that stems fromthe product life-cycle and the Leontief paradox is depicted in more detail by Wells ( 1972). Wellsexpands on the theories of Vernon. "For Vernon new products are introduced in the high-wagedregions, and as they are standardized, they are located in the low-waged regions." (Storper, 1985,p. 274)

production on the product cycle:
One way to regard the phenomenon of production abroad is a's a. systeiiof production geared to retaining comipetitiveness for firms in developedcountries after a product has entered the down side of the product cycle.That is, the firms that developed the product continue to produceeconomically by eventually relocating or subcontractinig assemblyproduction facilities in low-wage developing countries. (Grunwald andFlamm, 1985, p. 7)
As argued by Wilson (1989, p. 1), analysts have explained the recent
economic "success" of some Asian NICs' (South Korea, Taiwan, Hong Kong, and
Singapore) using some of the premises of the life cycle approach. Following the
life-cycle rationale, those analysts claim that industry dlispersal and offshore
assembly helped these countries industrialize. The Asian NIC's are now capable of
designing and innovating their own products. Furthermore, companies in these
countries have started to transfer assembly production to other regions inl Asia, and
the Caribbean (Grunwald, p. 1990/91) .7 The experiences of the Asian tigers
contrast with the experience of Mexico where, after almost three decades of the
Border Industrialization Program, the niaquiladora sector still plays a narginal role
in the country's industrial structure (Gonzalez-Arechiga and R.amirez, 1990;
Grunwald, 1990/91; Wilson, 1989). However, before applying the life cycle tenets to
the analysis the Mexican and Latin American industrialization experiences and
comparing them to the experience of the Asian countries, we must consider their
particular histories. After comparing the histories of the two groups of countries,
Wilson (1989, p. 2) concludes that "there is no natural, inexorable )a.th to
advanced industrialization based on the assembly industry. Rather, the reason why
some countries have been able to develop on the basis of assembly industry aud
some have not has to do with public policy, social relations, and the historical
context." Hence, the product life-cycle model may account for the movement of
firms to low-wage regions, but it does not explain why nor argues that those firms
will serve as a basis for industrialization.
'Newly-industrializing countries.7According to Grunwald (1990/91), Korean firms have now set up ma(uilarloras in Mexico.

Moreover, Storper and Walker (1989) argue that the upsurge in assembly
production cannot be fully explained by the life-cycle model. According to the
life-cycle account, only those industries in the post-maturation stage would1 move to
the developing countries. Nevertheless, the growth of personal computer (Asia) and
semiconductor (Asia and Mexico) assembly contradicts the life-cycle predictions.
Cheap labor unquestionably attracted [semiconductor] companies toMexico, Southeast Asia or Morocco, but here was a. fast growing sectorthat ought not to have felt pinched by factor costs [...] Neither relativefactor costs nor profit cycles can alone explain this peculiar form ofgrowth periphery. Nor can they account for the subsequent evolution ofcertain Southeast Asian semiconductor peripheries into more full-blowncenters of design, fabrication and assembly for expanding regionalmarkets. (Storper and Walker, 1989, p. 89-90)
On a more theoretical level, Storper (1985) criticizes the life-cycle iodel for
its essentialist character. In other words, the life-cycle model presents a, theory of
industrial behavior based on industry characteristics at the present time. That
theory is then applied to explain future developments in the world's industry. As
Storper shows, the product-life-cycle theorists assume thlat "real techn11ologies follow
one basic path, based on increasing standardization, mechanization, and integration,
which generate scale economies, reduce transportation costs, and lead to spatial
decentralization." (Storper, 1985, p. 269) For example, Markusen (1987, pp. 22-23)
sees mass production as the culminating stage of the cycle of production. Mass
production, however, can be seen as one among several technological options-more
ostensibly, flexible specialization-during the early twentieth century (Piore and
Sabel, 1984; Storper, 1985, p. 272). Hence, industrial forms and technological
outcomes are rather diverse and indeterminate; they are historically contingent. ard
do not result from empirically constant characteristics of in(istry, as pro(det cycle
theorist claim (Storper, 1985, p. 270)8: "Machines are as much a mirror as the
motor of social development." (Sabel and Piore, 1984, p. 5).
'The same deterministic path for technology development is present in traditional Marxist theory,although some neo-Marxists thinkers diverge from this view. See, for instance, Margliin (1974).
'Historical contingency as a determinant of technological "breakthroughs" is also emphasized

2.1.3 Structural theories
Both the Heckscher-Ohlin and the life-cycle models presenlt accounts of indllstrial
location that can explain the growth of assembly production in the developing
countries. However, both models appear to be ahistorical and lack any analysis of
the social environment in which production takes place. In contrast, structiral
analysts view location "as a consequence of the historical and structural conditions
governing the organization of industrial capital." (Storper ,1981,J). 18) Structural
theorists consider the economy as a set of social relations of production and thus
look at the political economy of industrial location.
In the structural account, labor plays a, central role in explaining industrial
location. Neoclassical economists perceive labor to be a, commodity that does not
differ much from other production factors; that is, its nature is only dependent on
the wage level-its price-and on the productivity of labor at a specific
location-its quality. In contrast, structural analysts also consider the actnal ability
of capital to exert control over the labor force and "the fabric of distinctive, lasting
local 'communities' and 'cultures' woven into the landscape of labor." (Storper,
1983, p. 7) As a result, the structuralist view of labor is not that of a 'passive'
factor of production which can be produced just like any other commodity (Storper,
1981, p. 28); instead, it acquires a spatially differentiated character to which
industry responds. As industry responds to the uneven distribultion of labor (and
other factors) in space, it creates "typical areal or regional roles, or a 'spatial
division of labor'." (Storper, 1981, p. 29)
Each industrial process exhibits a specific demand for labor power. However,
fluctuations in the macroeconomic environment lead to changes in the
organizational structure of production and on the nature of the labor _processes
involved. In this view, technical innovations involve both changes in investmjient. on
fixed capital and a reorganization of the labor process. As the (lemuand for labor
by new economic theories that study the importance and ubiquitousness of increasing returns inmanufacturing processes. Nevertheless, social relations are absent in this literature. See Arthur(1990) for an introduction to the subject.

with a specific set of characteristics is altered, the spatial pattern of investment
changes. Consequently, the technological and locational decisions of the firm -and
their ensuing implications on spatial organization-are mediated by changes in the
nature of industrial capital and its relationship to labor (Schoenberger, 1987, ).
200; Storper, 1981, p. 27).
Analysts have applied the logic of structural analysis to the study of offshore
assembly in several ways. Many of the existing variants coincide inl indicatling that
there is a tendency toward an increasing dispersal of production to the Third World.
First, as Clark et al. (1986) argue, the heightened international competitionl of
today's economy is met through increased standardization of the prodluction
process, automation, and the introduction of systems such as conputer-aided desigTn
and manufacturing. These changes decrease both the skill requirements an(l the
number of workers participating in the production process, except for a small
number of technicians which manage the new technologies (Clark et al., 1986, pp.
23-24). Spatially, the most labor-intensive processes are transfered to areas where
low-wage unskilled and semi-skilled labor are present an( where there is no previous
history of labor militancy (Clark et al., 1986, p. 26).
Second, and in a similar fashion, Frobel et al. (1980) argue that a finer
definition of production tasks, along with improved conuunication and
transportation technologies and increased global competition, have pushed
corporations in the industrialized countries into a cost rationalization strategy;
hence, Third World countries have experienced rapid industrialization-especially in
'export processing zones'-as 'global market factories' exploit low wages and
minimize production costs (Frobel et al., 1980). These authors refer to such events
as the new international division of labor.
Third, other authors emphasize the conflictual relationshilp betweetn capital
and labor in the developed countries. For instance, Bliestonie all Harrison (1982)
see relocation from the American manufacturing belt to other locations in the Third
World as a response of manufacturers to increased labor union deilands. Similarly,
for Sassen-Koob (1980), exporting production )lants to low-wage locations helps

corporations in dealing with labor shortages that threaten the profit level of firms in
industrialized countries." Although Sassen's argumenti may seem similar to tlie
Heckscher-Ohlin account, the emphasis here is on the capital-labor relations, and
not merely on cost considerations: Labor shortages are not only the result of
absolute decreases in the labor force; they also result from labor activisi and
capital-labor conflict.
More recently, however, some authors have argued tha-t the trend toward
industrial dispersal is reversing and that, in the near future, we will witness a,
reconcentration of production to the core industrialized countries. The views of
these authors can be framed by looking at an alternative explanation of offshore
production stemming from the French Regulation School. lRegulation theory looks
at the institutional arrangements-or modC of regudaifon-which guarantee the
survival and continuation of a given regime of accumidation. According to Lipietz
(1986, p. 19), a regime of accumulation "describes the stabilization over a long
period of the allocation of the product between consunption and accuulation."
The regime of accumulation which prevailed in the developed world through the
post-war era and until the early 1970s has come to be known as Fordism.
Fordism was characterized by tripartite neo-corporatlist arrangem ents that
indexed wages to productivity gains in order to sustain mass consumption. The
Fordist regime came into crisis in the early 19 70s, however, as a result of (i) market
volatility and (ii) the exhaustion of the structural limits of the capitalist system.
Market volatility originated from the social unrest of the 1960s, from supply-side
shocks on the macroeconomy in the 19 70s, and from the abandotment of the fixed
exchange rate system in 1971. Market volatility translated into a crisis of supply, at
first, and later into a crisis of deniand. Furthermore, as the institutions Chat
regulated the post-World War II economy were incapable of "accomlo(dat[iig] the
spread of mass-production technology," (Piore and Sabel, 1984, p. 166) the
capitalist production system reached its own structural limits.
0According to Sassen-Koob (1980), another way to imeet labor shortages is hroigh labor"imports"-e.g., the gastarbeiter in Gernany or the nudocnmented Mexican farm worker in theUnited States.

The first responses to global instability hinged upon the existing regulatory
institutions (Sabel, 1989, p. 20). In addition, firms reacted to a decrease in profits
by extending the logic of mass production to the Third World. In the midst of an
unstable environment, firms attempted to compete through cost-cuts; "[p]rodu ction
was reorganised to allow decentralisation of labour-intensive processes to low-wage
areas" (Sabel, 1989, p. 20). According to Sabel (1989, p. 21), these old institutions
and arrangements appeared incapable of reinitiating growth. A more effective
response to instability came through the revitalization of the region as a coherent
unit of production, to the re-emergence of flexible techniques similar to those of the
nineteenth-century craft production, and to the adoption of general-purpose
machinery that could be redeployed and reconfigured swiftly to adjust to changes in
the market.
The effectiveness of the region is based on the assumption that, in the context
of an unstable environment, cooperation between firms, workers, and government at
the local level increases the competitive advantage of regional economies. Firms
respond to uncertainty in the market by replacing vertical integration with a finer
division of labor among firms; cooperation between firms helps spread risk among
all participants and, in consequence, there are economies of scale internal to the
industry but external to any single firm. Spatially, enhanced cooperation between
firms leads to a convergence of production in specialized industrial districts.1 '
Some authors argue that the appearance of flexible production will reduce
the rate at which offshore assembly has been growing (luring the last two decades;
further, flexible production may translate into a reconcentration of production from
the developing countries to the core industrialized countries (Hoffman and
Kaplinsky, 1988; Sanderson, 1987; Womack, 1987). As automation an( the use of
flexible technologies increases, unskilled labor may become a dispensable factor.
Moreover, as the need to cluster together spatially increases, corporations may find
HBecattini (1990) provides an extensive definition of industrial district. Nevertheless, his defini-tion may only be applicable to a specific variety of industrial district that exists in Italy and otherWestern European countries. Different varieties of industrial districts exist; see lowar(d (1990) foran idealized typology of industrial districts.

it to their advantage to relocate their pro(luction facilities back to their home
countries. The plausibility of such a scenario is a, subject of current debate. For
example, Wilson (1990a) has found that some ma(iladoras are alopting flexible
technologies and organizational techniques." Also, Sanderson et al. (1987) and
Schoenberger (1989) have allowed for the possibility that some degree of automation
and flexible technologies may be adopted in the developing countries. In either case,
the result is to offset the trend toward reconcentration.
Such occurrences in the global nature of production point to the need for a,
better understanding of the organizational and locational patterns of assemlbly
production in the developing countries; such an understanding is essential to assess
the ability or inability of those countries to offset any potentially dlamaging effects
and to guarantee the welfare of their populations. In this thesis we assume that
identifying industrial clusters is a good starting point in analyzing the prospects of
maquiladora production given the changes in the global organization of production.
In this light, in the next section we attempt to dlefine a, set of parameters to study
the locational characteristics of assembly plants in Mexico an(l to identify clusters of
firms and the existence of agglomeration economies.
2.2 Maquiladoras and industrial location
Thus far, we have looked at the factors that explain offshore assembly production inl
the developing countries; we have said nothing about the loca-tional )att.erns of
assembly plants at the intra-national level. Nevertheless, the resurgence of the local
and regional economy as the locus of industrial product ion in the developed
countries calls for an inquiry into the way in which global capital relates to the local
economies of the developing world. If assembly plants are able to replicate somtie of
the same organizational features being adopted at the local level in the
industrialized countries, the host countries may be able to prevent a, reconcentration
"See also Brown and Dominguez (1989) for a study on the adoption of new technologies in themaquiladora sector.

of production in the developed countries; if, on the other hand, assembly plant s
remain largely footloose and with no other locational pull-factor but low wages,
developing countries-and regions within those countries-will be susceptible to the
vagaries of global industrial production. Hence, an understanding of the spatial
configuration of offshore manufacturing within the developing countries is essential.
Earlier, we argued that the locational decision Process for a mnaquiladora
involves several stages. Now we discuss some of the locational deterininants that
maquiladoras may face once they settle in Mexico. In particular, the theoretical
rationale for spatial concentration is presented. in this section. The (iscussion
presented here revolves mainly around location theory as presente(d by neoclassical
economists, despite the fact that other non-economistic, institutional and political,
factors may influence a firms location decision.
2.2.1 Neoclassical location theory
Neoclassical economists view the economic system as the sum of discrete rational
economic agents-consumers and firms-interacting in the market as they exc hange
goods and services. Rationality in the neoclassical account implies that agents
maximize the net benefits they obtain from market transactions: consumers
maximize a subjective utility function subject to income constraints, while firms
maximize profits subject to a given production function. An efficient allocation of
resources is reached as agents rationally respond to couno(ity-price signals so as to
maximize utility and profits.
Neoclassical economists extend their general assumiptions to the analysis of
the location decision of firns. In the neoclassical location account, firms choose to
locate in places where profits are maximized. A firm's profits become a f'unction of
the characteristics of a particular locality. The profit level will be deternline(l by the
production and transportation technologies available at a location, as well as by the
geography of demand and resources. Production technology will (etermilne the
relative amount of each input used in the production of a given good anl the
substitutability among inputs. It will also determine whether the weight the major

component of transport costs-of the final good is greater (weight-gaining
technology) or smaller (weight-losing technology) than the aggregate weight of the
inputs used". In addition, the types of transportation modes available at each
location will have an impact on the price of inputs and final goods. Thus, both
revenue and costs will vary from location to location: total revenues will be a.
function of the demand for a, firm's output, which is in turn determined by the
spatial distribution of consumers relative to the location, and by the delivered price
of its products-that is, price plus transport costs; total costs will be a, function of
the price and quality of inputs at the location.
Firms can be classified according to the relative importance of different
variables in their revenue and cost functions (Alonso, 1975). Thus, a, firm is said to
be transport-oriented when transportation costs are relatively high; if such is the
case, firms would attempt to minimize transportation costs by locating i) places
with inexpensive access to transportation networks such as highways or waterways.
If transportation costs are not very high, other factors may be more important in
pulling firms to a particular location. Power-oriented firms are those that consume
large amounts of electricity or other forms of energy and will locate in regions and
localities where energy sources are abundant and inexpensive. Firms are said to be
market-oriented when they locate near centers of final demand; weight- gaining
industries are typically market-oriented since transport costs are minimized at the
point of final consumption. On the other hand, weight-losing firms-e.g., steel
mills-will locate near input sources, and so they are said to be material-oriented.
Finally, industries that require large numbers of workers, or workers with a specific
characteristic, are called labor-oriented. For example, maquiladoras are (low-wage)
labor-oriented, because they require a vast supply of low-wage labor.
When no particular factor is of importance in the locational decision of an
"It may be hard at first to conceive how a given technological process might be weight-gaining.A gain in weight occurs, for example, when a ubiquitous public good (e.g., water) is used in theproduction of a commodity. Since the public good is assumed to be present at all locations and since,by definition, it is free, the weight of the resulting commodity may exceed the aggregatb weight of allother inputs into the production process. The soft-drink industry is weight-gaining: it is cheaper totransport sugar-the raw material into beverage production-than to transport the final product.

industry, or when the main input is ubiquitously found, the industry is considered
to be footloose. As defined by Alonso (1975, p. 33), footlooseness inplies that, as
technological progress decreases transportation cost and input requirements,
industries and firms will tend to disperse. Alonso (1975, p. 33) assumes that
footlooseness is largely a result of low transport-costs, but that other factors may
still be of importance in influencing a firm's location decision. One such location
factor that, according to Alonso, offsets footlooseness is the need for firms to
maintain contacts among each other to adapt to market trends more rapidly, tiiis
favoring concentration. The existence of concentrations of firms and indulistries
implies that external agglomeration economies exist. As noted )y Alonso (1975, p.
35), in a rather contradictory manner, external economies of agglomeration posit
some problems for neoclassical location theory, at least in its conventional forim.
2.2.2 Agglomeration economies
The existence of agglomerations of industries has attracted the attention of
neoclassical economists since the days of Alfred Marshall (c. 1890). Marshall-one
of the founders of modern microeconomic theory-was astonished by the existence
of several industrial districts in nineteenth-century England (Harrison, 1990;
Krugman, 1991a; Sabel, 1989). It is surprising then that a. rigorous analysis of
agglomerations was absent from neoclassical economic theory until recently.
According to Krugman (1991a), the absence of studies on industrial agglomeration
was explained by the lack of appropriate mathematical tools. Neoclassical
economics, based on the assumption of constant returns to scale and perfect,
competition, was unable to handle the widespread existence of external economies of
industry scale that arise from concentration; nor was it able to deal with a. world of
increasing returns and positive feedbacks." Unable to adopt the mathemat.ical
rigorousness that neoclassical economics demands, neoclassical location theory
became relegated vis-a-vis other fields in economics. Recently, however, the
"For a discussion of the importance of external economies and increasing refurns in economictheory see Arthur (1990).

incorporation of the analysis of increasing returns into such fields as international
trade has renewed the interest of economists in econonic geography."
Despite its lack of a rigorous mathematical specification, Marshall and other
economists identified several forces that drive agglomeration. According to Isard
(1975, p. 113-117), those forces can be classified in three groups: internal conies
of scale, urbanization economies, and localization economies. First, inCrnal
economies of scale of a firm will decrease average costs as the size of the firm
increases. Economies of scale occur whenever the prodiction process involves large
fixed costs such that average costs fall with increased production. A firm would find
it profitable to locate wherever it could operate at a large scale. Thus, large
concentrations of industries, population, and other activities will foster a
concentration of firms that present economies of scale.
Second, urbanization economies are associated with a large popul ation and
the high level of overall economic activity present in urban centers. Urbanization
economies benefit and "are available to all firms in all industries" (Isard, 1975, p.
116). Furthermore, they result merely from the size of the city and not (ie to its
industrial composition (Henderson, 1986, p. 48). Firms benefit from an enhanced
availability of diverse and specialized goods and services, and from a. larger labor
pool. In addition, public services may be supplied at a lower cost and with a better
quality.
Third, and last, localization economies refer to economies that accrue to all
firms in an industry at a particular location as the output of the industry increases.
"These economies reflect (i) economies of intraindustry specialization where greater
industry size permits greater specialization among firms in their detaile(l functions,(ii) labor market economies where industry size reduces search costs for firms
looking for workers with specific training relevant to that industry, (iii) scale for
'communication' among firms affecting the speed of, say, adoption of new
"The application of increasing returns and external econonijes to trade theory was 1)ionleered byHelpman and Krugman (1985). Recently, Krugman has extended that analysis to the study of theimportance of space in economic life (Krugian, 1991a, 19911)).

innovations 16, and (iv) scale in providing (uniiea.sured ) public interle(liate inputs
tailored to the technical needs of a particular industry." (Henderson, 1986, p. 47-48)
Alonso, in his account of external economies of aggloineralion, implicitly
assumes that spatial concentration is a deterrence of the enhanced footlooseness of
firms as a result of transport cost abatement. In fact, a fall in transport cost will be
a stimulus, not a hindrance, to localization (Krugman, 1991a). Furthermore,
localization does not depend on an asymmetry of transportation costs between
intermediate and final goods. "[L]ocalization will tend to occur unless the costs of
transporting intermediates are particularly low' compared with those of traisporting
final goods. And a general reduction of transport costs, of both.1 intermediate and
final goods, will ordinarily tend to encourage localization rather than discourage it."
(1991a, p. 50) The implication for location theory is that, rather than witnessing a
dispersion of production as a result of advances in transportation technology, a
renewed drive toward spatial concentration may indeed occur.
2.3 Research implications
The future of maquiladora production in Mexico-and of offshore assemlbly
elsewhere-is tied to changes in the internaational econoimy. Hence, an
understanding of changes in the global structure of industrial prodliction is essential
in assessing the future of those countries and conmunities where assembly plants
predominate. Nevertheless, parallel to such an understanding, it is also essential to
study the structure and characteristics of assembly production at. the local level,
that is, to study how assembly plants and maquiladoras relate to the local economy
of the cities where they locate.
Currently, the emphasis on flexible forms of production that rely on
automated, general-purpose machinery and on a closer cooperation between firms
has led some authors to question the viability of assemibly pro(luction in the
developing world (Hoffiman and Kaplinsky, 1988; Sanderson, 1987; Sanderson et al.,
1'Krugiman (1991a: 52) refers to this as "technological spillovers".

1987; Womack, 1987). Spatially, the implications of those changes are a, clustering of
firms at the region and city level and the formation of industrial districts in the
developed countries. If indeed the emergence of flexible production can be seen as a,
new paradigm of industrial development, its implications for the Third World
should receive deep academic and policy consideration.
If the maquiladora sector remains a labor-intensive produlctionl strategy,
where the use of advanced, flexible technology is rare, and where cooperation among
firms is absent, a relocation back to the industrialized core may indeed occur.
However, if maquiladoras are able to introduce new technologies and to cooperate
with other maquiladoras and with the local domestic industries of the communities
where they locate, relocation will be less likely to occur. Furthermore, if
maquiladoras establish forward and backward linkages with local firms, and if other
types of linkages exist-e.g., labor up-skilling, technology transfer-relocation will
not only be impeded, but maquiladora production may turn into a catalyst for local
economic growth.
Identifying industrial clusters of maquiladoras where external econilomies of
localization exist provides evidence on which industries have been able to create
linkages to the host community other than the use of cheap labor. In other words,
the existence of localization economies implies that low wages are not the sole
maquiladora locational determinant anymore, but that the availability of local
suppliers and of specialized labor skills are important locational pull factors as well.
As a result, the maquiladoras' footloose character is offset and the possibility that
they return to their host countries is greatly dininished. Therefore, in the following
chapters, we try to identify industrial clusters of maquiladoras an(l test for the
presence of localization economies.

Chapter 3
Geographic profile of maquiladora
production
In this chapter we analyze the spatial profile of assembly production, reviewing data
for 17 urban areas in Northern Mexico that account for a large proportion of total
maquiladora activity in the country. We apply different techniques to study the
extent to which industrial concentration in the maquiladora sector occurs and
compare this concentration to industry and city characteristics.
3.1 Techniques
In this section, we present several techniques for identifying clusters of firms in the
maquiladora sector: (i) the location quotient and related coefficients, (ii) the
specialization and localization coefficients, and (iii) shift-share analysis. First, the
location quotient permits identifying concentrations of firms or emiiployment in a,
city that are above the national average. Second, the localization coefficient
measures the extent to which an industry is concentrated across the cities or regions
under consideration. Third, the specialization coefficient is an index of the extent to
which a city's industrial mix differs from the industrial distributiion of the country
as a whole. These techniques are highly descriptive. They are helpful in identifying
geographical clusters and the tendency of certain industries to coiceitrate in space,

but they do not provide any further insight on why concentrations may arise.
Nevertheless, they are a useful indicator of which industries and regions should
receive closer attention when studying the determinants of concentration.
3.1.1 The location quotient
The first technique is known as the location quotient. Bendavid-Val (1983, ). 75)
characterizes the location quotient as "...a device for gauging the relative
specialization of a region in selected industries." In its simplest form, the location
quotient compares the relative weight of a particular industry in a, region to its
relative national weight. Such weights are typically measured as the share of
employment at the regional or national levels accounted for by an industry, but a,
number of other measures exist. The location quotient is a simple descrijtive
technique that requires readily available data; "[it] is useful in the early exploratory
stages of research." (Isard, 1967, p. 125) However, its simplicity also accounts for
most of its limitations; as Isard (1967, p. 125) puts it, "the fact that a. region has
more or less than its 'proportionate' share of an activity does not, of itself, tell us
much." Thus, in the study of industrial concentration, the location quotient will
serve as a first measuring rod and as an indicator of the regions and in(ustries that
demand special attention.
Algebraically, the location quotient LQi, of industry i in region r is given by
eir
LQir =V (3.1)RVN
where eir is employment in industry i (i 1, ... ,n ) in region r (r i ,..., m); Ei
represents employment in industry i in the nation; and RVr an( RVN are reference
variables for industry i in region r and in the nation, respectively. The reference
variables RV,' and RVN are typically (but not neccesarily) given in terms of lotal
employment in region r and in the nation, respectively.
We can make several observations about Equation (3.1). First, there is no
particular reason why employment data should be used; its use is explained by the

relative ease with which employment data can be obtained. Alternatively, other
measures of industrial activity can be used. For example, we can weigh the
importance of an industry in the region (nation) by the share of the industry in
total regional (national) value added. Second, the reference variable RV and
variable e do not necessarily have to be expressed in the same terms. We can use
the location quotient, for instance, to compare industrial productivity across
regions. In this case, the specialization variable c could be given in terms of value
added and the reference variable RV in terms of employment -that is, value added
per worker-hour or productivity. Third, we can not only compare regional data to
national data; we can also compare regional data to "a, parent region or province, a,
median or average of other regions, a nation exclusive of the study region, or even a
group of linked nations." (Bendavid-Val, 1983, p. 77) Fin ally, we can use different
versions of Equation (3.1) to measure specialization in many different areas of study.
For the purpose of studying industrial concentrations of miaquiladoras we use
the following variants of the location quotient:
* The share of value-added per industry in each municipality relative to theindustry's share of total national value added in the maquiladora sector.
" The share of employment per industry in each municipality relative to theindustry's share of total national employment in the maquiladora sector.
" The proportion of firms in an industry at the municipal level relative to theproportion of firms in the industry at the national level.
In all cases, if LQi, > 1, then, municipality r shows a. larger proportion of
employment in industry i than the nation; if LQir = 1, the proportion of
employment in the municipality is identical to the national proportion; inally, if
LQi, < 1, the proportion of i's employment in the region is below the national
average. Scott (1988a. p. 49) uses instead a, LQir > 1.2 to indicate
overrepresentation of the industry in the municipality or region, and a. LQ,. 0.8 to
show underrepresentation. Scott's criteria are used in this study and ii(ustrial
concentration is defined as overrepresentation in the proportion of employment or
value added in the industry (i.e., LQir > 1.2).
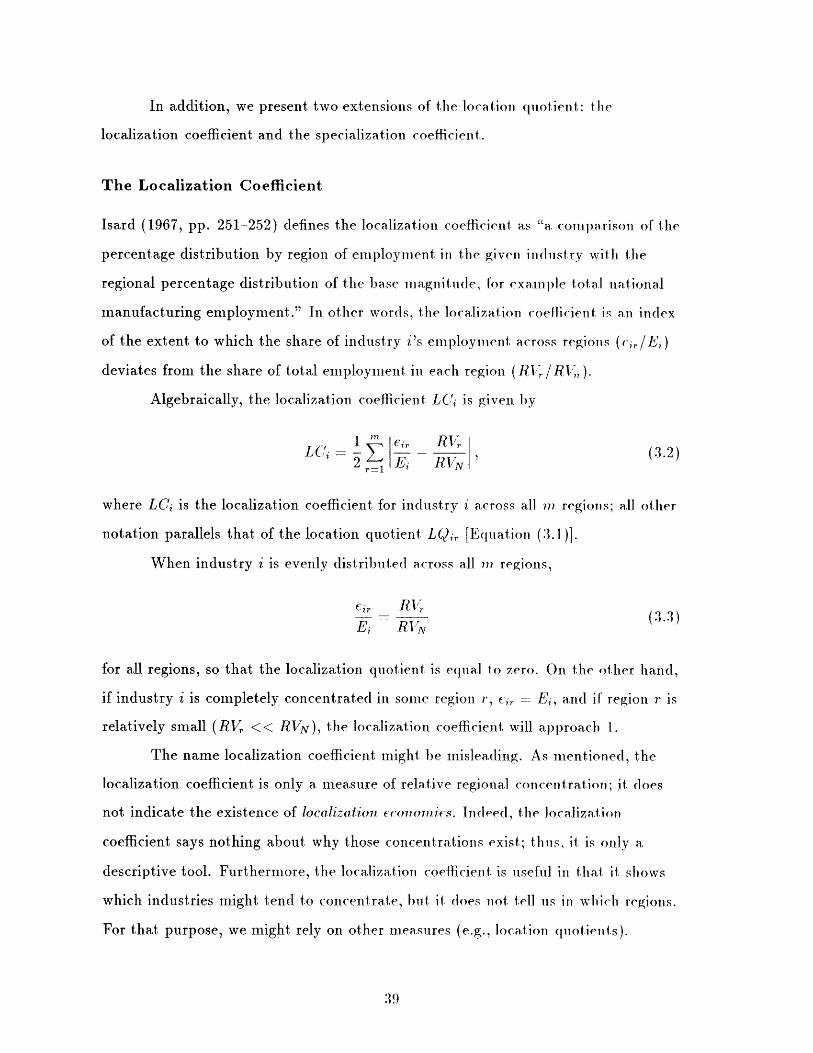
In addition, we present two extensions of the location quotient: the
localization coefficient and the specialization coefficient.
The Localization Coefficient
Isard (1967, pp. 251-252) defines the localization coefficient as "a comparison of the
percentage distribution by region of employment in the given industry with the
regional percentage distribution of the base magnitude, for example total national
manufacturing employment." In other words, the localization coefficient is an index
of the extent to which the share of industry i's employment across regions (ei,/E)
deviates from the share of total employment in each region (RV/RK;,).
Algebraically, the localization coefficient LC, is given by
LC, - Z (3.2)2 Ej RVN-r-1 E NRI\
where LCi is the localization coefficient for industry i across all m regions; all other
notation parallels that of the location quotient LQj, [Equation (3.1)].
When industry i is evenly distributed across all m regions,
ei, RV,
E; RVN
for all regions, so that the localization quotient is equal to zero. On the other hand,
if industry i is completely concentrated in some region 1, C = E_, and if' region r is
relatively small (RV << RVN), the localization coefficient will approach 1.
The name localization coefficient might be misleading. As nientioned, the
localization coefficient is only a, measure of relative regional concentration; it does
not indicate the existence of localization economics. Indeed, the localization
coefficient says nothing about why those concentrations exist; thus, it is only a
descriptive tool. Furthermore, the localization coefficient is useful in that. it shows
which industries might tend to concentrate, but it does not tell us in which regions.
For that purpose, we might rely on other measures (e.g., location quotients).

The Specialization Coefficient
The specialization coefficient is similar iI nature to the localization coefficient.
Whereas the localization coefficient shows the relative concentration of al
industry-without saying anything about where it concentrates-the specialization
coefficient "measures the extent to which the distribution of employinent lby
industry classes in [a] given region deviate from such distribution" in the nation as a
whole (Isard, 1967, p. 271). However, the specialization coefficient does not specify
which industries predominate in the region.
In studying industry localization in Europe and the ITnited States, Kru gmafn
(1991a, p. 76) uses a similar measure, which he terms "index of regional
divergence." In this study, we use elements of both Isard (1967) and Krugman
(1991a) to construct the following index:
1 "$ ei 1E-SCr - " R R- N ' (3.4)
where SCr is the specialization coefficient for region r in one or all ii industries; all
other notation is similar to that of the location quotient.
Again, the specialization coefficient is bounded by 0 and 1. If SC, = 0,
region r has an industrial mix proportional to that of the nation, that is,
employment in the region across industries is distributed proportionately to the
national employment distribution. On the other hand, if all of region r's
employment is concentrated in one particular industry, SCr approaches 1.
3.1.2 Shift-share analysis
Ideally, in a study of geographic industrial agglomeration, we should pay attention
to the changes in the spatial characteristics of the industry over time. For example,
we would like to test whether a region has been experiencing an "above-average"
increase in employment in a given industry during a particular period of tine. Also,
we may need to distinguish between absolute and relative increases across industries
in different regions. Shift-share analysis effectively tackles these issues.

Shift-share analysis decomposes region r's employment growth in industry i
into three different components:
National Share (NSi,) The national-share component represents industry i's
growth in region r attributable to natural growth across all industries; that is,
industry i in region r is assumed to grow at the same rate as total national
employment.
Industry Mix (IMi,) The industrial-mix component accounts for the growth in
industry i in region r attributable to the growth rate of the industry at the
national level. The IM component assumes that any industry i grows at the
same rate in region r and in the nation as a whole.
Regional Shift (RSi,) The regional-shift component captures the increase in
industry i's employment that stems from the difference in the growth rate of i
at the regional and national levels.
Algebraically, these components are given by:
NSir - -1 (P ) (3.5)"i E"
IMr 7 (3.6)er i' Et-1
RSir =er E (3.7)
Employment in industry i in region r at the beginning of the period of
analysis is given by e,'; at the end of the period, it is given )y C.. Thie national
employment level in the industry at the beginning of the period is given by E'-'; at
the end, it is given by E'. Finally, national emuployielt in all in(ustries at the
beginning and at the end of the period is given by E'-- ai(l E', respectively.
The aggregate effect of all three components yields the actual eiployient
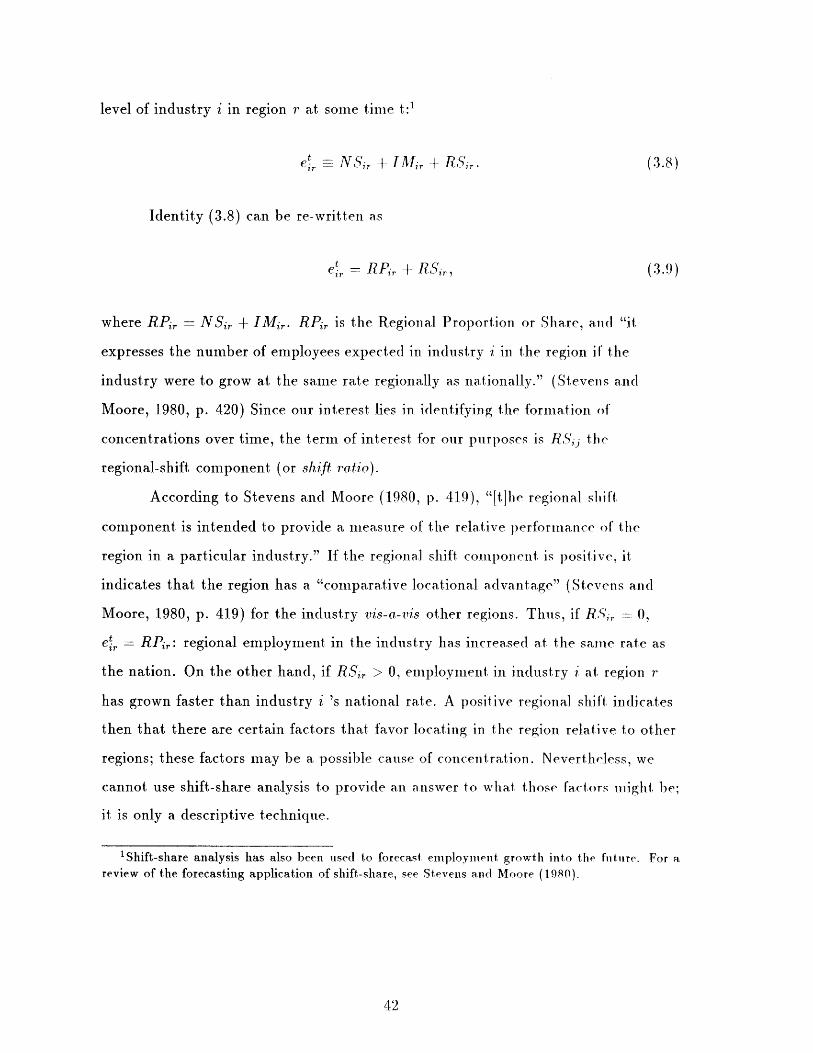
level of industry i in region r at some time t: 1
eC, = NSi, + I-ir + R5ir. (3.8)
Identity (3.8) can be re-written as
et = RP, + RSir, (3.9)
where RP, = NSi, + IMir. RPir is the Regional Proportion or Share, and "it
expresses the number of employees expected in industry i in the region if' the
industry were to grow at the same rate regionally as nationally." (Stevens and
Moore, 1980, p. 420) Since our interest lies in identifying the formation of
concentrations over time, the term of interest for our piurposes is R,5 the
regional-shift component (or shift ratio).
According to Stevens and Moore (1980, p. 419), "[t]he regional shift
component is intended to provide a measure of the relative performance of the
region in a particular industry." If the regional shift component is positive, it
indicates that the region has a "comparative locational advantage" (Stevens and
Moore, 1980, p. 419) for the industry vis-a-is other regions. Thus, if R,. = 0,
e, = RPir: regional employment in the industry has increased at the same rate as
the nation. On the other hand, if RS-7 > 0, employment in industry i at region r
has grown faster than industry i 's national rate. A positive regional shift indicates
then that there are certain factors that favor locating in the region relative to other
regions; these factors may be a possible cause of concentration. Nevertheless, we
cannot use shift-share analysis to provide an answer to what those factors might be;
it is only a descriptive technique.
'Shift-share analysis has also been used to forecast employment growth ijto the future. For areview of the forecasting application of shift-share, see Stevens and Moore (1980).

3.1.3 Use and limitations
So far, we have presented several techniques for identifying concentrations. Their
usefulness and appropriateness to this study are justified since these techniques
provide a quick and easy way to identify concentrations with few data requirements.
In order to analyze the results obtained from applying these techniques, we discuss
the experience of five maquiladora industries. Results are presented in A ppendix B.
We compared both the location quotient of an industry and the
specialization coefficient of the cities in the sample to some characteristics of the
city-population size, maquiladora employment, among others-and of t he industry
in the city-percent of domestic inputs used by the industry, percent of Cechnical
workers. The choice of these characteristics was determined by data availability. We
ranked cities by the size of the location quotient or specialization coefficient, and by
the size of one of the city or industry characteristics-e.g., population size, percent
of technical workers. We then computed the rank correlation and tested for
significance.
Rank correlation helps us determine why industries might be concentrating.
If, for example, the correlation between the size-rank of the location quotient and
the population-size rank is positive, urbanization iighi he presenit; thus, population
size is a proxy for urbanization economies. Similarly, a positive correlation between
the LQ-rank and the domestic input use or technical employment at each location
may show that these factors are important locational determinants. Given that
input and skilled-labor availability are among the determinants of industrial
localization, we used domestic input and technical employment as proxies for
localization determinants. It is impossible, however, to make cause-effect
observations from rank-correlation results; rather, they only help us pinpoint some
of the factors driving concentration and hinting to the existence of localization or
urbanization economies, prior to econometric analysis. Furthermore, a shortcoming
of the rank correlation technique is that it ignores the possibility of significant
correlation between some of the variables against which location quotients are
compared. If two variables are correlated, they will present similar correlation
coefficients with respect to the location quotients.
In addition to location quotients and specialization coeflicients, we coiputed
localization coefficients. Rather than providing an index of in(lustrial concentration
with respect to the country as a whole, the localization coefficient is only a. miieasure
of the extent to which a city is concentrated in the samiple of citics used in this
study. In order to obtain nationally significant figures, data for all maquiladora
localities in the country would have been needed; thus, the figures presented in this
study are significant in as much as the cities considered in this study are the largest.
maquiladora centers in Mexico. We considered an alternative technique, the
locational Gini coefficient (Krugman, 1991a), to measure the degree of spatial
concentration of the industry and compared against localization coefficients.
Locational Gini coefficients proved redundant to the localization coefficient and are
therefore not included in the thesis.
Due to data limitations, we could undertake shift-share analysis only to
study differences in growth between border and non-border localities. Ideally, we
would have used it to identify growth trends for different industries at the city level
and to determine which industries might present, a tendency to concentrate.
Nevertheless, the lack of disaggregated time-series data, for different cities prevented
such an analysis.
Finally, as pointed out by Isard (1967, pp. 262-270), several technical and
conceptual limitations apply to all of the techniques presented thus far. First, the
coefficient and curve of localization, as well as the regional-shift ratio, will depend
on the "degree of fineness" of the geographic subdivisions being ulsed -states,
cities, municipalities, etc. Second, the value or shape of any of these measures will
depend on the level of industrial disaggregation used. Third, with regard to the
regional-shift component, Isard (1967, p. 259) points out that regional changes in
variables such as population, value added per industry, public spending, aid )rivate
investment affect the meaning and implication of the shift ratio. Finally aln( most
important, all the devices analyzed "are of little value in identifying or evaluating
cause and effect relationships. They can assist the analyst to perceive certain

general empirical associations, but can be considered only as rough guideposts for
basic regional analysis and planning." (Isard, 1967, p. 270)
3.2 Data
As stated earlier, data limitations have prevented researchers from un(lertaking the
study of regional differences in maquiladora production. In particular, data with a
sufficient degree of industrial disaggregation at the municipal level have nlot been
published by the Mexican government's Instituto Nacional de Estadistica, Gcografia
e Informdtica (INEGI) due to confidentiality restrictions. For the purposes of this
thesis, however, we use municipal data, with a finer degree of disaggregation. We
obtained the data under a special agreement with INE(GI. The data we use provide
detail on the number of firms, total employment by class, value ad(le( in Mexico,
use of domestic inputs, among others, by industry per municipality.
We looked at five industries in the maquiladora sector spread across 17
Mexican cities. The industries we analyze are the largest industries in the
maquiladora sector; they include: (i) cectric and ecctronic componcnis; (ii) electric
and electronic goods and equipment; (iii) transportation equipmeni; (iv) Ie~rliles; and
(v) furniture assembly; other industries are also analyzed in some cases. 2 The cities
analyzed are the largest maquiladora produlction centers in ithe country; they
include 11 border cities (Matamoros, Nuevo Laredo, Reynosa, Acunia, Piedras
Negras, Juarez, Agua Prieta, Nogales, Mexicali, Tecate, Tijuana) and 6 cities in the
interior of Mexico (Monterrey (metropolitan area.), Saltillo, Torre6n (metropolitan
area), Chihuahua, Hermosillo, and Ensenada). These 17 cities account for 84% of all
maquiladora employment and 63% of all plants.
The sample choice was determined by the need to look at cities where
industrial concentrations might have developed the farthest. Including oiler cities
might not have been useful since they would have presented only scattere(I
2 See Appendix A for a complete listing of the miaquiladora sector's industrial categories as definedby INEGI.

maquiladora plants without considerable industrial clistering.'
3.3 Geographic profile-results
In this section, we apply the techniques presented above to the study of in(ulstrial
concentration in maquiladora production. As a first step, we present a brief
description of growth behavior in the niaquiladora sector over the last (ecade; in the
process, we look at differences in employment growth across industries an(l regions,
particularly between border and non-border municipalities. Such a, descri)tion
serves as a preamble to an industry-by-industry discussion of industrial
concentration across a sample of cities.
3.3.1 Growth patterns
Since its outset in the mid 1960s, the maquiladora sector has increased steadily.
Nonetheless, as shown in Figure 3-1, a rapid increase in employmnent growth
occurred after 1982: in 1983 employment grew by 18.7% and in 1984 by 32.5%
(Table 3.1). Such increases followed the Mexican government's announcement that
it was unable to service its foreign debt. In order to curtail the astronomical capital
flight underway, the government drastically devaluated the Mexican peso against
the U.S. dollar. Recurring devaluations of the peso during the 198 0s, coupled with
high inflation, slashed Mexican real wages by 50%: Mexican wages suddenly became
an attractive bargain for U.S. firms. To illustrate, Fernandez-Kelly (1987) estimates
that, in dollar terms, from January to September 1982, monthly wages in Jukrez fell
from $364 to to $156. As a result, Mexico became a preferred location for assembly
operations.
Growth in the maquiladora sector presented differences across in(stries,
however. Table 3.2 presents growth patterns for 6 mna(lliladora in(ustries from 1981
3 One important city that could have been included in this study but for which data could not beenobtained is Guadalajara. Wilson (1990b) has studied maquiladoras in Guadalajara in ain attemptto identify linkages between them and the local economy.

Figure 3-1: Growth in maquiladora employment (1979-1990)
500
450-
400-
jg 350 -0
z 300-
250-
0 200-
150 -
100 -
79 80 81 82 83 84 85 86 87 88 89 90Source: INEGI.
Table 3.1: Growth in the maquiladora sector (1979-1990)
Year Basic Indicators Annual Cumulative# Firms # Workers % change % change
1979 540 111,365 -- --
1980 620 119,546 7.3 7.31981 605 130,973 9.6 17.61982 585 127,048 -3.0 14.11983 600 150,867 18.7 35.51984 672 199,864 32.5 79.51985 760 211,684 5.9 90.11986 890 249,833 18.0 124.31987 1,125 305,253 22.2 174.11988 1,396 369,489 21.0 231.81989 1,655 429,725 16.3 285.91990 1,938 475,762 10.7 327.2
Source: Calculated from INEGI data.

Table 3.2: Growth in selected maquiladora industries (1981-1989)
Region 1981 1989 % Change# firms # workers # firms # workers # firms # workers
National total 605 130,973 1,655 429,725 173.6 228.1Textiles 117 18,059 245 39,077 109.4 116.4Shoe and leather (1984) 35 3,933 49 8,090 40.0 105.7Furniture 54 3,319 219 21,384 305.6 544.3Transportation equipment 44 10,999 142 90,524 222.7 723.0Electric/electronic goods 67 33,396 116 63,200 73.1 89.2Electric/electronic components 163 42,791 348 103,461 113.5 141.8Services 26 6,787 72 18,822 176.9 177.3
Border municipalities 533 116,450 1,327 339,918 149.0 191.9Textiles 92 14,278 152 20,672 65.2 44.8Shoe and leather (1984) 32 3,648 42 7,298 31.3 100.1Furniture 51 3,236 219 21,384 329.4 560.8Transportation equipment 41 10,108 113 75,765 175.6 649.6Electric/electronic goods 60 31,801 93 53,463 55.0 68.1Electric/electronic components 145 36,935 308 87,079 112.4 135.8Services 20 5,105 58 15,269 190.0 199.1
Non-border municipalities 72 14,523 328 89,807 355.6 518.4Textiles 25 3,781 93 18,405 272.0 386.8Shoe and leather (1984) 3 285 7 792 133.3 177.9Furniture 3 83 n.a. n.a. n.a. n.a.Transportation equipment 3 891 29 14,759 866.7 1556.5Electric/electronic goods 7 1,595 23 9,737 228.6 510.5Electric/electronic components 18 5,856 40 16,382 122.2 179.7Services 6 1,682 14 3,553 133.3 111.2
Notes: (1) n.a. = not available.(2) For the shoe and leather industry, 1984 figures are used instead of 1981 figures.
Source: Calculated from INEGI data.
to 1989; although all industries grew during this period, two of them, transportation
equipment and furniture, grew at a faster rate than the national average. The
employment share of the transportation equipment industry went up from 8.4% of
national maquiladora employment to 21.1% and that of the furniture industry
doubled from 2.5% to 5.0%. As a result, the employment share of other industries
declined: in the electric and electronic components industry, the share of
employment fell from 32.7% to 24.1%; in the textile industry, it fell from 13.8% to
9.1%; and in the electric and electronic goods industry, the employment share
declined from 25.5% to 14.7%.
In addition, maquiladora growth presented differences across regions.
Whereas in the past maquiladoras were restricted to operate along the border, they

are now allowed to operate anywhere in Mexico. In turn, employment growth was
not restricted to border municipalities, but spilled into the Mexican hinterland.
Indeed, the employment growth rate in the interior of Mexico surpassed the growth
level in border municipalities; from 1981 to 1989, employment in the mla(Iuiladora
sector grew at an average annual rate of 64.5% in non-border localities ?'rsus 24.0%
in border localities. In absolute terms, border maquiladora eml ployment increased
by more than 220,000, while non-border maquiladoras contributed more than 75,000
jobs, or approximately one quarter of all new maquiladora jobs (Table 3.2).
Again, the employment growth rate differed across industries in each region.
In order to understand the regional impact of different iudustrial growth rates, we
use shift-share analysis. Table 3.3 shows a, decomposition of growth factors affecting
each industry in border and non-border municipalities. We could not ulertake a,
more detailed analysis of shifts in the industrial characteristics of particllar cities
due to the lack of disaggregated industrial data, at the municipal level for periods
previous to 1990 prevented. Nevertheless, we can make several observations from
border versus non-border data. First, the regional-shift components for each region
confirm that maquiladora production is increasingly spreading into the interior of
Mexico; such an observation holds true for all industries with the exception of
service maquiladoras. In contrast, for border municipalities, we observe t hat
positive regional shifts occurred only for the furniture and service industries.4
Second, despite the fact that changes in the industrial distribution affected several
industries, regional growth in non-border municipalities was large enough in several
cases so as to offset industrial mix changes (i.e., RS > |IMI); such was the case of
the textile and electric/electronic goods industries, implying that both industries
are increasingly spreading into the Mexican interior (Table 3.2). Third, he positive
regional-shift component for all industries in non-border municipalities questions the
idea that only "traditional" maquiladoras, that is, those that perform simple labor
41989 figures for non-border iaquiladora plants in the furniture in(ustry were not available,perhaps due to confidentiality restrictions; INEGI assumes that employment in border municipalitiesequals national employment for the industry. It would be expected, then, that the regional shiftcomponent for border municipalities is positive, given the positive absolute growth of the industry.

Table 3.3: Shift-share decomposition of maquiladora employment growth (1981-1989)
RegionIndustr
BorderTextileShoe aFumituTranspElectricElectricService
Non-borcTextileShoe aFumituTranspElectricElectriServic
Notes:
National IndustrialY Shift Mix
382,075 0s 46,846 (15,951)nd leather (1984) 11,969 (4,465)re 10,617 10,232ortation equipment 33,165 50,026/electronic goods 104,340 (44,158),/electronic components 121,184 (31,882)s 16,750 (2,592)
er 47,650 (5,258)s 12,406 (6,931)nd leather (1984) 935 (365)re n.a. n.a.ortation equipment 2,923 3,755/electronic goods 5,233 (2,552)/electronic components 19,214 (5,407)
es 5,519 (488)
(1) Figures in brackets represent negative numbers.(2) n.a. = not available.
RegionalShift
(42,157)(10,223)
(206)535
(7,426)(6,719)(2,223)1,112
47,41412,931
222n.a.
8,0807,0562,576
(1,478)
Employment
339,91820,672
7,29821,38475,76553,46387,07915,269
89,80718,405
792n.a.
14,7599,737
16,3823,553
(3) 1984 figures for the shoe and leather industry are provided.Source: Calculated from INEGI data.
intensive processes-e.g., textiles-tend to locate in the Mexican hinterland;
shift-share results call at least for firm-by-firm studies to dispel that question.
3.3.2 Industrial concentration
We computed location quotients and localization coefficients for five maquiladora
industries. The results for each industry are presented next, along with evidence for
or against agglomeration factors-i.e., urbanization and localization economies.
Textiles
In 1981, the textile industry occupied the third place in maquiladora production,behind the electric/electronic goods and electric/electronic components industries,with 18,059 workers (Table 3.3). By 1990, the industry employed more than 42,000
workers, but had fallen behind the transportation equipment industry in
importance. Although the industry grew at an average rate of 14.5% from 1981 to
-------------------------------------------------------------------------------
--------------------------

1989, it failed to keep up with the 28.5% total maquilalora employment growth
during the same period.
The industry, nevertheless, presented noticeable growth differences between
border and non-border municipalities. Whereas textile enploynient along the
border increased by only 65% during this period, it grew by 272% in noni-border
municipalities. As a result, while non-border municipalities accounted only for
20.9% of textile employment, in 1989 they accounted for 47.1%. Although the
employment share of non-border municipalities for other industries also increased,
none of those industries reached the level of the textile industry. Ranfla and Avil6s
(1988, as cited by Quintanilla (1991)) point to the case of the textile industry to
indicate that "traditional" maquiladoras tend to move inlan(l, while "modern"
inaquiladoras locate in border localities. Although textile i aquiladoras iiiay )e
easily considered "traditional" due to its labor intensiveness aid low value added
per worker, we may question the rationale for the above claim given the high growth
rates in the interior of Mexico of other industries that cannot be easily classified as
traditional and, at least, suggest the need for detailed case studies.
In 1990 15 out of 17 cities in the sample had textile maquiladoras operating.
Employment in these 15 cities amounted to 33,264 workers or 79.1% of total
employment in the industry. Concentration of textile maquiladoras, as lleasured by
the employment location quotient (LQ > 1.2), existed in four cities: Torre6n,
Piedras Negras, Mexicali, and Hermosillo; moreover, if, instead, the value added-LQ
is considered, Agua Prieta and Nogales also present concentrations of textile
maquiladoras. Textile imaquiladora employment in the top four cities reached 32.8%
of national textile employment.
Textile assembly and manufacturing presents a reumarkably high LQ in the
Torre6n- G6mez Palacio-Lerdo metropolitan area., located in the Mexican interior. It
was found that, out of 51 maquiladoras in the area, 44 were textile firms, yielding a.
high LQ in terms of firms; value added and employment LQs were even higher,implying that firms in the region were relatively larger than the average textile
maquiladora in the rest of the country; indeed, the average size of local textile

plants was 169 workers versus 146 workers at the national level. The
Torre6n-G6rmez Palacio-Lerdo region is well-known as a cotton-producing center in
Mexico. Thus, we can possibly explain the high concentration of textile
maquiladoras by the availability of local inputs to the industry. Nevertheless, textile
naquiladoras in the region presented a lower value added in Mexico than the typical
textile firm in the country, suggesting that local inputs may not be significant. In
addition, a careful look at the ratio of domestic inputs to total inJuts exhibited a,
lower ratio for maquiladoras in the region than for the national average textile
maquiladora. As a result, the importance of local inputs as an agglomeration factor
is not supported by the available data.
Piedras Negras, a border town in the state of Coahuila, presente(l the secon(l
highest LQs in the textile industry of any other city in the sample; interestingly,
Acufia, another border town in the same state showed very low LQs in the in(ustry.
This indicates that the locational determinants for textile firis may be
location-specific rather than depending upon characteristics of the larger region in
which they locate.
The location quotients for the textile industry do not show a, significant
rank-correlation with either city characteristics or characteristics of the iinstry at
the location (Table 3.4). The only exception is the percent of technical workers
employed by the industry in each city, when compared to value-added location
quotients. Consequently, we cannot make any definitive claims about how
concentration is affected by industry and city characteristics. Nevertheless, by
looking at the correlation coefficients' sign and magnitude, we can infer some
qualitative characteristics of industrial concentrations. We can then use such
qualitative information to interpret the econometric results presented in Chapter 4,
keeping in mind that, by themselves, the insignificant correlation coeflicients tell us
nothing.
With these considerations in mind, we first observe that the size of' the
employment LQ presented a, positive, yet statistically insignificant, correlation
coefficient with respect to population size, suggesting the existence of some degree

Table 3.4: LQ rank-correlation vis-a-vis city and industry characteristics.
City and industry characteristics
LQ expressed Maquiladora Employment East-West Domestic TechnicalIndustry In terms of: Population Employment Maq {-} Location Inputs (%) Workers (%)
Textiles Employment 0.175 -0.100 -0.319 -0.303 0.111 -0.153n=15 Value added 0.017 -0.108 -0.339 -0.386 0.156 -0.733r=0.4405
Furniture Employment 0.325 0.117 -0.022 -0.350 0.525 0.817n=15 Value added 0.106 0.200 -0.053 -0.403 0.450 0.717r=0.4405
Transportation equipment Employment 0.178 -0.022 -0.111 0.656 -0.047 -0.450n=16 Value added 0.125 -0.008 -0.114 0.711 -0.139 -0.444r=0.4258
Electric/electronic goods Employment 0.426 0.048 0.024 -0.185 0.497 0.307n=14 Value added 0.310 -0.080 -0.098 -0.205 0.470 0.363r=0.4574
Electric/electronic components Employment -0.149 0.515 0.369 0.065 0.205 0.054n=15 Value added -0.143 0.539 0.438 0.235 0.116 0.155r=0.4405
Notes: n = number of cities that participate in the industry.r = critical correlation coefficient for 90% significance level.LQ = location quotient.Employment Maq{-i}=Maquiladora employment exclusive of industry I.East-West location refers to the relative geographic location of a city from East to West (see Figure B-1).
Source: Calculated from INEGI data.
of urbanization economies. Second, a positive, but statistically in significant,
correlation also existed between the LQ rank and the use of dolestic inplits a's a,
fraction of total inputs; on the other hand, correlation with respect to the use of
technical workers was negative and significant when using value added LQs.
Because both the percent of national inputs and of technical workers coulld be used
as proxies for localization factors, we obtained no clear evidence of the presence of
localization economies in the textile industry. Third, concentrations of textile
maquiladoras were less likely to occur as the size of overall maquiladora employment
in a city increases, implying that textile plants will locate in cities where
maquiladora activity is incipient (e.g., interior Mexico). Finally, with the use of
rank correlations, we also observed that textile firms tend to pre(omlina.te in
Western Mexico. To show this, we ranked each city according to their relative
geographic location, such that the Eastern-most city in the sample, MataImIoros,
received a value of one, Reynosa, the closest city west of Matamoros, received a. two,
and so on. We then compared the East-West ranking of the cities with their
LQ-ranking and computed correlation coefficients for each industry.

As mentioned above, the localization coefficient, provides an inde>: of the
extent to which an industry is concentrated across the saiple of cities. The
localization coefficient for an industry only provides an index to be compared
against those of other maquiladora industries; thus, it is only a, relative measure.
The localization coefficient for the textile industry was low relative to two other
industries, furniture and transportation equipment (Table B.3, Appendix B),
indicating that textile maquiladoras have a lesser tendency to concentrate relative
to the other two industries.
Furniture
The furniture industry had the second largest growth rate of all niaquiladora
industries, an annual average of 68.0% from 1981 to 1989, only behind the
transportation equipment industry. The industry increased its share of imaquiladora
employment from 2.5% in 1981 to 6.5% in 1990. Unfortunately, as mentioned
earlier, shift-share figures for the furniture industry were inaccurate; thus, we
cannot talk about the differential growth of the industries between border and
non-border municipalities.
Four cities in the sample presented concentrations (as expressed by the
employment LQ) of furniture maquiladoras: Tecate, Tijuana, Mexicali, and
Ensenada; if the value added LQ is used, Juarez is included anong the cities with
concentrations of furniture maquiladoras. The four cities with the largest. LQ were
all located in the state of Baja California and account for 63.7% of the industry's
national employment; JuAirez accounts for an additional 24.5% of the industry's
employment, so that 88.3% of all employment is concentrated in five cities.
Furthermore, with the exception of Ensenada, four out of five cities are located
along the border'; the employment of all other non-border cities in the sample adds
up to only 1.3% of total employment in the industry. Thus, the furniture industry is
highly concentrated in a small number of border cities. Relative to other in(lustries
in this study, the industry displayed the highest localizatiou coefficient ( L = 0.45).
'Ensenada, however, is only 60 miles away from the border.

With the use of the rank correlation coefficients, we showed that
concentration is correlated with the percent of domestic inputs used and with the
fraction of technical workers in the labor force. As mentioned before, we could use
domestic inputs and technical workers as proxies for localization factors.
Nevertheless, pairwise correlation between LQ and other characteristics ignores
correlation among those characteristics themselves; in particular, our use of
technical workers or domestic inputs may present regional differences that will bias
the correlation coefficients. For example, the maquiladora sector in Baja California
employs more technical workers than it employs in other regions; therefore, since
furniture maquiladoras are concentrated in Baja California,, we will obtain a positive
correlation between concentration and the use of technical workers. In order to
account for correlations between variables, we must use econometric techniques
similar to those used in Chapter 4. Finally, furniture maquiladoras also showed a
positive correlation, yet insignificant, with population size, implying the existence of
urbanization economies.
The fact that the furniture maquiladora industry has high location quotients
in the state of Baja California parallels figures provided by Krigman (1991a)
showing that the furniture industry in the United States concentrates in California,.
The possibility of having transborder concentrations of furniture firms would be an
interesting research area, since we could show that niaquiladoras do not concentrate
in a locality due to agglomeration economies, but because of the industrial structure
of the neighboring or closest region in the United States.
Transportation equipment
The transportation equipment maquiladora, industry showed the highest growth rate
in the maquiladora sector. From 1981 to 1989 employment increased by 723%,
reaching a level of almost 99,000 workers by 1990. As a result, the industry became
the second largest industry in the sector. The increases took place both in I)order
and non-border municipalities, although the growth rate in the interior of Mexico
was almost three times larger than in the border, 1556% versus 650%.

In terms of employment, eight cities presented concentrations of
transportation equipment maquiladoras: Saltillo, Nuevo Laredo, Chihuhalua,
Monterrey, Matamoros, Acufia, Juairez, and Agia Prieta [See Table B.2, Appendix
B). They accounted for 78.2% of all employment in the industry. With the exception
of Nuevo Laredo, three of the top four cities are located in the interior of Mexico,
showing once again the extent to which transportation equipmlent naquiladoras
have located in the interior of the country. Furthermore, cities in Western
Mexico-Baja California and Sonora-present smaller LQs than the rest of the
cities in the sample; thus, there is a strong correlation between the LQ size and the
relative East-to-West location of the industry. This is interesting since
transportation equipment plants in the United States predomlinate in the Midwest,
relatively closer to North Eastern Mexico than to Baja California or Sonora.
In Saltillo, five out of seven maquiladoras are in the transportation
equipment industry. This is of particular interest once we consider that the Saltillo
area, which includes neighboring Ramos Arizpe, has an important concentration of
non-maquiladora export manufacturing firms in the autoniobile industry. GM and
Chrysler have one engine manufacturing plant each in the area,; in addition, GM
also assembles cars for the U.S. market. Nevertheless, it is not possible to iden tify
any linkages between maquiladoras in Saltillo and automobile and engine
manufacturers in the city from the data, available; however, platnts in Salfillo showed
the highest percent of domestic inputs in the transportation equipment industry
(3.2%) compared to plants in all other cities, with the exception of Mexicali (4.6%).
In Nuevo Laredo, 16 out of 49 maquiladoras participate in the transportation
equipment industry, while in Chihuahua only seven out of 55 do, but they show the
highest average size of all firms in the industry.
Transportation equipment plant concentration showed insignifican t
correlation coefficients with regard to population or percent of (omlestic inputs; with
respect to percent of technical workers, the correlation coefficient was negative and
significant. Therefore, correlation figures suggest that urbanization and localization
factors are negligible.

Electric and electronic goods
The electric and electronic goods industry is the third largest, in(ustry inl the
maquiladora sector; in 1990 it employed over 53,000 workers. The electric/electronic
goods maquiladora industry grew at a slow rate relative to other in(ustries in the
1981-1989 period, at a mere 11.1% per year. Again, the in(lustry grew at a faster
rate in the interior of Mexico than in border localities and the regional-shift
component in non-border maquiladoras was large enough to offset the nation-wide
decline in the industry's employment relative to other industries (RS > |AII).
Fourteen cities in the sample contained firms in the electric/electronic goods
industry. In addition, the sample accounted for only 50.6% of employment in the
industry, implying that the industry may be scattered among smaller imaquiladora
centers. Moreover, only Junrez, where 26 out of 238 maquiladoras pro(hced
electric/electronic goods, showed a LQ greater than one (1.1-70); the industry in the
rest of the cities was actually underrepresented (i.e., LQ 0.8).' If the rest of the
country is assumed to be another region, its location quotient in terms of
employment would be equal to 4.4. This implies that the industry is overrepresented
in the rest of the country and underrepresented in the 14 cities in the sample that
participate in the industry. In terms of the number of firms at each location, 8 cities
displayed LQs greater than one, while the LQ in terms of firms for the rest of the
country equaled 0.871. Therefore, the cities in the sample a smaller firm size, in
terms of the average number of workers, than the rest of the country. While the
national size of the firm averaged 508 workers per firm, the average size in the
sample was 380 workers per firm. As a consequence, the study's results might not
be representative for the industry as a whole and should be taken with caution.
The LQ ranking of the cities showed significant correlation with pol)ilation
size and domestic input use; with regard to the percent of technical workers
employed, the correlation coefficient was positive but statistically insignificant.
'Saltillo s value added and employment LQs greater than 1.2; nevertheless, there were no firmsin the industry by the end of 1990. The apparent contradiction has to do with the fact that INEGIreports annual average data on employment and value added, but only reports the unmber of firmsexisting at the end of the year.

Hence, there is some evidence for the existence of urbanization and localization
economies.
Electric and electronic components
The electric and electronic components industry is the largest industry in the
maquiladora sector; it employed 127,047 workers in 1990, up from 42,791 in 1981.
From 1981 to 1989 the industry grew below the national level, at a rate of 17.6% per
year. Again, the industry grew faster in the interior of Mexico and, as a. result, the
regional shift component for non-border municipalities was positive. Nevertheless,
the industry's decline in importance relative to other industries was large enough so
as to offset the regional shift in employment in non-border cities (RS < |IMI).
The sample contained 15 cities that participated in the electric/electronic
components industry. They comprised 95.7% of the industry's total employment;
therefore, the results obtained in this study regarding the industry are highly
representative of the industry as a whole. Five cities (Nogales, Reynosa,
Matamoros, Chihuahua, and Juarez) presented LQs greater than 1.2; they account
for almost 61% of the industry's national employment. Chihuahua was the only
non-border municipality in the sample where the industry was concentrated. The
industry was underrepresented or inexistent in the remaining five non-border
municipalities included in the sample. Hence, electric/electronic components
maquiladoras are more likely to locate along the border than in interior locations.
The industry only displayed significant rank-correlation coefficients with
respect to the city's maquiladora employment. The correlation coefficient was
positive, implying perhaps that firms in the industry locate in cities where the
maquiladora sector is well established; alternatively, since the industry accounts for
a large percent of total maquiladora employment in the country (26.7%), a, high
correlation coefficient may exist simply because a high fraction of the industry's
employment in a city considerably increases the city's overall maquiladora
employment. Nevertheless, the correlation coefficient with respect to mnaquila(ora
employment exclusive of the electric/electronic coiponients industry is positive and

Table 3.5: Specialization coefficients
Municipality
Torreon-Gomez Palacio-LerdoSaltilloTecateHermosilloMonterrey (Metropolitan area)Piedras NegrasNuevo LaredoEnsenadaNogalesMatamorosChihuahuaAcunaReynosaTijuanaMexicaliAgua PrietaJuarez
Rank correlation vis-a-vis:Maquiladora employment rankPopulation rankCritical correlation coefficient = 0.482
(95% significance level)
Source: Calculated from INEGI data.
Specialization coefficients in terms of:
Employment Value added
0.814 0.7360.590 0.5660.509 0.4850.504 0.4940.482 0.4450.477 0.4470.452 0.4640.445 0.6140.371 0.3800.344 0.3810.324 0.3370.313 0.2940.286 0.2520.280 0.3460.238 0.3930.179 0.1550.154 0.145
-0.617-0.017
Highest-LQIndustry
TextilesTransportation
FurnitureTextiles
TransportationTextiles
TransportationFurniture
E/E componentsTransport, ee comp.
TransportationTransportation
E/E componentsFurniture
Furniture, textilesTransportationTransportation
HighestEmployment
Industry
TextilesTransportation
FurnitureTextiles
TransportationTextiles
TransportationE/E componentsE/E componentsE/E components
TransportationTransportation
E/E componentsE/E componentsE/E componentsE/E componentsE/E components
-0.6200.015
large, albeit statistically insignificant.
With respect to population size, industrial concentration showed a negative
yet insignificant correlation coefficient, hinting at the presence of urbanization
diseconomies. With regard to localization factors, the industry had positive
correlation coefficients with respect to the percent use of domestic inputs and
technical workers, but the coefficients were insignificant.
3.3.3 Regional specialization
So far, we have presented figures that show where maquiladora industrial clusters
exist, focusing on five industries and showing in which cities those industries are
overrepresented. Now, we look at the extent to which the industrial distribution ofthe maquiladora in a given city diverges from the nation's distribution. To this
effect, specialization coefficients for the 17 cities in the sample were computed.
-----------------------------------------------------------------------------------------------------------------------------------------

Table 3.5 presents the specialization coefficients for each city and ranks all cities
from highest-to-lowest coefficient. Specialization coefficients ranged from 0.814 in
Torre6n, where textile maquiladoras predomiinate, to 0.154 in .Jui.rez, with high LQs
in the transportation equipment and the electric/electronic components industries.
We used the specialization coefficients to study the way in which regional
specialization varied with respect to population and size of the maquiladora sector.
We computed rank correlation coefficients between the specialization coefficient and
population and maquiladora sector sizes in each city. Population size appeared to be
uncorrelated to the degree of specialization of a city. In contrast, we observed that
the degree of specialization of a locality decreases the larger the size of the
maquiladora sector in that locality is; this correlation is statistically significant at
the 97.5% significance level (Table 3.5). We can pose several hypothesis to explain
such inverse correlation.
A first hypothesis is that the industrial mix of a given city will converge
toward the national average mix as the size of the maquiladora sector in the city
increases. Over time, the largest maquiladora employment centers have been able to
attract a more diverse set of industries. Presumably, other cities will also attract
different industries once their absolute share of maquiladora employment increases,
so that they become less specialized through time. Second, cities in the interior tend
to specialize more than cities on the border, and since maquiladora, employment is
smaller in non-border iaquiladoras, there is a negative correlation between
population and maquiladora size. In the sample used, four interior cities, (Torre6n,
Saltillo, Hermosillo, and Monterrey) were among the five cities with the highest
specialization coefficients, along with Tecate, a. border town. Maquiladoras in the
interior of Mexico usually acquire a larger proportion of their inputs from Mexican
suppliers, thus they might be influenced by localization factors and will show a
greater tendency to concentrate in space. In contrast, maquiladoras in border
localities will be less influenced by localization economics, at. least by those arising
from the availability of specialized material inputs, since those ma-quiladoras import
most of their inputs from the United States; however, maquilaadorats in bor(er cities

might still be affected by the localization economies arising from the availability of
specific labor skills. Third, since the iaquiladora sector is still largely concentrate(d
in a few cities, the national average industrial mix will resemble that of the largest
maquiladora centers in Mexico (Jiuirez, Tijuana., Mataioros, etc.) Furthermore,
since the specialization coefficient compares national to local figures, the larger the
size of the locality, the closer its industrial mix will be to the nation's mix. As a.
result, specialization decreases with size of the maquiladora sector. Unfortunately,
testing the above hypotheses is beyond the scope of this thesis.
3.4 Summary
In determining the extent to which industrial concentration in the maquiladora
sector occurs, we looked at the spatial profile of the maquiladora sector in Mexico.
We examined data for 17 urban areas and five mnaquiladora industries using a. series
of techniques widely used in regional economic analysis. The techniques included
the location quotient, the specialization and localization coefficients, the locational
Gini coefficient, and shift-share analysis. We compared the degree of concentration
of an industry in each city-as defined by the location (Iotient-to specific
characteristics of the industry and the city by means of rank-correlation coefficients
in order to identify factors that may influence an industry's concentration in a. city
relative to that of other cities. We used population size as a proxy for the presence
of factors causing urbanization economies; similarly, we used the percent. of domestic
inputs purchased by an industry and the percentage of technical workers employed
as proxies for localization factors.
Two industries, furniture and electric/electronic goods, showed positive
rank-correlation coefficients vis-a-'is domestic input use an( technical eiploynment,
implying that above average concentrations of maquiladora-s might be explained by
localization economies. In addition, the electric/electronic conponent imluIstry also
showed positive correlation coefficients with localization factors, though the
coefficients were statistically insignificant. On the other hand, transportaion

equipment maquiladoras presented negative coefficients, although correlation with
the domestic input use variable was insignificant. Evidence for the textile industry
was inconclusive. The degree of maquiladora concentration was positively correlated
to population size in all industries, with the exception of the the electric and
electronic components industry. However, the correlation coefficient was only
significant in the electric/electronic goods industry; the coefficient was statistically
insignificant in the remaining four industries.
Our use of rank correlation coefficients provided insights into some of the
factors that may lead to industrial concentration. Nonetheless, the technique is
flawed in that it ignores pairwise correlation among the variables against which
location quotients are compared. In the next chapter, we apply a, multivariate
econometric model that takes into consideration pairwise correlation. Firthermore,
we constructed the model explicitly to account for urbanization and localization
factors and to provide clear evidence for or against localization economies.

Chapter 4
Industrial Concentration and its
Determinants
In this chapter, we present an econometric model to study the determinants of
industrial concentration. The model includes variables to account for the presence
of urbanization and localization economies in five maquiladora industries. Even
though the model is incapable of providing definitive evidence for or against
urbanization and localization economies, it does in fact point at industries were
agglomeration economies may be at work. Hence, the model is useful in indicating
where future research should focus.
The results obtained show that localization and urbanization economies and
diseconomies exist in some maquiladora industries.
4.1 Model
The formulation of the model presented in this section draws extensively from the
works of Moomaw (1988) and Henderson (1986); to a. lesser extent, it also considers
the work of Nakamura (1985). The models presented by these authors typically
consider some production function that includes the inputs used in the production
process (e.g., labor and capital) and a, term to account. for factors external to the
firm, but which may influence its output.

For any firm in a given industry and city, Mooinaw (1988) makes use of a
Cobb-Douglas (CD) production function with constant-returns to scale (CRS) of
the form
qj - alk -# (N, 1), (4.1)
where qj is firm i's output in a given period; i and ki are labor and capital inputs;
0 (N, V) is a function of external factors N, city size, and V, industry size; and a
and d are parameters. City size is expressed in terms of inhabitants; it may also be
given by the city's gross product, but such a figure is usually hard to obtain.
Industry size can be expressed either in terms of employment or value-added; both
variables were considered in this study.
The cost minimization first-order condition for any given output imnplies
Oqi _ ~ -' d=w = (dli 1k # 1(N, ), (4.2)
where w is the wage rate. By rearranging Equation (4.2) and summing over all firms
in the industry, as permitted by the CRS assumption, we obtain the industry's
labor demand function in each city (Moomaw, 1988); that is,
w(l -= ad# (N, ) k-, (4 3)
such that
L [ad# ( N,V , 1- K. (4.4)
By rearranging Equation (4.4) and taking (natural) logarithms, we obtain
regression Equation (4.5),
log - 1 d log (ad) + 1 d log 4 (N, V,,) + 1-dlog m. (4.5)
In order to estimate Equation (4.5), Mooiaw (1988) uses an external factor
function of the form 4 (N, V) = NbVc,and measures industry size by value added in

the city (V = E qi = Q). Thus, he estimates the following equation:
log (-)- ( I )log (ad)+ b log N+( c log Q+( d) log w, (4.6)K 1 -d 1d 1 -d 1 -d)
where value added minus payroll is used as a proxy for K. As indicated by Moomaw
(1988, p. 154), K is subject to measurement errors; Mooiaw argues that using K
as part of the dependent variable minimizes the negative effect of flawed measures of
K.
In this thesis, we estimated several variants of Equation (4.5) using different
functional forms for 0(-). In all instances the wage coefficient was positive (and
significant in three industries), implying that, as wages increase across cities, labor
is substituted for capital. We may consider that a high labor-deniand by the
maquiladora sector in a city bids up wages and that, thus, the positive wage
coefficient captures such effect. Nevertheless, the pairwise correlation coefficient
between employment and wages is negative in all industries. Furthermore, the
dependent variable in Equation (4.5) represents the substitution of labor for
capital-and not the amount of labor employed by an industry-as a function of
wages. Recalling the Heckscher-Ohlin model (section 2.1.1), we would exl)ect that
more capital would be used instead of labor as wages increase; that is, we would
expect a negative wage coefficient. Inefficient measures of K might have been
responsible for the wage coefficient's anomalous sign. In addition, the special nature
of maquiladora production possibly exarcebated the problem of using K.
Maquiladoras' main input is labor; other factors of production play only a minor
role. Thus, increases in the wage rate will not lead to significant substitution of
other inputs for labor in the short run. Therefore, an alternative regression equation
is necessary.
Moomaw (1988) derives another model based on the constant-elasticity of
substitution (CES) production function. The CES production function leads to a
labor demand function independent of the capital variable K. In its general form,

the CES production for firm i in a given industry is given by
qi =j [rl3 + (1 -r)k . (4.7)
Again, cost minimization requires
=w jr r + (1 -r) kS] (4.8)
Rearranging,
S (jr) [rl + (1 r)k w + (4.9)
Since ji/(1s) . -s/(+s), Equations (4.7) and (4.9) can be combined to produce
-s 1 -1
S 1j+- - rI+1 - +)- q?. (4.10)
Summing over all n firms in the industry and making use of the CRS nature
of the CES function, the labor-demand function for the industry is obtained:
--s 1 ~-1
L =j r -1w+ (+ -Q. (4.11)
Now, in order to introduce external factors into the labor-denmand( function
(Equation (4.11)), let j j' - # (N, V7), where 9 (-) is a function similar to that use(I
in the CD function (Equation (4.1), page 64). Hence, Equation (4.11) can be
rewritten as
L j+ rT -w+ - [# (N, V)]TTT Q, (4.12)
and its logarithmic form is
log L = a + #1 log w + log # (N, V) + log Q, (4.13)
where a (-) log j' + ) log r and 1, = (:).
Given that there is no theoretically-based functional form for #(-), we
experimented with four different functional forms: (i) #1 (N, V) =Nb cxpT; (ii)

0 2 (N, V) = exp+ ; (iii) #3 (N, V) = NbVC; and (iv) (t4 (N, V) - expN VC. Using
the four functional forms and two alternative measures for industry size V-value
added (Q) and employment (L)-we obtained five regression models (Appendix C).
Using cross-section data for each industry, the five models test for urbanization and
localization coefficients in each industry. The use of different functional forms yields
different combinations of the urbanization and localization variables. Models A and
B use a log-inverse and inverse-inverse combination of population and employment,
respectively; Models C, D, and E use log-log, log-inverse, and inverse-log
combinations of population and value added in the industry, respectively. Ideally,
each model should provide similar qualitative information; in practice, however, we
found that, while a model may yield significant estimates, other model's estimates
may be meaningless or even contradictory. Thus, rather than choosing one
particular model, we use all five models and derive conclusions based on those that
present significant estimates. Regression results are reported in Table C. t.
In order to account for potential correlation of somte of the independent
variables and the error term, we estimated the five regression equations by creating
instruments for the wage level and value added in the industry. After experimenting
with several combinations of geographic and industry-specific characteris tics, we
chose those variables that could account for a high percentage of the observed wages
and value added; that is, those variables that yielded high R 2 for the first-stage
least-squares regressions. In this manner, the instrumental variables were regional
dummies (border/non-border, east/central/western Mexico), the logarithm of
worker productivity (value added per worker) in the industry in each city, and the
proportion of employees (i.e., white-collar workers) with respect to total
employment as an index for the composition of the labor force. In addition, we
included the exogenous population and industry-size variables used in the
second-stage regression to create the instruments. All of these variables were
capable of explaining a high percentage of the observed wages an( value added; that
is, the R 2 for the first-stage least-squares regressions were high (close to one).
In computing the regression equations, we encountered two problemns. First,

the sample of cities used was very sniall, and, as a result, the equations' degrees of
freedom ranged from 10 to 12. Although many of the regressions' coeflicients were
significant at the 5% level, others were only significant at the 10% level, while others
were insignificant (Table C.1, Appendix C). Second, in addition to low significance
levels, high R2s were observed in all cases, suggesting the presence of
multicollinearity in the model (Ramanathan, 1989, p. 233). In some cases
multicollinearity appeared as the result of high correlation coefficients among some
of the independent variables. Unfortunately, since the models were structurally
derived, it was impossible to dispense with some of the correlated variables to solve
the problem of multicollinearity. Multicollinearity may also be solved by increasing
the sample size; again, such an alternative was not readily available since we had
already included the largest maquiladora centers in Mexico in the sample and other
cities that we had not included in the study would present relatively small industry
sizes.
Multicollinearity among explanatory variables increases the standard error of
the regression coefficients and reduces the coefficients' t-statistics (Pindyck and
Rubinfeld, 1991; Ramanathan, 1989). As a result, the regression coefficient tend to
be less significant, or insignificant altogether. Nevertheless, they remain unbiased,
efficient, and consistent, that is, they are still BLUE (best linear unbiased
estimators), and therefore, we can still use t-statistics for hypothesis-testing
(Ramanathan, 1989, p. 232-233). Thus, Ranmanathan (1989, p. 234) concludes that,
"if the regression coefficients are significant and have meaningful signs and
magnitudes, one need not be concerned about multicollinearity."
4.2 Results
Despite the small sample of cities and the associated multicollinearity of the model,
several of the regression coefficients we obtained and report in Table C.1 (Appendix
C) were significant at the 5% and 10% level. Thus, the results provide us with
qualitative information about the nature of agglomeration economies-either in the

form of localization or urbanization economies. We discuss the existence or
non-existence of external economies of agglomeration by analyzing the specific
experience of five maquiladora industries and comparing the regression results with
those presented in Chapter 3.
Textiles
For each of the five regression models, we obtained acceptable results for the textile
industry. First, all of them presented negative and significant wage coefficients,
implying that the demand for labor decreases as the wage level increases.
Furthermore, the wage coefficient was different from -1 and, thus, the localization
and urbanization parameters (c and b, respectively) are identifiable, provided the
corresponding coefficients are significant. Second, at least two coefficients were
statistically significant at the 5% level, with another coefficient being significant at
the 10% level. Third, all models presented high R 2 's. Although a, high Rl2 may
indicate the presence of multicollinearity, the existence of significant coefficients
allows us to test hypotheses regarding the existence of localization and ilrbanization
economies.
Maquiladoras in the textile industry showed signs of industrial localization.
Two regression models (A and B) presented significant localization parameters
(c > 0) at the 5% level; the remaining three models presented localization
parameters that were statistically insignificant. On the other hand, the evidence for
urbanization economies or diseconomies was inconclusive. Two models (C and D)
showed positive urbanization parameters significant at the 5% and 10% levels, while
another model (E) indicated urbanization diseconomies (4) < 0) significant at the 5%
level. As mentioned earlier, although the five different model variants should ideally
yield the same results, data imperfections and a small sample mnay result, in
contradictory regression coefficients.

Furniture
Results for the furniture industry were not as auspicious as those for the textile
industry. Student t-statistics tended to be lower, albeit significant at the 10% and
5% levels. More importantly, the wage coefficients were statistically equal to -1 in
three models (A, B, and C), thus creating an identification problem.1 Therefore, we
only look at results from models D and E.
Both models D and E showed evidence of urbanization economies at the 10%
level of significance. This contrasts with our results from Chapter 3, where
population size and industrial concentration were uncorrelated. On the other hand,
whereas in Chapter 3 we observed a positive correlation between both percent-input
use and technical-employment and industrial concentration, econometric results
showed no evidence of localization economies. As we mentioned earlier, the use of
rank-correlation coefficients between industrial concentration and city an d industry
characteristics may hide correlation among some of those characteristics.
Accordingly, econometric results may contradict rank- correlation results, because
the former do take into consideration correlation among independent variables.
Transportation equipment
All five models produced negative wage coefficients that are statistically equal to
zero (#1 0). A wage coefficient equal to zero may indicate that the demand for
labor remains indifferent to wage differences across Mexican cities. This does not
mean, however, that a firm in the industry has an inelastic demand for labor, but,
rather, that the industry is not concentrated in low-wage cities. On the other hand,
with the exception of one regression coefficient (logarithm of value-added), the
t-statistics for all coefficients in models A, B, and C, were insignificant. Models D
and E performed better, with significant coefficients at the 5% and 10% levels.
Therefore, we considered only models D and E in analyzing the transport ationl
equipment industry.
'See Appendix C, section C.1.1

According to the regression results for models D and E, transportation
equipment maquiladoras exhibited a marked tendency to agglomerate (ie to
localization economies. We have difficulty explaining the positive localization
parameters by looking at the input-use and labor-skill characteristics of the
transportation equipment industry. Transportation eqipmient niaquiladoras do not
stand out as intensive users of Mexican inputs and, consequently, of inputs supplied
by producers located in the city where the maquiladora plant locates. Furthermore,
the relative size of the transportation industry in a, given city does not seem
correlated with the use of domestic inputs (Table 3.4). Also, the use of technical
workers, assumed here to be a proxy of the skill-level of the work force, was
negatively correlated to LQ rank-i.e., to the relative size of the industry
(Table 3.4). We should note that the percentage of technical labor does not capture
other labor skills that may act as localization factors. For example, all workers, not
only technical employees, may possess the labor-skills required by the industry. A
city's blue-collar labor-force may possess a work ethic more amenable to
maquiladora production as the size of the inaquiladora sector increases. Industries
in which labor-training is more extensive and costly may then benefit from access to
workers who are accustomed umaquiladora activities.2 Therefore, if localization
economies indeed exist, future research should explore why transportation
equipment (and other industries) maquiladoras benefit from clustering in a city.
In addition, model E showed that urbanization economies are important in
the industry. The existence of urbanization economies contradicts the findings
presented in Table 3.4, which shows a negligible correlation between
population-rank and LQ-rank.
Electric and electronic goods
All five regression models exhibited wage regression coefhcients e(qual to -1. As a
result, we are unable to detect the sign and magnitude the urbanization and
2On the other hand, large concentrations of maquiladora employment may encourage laborturnover as a higher demand for labor decreases the search cost for jobs.

localization coefficients-i.e., all models are subject to identification problems. The
sample of cities with firms in the electric/electronic goods industry was the smallest
of all five five industries we have considered, so that might have explained the poor
results obtained in the model. Also, the industry was not well represented in the
sample relative to the national employment level. For instance, as we saw before,
only Juarez presents a concentration of firms in the area, above the national average.
In Chapter 3 we saw that there is a large correlation domestic input use and
the LQ-rank (Table 3.4); moreover, the LQ rank-correlation with respect to
technical employment was positive but statistically insignificant. With respect to
population size, there was again a positive correlation with the LQ in the sample of
cities. Unfortunately, we could not corroborate or reject those results. We need
follow up studies in order to understand whether input availability plays a. role in
driving industrial localization and to assess the importance of labor skills and
urbanization economies. Future studies should examine whether local suppliers exist
and the quality of local workers-engineers, technicians, managers-among other
potential localization and urbanization factors.
Electric and electronic components
Similar to the case of the electric/electronic goods industry, the electric and
electronic components industry was affected by the un(ler-identification )robleml;
two of the models (D and E), however, presented a wage coefficient greater than -1,
but smaller than zero. Furthermore, models D and E displayed higher 1-statistics
than the other three models; thus, we preferred models D and E over the remaining
models.
Models D and E pointed to the existence of localization economies at the 5%
level of significance. Although, in Table 3.4, we observe a positive correlation
between concentration and localization factors, the correlation is not signiicant.
Thus, further studies are needed to determine whether input-use or skilled-labor
availability, or both, account for the localization economies in the electric/electronic
components industry.

Table 4.1: Relevant agglomeration factors in five maquiladora industries
Localization UrbanizationIndustry Economies Economies
Textiles Economies Inconclusive
Furniture Negligible Economies
Transportation equipment Economies Economies
Electric and electronic goods Faulty model
Electric and electronic components Economies Negligible
Source: Calculated from INEGI data.
The evidence for urbanization economies was negligible in models D and E,
implying that electric/electronic component maquiladoras are insensitive to city
size. Moreover, our results from Chapter 3 show negative correlation, albeit
statistically insignificant, between population size and relative concentration.
Although we cannot make any definitive statements from statistically insignificant
results, the rank-correlation coefficient's negative sign would hint at the existence of
urbanization diseconomies.
4.3 Summary
In this chapter, we used an econometric model that accounts for the existence of
external economies of localization and urbanization. We posed several variants of
the model according to different functional specifications for external factors and run
each variant for five different maquiladora industries in 14-16 metropolitan areas.
The regression results-summarized in Table 4.1-suggest that localization
economies are important in at least three of the industries: textiles, transportation
equipment, and electric/electronic components. In contrast, evidence for the
furniture industry seemed negligible. Urbanization economies appeared to be

significant for the furniture and transportation equipment industries; in contrast,
the electric/electronic components and textile industries seemed unaffected by city
size. Regression results were not applicable to the electric/electronic goods industry.
Nonetheless, we may challenge the above results because the regression
models and the data we used to compute them had several deficiencies. First, the
models were affected by multicollinearity among the independent variables. Second,
the sample-size was fairly small ranging from 14 to 16 cities; consequently, the
number of degrees of freedom was small. Third, our proxies for localization and
urbanization factors might have been imperfect. Finally, some of the model-variants
yielded contradictory results. As a result, we had difficulty making any (efinite
conclusions about the presence, or lack thereof, of localization and urbanization
economies, or, if they indeed exist, why they may arise.
The results we obtained in this chapter, however, shed light on which
industries may potentially be exhibiting a tendency to agglomerate due to the
existence of localization economies. In order to determiine what the drivinig factors
behind localization are-or whether localization is occurring at all-further studies
are needed. By focusing on the three industries that appear to be influenced by
localization economies and that we have identified in this study, we may learn more
about the relationship between the maquiladora sector and its host communities.
Moreover, in future studies, we should not only look at aggregate industrial data, as
we have done, but we must also consider more detailed data for the industry, as well
as firm-specific data. In the next chapter, we present somime of the issues that a. study
of the maquiladora sector should consider.

Chapter 5
Conclusions
5.1 Summary
In this thesis, we explored the way in which inaquiladoras-or offshore assembly
plants-relate to the economies of those communities where they locate. We focused
on above-average concentrations of maquiladora plants in the same indlstry and
tested for localization economics as the driving factor behind industrial
concentration.
We deemed localization economies important because they would indicate
that some maquiladora industries have established inkages to their host
communities. Those linkages could take the form of backward linkages-i.e., the
purchase of local material inputs-or the need for specialized labor skills by the
industry. Linkages help spur economic growth because maquiladora benefits are not
restricted to direct employment creation, but foster employment growth in other
industries as well. The existence of linkages also decreases the footloose character of
assembly production and prevents maquiladoras from migrating to lower-wage
communities. This is particularly important given changes in the global character of
industrial production-automation, flexible productionl schemes-that threaten to
shift offshore assembly production back to the industrialized world.
We analyzed data for five iaquiladora industries through the use of
econometric models that accounted for external economics of agglomeration. We

included localization and urbanization economies into the models as potential
agglomerative forces. The former imply that, as the size of the industry increases,
the average costs of any firm in it fall; the latter mean that any firm benefits from
locating in large cities where services and inputs are readily available to all
industries. As argued above, we paid particular attention to the existence of
localization economies.
There is some evidence for the presence of localization economies in three
industries (textiles, transportation equipment, and electric and electronic
components). In contrast, evidence of localization economies in the furniture
industry was negligible, while results for the electric and electronic goods industry
did not allow us to identify localization economies or diseconomies. On the other
hand, urbanization economies seemed significant for the furniture and
transportation equipment industry, while they were unimportant in the
electric/electronic components industry. Again, results for the electric/elect ronic
goods industry were not meaningful.
While the econometric models we used provided us with some indication of
which factors drive industrial concentration, the models were affected by several
problems-multicollinearity, a small sample-size, low t-statistics. Furthermore, the
models were not capable of distinguishing what determinants of localization
economies. To bridge such shortcoming of the models, we studied the way in which
industry and city characteristics varied with the degree of industrial concentration,
as measured by the use of location quotients. To that effect, we computed
rank-correlation coefficients and tested for statistical significance. Unfortunately,
several of those coefficients were statistically insignificant. Moreover, they
sometimes contradicted our econometric results, preventing us from identifying
what the factors behind industrial concentration and localization are. Heice, we
end up by analyzing what research steps would be needed to understand better why
maquiladoras may tend to cluster and what the implication of such clustering may
be for local economies.

5.2 Policy implications
Fostering an increase in the overall level of maquiladora production in a city helps
create employment opportunities for the city's population. Nevertheless, if
industries are attracted to a locality solely because of a large supply of inexpensive
labor, maquiladoras would find it easy to move elsewhere if wages increased or if
technological and organizational changes in the industry made unskilled Ilabor
dispensable. In contrast, local governments may find it profitable to pronote local
economic development by targeting industries with a tendency to localize.
As stated earlier, localization offsets footlooseness. The existence of
localization economies in some inaquiladora industries suggests that it is possible to
attract maquiladora plants to a city and to create maquiladora employment based
on factors other than low wages. Therefore, a rise in wages will not be paralleled by
relocation to lower-wage sites; instead, the decline in average costs that arises from
the availability of local inputs or specialized skills-the factors behind
localization-may be large enough so as to compensate for wage increases.
Furthermore, even if an industry is unaffected by localization economies, the
existence of above-average industrial concentrations could be exploited, to the
community's benefit, by providing incentives for the creation of local suppliers.
Hence, knowledge about which industries present a, tendency to localize is not
enough. Information is also needed on the relationship between the different
maquiladora industries and their host communities.
The need to understand the relationship that exists between maqniladoras
and their host communities is important for at least two reasons. First, the
unintegrated character of maquiladora production has prevented it from becoming a,
springboard for further economic development. Integration in this context is
understood as the existence of strong linkages between the maquiladora sector and
the host communities in the form of increased local sourcing of muateria] inputs,
transfer of technology that otherwise would not be available to the conunituiity, and
labor skill upgrading as maquiladoras implement labor-training programs. Hence, it

is important to evaluate which industries have the largest potential to integrate and
which mechanisms and strategies are available to local. policy makers to foster
integration.
A second reason to study the relationship between local economies and
maquiladora production is to understand how assembly plants are adapting to
changes in the technological and organizational structure of global industrial
production. If maquiladoras fail to adapt to those changes, they may remain largely
incapable of spurring long-term economic growth in their host communities.
However, the introduction of new production techniques in maquiladora production
does not guarantee such growth; indeed, they may remain an export enclave.
Nonetheless, it was not within the scope of the thesis to provide a. deeper
understanding of industry and city characteristics that favor localization. Ii order
to shed light on the factors that may foster industrial growth and concentration in a,
given city, more data and studies are needed. Thus, we conclude by presenting an
agenda for further research.
5.3 Agenda for further research
We consider two future research directions. First, a study on how the maquiladora
sector and industries in it are related or linked to the local economy of a particular
city. In the study, we would try to identify the extent to which forward and
backward linkages between the maquiladora sector and the local economy have been
established, and the kinds of structural barriers that prevent stronger linkages and
further integration to the community. In addition, we would look at the kind of
initiatives and programs that have been put, or are, in place to foster the creation of
linkages. Second, we would look at how maquiladoras are adapting to changes in the
organizational and technological structure of global production. Here, we would
consider the adoption of new technologies and interfirm cooperation arrangements
and, if their adoption is indeed occurring, their effect on host communities. The
research agenda we present considers elements of both approaches, but places a

greater emphasis on the study of maquiladoras and local linkages.
How can we study the implications of global changes in industrial production
on maquiladora communities? How could economic growth be promoted? An
answer to these questions requires an inquiry into the way in which maquiladoras at
the local level interact with each other, with local industry, with the local labor
force-i.e., the people of the community-and with local institutions.
In studying the constraints on greater integration and of the implications of
new trends in global production, we suggest looking at the following:
1. Firm-specifc characteristics: It is necessary to know how the age of different
plants, their size, and other characteristics of the firm influence its use of new
technologies, labor-training programs, cooperative arrangements with other
firms, etc. Some of the questions that we propose answering are:
(a) Is automated technology being used?
(b) Which flexible production technologies and techniques are being used
(just-in-time inventorying; statistical control processing)?
(c) What type of labor-training programs are being implemented?
(d) How does the use of new technologies affect firms' integration to the localeconomy?
(e) What kind of inputs are purchased?
(f) How do input purchases vary with firm characteristics?
2. Industry-specific characteristics: Industries that make ip the inaquiladora
sector present different degrees of integration to the local comnmunities. They
may purchase different amounts of inputs from domestic suppliers. They may
also require different degrees and kinds of labor skills; for instance, textile
maquiladoras may employ largely unskilled workers that can be trained
rapidly, while some, but by no means all, electronics maquiladoras require
larger numbers of engineers and technicians. Although differences iti(ced exist
between firms within the same industry, by focusing on specific
industries-rather than on the maquiladora sector as a whole-we tmay

identify those industries that have established, or those that present a greater
potential to establish, linkages to their host communities.
For an industry analysis, we must consider the way in which firms in the
industry interact with each other; that is, the type of interfirm transactions
and forms of cooperation, the existence of subcontracting networks in the
locality, etc. In addition, we must consider how different maquiladora
industries relate to each other and to the local industrial base.
3. Locational factors: Of particular relevance to the study is the identification of
locational attributes specific to each community that attract a given kind of
maquiladora industry. Doeringer and Terkla (1990) use the term iniu'sibic
factors to refer to city-specific characteristics-other than input cost and
availability-that influence a firm's location choice. Invisible factors include
labor-force quality, labor-management relations, and interfirm cooperative
arrangements (Doeringer and Terkla, 1990, p. 492). They argue that
development efforts should exploit the existence of those factors as a. basis for
local economic development. Therefore, the following questions should be
answered:
(a) Does the existence of other plants in the same industry influence thelocation decision of a maquiladora?
(b) Are local labor skills a determining locational factor?
(c) Besides labor availability, which factors influence a firm's locationdecision?
4. Government policies: Local governments should explore which kind of
structural and institutional constraints have prevented imlaquiiladoras from
purchasing a larger proportion of their inputs from local firms.
(a) What factors prevent naquiladoras from purchasing more inp)lts?
(b) Are there any programs in place to increase local input use?
(c) Why have previous efforts to integrate the maquiladora into the localeconomy failed?

(d) Do firms have any suggestions as to whicli kind of programs couldincrease integration into the local economy?
Future policy regarding maquiladora production in Mexico should be base(d
on a systematic analysis of the factors mentioned above. An indiscriminate policy to
foster maquiladora employment creation is less promising than a concerted strategy
to ground global capital to the local economies of Mexican host communities, i.e., to
offset footlooseness by creating local linkages. If the maquiladora sector is
successfully integrated into the Mexican economy-boti at the local an( national
level-maquiladoras will propel and multiply employment an( economic growth.
Otherwise, maquiladora communities will continue to suffer the social costs of
assembly production, while foregoing long-lasting economic development.

Appendix A
Maquiladora industries
In this appendix, we present a list of maquiladora industrial categories, as used by
INEGI. The industries we analyzed in this study are indicated by an asterisk.
1. Selection, preparation, packing, and canning of food.
2. Cloth and other textile products assembly.*
3. Shoe and leather industry.
4. Assembly of furniture and its accessories and other wood and metal products.*
5. Chemical products.
6. Construction, re-construction, and assembly of transport equipmient and itsaccessories.*
7. Assembly and repair of tools, equipment, and their parts, except electric.
8. Assembly of electric and electronic machinery, equipment, apparatus, andgoods.*
9. Electric and electronic materials and accessories.*
10. Assembly of toys and sports goods.
11. Other manufacturing industries.
12. Services.

Appendix B
Geographic profile
We applied the techniques presented in Chapter 3 to data on the regional
characteristics of the maquiladora sector in a sample of 17 Mexican cities (see
Figure B-1). In Table B.1, we present information pertaining to each industry in the
sample of cities. In addition, in Table B.2 in this appendix, we report the location
quotients for five maquiladora industries, ranking cities from highest to lowest
location quotient. We also report the industry's employment share at each locality.
Finally, in Table B.3, we show the localization coefficients for each of the five
industries.

Maquiladora Cities
15 UNITED STATES OF AMERICA g. AcuPia16 2. Agua Prieta
8 3. Chihuahua4 4. Ensenada
6* 5. Hermosillo10 2 6. Juirez
7. Matamoros8. Mexicali
50 1 9. Monterrey3 110. Nogales
11. Nuevo Laredo12. Piedras Negras13. Reynosa14. Saltillo
00 14 9 13 7 15. Tecate17 16. Tijuana
17. Torre6n
MEXICO GULF OFMEXICO
PACIFICOCEAN
Figure B-1: Cities considered in the study

Table B.1: Maquiladora sector's regional characteristics (1990 figures)
Municipality Number of Number of Value added % domestic % domestic % technicalIndustry firms workers in Mexico inputs (total) inputs (VA) workers
National totalFoodTextilesShoe and leatherFurnitureChemical productsTransportation equipmentTools and equipmentElectric/electronic goodsElectric/electronic componeiToysOther industriesServices
AcunaFoodTextilesShoe and leatherFurnitureChemical productsTransportation equipmentTools and equipmentElectric/electronic goodsElectric/electronic componerToysOther industriesServices
Agua PrietaFoodTextilesShoe and leatherFurnitureChemical productsTransportation equipmentTools and equipmentElectric/electronic goodsElectric/electronic componeiToysOther industriesServices
ChihuahuaFoodTextilesShoe and leatherFurnitureChemical productsTransportation equipmentTools and equipmentElectric/electronic goodsElectric/electronic componeiToysOther industriesServices
EnsenadaFoodTextilesShoe and leatherFurnitureChemical productsTransportation equipmentTools and equipmentElectric/electronic goodsElectric/electronic componeiToysOther industriesServices
1,93846
28951
26588
15834
105396
2937386
475,7627,966
42,0367,318
30,7116,885
98,9224,960
53,359127,04710,69865,86719,995
10,127,911,750.0264,120,361.0566,591,261.0126,293,567.0565,368,115.0161,794,213.0
2,555,515,475.0125,481,070.0
1,183,729,776.02,626,879,298.0
254,021,865.01,406,560,672.0
291,556,077.0
39 14,276 196,990,568.0
n.i. n.i. n.l.3 1,078 13,680,745.05 272 5,467,583.0
n.i. n.l. n.i.3 4,161 60,241,755.0
n.i. n.i. n.i.n.l. n.. n.i.
8 3,759 57,214,440.03 1,064 14,200,984.0
12 1,670 21,236,2385 2,272 24,948,823.0
5,738
n.l.
n.i.n.i.n.i.n.i.n.i.
1,793
82,088,071
n.i.
n.l.n.i.n.i.n.l.n.l.
32,009,147
3,945 50,078,924n.i. n.l.
29,819 625,139,081.0
1,362 16,025,187.0
n.i.n.i.
12,77356
2389,780
n.l.n.i.
314,295,993.02,012,534.05,224,097.0
188,636,226.0
3,072 53,149,6572,538 45,795,387.0
3,871 124,487,546
247 3,260,44112 63,000
461 80,237,819n.i. n.i.n.i. n.i.
806 12,355,658n.i. n.l.
2,170 26,517,563
1.5820.800.872.383.38
10.170.921.361.350.740.324.422.33
3.689.511.465.396.345.662.373.724.591.910.737.752.32
n.i.0.020.040.900.71
0.19
1.07
3.86
n.i.n.i.
0.2817.8512.31
0.11
0.8617.74
4.06
3.710.000.00
0.116.86
10.819.629.427.49
11.9910.8114.1114.0711.809.736.20
11.76
n.l.17.639.56
n.l.11.44
n.i.n.i.
14.989.407.848.27
22.87
n.l.
n.i.n.i.n.i.n.i.n.i.
23.20
10.23n.i.
13.36
11.09
n.l.n.l.
12.177.14
21.0115.19
17.428.12
32.37
37.650.00
90.89n.i.n.i.
11.66n.l.
33.90
2.66
7.82
n.i.n.j.
0.6620.428.210.33
2.5922.74
Notes: (1) n.i. = figures are not included due to confidentiality restrictions (2 or less plants in the industry). The number of finms and workers,and value added are included under "other industries"; nevertheless, the percentage of domestic inputs and technical workersin "other industries" do not account for the unincluded industries.
(2) Two dashes (--) indicate that the industry did not exist in the municipality in 1990.(3) The value of domestic inputs purchased by the industry as a percentage of total inputs is given under "% domestic inputs total (total)."(4) The value of domestic inputs purchased by the industry as a percentage of value added is given under "% domestic inputs total (VA)."(5) National domestic-input and technical-employment percentages are given for 1989; all other figures are for 1990.(6) Value-figures are given in Mexican pesos.
Source: INEGI.
85

Table B.1 (continued): Maquiladora sector's regional characteristics (1990 figures)
Municipality Number of Number of Value added % domestic % domestic % technicalIndustry firms workers in Mexico inputs (total) inputs (VA) workers
HermosilloFoodTextilesShoe and leatherFurnitureChemical productsTransportation equipmentTools and equipmentElectric/electronic goodsElectric/electronic componetToysOther IndustriesServices
JuarezFoodTextilesShoe and leatherFurnitureChemical productsTransportation equipmentTools and equipmentElectric/electronic goodsElectric/electronic componetToysOther IndustriesServices
MatamorosFoodTextilesShoe and leatherFurnitureChemical productsTransportation equipmentTools and equipmentElectric/electronic goodsElectric/electronic componeiToysOther industriesServices
Monterrey (Metropolitan area)FoodTextilesShoe and leatherFurnitureChemical productsTransportation equipmentTools and equipmentElectric/electronic goodsElectric/electronic componetToysOther industriesServices
MexicaliFoodTextilesShoe and leatherFurnitureChemical productsTransportation equipmentTools and equipmentElectric/electronic goodsElectric/electronic componeiToysOther industriesServices
3,744 54,495,417
575 14,509,102
n.l. n.i.
2,999 38,928,305
124,0611,0389,135
9067,562
87933,655
70116,28139,352
6,7147,838
37,870n.i.
2,306
4761,214
13,737721ni.
16,279
2,691,380,134.041,597,079.0
159,404,063.020,712,833.0
218,410,534.013,391,868.0
772,764,098.015,858,993.0
342,813,638.0849,215,361.0
139,348,751.0117,862,916.0
1,350,391,532.0n.i.
35,516,268.0
10,681,654.022,256,210.0
352,043,373.021,140,159.0
n.i.846,631,533.0
2,905 54,770,143222 5,245,091.0
6,013n.i.n.i.n.i.
226n.i.
2,535n.i.n.l.n.i.
1,0151,272
n.l.
21,8201,1243,397
2,895
2,409955
1,7504,755
8333,425
276
163,554,304.0n.i.n.l.n.i.
8,067,275.0n.i.
52,564,161.0n.i.n.l.n.i.
26,881,742.044,835,702
n.i.
683,913,40613,160,85549,197,460
289,202,048
60,663,73815,384,80725,499,226
158,850,87012,127,01253,454,2476,366,143
Notes: (1) n.i. = figures are not included due to confidentiality restrictions (2 or less plants in the industry). The number of firms and workers,and value added are included under "other industries"; nevertheless, the percentage of domestic inputs and technical workersin "other industries" do not account for the unincluded industries.
(2) Two dashes (--) indicate that the industry did not exist in the municipality in 1990.(3) The value of domestic inputs purchased by the industry as a percentage of total inputs is given under "% domestic inputs total (total)."(4) The value of domestic inputs purchased by the industry as a percentage of value added is given under "% domestic inputs total (VA)."(5) National domestic-input and technical-employment percentages are given for 1989; all other figures are for 1990.(6) Value-figures are given in Mexican pesos.
Source: INEGI.
0.60
1.87
n.i.
n.i.n.l.
0.00
2.7557.270.10
13.284.320.100.900.593.731.44
1.493.05
3.30n.i.
0.02
11.511.477.76
10.08n.i.
0.66
12.7327.35
19.19n.i.n.i.n.i.
43.62n.i.
0.49n.i.n.i.n.i.
20.1321.85
ni.
1.7216.070.04
0.45
5.900.001.102.301.721.100.11
18.56
29.57
n.l.
n.l.n.i.
11.02
13.167.51
14.306.29
15.2611.4914.848.279.95
14.61
13.493.88
10.57n.i.
6.76
14.716.678.92
17.34n.l.
12.83
9.592.70
9.66n.i.n.i.n.i.
9.29n.i.
6.63n.i.n.i.n.i.
0.3022.41
n.i.
23.352.05
31.65
46.63
20.928.389.20
17.1036.6122.0710.51
n.i.n.l.
0.00
0.9919.070.025.431.610.020.350.181.390.46
0.754.50
0.97n.i.
0.00
7.251.120.994.62
n.i.0.53
6.141.45
9.65n.L.n.i.n.i.
0.00n.i.
0.16n.l.n.i.n.i.
74.8515.12
ni.
3.340.000.18
11.61
4.560.000.513.861.461.110.33

Table B.1 (continued): Maquiladora sector's regional characteristics (1990 figures)
Municipality Number of Number of Value added % domestic % domestic % technicalIndustry firms workers in Mexico inputs (total) inputs (VA) workers
--- --- -- - -- --- --- -- --- --- -- - -- --- --- - - --- --- -- --- --- --- -- --- --- -- --- --- -- --- --- --- --1.05 -- -- 20.64---Nogales
FoodTextilesShoe and leatherFurnitureChemical productsTransportation equipmentTools and equipmentElectric/electronic goodsElectric/electronic componeiToysOther IndustriesServices
Nuevo LaredoFoodTextilesShoe and leatherFurnitureChemical productsTransportation equipmentTools and equipmentElectric/electronic goodsElectric/electronic componeiToysOther industriesServices
Piedras NegrasFoodTextilesShoe and leatherFurnitureChemical productsTransportation equipmentTools and equipmentElectric/electronic goodsElectric/electronic componeiToysOther IndustriesServices
ReynosaFoodTextilesShoe and leatherFurnitureChemical productsTransportation equipmentTools and equipmentElectric/electronic goodsElectric/electronic componeiToysOther industriesServices
SaltilloFoodTextilesShoe and leatherFurnitureChemical productsTransportation equipmentTools and equipmentElectric/electronic goodsElectric/electronic componeiToysOther industriesServices
17,909n.i.
1,241n.i.n.i.n.l.
1,147n.i.n.i.
10,296
5,225
218,860,858n.i.
19,631,900n.i.n.i.n.i.
19,885,194n.l.n.i.
120,464,155
58,879,609
49 15,773 316,081,383.0
n.l. n.l.358 5,824,362.0592 5,539,822.0
8,028 210,884,871.0
n.i.1,780
n.l.32,969,259.0
5,010 60,841,043n.i. n.i.
7,156 97,812,287.0564 7,919,052.0
2,358 27,469,306.0
n.i.n.l.n.i.
n.i.1,461
n.i.2,773
n.i.
23,437n.i.
825n.i.
290150
5,142615
1,93011,656
n.i.n.n.l.
n.i.20,458,060.0
n.l.41,965,869
n.i.
462,167,951.0n.i.
10,860,993.0n.i.
4,652,459.01,576,398.0
117,349,568.017,207,135.040,001,791.0
199,628,226.0
2,829 70,891,381n.i. n.i.
1,227 44,457,255.0
ni.
27,147,561.0
n..
Notes: (1) n.i. = figures are not included due to confidentiality restrictions (2 or less plants in the industry). The number of firms and workers,and value added are included under "other industries"; nevertheless, the percentage of domestic inputs and technical workersin "other industries" do not account for the unincluded industries.
(2) Two dashes (--) indicate that the industry did not exist in the municipality in 1990.(3) The value of domestic inputs purchased by the industry as a percentage of total inputs is given under "% domestic inputs total (total)."(4) The value of domestic inputs purchased by the industry as a percentage of value added is given under "% domestic inputs total (VA)."(5) National domestic-input and technical-employment percentages are given for 1989; all other figures are for 1990.(6) Value-figures are given in Mexican pesos.
Source: INEGI.
87
0.82
ni.1.221.990.26
n.l.0.86
4.59ni.
1.360.050.00
ni.n.i.n.l.n.i.
n.l.0.05ni.
5.12ni.
1.61n.l.
0.02n.l.
2.270.030.075.760.690.26
3.37n.i.
1.05n.i.
0.00n.i.n.i.n.l.
0.00
2.46
n.l.2.632.440.84
n.l.3.05
11.90n.i.
2.600.180.00
ni.n.i.n.i.
n.l.0.10
n.i.5.48ni.
7.21ni.
0.04n.l.
10.580.130.34
14.383.431.42
11.51ni.
16.60
n.i.
7.28
n.i.
20.64n.l.
11.44n.l.n.i.n.i.
18.57n.l.n.i.
20.00
23.09
14.11
n.l.12.0112.6716.78
n.i.17.53
11.59n.i.
12.5915.4313.74
n.i.n.l.n.i.
n.l.12.18
n.l.10.80
n.l.
11.42n.l.
8.73ni.
5.8616.679.98
28.299.48
10.93
16.85n.l.
14.34
n.
11.72
n.i.

Table B.1 (continued): Maquiladora sector's regional characteristics (1990 figures)
Municipality Number of Number of Value added % domestic % domestic % technicalIndustry firms workers in Mexico inputs (total) inputs (VA) workers
Tecate 48 7,575 112,361,825 0.28 0.23 33.89Food
Textiles n.i. n.i. n.i. n.i. n.i. n.i.Shoe and leather
Furniture 14 3,514 49,618,340 0.13 0.22 44.99Chemical products 4 552 8,295,473 0.01 0.00 19.02Transportation equipment 3 137 1,526,015 0.00 0.00 66.42Tools and equipment n.i. n.i. n.i. n.i. n.i. n.i.Electric/electronic goods n.i. n.i. n.l. n.i. n.i. n.l.Electric/electronic componel 16 1,323 22,387,937 0.44 0.08 12.02Toys -
Other industries 8 1,794 27,498,636 0.22 0.01 30.09Services 3 255 3,035,424 0.00 0.00 5.88
Tijuana 319 59,614 955,428,645 0.77 0.79 20.28Food 3 301 6,645,807 37.08 0.12 6.64Textiles 35 3,330 38,248,711 3.37 0.85 33.78Shoe and leather 6 1,018 11,712,068 1.31 0.07 42.44Furniture 78 12,727 340,424,342 5.67 1.12 22.71Chemical products 24 4,636 35,924,467 0.44 0.42 31.62Transportation equipment 11 1,459 22,510,225 1.02 0.50 34.61Tools and equipment 6 664 8,674,706 0.25 1.20 36.30Electric/electronic goods 15 4,697 67,969,638 0.05 0.03 17.59Electric/electronic componel 84 17,697 240,801,644 0.15 0.42 14.46Toys 7 3,442 47,030,648 3.94 2.58 15.02Other industries 32 7,755 108,600,377 0.79 0.30 14.66Services 18 1,888 26,886,012 1.64 1.55 19.70
Torreon-Gomez-Lerdo 51 8,288 91,942,140.0 5.20 7.92 8.10Food
Textiles 44 7,421 66,113,897.0 2.47 4.14 7.75Shoe and leather -- -FurnitureChemical products -- -- -
Transportation equipment n.i. n.i. n.i. n.i. n.i. n.l.Tools and equipmentElectric/electronic goods -Electric/electronic componeiToys n.l. n.i. n.l. n.l. n.i. n.i.Other industries 7 830 23,896,719 0.00 37.28 7.03Services n.L n.i. n.i. n.l. n.i. n.l.
Notes: (1) n.i. = figures are not included due to confidentiality restrictions (2 or less plants in the industry). The number of finns and workers,and value added are included under "other industries"; nevertheless, the percentage of domestic inputs and technical workersin "other industries" do not account for the unincluded industries.
(2) Two dashes (--) indicate that the industry did not exist in the municipality in 1990.
(3) The value of domestic inputs purchased by the industry as a percentage of total inputs is given under "% domestic inputs total (total)."(4) The value of domestic inputs purchased by the industry as a percentage of value added is given under "% domestic inputs total (VA)."(5) National domestic-input and technical-employment percentages are given for 1989; all other figures are for 1990.(6) Value-figures are given in Mexican pesos.
Source: INEGI.

Table B.2: Location quotients
Location quotients in terms of:Industry --------------------------------------------------- Employment
Municipalities Employment Value added Number of firms share--------------------------------------------------------------------------------------------------------------Textiles
Torreon-Gomez Palacio-Lerdo 10.134 12.865 5.785 17.7%Piedras Negras 3.729 5.024 1.048 5.6%Mexicali 1.762 1.287 1.497 8.1%Hermosillo 1.738 4.763 2.794 1.4%Agua Prieta 0.984 1.245 0.610 1.2%Juarez 0.833 1.060 0.789 21.7%Nogales 0.784 1.605 0.536 3.0%Ensenada 0.722 0.469 1.006 0.6%Matamoros 0.689 0.471 0.245 5.5%Tijuana 0.632 0.716 0.736 7.9%Chihuahua 0.517 0.459 0.975 3.2%Reynosa 0.398 0.420 0.402 2.0%Tecate 0.356 1.054 0.140 0.6%Monterrey (Metropolitan area) 0.207 0.181 0.216 0.3%Acuna 0.170 0.188 0.172 0.5%Nuevo Laredo 0.004 0.001 0.000 0.0%Saltillo 0.000 0.000 0.000 0.0%
FumitureTecate 7.186 7.918 2.133 11.4%Tijuana 3.307 6.388 1.788 41.4%Mexicali 2.055 7.582 0.718 9.4%Ensenada 1.845 11.557 1.097 1.5%Juarez 0.944 1.455 0.737 24.6%Hermosillo 0.703 0.347 0.000 0.6%Monterrey (Metropolitan area) 0.582 0.884 0.944 0.7%Nuevo Laredo 0.352 0.330 0.746 1.2%Acuna 0.295 0.498 0.938 0.9%Matamoros 0.195 0.142 0.624 1.5%Reynosa 0.192 0.180 0.878 0.9%Saltillo 0.152 0.049 1.045 0.0%Piedras Negras 0.102 0.155 0.229 0.2%Agua Prieta 0.067 0.026 0.332 0.1%Nogales 0.023 0.340 0.146 0.1%Chihuahua 0.001 0.000 0.133 0.0%Torreon-Gomez Palacio-Lerdo 0.000 0.000 0.000 0.0%
Transportation equipmentSaltillo 3.712 2.422 8.761 1.0%Nuevo Laredo 2.448 2.647 4.005 8.1%Chihuahua 2.028 1.994 1.561 12.9%Monterrey (Metropolitan area) 1.962 1.275 1.187 2.6%Matamoros 1.745 1.034 2.543 13.9%Acuna 1.402 1.213 0.944 4.2%Juarez 1.305 1.139 1.288 34.0%Agua Prieta 1.259 0.907 1.115 1.5%Reynosa 1.055 1.007 0.981 5.2%Mexicali 0.531 0.352 1.205 2.4%Nogales 0.308 0.360 1.227 1.2%Piedras Negras 0.238 0.377 0.767 0.4%Torreon-Gomez Palacio-Lerdo 0.173 0.269 0.241 0.0%Tijuana 0.118 0.093 0.423 1.5%Ensenada 0.112 0.033 0.613 0.1%Tecate 0.087 0.054 0.767 0.1%Hermosillo 0.000 0.000 0.000 0.0%
---------------------------------------------------------------------Source: Calculated from INEGI data.

Table B.2 (continued): Location quotients
Location quotients in terms of:Industry -------------- ----------------------------------------------------- Employment
Municipalities Employment Value added Number of firms share
Electric and electronic goodsSaltillo 1.235 2.782 0.000 0.3%Juarez 1.170 1.091 2.016 30.5%Reynosa 0.734 0.741 1.477 3.6%Mexicali 0.715 0.319 1.318 3.3%Tijuana 0.703 0.609 0.868 8.8%Agua Prieta 0.659 1.002 1.678 0.8%Hermosillo 0.553 0.609 1.538 0.4%Nogales 0.376 0.139 0.738 1.4%Monterrey (Metropolitan area) 0.138 0.134 1.191 0.2%Nuevo Laredo 0.110 0.117 0.377 0.4%Chihuahua 0.071 0.072 1.678 0.4%Piedras Negras 0.044 0.066 1.154 0.1%Tecate 0.044 0.021 0.385 0.1%Matamoros 0.034 0.014 0.225 0.3%Acuna 0.016 0.017 0.473 0.0%Ensenada 0.000 0.000 0.000 0.0%Torreon-Gomez Palacio-Lerdo 0.000 0.000 0.000 0.0%
Electric and electronic componentsNogales 2.153 2.124 2.055 8.1%Reynosa 1.862 1.667 1.272 9.2%Matamoros 1.610 2.425 1.492 12.8%Chihuahua 1.234 1.505 1.780 1.4%Juarez 1.228 1.164 1.068 7.7%Agua Prieta 1.188 1.218 1.419 31.0%Tijuana 1.112 0.973 1.289 13.9%Acuna 0.986 1.121 1.004 3.0%Mexicali 0.816 0.896 0.874 3.7%Ensenada 0.780 0.383 0.734 0.6%Piedras Negras 0.765 0.807 1.071 1.1%Tecate 0.654 0.769 1.631 1.0%Hermosillo 0.552 0.789 0.816 0.4%Nuevo Laredo 0.423 0.403 0.599 1.4%Monterrey (Metropolitan area) 0.148 0.070 0.158 0.2%Saltillo 0.000 0.000 0.000 0.0%Torreon-Gomez Palacio-Lerdo 0.000 0.000 0.000 0.0%
--------------------------------------------------------------------Source: Calculated from INEGI data.

Table B.3: Localization coefficients
Industry
Textiles
Furniture
Transportation equipment
Electric and electronic goods
Electric and electronic components
Source: Calculated from INEGI data.
LocalizationCoefficient
(Employment)
0.289
0.452
0.303
0.229
0.164
---------------------------------------------------------
------------

Appendix C
Regression results
C.1 Regression equations
In Chapter 4, we used a constant elasticity of substitution (CES) production
function for a firm to derive the labor-demand function for an industry at a
particular location [See Section 4.1]. We introduced external economies of
agglomeration as a function # = # (N, V7), were N represents population and is use a
measure of urbanization and V represents industry size, either in terms of value
added Q or employment L. Given that there is no theoretically defined functional
form for #(-), we experimented with different functional forms to produce five
regression models. We report results for all of them and use those that present
significant regression coefficients. Below, we present the models along with the
functional form being used and the elasticities of city and industry size, -N and V,
respectively. The elasticities of city and industry size show the percent change in a,
firm's output as a result of a 1% increase in city size N and industry size V,
respectively. Mathematically,& log q
EN=Blog N
and
F logq-a log V
Finally, for each model, we present the criteria for testing the significance of

localization and urbanization coefficients. In all cases, a = (1) log ' + ) log r
and #1 = ); the rest of the coefficients vary from model to model.
Model A We use functional form 4 (N, V) N exp L to produce a log-inverse
combination of population and industry employment. The corresponding
elasticities are EN - b, EV - c/L. /32 = constant; 33 ( '); 04
log Lt = a + 131 log wt + /2 log Qt + 03 log Nt + /34 - + n,. (C.1)L t
Model B We let # (N, V) = exp N#, yieldin an inverse-inverse combination of
population and employment, with elasticities 6 N =)/N, Cy =/L.
/2 - constant; 03 - ( ); /34 -
log Lt = a + #1 log 'w1 + /32 log Qt + /3 - + /34 + ut. (C.2)Nt Lt
Model C We use #(N, V) - Nb exp to prroduce a log-inverse combination of
population and value-added; the elasticities are EN = b, EV = c/L.
/32 =constant; 33 = ( ); 04 =
1+1
log Lt = a + 01/ log we + /2 log Qt + /33 log Nt + 04 t + uj. (C.3)
Model D Functional form #(N, V7) = NbQc is use( to produce a log-log
combination of population and value-added by the industry; the elasticities
are EN =b, Ev =c. /32 (1+scs); 03 (s)-
log Lt = a + 13, log wt + /32 log Qt + /13 log Nt + 1t. (C.4)
Model E Finally, we let 4 (N, V) = exp QC, producing an inverse-log
combination of population and value-added; the elasticities are -N = b/N,

ev - C. /32 (1+cs 3= - -
log Lt a + 13, logwe + /32 log Qt + 33 + ut. (C.5)(Nt
C.1.1 Hypothesis testing criteria
For all models, the theoretical sign of the wage coefficient /j1 should be negative
since the use of labor inputs will decrease as the price of labor-i.e., the wage
level-increases. Thus, a negative 131 coefficient indicates the theoretical validity of
the regression model; furthermore, we must keep this consideration in mind at all
times and check for it.
Next, we tested the external factors coefficients must be tested to determine
the existence of localization and urbanization economies and diseconoinies. We
describe the test criteria for each of them below.
Localization economies
In models A, B, and C, the localization coefficient c is given by
34C = .
1 + 1
Thus, if -1 < 01 < 0, localization economies (c > 0) exist if and only if d4 > 0.
Therefore, we test the null hypothesis H, : /4 = 0 versus the alternative hypothesis
H1 : d4 > 0. If #1, < -1, the alternative hypothesis becomes H1 : 34 < 0.
In models D and E,1 - /32
c 1 + 1'
so that, for -1 < d1 < 0, c > 0 if and only if d2 < 1. Hence, we test the null
hypothesis H, : #2= 1 against the alternative hypothesis 1 :/#2 < 1. If /41 -- 1,
c > 0 if and only if 02 > 1, and the alternative hypothesis becomes 1 : /12 1. In
all models, if 31 = 0 or 1 =_ -1, the equation is under-identified; finally, as stated
earlier, if 1 > 0, the coefficient is theoretically unacceptable.

Urbanization economies
In models A, C, and D, urbanization economies exist whenever
b = > 0.S+ 13
Thus, if -1 < #1 < 0, b > 0 if and only if A3 < 0; the corresponding hypotheses are
H, : /33= 0 and H1 : 33 < 0. If 13 < -1, the alternative hypothesis becomes
H 1 : )3 > 0.
In models B and E,
b-=> 01 + 1
so that, for -1 < #1 < 0, b > 0 if and only if d3 > 0 and the corresponding test is
H0 :3 - 0 versus H1 : 03 > 0. If 131 < -1, the alternative hypothesis becomes
Hi :3 < 0.
Again, in all models, if d1 = 0 or 1 = -1, the model is under-identified, and
if $1 > 0, the coefficient is theoretically unacceptable.
C.2 Results
Table C.1 summarizes the regression results for the five econometric models. The
results are discussed in Section 4.2.

Table C.1: Regression results
Textiles-regression coefficients
Variable Model A Model B Model C Model D Model E
Constant term -0.431 -0.279 -1.061 -2.427 -3.645(-0.343) (-.166) (-.496) (-1.988) (-2.807)
Wage (log) -0.638 -0.634 -0.734 -0.696 -0.708(-8.126) (-7.947) (-6.932) (-7.129) (-6.264)
Value added (log) 0.821 0.811 0.958 1.028 1.037(9.075) (8.268) (9.272) (0.626)* (0.700)*
Value added (inv) - - 6.59e5 - -
- - (0.924) - --
Population (log) 1.391 - -0.068 -0.086 -
(2.94e-2) - (-1.449) (-2.149) -
Population (inv) - -289.5 - - -1.53e4- (-4.39e-02) - - (-2.011)
Workers (inv) 113.7 118.2 - - -
(2.668) (2.777) - - -
R-squared 0.99 0.99 0.99 0.98 0.98
Furniture-regression coefficients
Coefficient Model A Model B Model C Model D Model E
Constant term 0.357 -2.870 0.264 0.156 -2.119(.272) (-2.422) (0.206) (0.114) (-2.382)
Wage (log) -0.872 -0.845 -0.862 -0.813 -0.786(-7.309) (-7.142) (-7.667) (-6.997) (-6.951)
Value added (log) 1.042 1.042 1.039 0.966 0.963(11.985) (12.135) (12.971) (-0.616)* (-0.694)*
Value added (inv) - - -1.15e4 - -- - (-1.074) - -
Population (log) -0.222 - -0.219 -0.151 --
(-1.983) - (-2.073) (-1.631) -
Population (inv) - -3.12e4 - - 2.48e4- (-1.975) - - (1.759)
Workers (inv) -1.423 -1.489 - - -
(-.977) (-1.022) - - -
R-squared 0.98 0.98 0.98 0.98 0.98
Transportation equipment-regression coefficients
Coefficient Model A Model B Model C Model D Model E
Constant term -1.174 -5.839 -3.671 -4.296 -5.42(-0.225) (-1.276) (-.899) (-1.424) (-2.108)
Wage (log) -0.438 -0.243 -0.324 -0.259 -0.263(-1.083) (-0.790) (-.953) (-0.822) (-0.948)
Value added (log) 0.777 0.894 0.867 0.860 0.881(4.764) (6.420) (7.420) (-2.61)* (-2.394)*
Value added (inv) - - 9.14 - -- - (0.137) - -
Population (log) -0.045 - -0.065 -0.051 -
(-0.484) - (-0.858) (-0.777) -
Population (inv) - -1.60e4 - - 1.53e4-- (-1.356) - - (1.494)
Workers (inv) 63.456 2.678 - - -
(0.746) (0.037) - - -
R-squared 0.97 0.98 0.98 0.97 0.98
Notes: -Figures in parethesis represent t-statistics.-In models D and E, t-statistic's for log(value added) consider a null hypothesis
where the coefficient is equal to one.

Table C.1 (continued): Regression results
Electric/electronic goods-regression coefficients
Coefficient Model A Model B Model C Model D Model E
Constant term 0.715 1.823 -2.142 -2.068 -2.057(0.249) (0.559) (-0.638) (-0.911) (-0.795)
Wage (log) -0.876 -0.883 -0.817 -0.979 -0.788(-3.052) (-3.350) (-2.601) (-2.792) (-3.021)
Value added (log) 0.846 0.810 0.972 0.975 0.986(8.120) (7.177) (8.488) (-0.287)* (-0.157)*
Value added (inv) - - -5173 - -
- - (-2.6-02) - -
Population (log) 0.036 - 0.046 4.125 -(0.284) - (0.334) (0.309) -
Population (inv) - -6750 - - -1.45e3- (-.404) - - (-0.078)
Workers (inv) 24.286 32.935 - - -
(1.581) (1.930) - - -
R-squared 0.97 0.96 0.96 0.96 0.96
Electric/electronic components-regression coefficients
Coefficient Model A Model B Model C Model D Model E
Constant term 3.531 5.544 1.854 -2.578 -2.922(0.756) (0.896) (0.449) (-0.926) (-1.066)
Wage (log) -0.624 -0.527 -0.708 -0.479 -0.477(-1.719) (-1.330) (-2.062) (-1.611) (-1.608)
Value added (log) 0.368 0.460 0.594 0.865 0.868(1.334) (1.739) (3.111) (-2.126)* (-2.058)*
Value added (inv) - - 6.03e6 - -
- - (1.580) - -
Population (log) 0.366 - 0.214 -1.88e-2 -(1.647) - (1.256) (-0.253) -
Population (inv) - 2.94e4 - - 4.58e3- (1.148) - - (0.377)
Workers (inv) 815.1 586.7 - - -
(1.923) (1.651) - - -
R-squared 0.94 0.93 0.95 0.96 0.96
Notes: -Figures in parethesis represent t-statistics.-In models D and E, t-statistic's for log(value added) consider a null hypothesis
where the coefficient is equal to one.

Bibliography
Alonso, William (1975), "Location Theory," in Friedinann, -John and WilliamAlonso (eds.), Regional Policy, Cambridge, Mass.: The MIT Press, pp.35-63.
Amin, Ash, and Kevin Robbins (1990),"Industrial Districts and ]RegionalDevelopment: Limits and Possibilities," and responses by Sabel, Piore,and Storper, in F. Pyke, G. Becattini, and W. Sengenberger (eds.),Industrial Districts and Inter-Firm Cooperation in Italy, Geneva,Switzerland: International Institute for Labor Studies, pp. 185-219.
Arthur, W. Brian (1990), "Positive Feedbacks in the Economy," ScientificAmerican, February 1990, pp. 92-99.
Avioli, Peter John (1976), Regional Population Distribution: Application ofthe Lorenz Curve to the Description and Analysis of Spatial Concentration,Ithaca, N.Y.: Center for Urban Development Research, Cornell University.
Becattini, Giacomo (1990), "The Marshallian Industrial District as aSocio-Economic Notion," in F. Pyke, G. Becattini, and W. Sengenberger(eds.), Industrial Districts and Inter-Firm Cooperation in Italy, Geneva,Switzerland: International Institute for Labor Studies, pp. 37-51.
Bendavid-Val, Avrom (1983), Regional and Local Economic Analysis forPractitioners, New York, N.Y.: Praeger Publishers.
Bluestone, Barry, and Bennett Harrison (1982), The Deindustrialization ofAmerica, New York, N.Y.: Basic Books.
Brown, Flor, and Lilia Dominguez (1989), "Nuevas tecnologias en la industriamaquiladora de exportaci6n," Comercio Exterior, Vol. 39, Nini. 3(Marzo), pp. 215-223.
Carlton, Dennis (1976), "Why Firms Locate Where They Do?" in Wheaton,W. (ed.), Interregional Movements and Regional Growth., Urban Institute.
Doeringer, Peter B., and David G. Terkla (1990), "Turning Around LocalEconomies: Managerial Strategies and Comninnity Assets, " journal ofPolicy Analysis and Management, Vol. 9, No. 4, pp. 487-506.

Ferniandez, Ra61 A. (1989), The Mexican-American Border Region: Issuesand Trends, Notre Dame, Ind.: University of Notre Dame Press.
Fern'ndez-Kelly, M. Patricia, (1987), "Technology and Employment Along
the U.S.-Mexican Border," in Cathryn Thurop (ed.), The Uni/ed Statesand Mexico: Face to Face with New Technology, New Brunswick, N.J.:Transaction Books.
Fernandez-Kelly, Mara Patricia., (1983) For We Are Sold, I and Iy People:Women and Industry in Mexico's Frontier, Albany, N.Y.: State Universityof New York Press.
Frobel, Folker, Jurgen Heinrichs, and Otto Kreye (1980), The NewInternational Division of Labour: Structural Unemployment inIndustrialised Countries and Industrialisation in De veloping Countries,Cambridge; New York: Cambridge University Press.
George, Edward Y. (1990), "What Does the Future Hold for the MaquiladoraIndustry?" in Fatemi, Khosrow (ed.), The Maquiladora Industry:Economic Solution or Problem? New York: PRAEGE'ER, pp. 219-233.
Gonzailez-Arechiga, Bernardo, and Josh Carlos Rainirez (1-990), "Perspectivasestructurales para la subcontrataci6n en Mexico," in GonzAlez-Ar6chigaand Ramifrez (eds.), Subcontratacidn y Einpresas Transnacionales,Tijuana, Mexico: El Colegio de la, Frontera Norte, pp. 17-45.
Grunwald, Joseph, (1990/91) "Opportunity Missed: Mexico andMaquiladoras," The Brookings Reiiew (Winter), pp. 44-48.
Grunwald, Joseph, and Kenneth Flamni (1985), The Global Factory: ForeignAssembly in International Trade, Washington, D.C.: The BrookingsInstitution.
Haring, Henk A. (1985), Sunbelt Frontier and Border EconomyManufacturing in El Paso - Ciudad Juarez, Utrecht, The Netherlands:University of Utrecht, Dept. of Geography.
Harrison, Bennett (Forthcoming), "Industrial Districts: Old Wine in NewBottles," Regional Studies (Paper presented at the 1990 Boston meetingsof the North American Regional Science Association, Special Session inhonor of Benjamin Chinitz.)
Helpman, E., and P. Krugman (1985), Market Structure and Foreign Trade,Cambridge, Mass.: The MIT Press.
Henderson, J. Vernon (1986), "Efficiency of Resource Usage and City Size,"Journal of Urban Economics, Vol. 19, pp. 47-70.
Hirschman, Albert 0. (1958), The Strategy of Economic Development, NewHaven, CT: Yale University.
Hoffman, Kurt, and Raphael Kaplinsky (1988), Driving Force: The GlobalRestructuring of Technology, Labour, and Invlestment in the A utomobileand Components Industries, Boulder, Colorado: Westview Press.

Holmes, John (1988), "The Organization and Locational Structure ofProduction Subcontracting," in Allen J. Scott and Michael Storper (eds.),Production, Work, Territory, Boston, MA: Unwin Hyman, chapter 5.
Horiba, Yutaka, and Richard Kirkpatrick (1981), "Factor Endowments,Factor Proportions, and the Allocative Efficiency of U.S. InterregionalTrade," The Review of Economics and Statistics, Vol. 63, No. 2 (May), pp.178-187.
Howard, Robert (1990), "Can Small Business Help Countries Compete?"Harvard Business Review, November-December, pp. 88-103.
INEGI (Instituto Nacional de Estadfstica, Geograffa e Informtica) (1991),Resultados Preliminares: XI Censo General de Pohlaci6n y Vivienda,1990, Aguascalientes, Mexico: Instituto Nacional de Estadfstica, Geografiae Informaitica.
INEGI (1991), Estadi'stica de la Industria Mlaquiladora de Exportachin1979-1989, Aguascalientes, Mexico: Instituto Nacional de Estadistica,Geograffa e Informaitica.
INEGI (1989), Cuaderno de Inforinacidn Oportuna Regional, Numero 18,Cuarto Trimestre, 1988, Aguascalientes, Mexico: Instituto Nacional deEstadfstica, Geografia e Informatica.
INEGI, Avance de Informacidn Econ6mica: Industria Alaqutriladora deExportacion (various issues), Aguascalientes, Mexico: Instituto Nacionalde Estadistica, Geograffa e Infornitica.
Isard, Walter (1975), Introduction to Regional Science, Englewood Cliffs,New Jersey: Prentice Hall, Inc.
Isard, Walter (1967), Methods of Regional Analysis: An Introduction toRegional Science, Cambridge, Mass.: The MIT Press.
Kochan, Leslie (1989), The Alaquiladoras and Toxics: The Hfidden Costs ofProduction South of the Border, Washington, D.C.: AFL-CIO.
Krugman, Paul (1991a), Geography and Trade, Leuven, Belgium; Cambridge,Mass.: Leuven University Press and The MIT Press.
Krugman, Paul (1991b), "Increasing Returns and Economic Geography,"Journal of Political Economy, forthcoming.
Leontief, Wassily (1953), "Domestic Production and Foreign Trade: TheAmerican Capital Position Re-examined," Proceedings of the A mericanPhilosophical Society, Vol. 97 (September), pp. 332-349.
Leontief, Wassily (1956), "Factor Proportions and the Structure of AmericanTrade: Further Theoretical and Empirical Analysis," Review' of Economicsand Statistics, Vol. 38 (November), pp. 386-407.
Lipietz, Alain (1986), "New Tendencies in the International Division ofLabor: Regimes of Accumulation and Modes of Regulation," in Allen J.
100

Scott and Michael Storper (eds.), Production, Work, and Territory,Boston, Mass.: Allen and Unwin, pp. 16-40.
Madian, Alan L. (1987),"Technology and the Changing Industrial Balance,"in Cathryn L. Thurop (ed.), The United States and Merico: Face to Facewith New Technology, New Brunswick (UISA): Tranisaction Books, pp.41-66.
Marglin, Stephen A. (1974), "What do Bosses Do: The Origins andFunctions of Hierarchy in Capitalist Production," Review of RadicalPolitical Economics, 6, pp. 60-112.
Markusen, Ann R. (1987a), Profit Cycles, Oligopoly, and RegionalDevelopment, Cambridge, MA: The MIT Press.
Markusen, Ann R. (1987b), Regions: The Economics and Politics ofTerritory, Totowa, NJ: Rowman & Littlefield, Publishers.
Moomaw, Ronald L. (1988), "Agglomeration Economies: Localization orUrbanization?", Urban Studies (25), pp. 150-161.
Moroney, J., and James M. Walker (1966), "A Regional Test of theHeckscher-Ohlin Hypothesis," Journal of Political Economy, Vol. 74, No. 6(December), pp. 573-586.
Moulaert, Frank, and Patricia Wilson Salinas (1)83), Regional Analysis andthe New International Division of Labor, Boston, Mass.: Kluwer-NijhoffPublishing.
Norton, R.D., and J. Rees (1979), "The Product Cycle and the SpatialDecentralization of American Manufacturing," Regional St udies. Vol. 6-1,No. 3, pp. 260-282.
Nakamura, Ryohei (1985), "Agglomeration Economies in UrbanManufacturing Industries: A Case of Japanese Cities," Journal of UrbanEconomics, Vol. 17, pp. 108-124.
Orrantia, Michael Scott (1990), The Economic Impact of Tijuana'sMaquiladora Industries on San Diego's Economy, (unpublished Mastersthesis), Cambridge, Mass.: Dept. of Urban Studies an( Planning, MIT.
Pindyck, Robert S., and Daniel L. Rubinfeld (1991), Econometric Models andEconomic Forecasts, New York, N.Y.: McGraw-Hill.
Piore, Michael, and Charles Sabel (1984), The Second Industrial Divide, NewYork, NY: Basic Books, Inc., Publishers.
Quintanilla, Ernesto R. (1991), "Tendencias recientes (le la localizaci6n en laindustria maquiladora," Comercio Exterior, Vol. 4, Nim. 9, pp. 861-868.
Ramanathan, Ramu (1989), Introductory Econom etrics with Applications,Orlando, Fl.: Harcourt Brace Jovanovich, Inc.
Ranfla Gonz ilez, A., and A.M. Avil6s M. (1988), "La reciente inserci6ninternacional de la industria nexicana y su impacto regional," EstudiosFronterizos, Nfio 6, Vol. 6, enero-abril, mayo-agosto, pp. 61-79.
101

Sabel, Charles (1989), "Flexible Specialization and the Re-emergence ofRegional Economies," in Paul Hirst and Jonathan Zeithin (eds.),RcversingIndustrial Decline? Oxford, UK: Berg, pp. 17-59.
Sabel, Charles (1986), "Changing Models of Economic Efficiency and theirImplications for the Third World," in A. Foxley, M.S. McPherson, andGuillermo O'Donnell (eds.), Development, Democracy, and the Art ofTrespassing. Essays in Honor of Albert 0. Hirschman, Notre Dame, IL:University of Notre Dame Press, pp. 27-55.
Sanderson, Susan W. (1987), "Automated Manufacturing and OffshoreAssembly in Mexico," in Cathryn L. Thurop (ed.), The United States andMexico: Face to Face with New Technology, New Brunswick (ISA):Transaction Books, pp. 127-148.
Sanderson, Susan W., G. Williams, T. Ballenger, B.J.L. Berry (1987),"Impacts of Computer- Aided Manufacturing on Offshore Asseibly andFuture Manufacturing Locations," Regional Studies, Vol. 21, No. 2, pp.131-142.
Sassen-Koob, Saskia (1980), "The Internationalization of the Labor Force,"Studies in Comparative Development, Vol. 15, No. 4 (Winter), pp. 3-25.
Sayer, Andrew (1986), "Industrial Location on a, World Scale," in Allen J.Scott and Michael Storper (eds.), Production, Work, Territory, Boston,MA: Unwin Hyman.
Schoenberger, Erica (1987), "Technological and Organizational Change inAutomobile Production: Spatial Implications," Regional Studies, Vol. 21,No. 3, pp. 199-214.
Schoenberger, Erica (1989), "Some Dilemmas of Automation: Strategic andOperational Aspects of Technological Change in Production," BEonoicGeography, Vol. 65, No. 3 (July), pp. 232-247.
Scott, A.J. (1988a), New Industrial Spaces, London, U.K.: Pion Limited.
Scott, A.J. (1988), "Flexible Production Systems and Regional Development:The Rise of New Industrial Spaces in North America, and WesternEurope," International Journal of Urban Research, Vol. 12, No. 2, pp.171-186.
Scott, A.J. (1987), "Semiconductor Industry in South-East Asia:Organization, Location and the International Division of Labour,"Regional Studies, Vol. 21, No. 2, pp. 143-160.
Stevens, Benjamin and Craig L. Moore (1980), "A Critical Review of theLiterature on Shift-Share as a Forecasting Technique," Journal of legionalScience, Vol. 20, No. 4.
Storper, Michael (1990), "Industrialization an( the Regional Question in theThird World: lessons of Postimperialism; Prospects of Postford ism,"International Journal of Urban and Regiona.l Research, 14(3), y)1). 423-444.
102

Storper, Michael (1985) "Oligopoly an(d the Product Cycle: Essentialism inEconomic Geography," Economic Geography, Vol. 61, No. 3, pp. 260-282.
Storper, Michael (1981), "Toward a Structural Theory of IndustrialLocation," in Rees, John, Geoffrey J.D. Hewings, and Howard A. Stafford(eds.), Industrial Locations and Regional Systemns, Brooklyn, N.Y.: J.F.Bergin Publishers, Inc., pp. 17-40.
Storper, Michael, and Susan Christopherson (1986), "Flexible Specializationand Regional Industrial Agglomerations: The Case of the U.S. MotionPicture Industry," (mimeograph) Los Angeles, Ca.: University ofCalifornia, Los Angeles.
Storper, Michael, and Richard Walker (1989), The Capitalist Imperative:Territory, Technology, and Industrial Growth, Oxford, U.K.: BasilBlackwell.
Storper, Michael, and Richard Walker (1983), "The Theory of Labour andthe Theory of Location," International Journal of Urban and RegionalResearch, Vol. 7, No. 1 (Fall), pp. 1-41.
Suirez-Villa, Luis (1985), "Technological Dualism, the Sunbelt and Mexico'sBorder Areas Industrialization," in Alfonso Corona Renteria aid LayJames Gibson (eds.), fInpactos Regionales de las Relaciones Econ .micasMe"xico-Estados Unidos, Mexico City: El Colegio (le M'xico, Asociaci6n deEstudios Regionales, M xico-Estados Unidos, W.R.S.A.
The Development GAP, (1991) Look Before You Leap: What You ShouldKnow About a North American Free Trade Agreement, Washington, D.C.:The Development Group For Alternative Policies, Inc.
Warner, David C. (1991), "Health Issues at the US-Mexican Border," Jiournalof the American Medical Association, Vol. 265, No. 2, January 9.
Wells, Louis T., Jr. (1972), "The Product Life Cycle Approach," in Louis T.Wells, Jr. (ed.), The Product Life Cycle and [niernational Trade,Cambridge, MA: Division of Research, Graduate School of BusinessAdministration, Harvard University.
Weintraub, Sidney (1990), "The Maquiladora Industry: Its TransitionalRole," in Unauthorized Migration: Addressing the Root Causes, Vol. II,Commission for the Study of International Migration and CooperativeEconomic Development, Washington, D.C.: T .S. Government Prin tingOffice, pp. 1143-1155.
Wilson, Patricia A. (1990a), "The New Maquiladoras: Flexible Production inLow Wage Regions," in Khosrow Fatemi (ed.), Maquiladoras: EconoicProblem or Solution? New York: Praeger, 1990.
Wilson, Patricia A. (1990b), "Maquiladoras and Local Linkages: BuildingTransaction Networks in Guadalajara," in Unauthorized ligra t ion:Addressing the Root Causes, Vol. II, Commission for the Study of
103

International Migration and Cooperative Economic Developmen t,Washington, D.C.: U.S. Government Printing Office, pp. 1183- 1219.
Wilson, Patricia A. (1989), "The Global Assembly Industry: Maquiladoras inInternational Perspective," Working Paper # 010 (June), Austin, Texas:Graduate Program in Community and Regional Planning, University ofTexas at Austin.
Womack, John P. (1987), "Prospects for the U.S.-Mexican Relationship inthe Motor Vehicle Sector," in Cathryn L. Thurop (ed.), Thex United Statesand Mexico: Face to Face with New Technology, New Brunswick (U SA):Transaction Books, pp. 101-125.
104


