Industrial Competitiveness: the challenge for Pakistan - nttfc
69
INDUSTRIAL COMPETITIVENESS: The Challenge for Pakistan Sanjaya Lall, Professor of Development Economics, Oxford University John Weiss, Research Director, ADB Institute, Tokyo * Background Paper for the Asian Development Bank Institute Policy Seminars on International Competitiveness in Pakistan, November 2003. DRAFT November 2003 * We are grateful to Manuel Albaladejo and Jinkang Zhang for their help with collecting and processing data. Peter Brimble provided material on Thailand.
Transcript of Industrial Competitiveness: the challenge for Pakistan - nttfc
INDUSTRIAL COMPETITIVENESS:
The Challenge for Pakistan
Sanjaya Lall, Professor of Development Economics, Oxford University
John Weiss, Research Director, ADB Institute, Tokyo*
Background Paper for the Asian Development Bank Institute
Policy Seminars on International Competitiveness in Pakistan, November 2003.
DRAFT
November 2003
* We are grateful to Manuel Albaladejo and Jinkang Zhang for their help with collecting and processing data. Peter Brimble provided material on Thailand.
Industrial competitiveness in Pakistan
Table of Contents
1. Introduction
2. Understanding Industrial Competitiveness: A Framework
3. The changing nature of competitiveness
4. New dynamics of world markets
5. Pakistan: the current policy environment for manufacturing
6. Benchmarking Pakistan’s performance
7. Benchmarking Pakistan’s skills and technological capabilities
8. Lessons from East Asia
9. Conclusions
Page 2
Industrial competitiveness in Pakistan
1. Introduction.
I t is now a truism that the acceleration in the global movement of capital and goods, termed
conventionally ‘globalization’, carries both immense opportunities, but also serious potential threats.
Ultimately it will be the international competitiveness of firms in particular economies that will
determine how far opportunities are converted into lasting national benefits and how far potential threats
from heightened international competition result in serious cost. There is widespread agreement that
currently with important domestic policy changes and with the imminent end of the international textile
and clothing quota regime the economy of Pakistan is at an important crossroads. The competitiveness of
the industrial sector in the new more liberal international and domestic environment will have a critical
bearing on economic prospects for the foreseeable future.
This paper aims to place the current situation of industry in the country in an international context by
‘benchmarking’ various indicators of national capability and performance against competitor economies
and by highlighting the key lessons from the experience of the successful Asian economies. As such it
should be seen as a contribution to the debate on international competitiveness in Pakistan and not the
result of a detailed assessment of the efficiency of various branches of industry. We begin with a
conceptual discussion of what is meant by international competitiveness, highlighting not only why it is
important, but also how the nature of international competition has changed in recent years. We then
consider aspects of Pakistan’s performance, in relation to international trade and national capability. The
next sections consider experience in a number of the more succesful Asian economies. We refrain from
making detailed policy recommendations, but end with some general comments on industrial strategy and
competitiveness.
2. Understanding Industrial Competitiveness: A Framework
Competitiveness means essentially the ability to compete with firms at the international frontier of
best-practice. It must be recognized that it is firms that compete not nations (Krugman, 1996).
Firms have their own strategies for lowering cost, improving product quality and finding
marketing networks. However, due to the intrinsic failure of markets in critical areas government support
for firms has in some contexts proved to be an important component of the process of attaining
competitiveness. Use and development of technology is central. However using technologies efficiently is
not a passive, automatic process of simply importing a set of machines and instructions on how to use
them. It involves building technical understanding and information, skills, managerial practices, links with
other firms and institutions: what we may term ‘capabilities’ in a broad sense. Such capability
development can be a slow, often costly and risky learning process. Adding to ‘capacity’ (i.e. physical
plant and equipment) is only part of this process: what is critical is the ability to understand how to
Page 3
Industrial competitiveness in Pakistan
operate the capacity at optimal levels, adapt it to local factors and conditions, and upgrade it as
technologies improve and new products appear. There is ample evidence that the same technologies are
used by different firms at vastly different levels of efficiency. More importantly, different countries differ
greatly in their ability to produce efficient firms, and so in their abilities to compete internationally, even if
they start with similar initial factor endowments. Why? Because they tackle differently the intrinsic market
failures that affect learning by firms. The secret of competitiveness lies in the effectiveness with which
countries promote the development of technological and managerial capabilities.
Note that developing technological capabilities does not mean innovation in the sense of ‘reinventing the
wheel’ to create technologies that are available elsewhere, often at lower cost. It does mean learning to
use existing technologies efficiently: an enormously challenging task. It can involve a lot of investment,
effort, time and risk, and constant interaction with other actors with whom information and skills are
shared. It is thus far more complicated than travelling down a given ‘learning curve’, with predictable costs
and outcomes. In developing countries, firms often do not know how to go about making new imported
technologies work at world best practice levels. They do not understand what new skills, technical
knowledge and organisational techniques are involved and where to access them. When exposed to
import competition, they find it difficult to ‘relearn’ their capabilities and get rid of inherited practices and
bad habits. Interactions with other firms or institutions itself requires effort, and overcoming problems of
‘leakage’ (of trained workers or technical know-how) and trust. Firms may not have access to the
information, skills, finance or other factors needed to develop their capabilities.
Of course, not all activities involve the same degree of effort or cost: learning needs may be minimal in
simple industries like apparel manufacture, and very large in advanced electronics or machinery making.
They also vary with ownership: multinational affiliates may be able to undertake learning more easily
because of support of parent companies. But such needs exist in every case, and firms differ enormously
in the success with which they conduct learning.
Effective learning faces market failures, both within firms (their reluctance, lack of knowledge, risk
aversion or inability to undertake learning processes) and between them (or between them and
institutions). These market failures give rise to the need for corrective policies. This is the essence of
competitiveness strategy, to promote in-firm learning, skill development and technological effort, to
improve the supply of information, skills and technology from surrounding markets and institutions, and to
coordinate the collective learning processes that involve different firms in the same industry, or across
related industries (popularly known as ‘clusters’, geographical or activity-wise, see Porter, 1990).
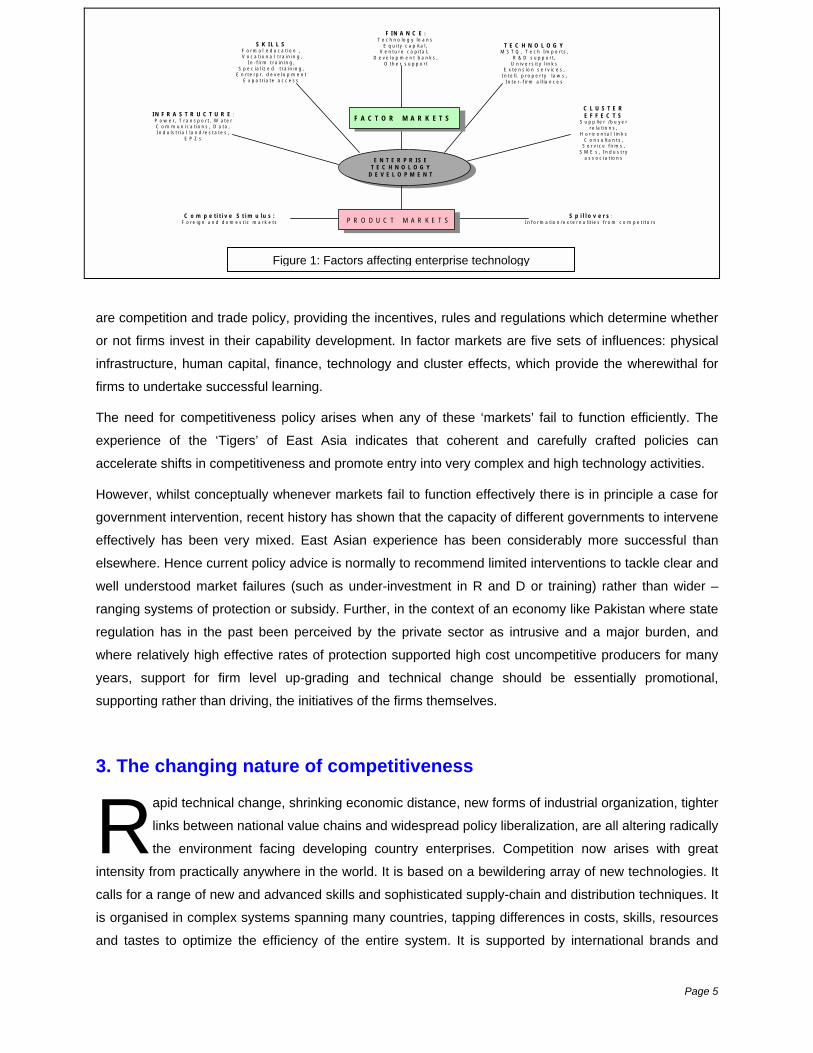
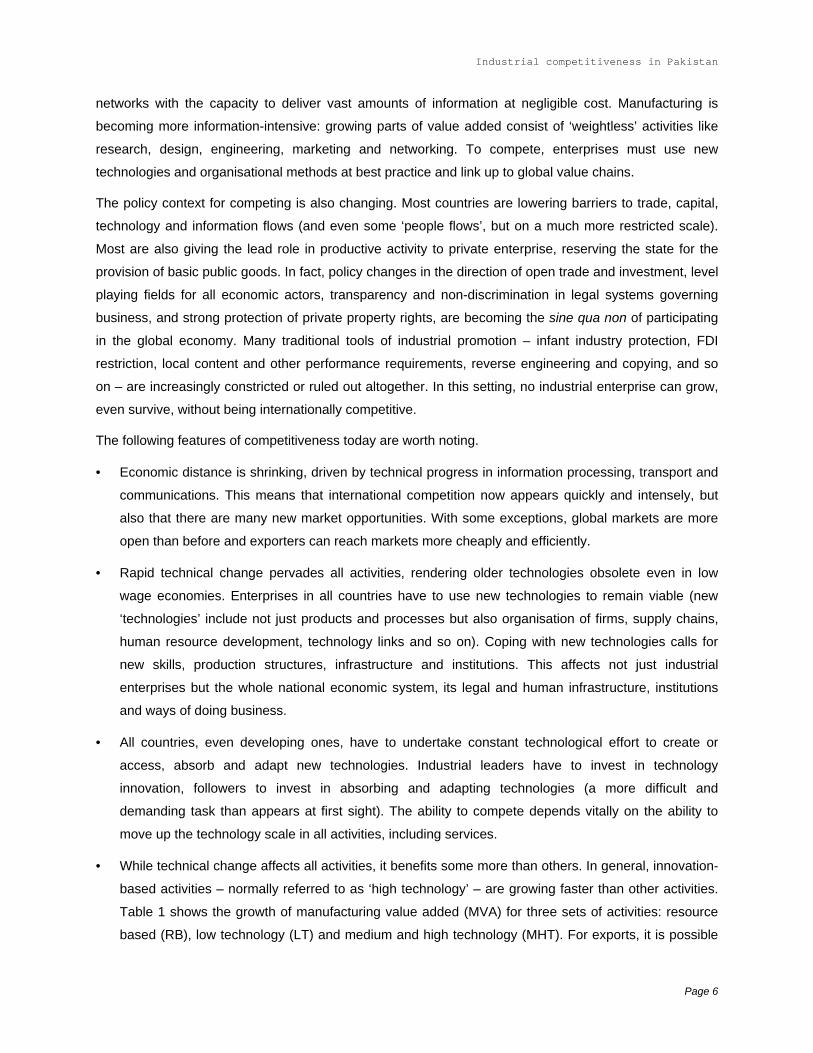
These factors are given in the figure below, which shows the different ‘markets’ within which firms develop
their capabilities. At the firm level there are several random (entrepreneurial, managerial or accidental)
factors that also affect its success, but these are not directly amenable to policy influence and so are
excluded. Also not shown are broad macroeconomic, legal, political and similar factors, which affect the
environment within which all firms function. This still leaves a number of critical factors: in product markets
Page 4
Industrial competitiveness in Pakistan
I N F R A S T R U C T U R E :P o w e r , T r a n s p o r t , W a t e rC o m m u n ic a t io n s , D a t a ,I n d u ls t r ia l l a n d / e s t a t e s ,
E P Z s
S K I L L SF o r m a l e d u c a t i o n ,V o c a t io n a l t r a in in g ,
I n - f i r m t r a in in g ,S p e c ia l i z e d t r a in in g ,
E n r t e r p r . d e v e lo p m e n tE x p a t r ia t e a c c e s s
T E C H N O L O G YM S T Q , T e c h I m p o r t s ,
R & D s u p p o r t ,U n iv e r s i t y l i n k s
E x t e n s io n s e r v ic e s ,I n t e l l . p r o p e r t y l a w s ,
I n t e r - f i r m a l l i a n c e s
C L U S T E RE F F E C T S
S u p p l ie r / b u y e r r e la t io n s ,
H o r i z o n t a l l in k sC o n s u l t a n t s ,
S e r v i c e f i r m s ,S M E s , I n d u s t r y
a s s o c i a t io n sE N T E R P R I S ET E C H N O L O G Y
D E V E L O P M E N T
F I N A N C E :T e c h n o lo g y lo a n s
E q u i t y c a p i t a l ,V e n t u r e c a p i t a l ,
D e v e lo p m e n t b a n k s ,O t h e r s u p p o r t
F A C T O R M A R K E T S
P R O D U C T M A R K E T SC o m p e t i t i v e S t i m u l u s :F o r e ig n a n d d o m e s t ic m a r k e t s
S p i l l o v e r s :I n f o r m a t io n / e x t e r n a l i t i e s f r o m c o m p e t i t o r s
are competition and trade po
or not firms invest in their ca
infrastructure, human capital
firms to undertake successfu
The need for competitivenes
experience of the ‘Tigers’
accelerate shifts in competitiv
However, whilst conceptually
government intervention, rec
effectively has been very m
elsewhere. Hence current po
well understood market failu
ranging systems of protection
regulation has in the past b
where relatively high effectiv
years, support for firm lev
supporting rather than driving
3. The changing nat
R apid technical chan
links between natio
the environment fa
intensity from practically anyw
calls for a range of new and a
is organised in complex syst
and tastes to optimize the e
Figure 1: Factors affecting enterprise technology
licy, providing the incentives, rules and regulations which determine whether
pability development. In factor markets are five sets of influences: physical
, finance, technology and cluster effects, which provide the wherewithal for
l learning.
s policy arises when any of these ‘markets’ fail to function efficiently. The
of East Asia indicates that coherent and carefully crafted policies can
eness and promote entry into very complex and high technology activities.
whenever markets fail to function effectively there is in principle a case for
ent history has shown that the capacity of different governments to intervene
ixed. East Asian experience has been considerably more successful than
licy advice is normally to recommend limited interventions to tackle clear and
res (such as under-investment in R and D or training) rather than wider –
or subsidy. Further, in the context of an economy like Pakistan where state
een perceived by the private sector as intrusive and a major burden, and
e rates of protection supported high cost uncompetitive producers for many
el up-grading and technical change should be essentially promotional,
, the initiatives of the firms themselves.
ure of competitiveness
ge, shrinking economic distance, new forms of industrial organization, tighter
nal value chains and widespread policy liberalization, are all altering radically
cing developing country enterprises. Competition now arises with great
here in the world. It is based on a bewildering array of new technologies. It
dvanced skills and sophisticated supply-chain and distribution techniques. It
ems spanning many countries, tapping differences in costs, skills, resources
fficiency of the entire system. It is supported by international brands and
Page 5
Industrial competitiveness in Pakistan
networks with the capacity to deliver vast amounts of information at negligible cost. Manufacturing is
becoming more information-intensive: growing parts of value added consist of ‘weightless’ activities like
research, design, engineering, marketing and networking. To compete, enterprises must use new
technologies and organisational methods at best practice and link up to global value chains.
The policy context for competing is also changing. Most countries are lowering barriers to trade, capital,
technology and information flows (and even some ‘people flows’, but on a much more restricted scale).
Most are also giving the lead role in productive activity to private enterprise, reserving the state for the
provision of basic public goods. In fact, policy changes in the direction of open trade and investment, level
playing fields for all economic actors, transparency and non-discrimination in legal systems governing
business, and strong protection of private property rights, are becoming the sine qua non of participating
in the global economy. Many traditional tools of industrial promotion – infant industry protection, FDI
restriction, local content and other performance requirements, reverse engineering and copying, and so
on – are increasingly constricted or ruled out altogether. In this setting, no industrial enterprise can grow,
even survive, without being internationally competitive.
The following features of competitiveness today are worth noting.
•
•
•
•
Economic distance is shrinking, driven by technical progress in information processing, transport and
communications. This means that international competition now appears quickly and intensely, but
also that there are many new market opportunities. With some exceptions, global markets are more
open than before and exporters can reach markets more cheaply and efficiently.
Rapid technical change pervades all activities, rendering older technologies obsolete even in low
wage economies. Enterprises in all countries have to use new technologies to remain viable (new
‘technologies’ include not just products and processes but also organisation of firms, supply chains,
human resource development, technology links and so on). Coping with new technologies calls for
new skills, production structures, infrastructure and institutions. This affects not just industrial
enterprises but the whole national economic system, its legal and human infrastructure, institutions
and ways of doing business.
All countries, even developing ones, have to undertake constant technological effort to create or
access, absorb and adapt new technologies. Industrial leaders have to invest in technology
innovation, followers to invest in absorbing and adapting technologies (a more difficult and
demanding task than appears at first sight). The ability to compete depends vitally on the ability to
move up the technology scale in all activities, including services.
While technical change affects all activities, it benefits some more than others. In general, innovation-
based activities – normally referred to as ‘high technology’ – are growing faster than other activities.
Table 1 shows the growth of manufacturing value added (MVA) for three sets of activities: resource
based (RB), low technology (LT) and medium and high technology (MHT). For exports, it is possible
Page 6
Industrial competitiveness in Pakistan
to show high technology (HT) separately from medium technology (MT) products.1 Over the past two
decades exports have grown faster than production, and complex activities have grown faster than
other manufacturing.
•
•
Developing countries have done better in all technology categories than industrialized economies, in
both production and exports. This is considered further below.
Table 1: Growth of manufacturing value added and manufactured exports by technology (% per annum, 1980-2000)
Activity World Industrialized countries Developing countries Manufacturing value added
Total MVA 2.6% 2.3% 5.4% Resource Based MVA 2.3% 1.8% 4.5% Low Technology MVA 1.7% 1.4% 3.5% Medium/High Tech MVA 3.1% 2.6% 6.8%
Manufactured exports Total manufactured exports 7.6% 6.6% 12.0% RB manufactured exports 5.6% 5.2% 6.7% LT manufactured exports 7.4% 8.4% 11.4% MHT manufactured exports 8.4% 7.3% 16.5% without HT exports 11.5% 9.9% 20.2% Source: Calculated from UNIDO and Comtrade data.
National and regional patterns of competitive advantage are changing as exports grow in response to
two forces: innovation and relocation of processes or functions. Both exist in most industries, but their
importance differs by technology and physical characteristics. Some products (like pharmaceuticals)
grow rapidly mainly because of innovation; there is little relocation to take advantage of low wages.
Some (like electronics) benefit from both innovation and relocation – they have low-technology
assembly processes that can be placed in poor countries. Some (like apparel) are driven primarily by
relocation. Some (like automobiles) undergo some relocation, but their technological complexity and
‘weight’ (critical components are, unlike electronics, heavy in relation to their value) means that
distances have to be small (NAFTA is a good example). Exports in which neither innovation nor
1 For a longer description of the categories and the rationale behind the classification see Lall (2001.a). Resource-based manufactures (RB) include processed foods and tobacco, simple wood products, refined petroleum products, dyes, leather (but not leather products), precious stones and organic chemicals. RB products can be simple and labour-intensive (e.g. simple food or leather processing) or capital, scale and skill-intensive (e.g. petroleum refining or modern processed foods). Low technology manufactures (LT) include textiles, garments, footwear, other leather products, toys, simple metal and plastic products, furniture and glassware. These products tend to have stable, well-diffused technologies with low R&D expenditures and skill requirements, and low economies of scale. Labour costs tend to be a major element of cost and the products tend to be undifferentiated, at least in the mass-produced (non-fashion) end of the scale. Barriers to entry are relatively low; competitive advantages in products of interest to developing countries come from price rather than quality or brand names. Medium technology manufactures (MT) are ‘heavy’ products like automobiles, industrial chemicals, machinery and standard electrical and electronic products. These products tend to have complex but not fast-changing technologies, with moderate levels of R&D expenditure but advanced engineering and design skills and large scales of production. In engineering products, there is emphasis on product design and development capabilities as well as extensive supplier and subcontractor networks. Barriers to entry tend to be high, not only because of capital requirements, but also because of strong ‘learning’ effects in operation, design, and, in certain products, product differentiation. High technology manufactures (HT) are complex electrical and electronic (including telecommunication) products, aerospace, precision instruments, fine chemicals and pharmaceuticals. Products with advanced and fast-changing technologies and complex skill needs have the highest entry barriers. The most innovative ones call for large R&D investment, advanced technology infrastructures and close interactions between firms, universities and research institutions. However, many HT activities, particularly electronics, have final assembly with simple technologies, where low wages are an important competitive factor.
Page 7
Industrial competitiveness in Pakistan
relocation are relevant tend to grow slowly. In the service area, there is explosive relocation of
functions like data entry, call centres and so on to low wage countries.
•
•
•
•
Productive resources – goods, inputs, capital, technology and high-level skills – move around the
globe more easily and rapidly. While some of this mobility does not involve ownership, in general it
does, leading to a growing role for transnational companies (TNCs). Their growth is accompanied by
a growing trend to internalise more tightly the most valuable technologies, so that entering these
activities necessarily involves investment by TNCs. However, FDI in the developing world remains
highly concentrated, and is growing more so over time. The share of the leading five and ten
recipients of FDI in the developing world has grown, while declining in the world as a whole.
Organizational structures and location of production are changing in response to technical change.
Industrial firms, including leading TNCs, are becoming less vertically integrated and more specialized
by technology. Under competitive pressure, they are scouring the world for more economical
locations. Technical progress in transport and communications is allowing them to locate and manage
activities in far-flung parts of the globe. Some facilities are under the control of TNCs (mainly from
industrial countries) but others are independent local firms, interwoven with the leaders in intricate
webs of contractual and non-contractual relations.
International industrial value chains are more tightly coordinated than before, both within firms (by
TNCs1) and externally (by contractual or informal relationships2). Functions and processes are being
subdivided and relocated to take advantage of fine differences in costs, logistics, markets and
innovation.3
Locations able to plug into dynamic value chains have seen large, sustained increases in production,
exports and employment (UNIDO, 2002). A large part has been in relatively low-skill assembly
activities, but in the high technology end, like electronics, activities have tended to ‘stick’ rather than
move on as wages rise. It is low technology activities like clothing that have been relatively footloose.
However, only a few countries have become significant players in of global supply chains, even in low
technology activities (one of the main drivers, the successor to the Multi-Fibre Arrangement the
Agreement on Textiles and Clothing, is about to expire).
1 Thus, some 30-40 percent of the trade handled by TNCs is actually within the firm (between different affiliated companies) and is not transacted on open markets (UNCTAD, 1999). 2 There is a tendency for lead firms to rely on a smaller number of ‘first tier’ suppliers, which in turn deal with and coordinate second and third tier suppliers. The first tier suppliers are major TNCs in their own right. 3 In some low technology activities like apparel, lead coordinators are international buyers rather than TNCs. The role of direct ownership (i.e. of FDI) in coordinating globalised activities depends on the nature and pace of change of the technology and the availability of specialised suppliers; it is also changing rapidly over time as systems become more open.
Page 8
Industrial competitiveness in Pakistan
•
•
The determinants of competitiveness are changing. The possession of primary resources or cheap
unskilled labour per se is no longer sufficient. Strong local capabilities and institutions are needed,
whether or not countries rely on national firms or FDI; the most effective strategy is to combine both
and leverage foreign skills, technologies and marketing systems to develop local competencies.
UNIDO (2002) calls this the ‘triple-L’ (linking, learning and leveraging) strategy, drawing on Mathews
and Cho’s (2002) analysis of East Asian entry into high technology electronics exports. Thus,
technological competence, skills, work discipline and trainability, competitive supplier clusters, strong
support institutions, good infrastructure and well-honed administrative capabilities are the new tools of
comparative advantage.
Global value chains, particularly integrated production systems, are unlikely to spread to all
developing countries because of their technological features. Most advanced activities have strong
economies of scale and agglomeration, and concentrate in the few locations that can provide the
critical mass of skills, suppliers, services and institutions they need. There is unlikely to be continuous
cascading of production facilities to other countries as wages rise: on the contrary, there may be large
discontinuities in the relocation process. Once established in particular countries, TNCs are likely to
‘stick’ for long periods, at least until wage and congestion costs rise to uneconomic levels or the
supply of relevant skills run out.
Globalization and technical change have strong policy implications, for countries at all levels of
development. Countries require new skills to manage technical change, and so have to change the
institutional structure for education and training (Narula, 2003). They need strong technical support
agencies in standards, metrology, quality, testing, R&D, productivity and SME extension, in addition to
institutions concerned with technology and innovation. They need advanced infrastructure in information
and communication technologies (ICTs). They need new rules, legal systems and agencies to encourage
enterprises to build competitive capabilities and allow knowledge to flow across nations. It is not easy to
meet such demands: this is why many governments mount competitiveness strategies (Lall, 2001.b).
However, capabilities develop slowly, in a cumulative and path-dependent manner. Thus, economies that
start off on a virtuous circle of growth, competitiveness and investment in new capabilities can carry on
doing better than those that are stuck in a ‘low level equilibrium’ and cannot muster the resources to
break out. Industrial performance can diverge across countries and continue diverging over time, with no
inbuilt forces to return them towards greater convergence. Countries can reverse these trends, but only if
they can mount a concerted strategy to shift the economy, its human capital and technology base, its
institutions and infrastructure from a low to a high competitiveness path.
Page 9
Industrial competitiveness in Pakistan
4. New dynamics of world markets
R apid technological progress is, as noted, changing the structure of industrial activity. As noted
above, activities with higher “technological intensity” — those with higher than average
expenditures on R&D — are growing faster than other activities. While every activity uses new
technologies, differences in innovative potential, the speed of application of new innovations and different
rates of demand expansion affect relative growth rates. Table 1 showed that high technology activities
grew faster in both production and trade than other manufacturing activities (and trade grew faster than
production, indicating the increasing internationalisation of industry in all economies).
Not only are technology-intensive industrial activities more dynamic, they tend to offer greater potential for
sustained learning and productivity increase, more spillover benefits to other activities and more scope for
FDI in integrated production systems that offer enormous export possibilities. All production and export
structures are not, in other words, equal in terms of promoting industrial growth and competitiveness.
Countries that wish to strengthen their export market positioning and diversify out of slow-growing
activities, to tap rapid technology transfer, to promote technological deepening and to exploit the growing
fragmentation of production should shift their structures from simple to complex technologies. To some
extent, the deepening of the industrial structure is a normal consequence of the development process, but
the most successful and competitive countries have made deliberate efforts to accelerate the process by
deliberate policy.
This does not mean that low-technology and resource-based products should be neglected in
competitiveness strategy. On the contrary, such products are the starting point for building industrial
competitiveness in developing countries, and they continue to remain significant exports by mature
industrial countries (in 2000, developed countries were the top 10 exporters in the world of resource
based manufactures and comprised 7 of the top 10 exporters of low technology products). Both groups
also have technology intensive products (see Box 1 below): technical change produces pockets of
unexpected innovation even in mature and stable technologies. Biotechnology, for instance, is making
food processing into a high technology industry. The ‘bottom line’ of competitiveness is to upgrade
technologies in all activities, building new capabilities and finding new markets and market niches. At the
same time, the dynamics of world markets suggest that it is necessary to promote structural change, and
nearly all countries that have maintained high rates of export growth have upgraded the technological
composition of the exports and production (see below).
4.1 Export structure by technology
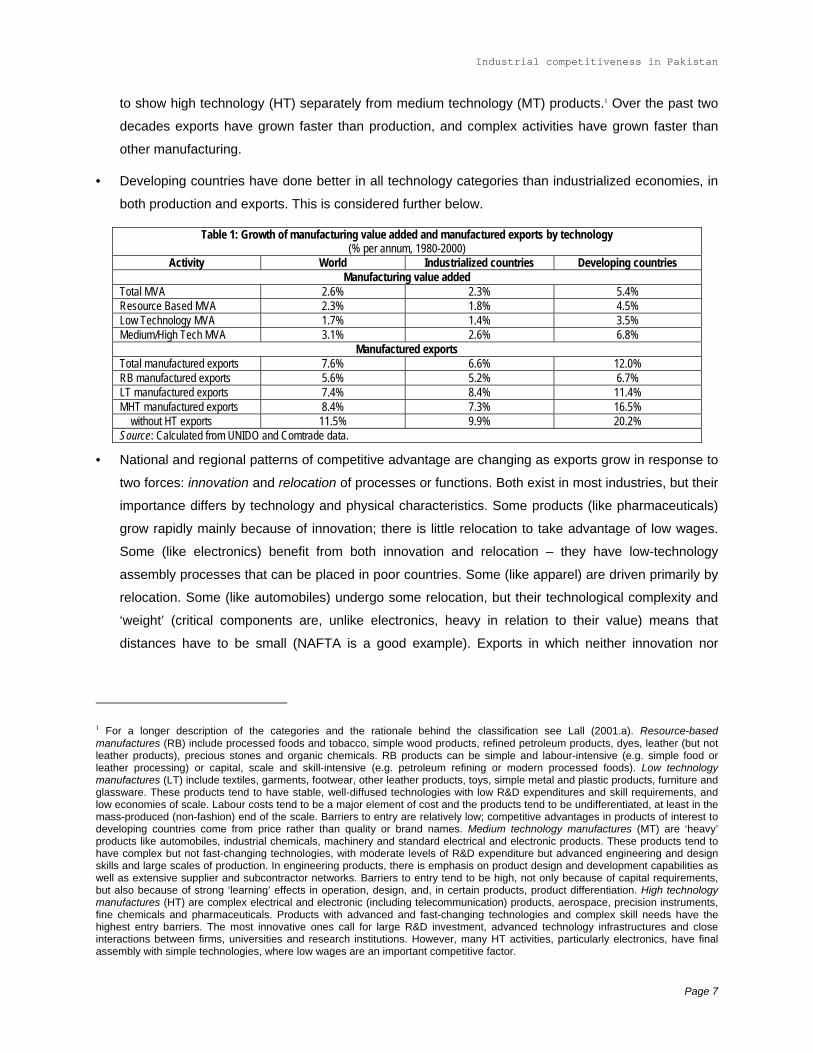
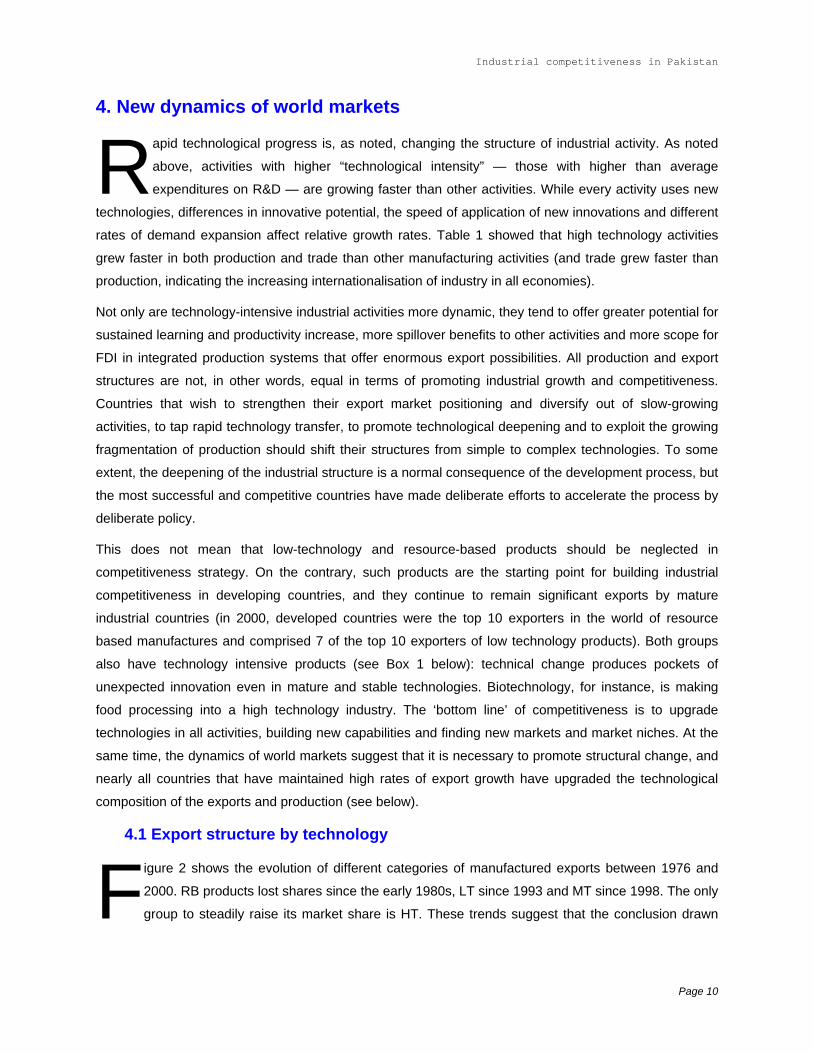
Figure 2 shows the evolution of different categories of manufactured exports between 1976 and
2000. RB products lost shares since the early 1980s, LT since 1993 and MT since 1998. The only
group to steadily raise its market share is HT. These trends suggest that the conclusion drawn
Page 10
Industrial competitiveness in Pakistan
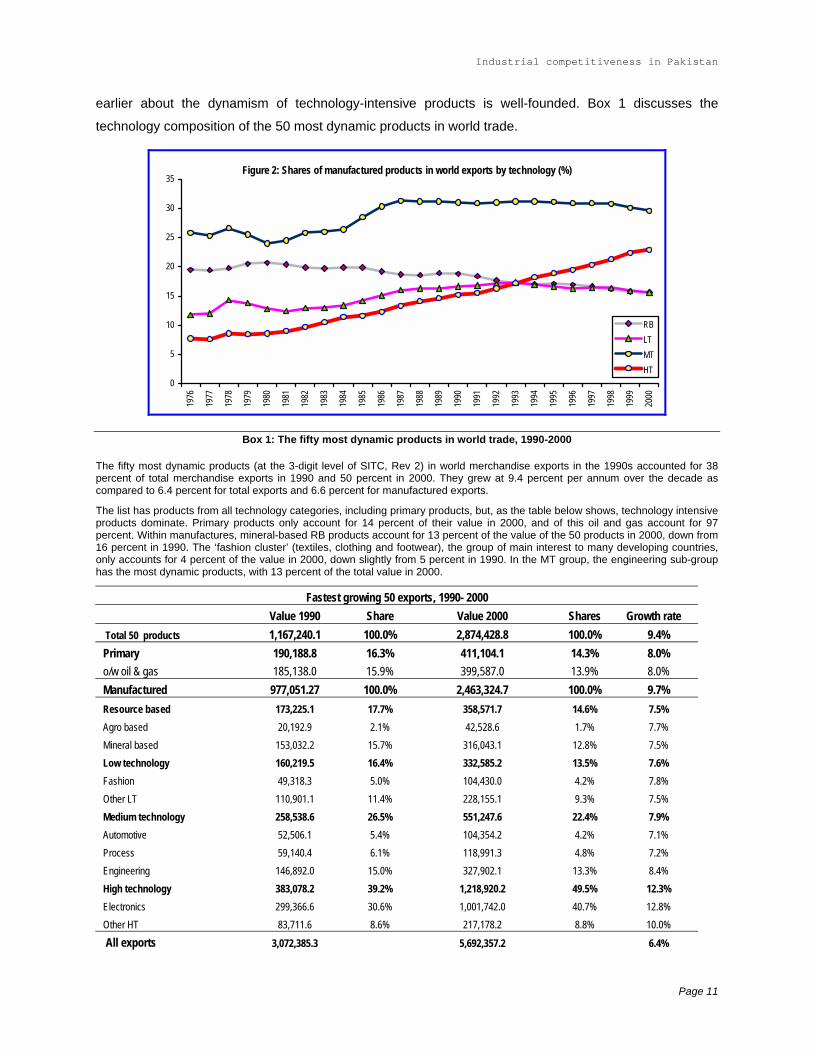
earlier about the dynamism of technology-intensive products is well-founded. Box 1 discusses the
technology composition of the 50 most dynamic products in world trade.
Figure 2: Shares of manufactured products in world exports by technology (%)
0
5
10
15
20
25
30
3519
76
1977
1978
1979
1980
1981
1982
1983
1984
1985
1986
1987
1988
1989
1990
1991
1992
1993
1994
1995
1996
1997
1998
1999
2000
RBLTMTHT
Box 1: The fifty most dynamic products in world trade, 1990-2000
The fifty most dynamic products (at the 3-digit level of SITC, Rev 2) in world merchandise exports in the 1990s accounted for 38 percent of total merchandise exports in 1990 and 50 percent in 2000. They grew at 9.4 percent per annum over the decade as compared to 6.4 percent for total exports and 6.6 percent for manufactured exports.
The list has products from all technology categories, including primary products, but, as the table below shows, technology intensive products dominate. Primary products only account for 14 percent of their value in 2000, and of this oil and gas account for 97 percent. Within manufactures, mineral-based RB products account for 13 percent of the value of the 50 products in 2000, down from 16 percent in 1990. The ‘fashion cluster’ (textiles, clothing and footwear), the group of main interest to many developing countries, only accounts for 4 percent of the value in 2000, down slightly from 5 percent in 1990. In the MT group, the engineering sub-group has the most dynamic products, with 13 percent of the total value in 2000.
Fastest growing 50 exports, 1990- 2000 Value 1990 Share Value 2000 Shares Growth rate
Total 50 products 1,167,240.1 100.0% 2,874,428.8 100.0% 9.4% Primary 190,188.8 16.3% 411,104.1 14.3% 8.0% o/w oil & gas 185,138.0 15.9% 399,587.0 13.9% 8.0% Manufactured 977,051.27 100.0% 2,463,324.7 100.0% 9.7% Resource based 173,225.1 17.7% 358,571.7 14.6% 7.5% Agro based 20,192.9 2.1% 42,528.6 1.7% 7.7% Mineral based 153,032.2 15.7% 316,043.1 12.8% 7.5% Low technology 160,219.5 16.4% 332,585.2 13.5% 7.6% Fashion 49,318.3 5.0% 104,430.0 4.2% 7.8% Other LT 110,901.1 11.4% 228,155.1 9.3% 7.5% Medium technology 258,538.6 26.5% 551,247.6 22.4% 7.9% Automotive 52,506.1 5.4% 104,354.2 4.2% 7.1% Process 59,140.4 6.1% 118,991.3 4.8% 7.2% Engineering 146,892.0 15.0% 327,902.1 13.3% 8.4% High technology 383,078.2 39.2% 1,218,920.2 49.5% 12.3% Electronics 299,366.6 30.6% 1,001,742.0 40.7% 12.8% Other HT 83,711.6 8.6% 217,178.2 8.8% 10.0% All exports 3,072,385.3 5,692,357.2 6.4%
Page 11
Industrial competitiveness in Pakistan
All manufactures 2,576,443.5 4,883,038.7 6.6%
Each technological group within manufacturing loses shares to the high technology category, mirroring trends in aggregate exports as HT products grow significantly faster than other dynamic products. As a result, they raise their share of the total for the dynamic group from 39 to 50 percent over 1990-2000. They account for 25 percent of total manufactured exports by 2000, up from 15 percent ten years earlier.
This has implications for developing countries, since over 80 percent of the value of the dynamic HT products comes from electronics, and nearly 40 percent of electronics exports now come from the developing world. This is a product that seems ideally suited to drive exports from poor countries: it is growing rapidly in world trade, it is highly income elastic, it can provide enormous technological and spillover benefits and it has processes that can be segmented easily. However, the segmentation process so far has encompassed only a handful of countries: the East Asian Tigers (increasingly including China), Mexico and Costa Rica. It is spreading to some East European countries and to North Africa, but the main production system seems to be in place in East Asia. The prospects for its spreading to other regions are unclear.
4.2 Manufacturing value added performance
D eveloping countries are doing well in the current scene. As noted, their MVA and manufactured
exports have grown faster than those of industrialized countries in every technological category.
However, these overall figures are misleading in that dynamism is spread very unevenly in the
developing world. Let us consider performance by the main regions in the developing world (Pakistan and
its comparators are considered later):
•
•
•
•
•
‘East Asia’ or ‘EA’ includes China and all countries in the Southeast Asian region apart from Japan,
while EA2 excludes China where relevant.
‘LAC’ (Latin America and the Caribbean) includes Mexico and LAC 2 excludes it.
S. Asia includes Bangladesh, India, Pakistan, Sri Lanka and Nepal.
‘MENA’ (Middle East & North Africa) includes Turkey but not Israel (an industrialized country).
‘SSA’ is Sub-Saharan Africa (including S. Africa).
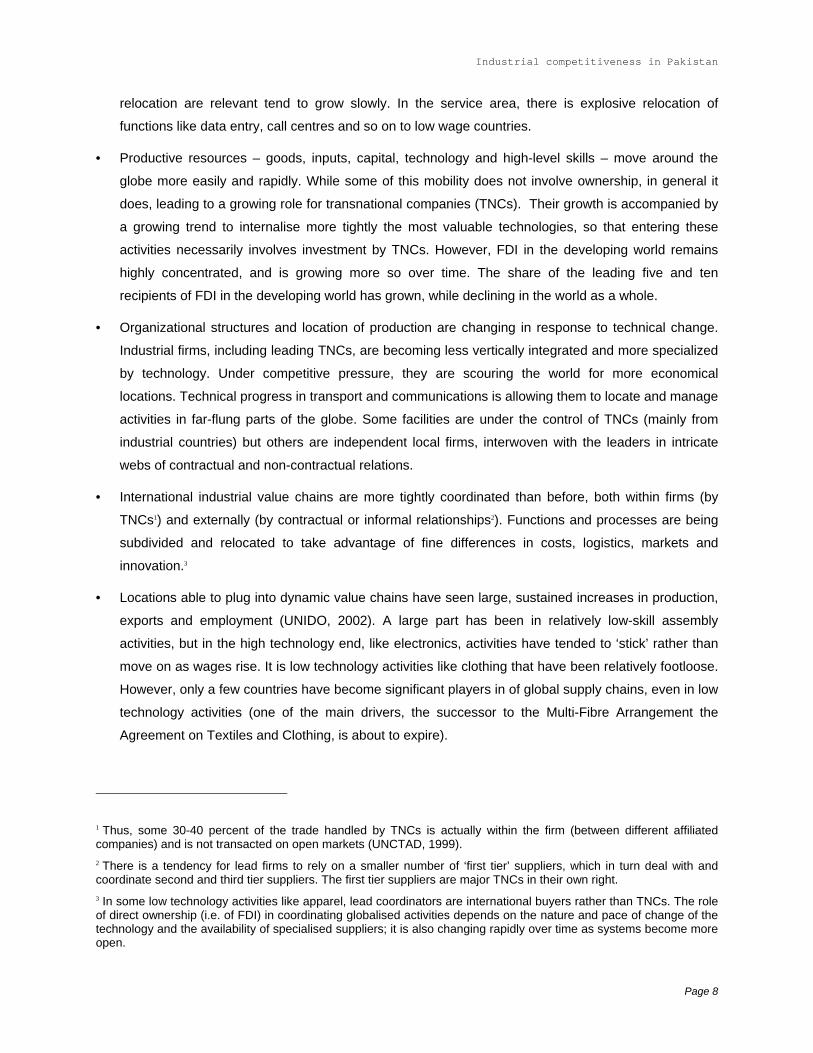
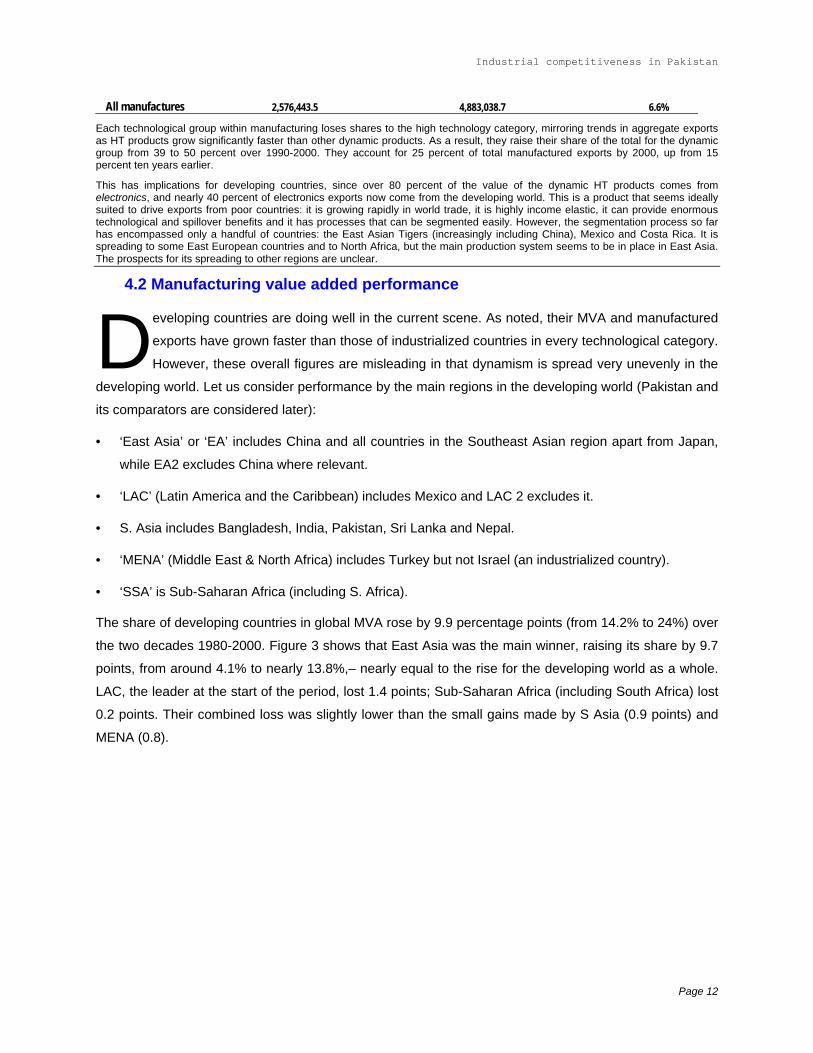
The share of developing countries in global MVA rose by 9.9 percentage points (from 14.2% to 24%) over
the two decades 1980-2000. Figure 3 shows that East Asia was the main winner, raising its share by 9.7
points, from around 4.1% to nearly 13.8%,– nearly equal to the rise for the developing world as a whole.
LAC, the leader at the start of the period, lost 1.4 points; Sub-Saharan Africa (including South Africa) lost
0.2 points. Their combined loss was slightly lower than the small gains made by S Asia (0.9 points) and
MENA (0.8).
Page 12
Industrial competitiveness in Pakistan
Figure 3: Shares of developing regions in world MVA (%)
0
2
4
6
8
10
12
14
16
E Asia S. Asia LAC MENA SSA
1980 1990 2000
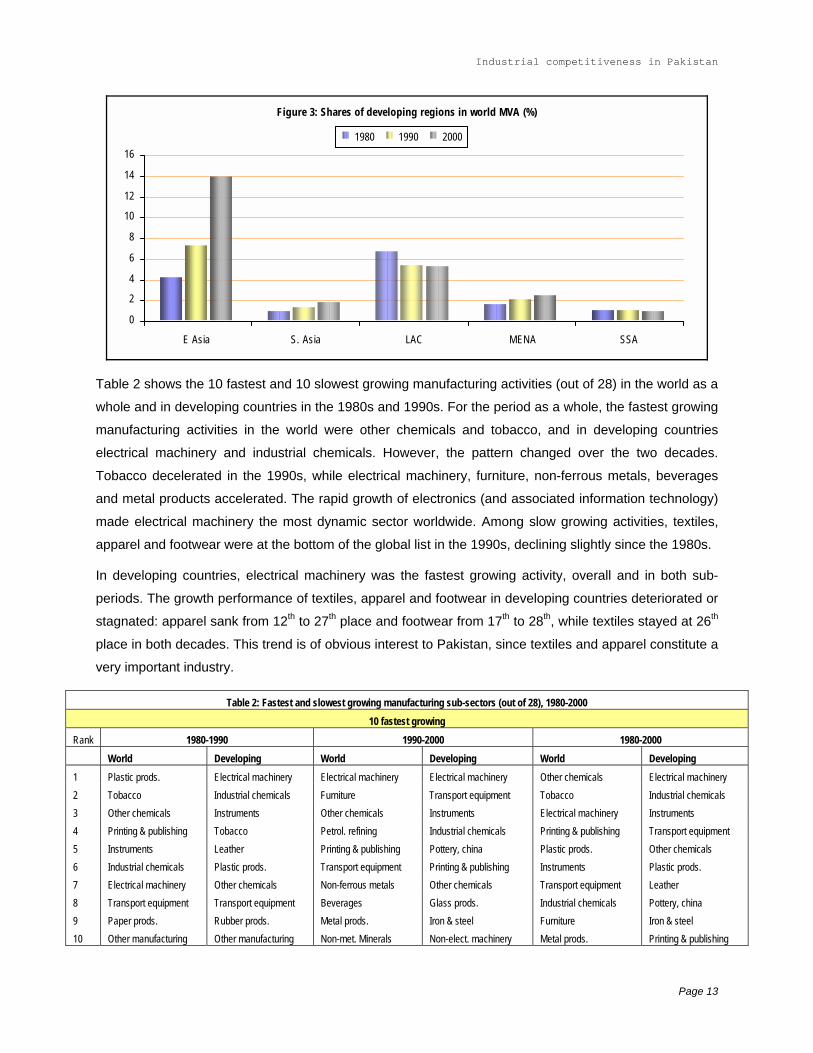
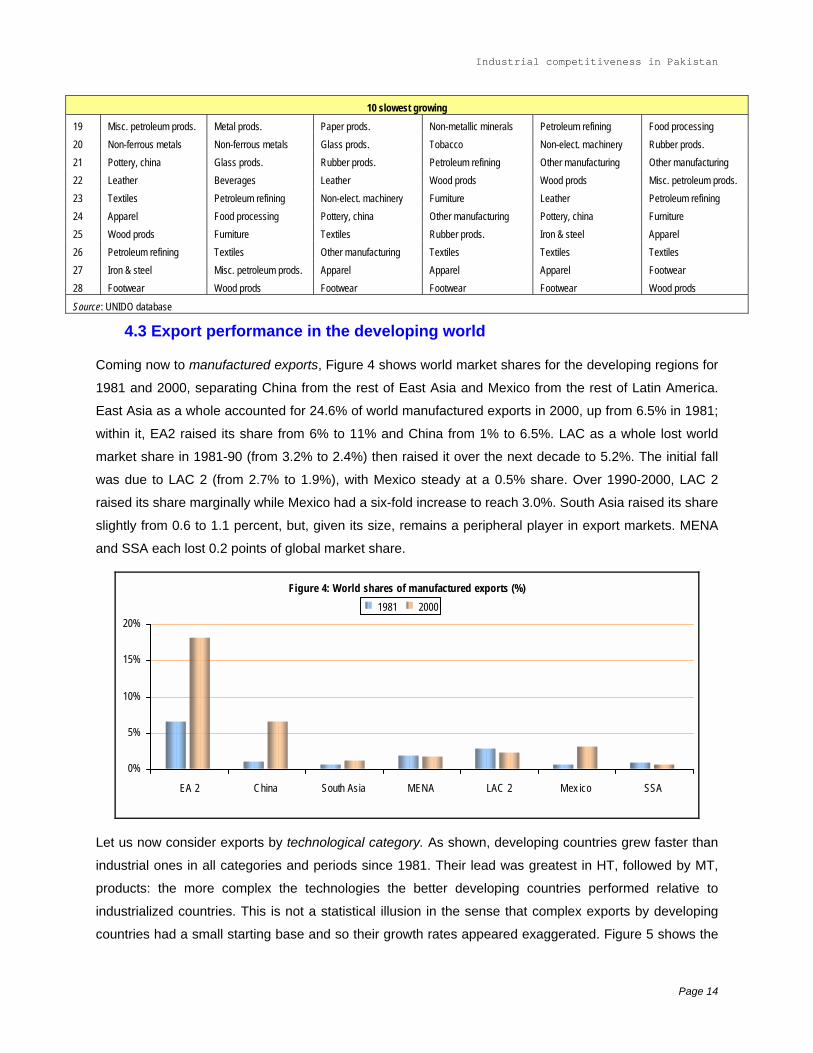
Table 2 shows the 10 fastest and 10 slowest growing manufacturing activities (out of 28) in the world as a
whole and in developing countries in the 1980s and 1990s. For the period as a whole, the fastest growing
manufacturing activities in the world were other chemicals and tobacco, and in developing countries
electrical machinery and industrial chemicals. However, the pattern changed over the two decades.
Tobacco decelerated in the 1990s, while electrical machinery, furniture, non-ferrous metals, beverages
and metal products accelerated. The rapid growth of electronics (and associated information technology)
made electrical machinery the most dynamic sector worldwide. Among slow growing activities, textiles,
apparel and footwear were at the bottom of the global list in the 1990s, declining slightly since the 1980s.
In developing countries, electrical machinery was the fastest growing activity, overall and in both sub-
periods. The growth performance of textiles, apparel and footwear in developing countries deteriorated or
stagnated: apparel sank from 12th to 27th place and footwear from 17th to 28th, while textiles stayed at 26th
place in both decades. This trend is of obvious interest to Pakistan, since textiles and apparel constitute a
very important industry.
Table 2: Fastest and slowest growing manufacturing sub-sectors (out of 28), 1980-2000 10 fastest growing
Rank 1980-1990 1990-2000 1980-2000 World Developing World Developing World Developing 1 Plastic prods. Electrical machinery Electrical machinery Electrical machinery Other chemicals Electrical machinery 2 Tobacco Industrial chemicals Furniture Transport equipment Tobacco Industrial chemicals 3 Other chemicals Instruments Other chemicals Instruments Electrical machinery Instruments 4 Printing & publishing Tobacco Petrol. refining Industrial chemicals Printing & publishing Transport equipment 5 Instruments Leather Printing & publishing Pottery, china Plastic prods. Other chemicals 6 Industrial chemicals Plastic prods. Transport equipment Printing & publishing Instruments Plastic prods. 7 Electrical machinery Other chemicals Non-ferrous metals Other chemicals Transport equipment Leather 8 Transport equipment Transport equipment Beverages Glass prods. Industrial chemicals Pottery, china 9 Paper prods. Rubber prods. Metal prods. Iron & steel Furniture Iron & steel 10 Other manufacturing Other manufacturing Non-met. Minerals Non-elect. machinery Metal prods. Printing & publishing
Page 13
Industrial competitiveness in Pakistan
10 slowest growing 19 Misc. petroleum prods. Metal prods. Paper prods. Non-metallic minerals Petroleum refining Food processing 20 Non-ferrous metals Non-ferrous metals Glass prods. Tobacco Non-elect. machinery Rubber prods. 21 Pottery, china Glass prods. Rubber prods. Petroleum refining Other manufacturing Other manufacturing 22 Leather Beverages Leather Wood prods Wood prods Misc. petroleum prods. 23 Textiles Petroleum refining Non-elect. machinery Furniture Leather Petroleum refining 24 Apparel Food processing Pottery, china Other manufacturing Pottery, china Furniture 25 Wood prods Furniture Textiles Rubber prods. Iron & steel Apparel 26 Petroleum refining Textiles Other manufacturing Textiles Textiles Textiles 27 Iron & steel Misc. petroleum prods. Apparel Apparel Apparel Footwear 28 Footwear Wood prods Footwear Footwear Footwear Wood prods
Source: UNIDO database
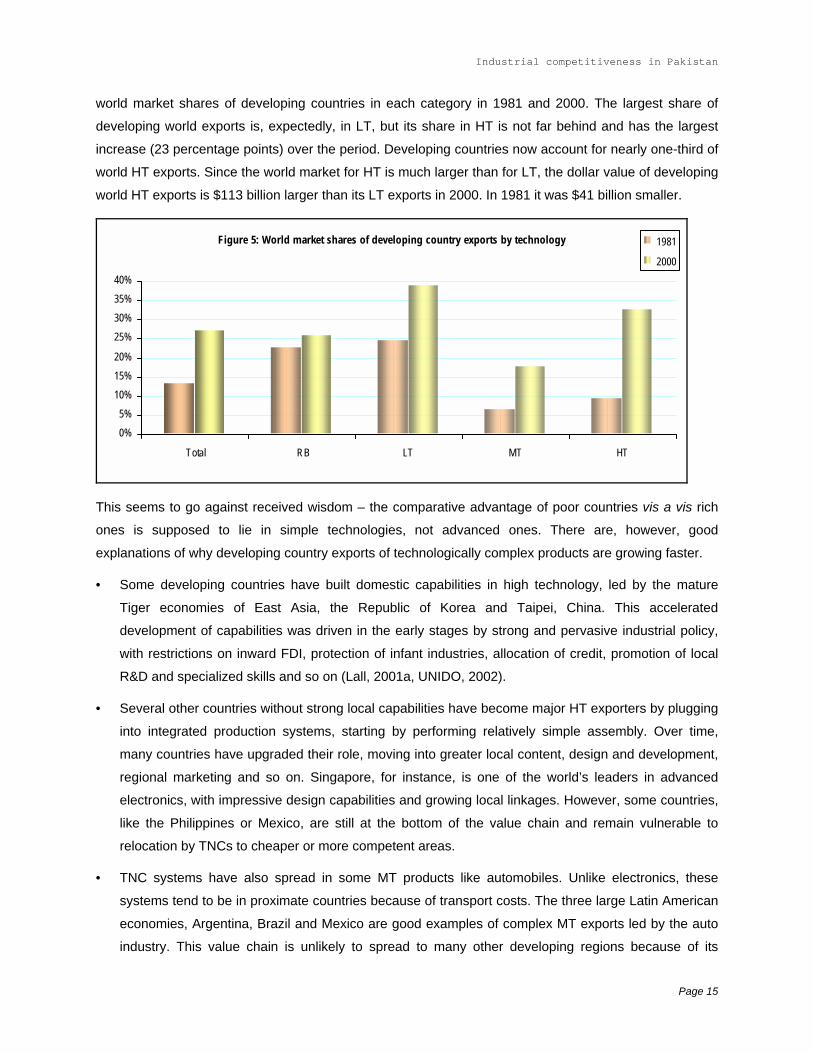
4.3 Export performance in the developing world
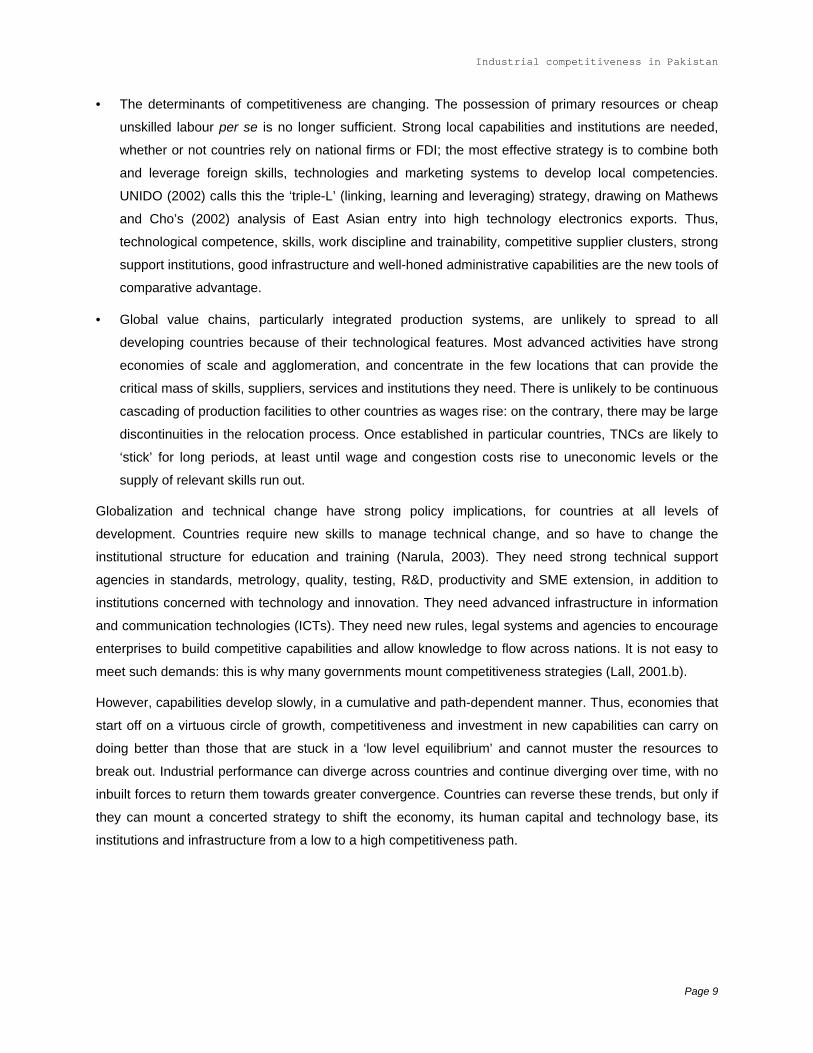
Coming now to manufactured exports, Figure 4 shows world market shares for the developing regions for
1981 and 2000, separating China from the rest of East Asia and Mexico from the rest of Latin America.
East Asia as a whole accounted for 24.6% of world manufactured exports in 2000, up from 6.5% in 1981;
within it, EA2 raised its share from 6% to 11% and China from 1% to 6.5%. LAC as a whole lost world
market share in 1981-90 (from 3.2% to 2.4%) then raised it over the next decade to 5.2%. The initial fall
was due to LAC 2 (from 2.7% to 1.9%), with Mexico steady at a 0.5% share. Over 1990-2000, LAC 2
raised its share marginally while Mexico had a six-fold increase to reach 3.0%. South Asia raised its share
slightly from 0.6 to 1.1 percent, but, given its size, remains a peripheral player in export markets. MENA
and SSA each lost 0.2 points of global market share.
Figure 4: World shares of manufactured exports (%)
0%
5%
10%
15%
20%
EA 2 China South Asia MENA LAC 2 Mex ico SSA
1981 2000
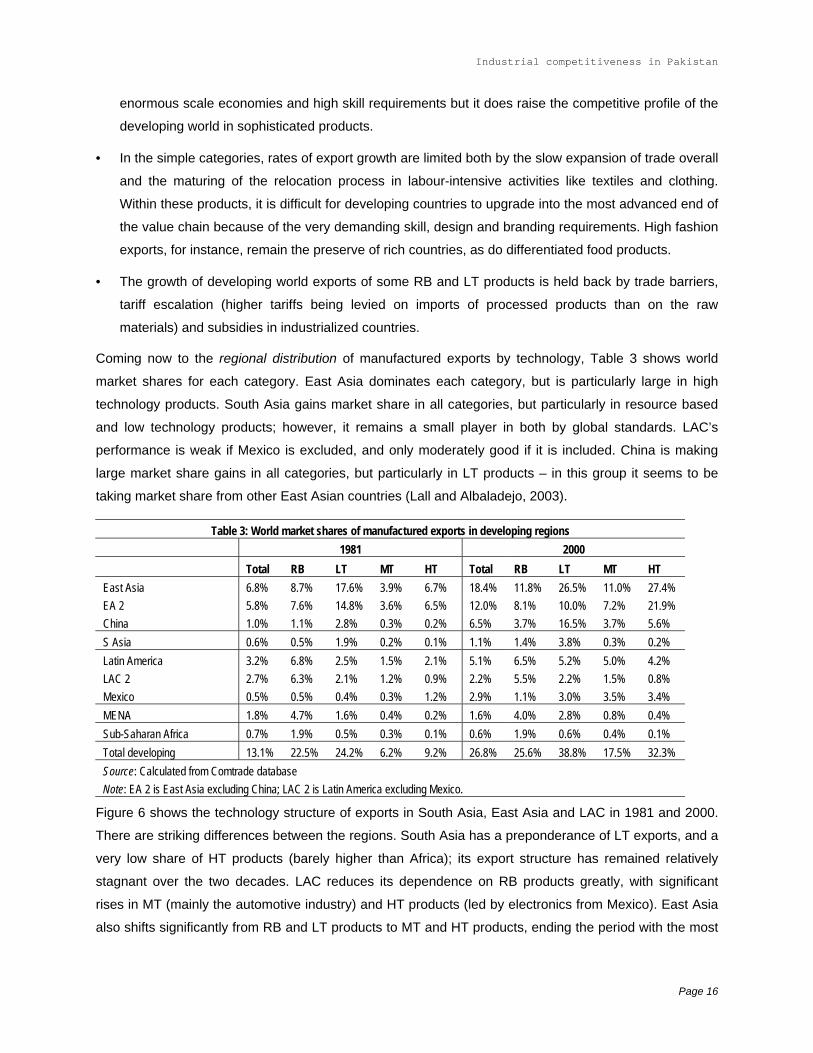
Let us now consider exports by technological category. As shown, developing countries grew faster than
industrial ones in all categories and periods since 1981. Their lead was greatest in HT, followed by MT,
products: the more complex the technologies the better developing countries performed relative to
industrialized countries. This is not a statistical illusion in the sense that complex exports by developing
countries had a small starting base and so their growth rates appeared exaggerated. Figure 5 shows the
Page 14
Industrial competitiveness in Pakistan
world market shares of developing countries in each category in 1981 and 2000. The largest share of
developing world exports is, expectedly, in LT, but its share in HT is not far behind and has the largest
increase (23 percentage points) over the period. Developing countries now account for nearly one-third of
world HT exports. Since the world market for HT is much larger than for LT, the dollar value of developing
world HT exports is $113 billion larger than its LT exports in 2000. In 1981 it was $41 billion smaller.
Figure 5: World market shares of developing country exports by technology
0%5%
10%15%20%
25%30%35%40%
Total RB LT MT HT
1981
2000
This seems to go against received wisdom – the comparative advantage of poor countries vis a vis rich
ones is supposed to lie in simple technologies, not advanced ones. There are, however, good
explanations of why developing country exports of technologically complex products are growing faster.
•
•
•
Some developing countries have built domestic capabilities in high technology, led by the mature
Tiger economies of East Asia, the Republic of Korea and Taipei, China. This accelerated
development of capabilities was driven in the early stages by strong and pervasive industrial policy,
with restrictions on inward FDI, protection of infant industries, allocation of credit, promotion of local
R&D and specialized skills and so on (Lall, 2001a, UNIDO, 2002).
Several other countries without strong local capabilities have become major HT exporters by plugging
into integrated production systems, starting by performing relatively simple assembly. Over time,
many countries have upgraded their role, moving into greater local content, design and development,
regional marketing and so on. Singapore, for instance, is one of the world’s leaders in advanced
electronics, with impressive design capabilities and growing local linkages. However, some countries,
like the Philippines or Mexico, are still at the bottom of the value chain and remain vulnerable to
relocation by TNCs to cheaper or more competent areas.
TNC systems have also spread in some MT products like automobiles. Unlike electronics, these
systems tend to be in proximate countries because of transport costs. The three large Latin American
economies, Argentina, Brazil and Mexico are good examples of complex MT exports led by the auto
industry. This value chain is unlikely to spread to many other developing regions because of its
Page 15
Industrial competitiveness in Pakistan
enormous scale economies and high skill requirements but it does raise the competitive profile of the
developing world in sophisticated products.
•
•
In the simple categories, rates of export growth are limited both by the slow expansion of trade overall
and the maturing of the relocation process in labour-intensive activities like textiles and clothing.
Within these products, it is difficult for developing countries to upgrade into the most advanced end of
the value chain because of the very demanding skill, design and branding requirements. High fashion
exports, for instance, remain the preserve of rich countries, as do differentiated food products.
The growth of developing world exports of some RB and LT products is held back by trade barriers,
tariff escalation (higher tariffs being levied on imports of processed products than on the raw
materials) and subsidies in industrialized countries.
Coming now to the regional distribution of manufactured exports by technology, Table 3 shows world
market shares for each category. East Asia dominates each category, but is particularly large in high
technology products. South Asia gains market share in all categories, but particularly in resource based
and low technology products; however, it remains a small player in both by global standards. LAC’s
performance is weak if Mexico is excluded, and only moderately good if it is included. China is making
large market share gains in all categories, but particularly in LT products – in this group it seems to be
taking market share from other East Asian countries (Lall and Albaladejo, 2003).
Table 3: World market shares of manufactured exports in developing regions 1981 2000
Total RB LT MT HT Total RB LT MT HT East Asia 6.8% 8.7% 17.6% 3.9% 6.7% 18.4% 11.8% 26.5% 11.0% 27.4% EA 2 5.8% 7.6% 14.8% 3.6% 6.5% 12.0% 8.1% 10.0% 7.2% 21.9% China 1.0% 1.1% 2.8% 0.3% 0.2% 6.5% 3.7% 16.5% 3.7% 5.6% S Asia 0.6% 0.5% 1.9% 0.2% 0.1% 1.1% 1.4% 3.8% 0.3% 0.2% Latin America 3.2% 6.8% 2.5% 1.5% 2.1% 5.1% 6.5% 5.2% 5.0% 4.2% LAC 2 2.7% 6.3% 2.1% 1.2% 0.9% 2.2% 5.5% 2.2% 1.5% 0.8% Mexico 0.5% 0.5% 0.4% 0.3% 1.2% 2.9% 1.1% 3.0% 3.5% 3.4% MENA 1.8% 4.7% 1.6% 0.4% 0.2% 1.6% 4.0% 2.8% 0.8% 0.4% Sub-Saharan Africa 0.7% 1.9% 0.5% 0.3% 0.1% 0.6% 1.9% 0.6% 0.4% 0.1% Total developing 13.1% 22.5% 24.2% 6.2% 9.2% 26.8% 25.6% 38.8% 17.5% 32.3% Source: Calculated from Comtrade database Note: EA 2 is East Asia excluding China; LAC 2 is Latin America excluding Mexico.
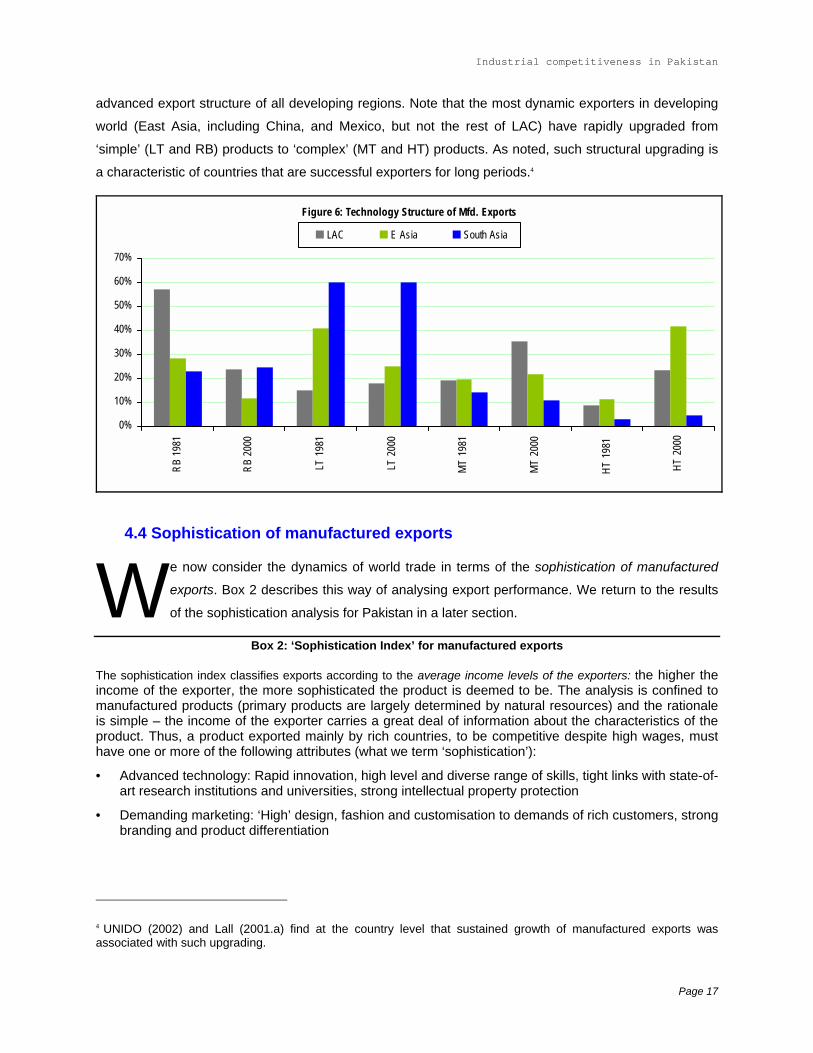
Figure 6 shows the technology structure of exports in South Asia, East Asia and LAC in 1981 and 2000.
There are striking differences between the regions. South Asia has a preponderance of LT exports, and a
very low share of HT products (barely higher than Africa); its export structure has remained relatively
stagnant over the two decades. LAC reduces its dependence on RB products greatly, with significant
rises in MT (mainly the automotive industry) and HT products (led by electronics from Mexico). East Asia
also shifts significantly from RB and LT products to MT and HT products, ending the period with the most
Page 16
Industrial competitiveness in Pakistan
advanced export structure of all developing regions. Note that the most dynamic exporters in developing
world (East Asia, including China, and Mexico, but not the rest of LAC) have rapidly upgraded from
‘simple’ (LT and RB) products to ‘complex’ (MT and HT) products. As noted, such structural upgrading is
a characteristic of countries that are successful exporters for long periods.4
Figure 6: Technology Structure of Mfd. Exports
0%
10%
20%
30%
40%
50%
60%
70%
RB 1
981
RB 2
000
LT 1
981
LT 2
000
MT
1981
MT
2000
HT 1
981
HT 2
000
LAC E Asia South Asia
4.4 Sophistication of manufactured exports
W e now consider the dynamics of world trade in terms of the sophistication of manufactured
exports. Box 2 describes this way of analysing export performance. We return to the results
of the sophistication analysis for Pakistan in a later section.
Box 2: ‘Sophistication Index’ for manufactured exports
The sophistication index classifies exports according to the average income levels of the exporters: the higher the income of the exporter, the more sophisticated the product is deemed to be. The analysis is confined to manufactured products (primary products are largely determined by natural resources) and the rationale is simple – the income of the exporter carries a great deal of information about the characteristics of the product. Thus, a product exported mainly by rich countries, to be competitive despite high wages, must have one or more of the following attributes (what we term ‘sophistication’):
•
•
Advanced technology: Rapid innovation, high level and diverse range of skills, tight links with state-of-art research institutions and universities, strong intellectual property protection
Demanding marketing: ‘High’ design, fashion and customisation to demands of rich customers, strong branding and product differentiation
4 UNIDO (2002) and Lall (2001.a) find at the country level that sustained growth of manufactured exports was associated with such upgrading.
Page 17
Industrial competitiveness in Pakistan
• Scale and agglomeration economies: large scale facilities needing complex organisational and supply-chain management skills, tight supply links with advanced suppliers and interactions with competitors, leading edge infrastructure (particularly in information technology).
The index is not, however, a measure only of technological, marketing and agglomeration advantages. It also captures other elements that can allow high wage countries to retain a competitive edge: particular natural resources (e.g. furs are only available from a few rich countries, pine for paper manufacture is largely found in a few Northern regions and so on), transport costs (heavy products consumed in rich countries may have to be produced in close proximity to the market) and trade distortions (agricultural protection and subsidies). However, even with these problems (some of which are easy to detect) the index provides a useful map of comparative advantage and its dynamics over time. While there is a general shift in export production from rich to poor countries, different products are relocating at different rates. And the shift is not uniformly down the income scale; some locations (i.e. some groups of countries) are gaining much more than others.
The sophistication index shown here is calculated at the three-digit SITC (Revision 2) level for 237 products (of which, 181 are manufactures) for 1990 and 2000. However, more detailed four-digit level data are used for analysing performance for selected industries (e.g. textiles and clothing, below). Exporting countries are grouped into ten income categories in 1990 and 2000 (the composition of each group differs over time as countries move up or down the income scale). The percentage share in world exports of each income group is multiplied by its average income for each product, and the final value is standardized to range from zero to 100 for all products.
To facilitate analysis, however, products are grouped into six categories according to their sophistication scores; no a priori criteria are applied, and the groups are formed by dividing the total of 181 products into sets of 30 products each (31 for the last group). Level 1 is the most sophisticated category and level 6 is the least.
There is, as expected, broad correspondence between technology levels and sophistication. Thus, most high technology products tend to be high on the sophistication scale (e.g. measuring instruments or aircraft) and most low-sophistication products tend to be low technology (footwear, undergarments) or resource based (pottery or some vegetable oils). However, the correspondence is not exact, since other factors affect the ranking. Thus, some medium technology products like radio receivers appear very low on the sophistication index because their production has shifted almost entirely to low wage countries, while some resource based products (chocolate and cheese) appear high on the sophistication index because of advanced skill requirements, subsidies and so on. Some products, like semiconductors, remain highly complex in their design and core processes that remain in rich countries but have simple final assembly operations that allow them to be finished in poorer ones; thus they appear in the middle rather than top end of the scale.
This illustrates one useful feature of the sophistication index: it overcomes some aggregation problems inherent in broad technology groupings, where products are placed in low, medium and high technology groups on the basis of general industrial R&D propensities. The sophistication index allows distinctions to be drawn within each group, differentiating products according to technology, relocation, differentiation and so on.
At the country level, the index allows the benchmarking of the sophistication of national exports and changes in sophistication over time. Since the index can be calculated at any level of detail (it does not require any data apart from the identity and incomes of the exporting countries) it allows performance to be tracked at finer product levels.
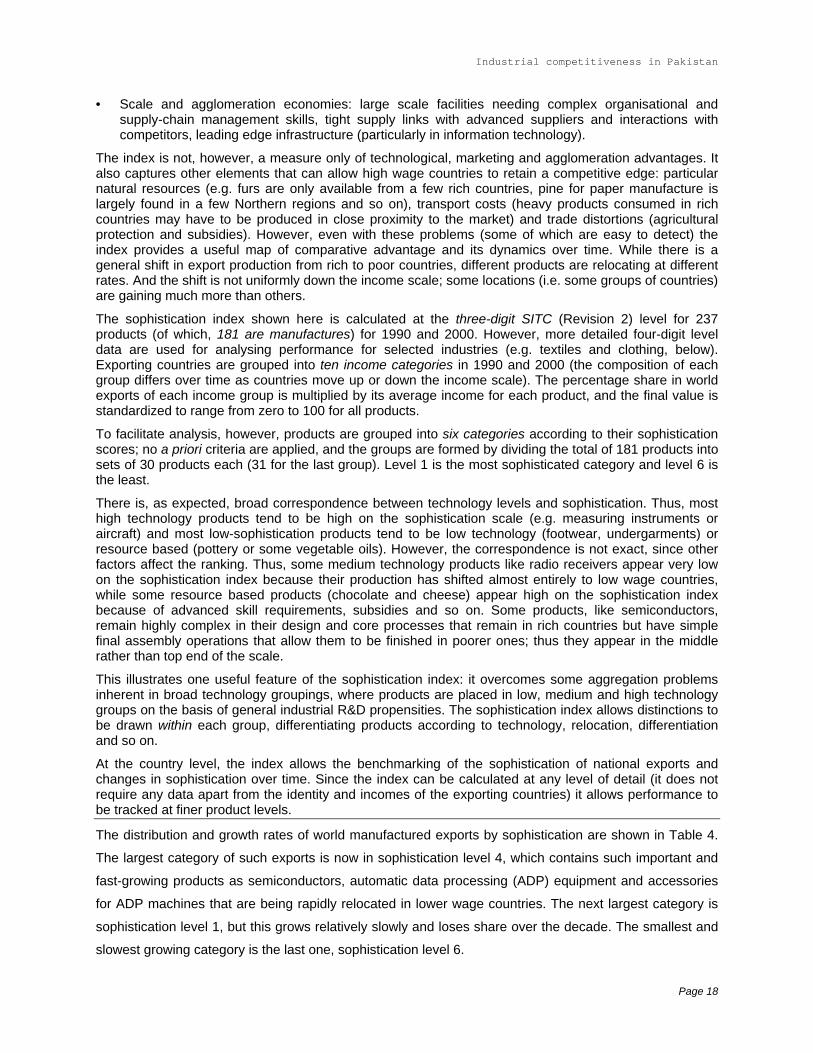
The distribution and growth rates of world manufactured exports by sophistication are shown in Table 4.
The largest category of such exports is now in sophistication level 4, which contains such important and
fast-growing products as semiconductors, automatic data processing (ADP) equipment and accessories
for ADP machines that are being rapidly relocated in lower wage countries. The next largest category is
sophistication level 1, but this grows relatively slowly and loses share over the decade. The smallest and
slowest growing category is the last one, sophistication level 6.
Page 18
Industrial competitiveness in Pakistan
The best product ‘positioning’ for growth is categories 4, 5 and 3 – high sophistication is not necessarily
the route to rapid export expansion. This is in line with the finding that exports by developing countries are
generally growing faster than those by industrialized countries. The distinction between the technological
and sophistication classifications shows up clearly here: high technology products are the most rapidly
growing segment of world trade but high sophistication products are not. The reason is that many high
technology products are becoming ‘less sophisticated’ because they have labour-intensive processes that
have led to their relocation in lower wage countries. However, they do not move to the bottom of the
sophistication scale: the relocation is not to the poorest countries but to those with relatively low wages in
combination with skilled and disciplined labour, growing industrial capabilities, efficient infrastructure and
stable, welcoming policy regimes. These economies are in the middle rather than the low income range.
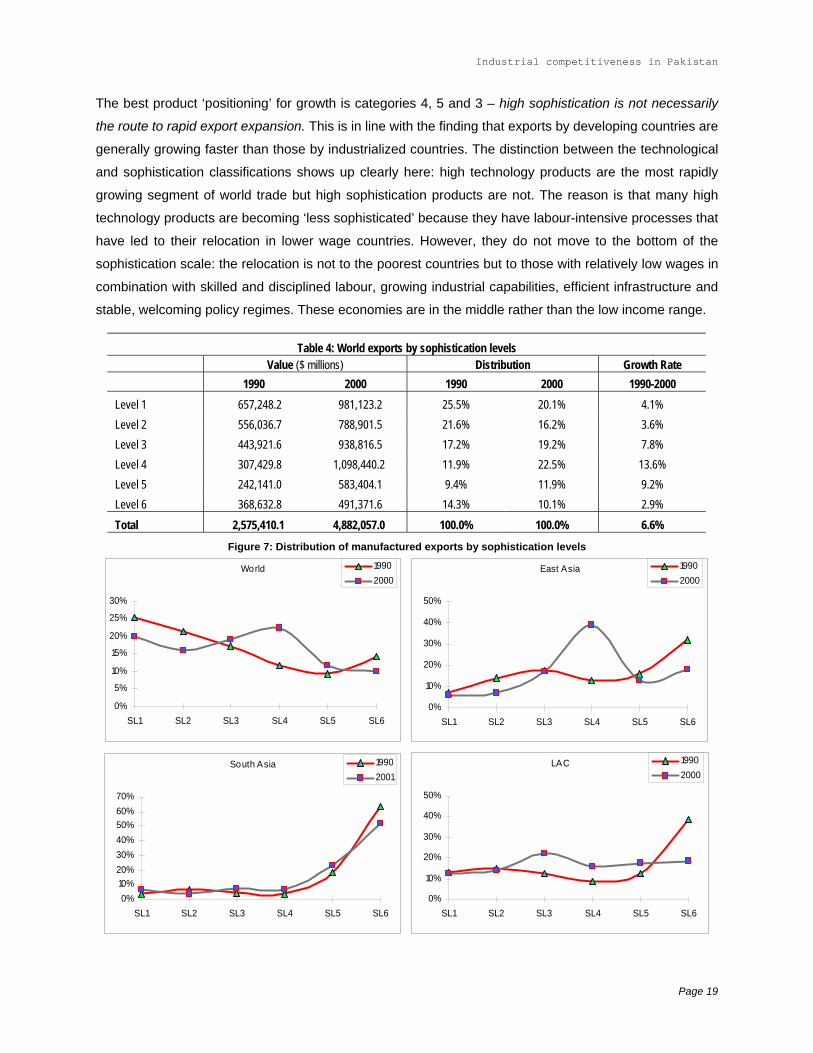
Table 4: World exports by sophistication levels Value ($ millions) Distribution Growth Rate 1990 2000 1990 2000 1990-2000
Level 1 657,248.2 981,123.2 25.5% 20.1% 4.1% Level 2 556,036.7 788,901.5 21.6% 16.2% 3.6% Level 3 443,921.6 938,816.5 17.2% 19.2% 7.8% Level 4 307,429.8 1,098,440.2 11.9% 22.5% 13.6% Level 5 242,141.0 583,404.1 9.4% 11.9% 9.2% Level 6 368,632.8 491,371.6 14.3% 10.1% 2.9% Total 2,575,410.1 4,882,057.0 100.0% 100.0% 6.6%
Figure 7: Distribution of manufactured exports by sophistication levels
World
0%
5%
10%
15%
20%
25%
30%
SL1 SL2 SL3 SL4 SL5 SL6
19902000
South Asia
0%10%20%30%40%50%60%70%
SL1 SL2 SL3 SL4 SL5 SL6
19902001
East Asia
0%
10%
20%
30%
40%
50%
SL1 SL2 SL3 SL4 SL5 SL6
19902000
LAC
0%
10%
20%
30%
40%
50%
SL1 SL2 SL3 SL4 SL5 SL6
19902000
Page 19
Industrial competitiveness in Pakistan
Figure 7 shows the distribution of manufactured exports by sophistication levels in the world as a whole
and in three developing regions in 1990 and 2000 (the data for South Asia are for 1990 and 2001). There
are striking differences in the patterns. Some highlights are:
•
•
•
In South Asia, exports are preponderantly in the low sophistication group, but there is small fall in its
share over time, with a corresponding gain in the medium sophistication group. The gain is due
largely to India – the rest of region remains at the low end of the sophistication range (below).
The structure of East Asian exports moves significantly towards the medium sophistication category,
driven by semiconductor, automatic data processing machines and their parts and accessories in
level 4. However, its level 3 exports like electrical machinery and telecommunications apparatus are
also very large, over 2.5 times larger than LAC in value. The share of highly sophisticated products in
East Asian exports remains relatively small and falls slightly over time.
LAC exports also move towards medium sophistication but there is a less pronounced shift towards
level 4 than in East Asia. LAC starts with and retains a higher share of sophisticated products than
East Asia (mainly category 1 products like auto engines and components, aircraft and
pharmaceuticals). In the medium category, its dynamic products include telecommunications,
automobiles and electrical machinery (level 3); it also has significant values in category 4 exports (but
East Asian exports are nearly 10 times larger). However, a very large part of its level 3 and 4 exports
come from Mexico; the rest of LAC lags in high technology exports.
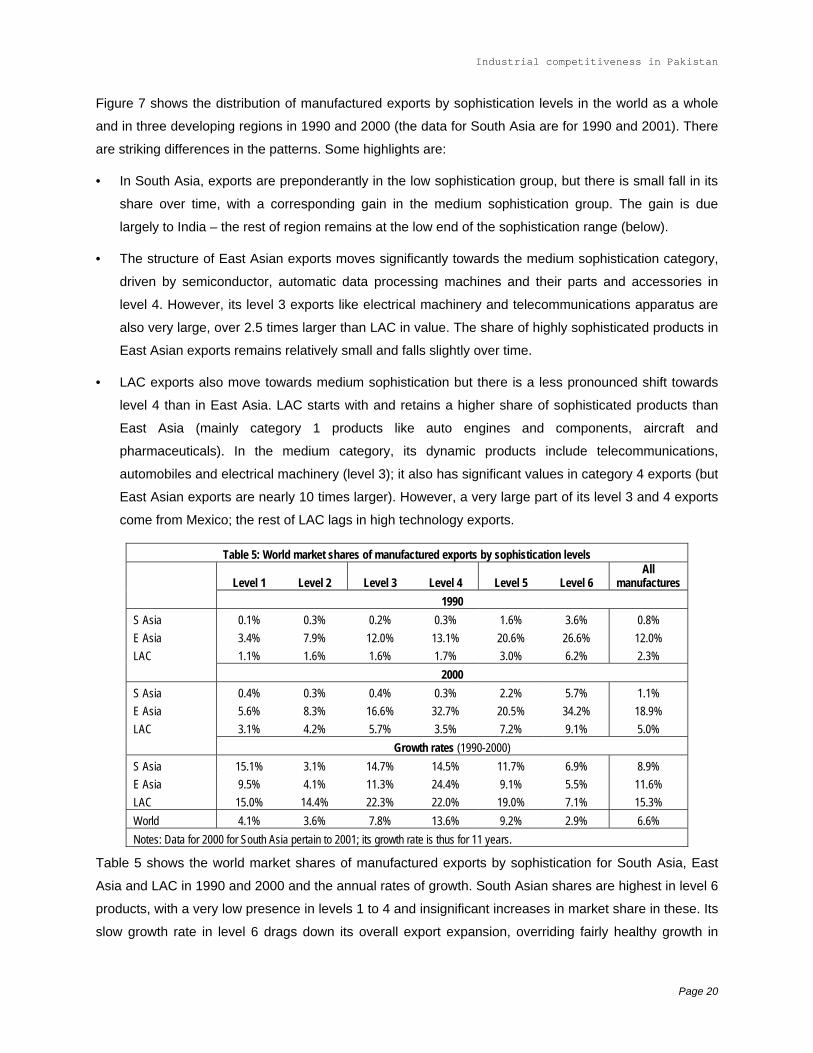
Table 5: World market shares of manufactured exports by sophistication levels
Level 1 Level 2 Level 3 Level 4 Level 5 Level 6 All
manufactures 1990
S Asia 0.1% 0.3% 0.2% 0.3% 1.6% 3.6% 0.8% E Asia 3.4% 7.9% 12.0% 13.1% 20.6% 26.6% 12.0% LAC 1.1% 1.6% 1.6% 1.7% 3.0% 6.2% 2.3% 2000 S Asia 0.4% 0.3% 0.4% 0.3% 2.2% 5.7% 1.1% E Asia 5.6% 8.3% 16.6% 32.7% 20.5% 34.2% 18.9% LAC 3.1% 4.2% 5.7% 3.5% 7.2% 9.1% 5.0% Growth rates (1990-2000) S Asia 15.1% 3.1% 14.7% 14.5% 11.7% 6.9% 8.9% E Asia 9.5% 4.1% 11.3% 24.4% 9.1% 5.5% 11.6% LAC 15.0% 14.4% 22.3% 22.0% 19.0% 7.1% 15.3% World 4.1% 3.6% 7.8% 13.6% 9.2% 2.9% 6.6% Notes: Data for 2000 for South Asia pertain to 2001; its growth rate is thus for 11 years.
Table 5 shows the world market shares of manufactured exports by sophistication for South Asia, East
Asia and LAC in 1990 and 2000 and the annual rates of growth. South Asian shares are highest in level 6
products, with a very low presence in levels 1 to 4 and insignificant increases in market share in these. Its
slow growth rate in level 6 drags down its overall export expansion, overriding fairly healthy growth in
Page 20
Industrial competitiveness in Pakistan
levels 1, 3 and 4 (but this is from very small bases in each). East Asia has a significant global presence in
all sophistication categories, with around one-third world market share in levels 4 and 6 and around one-
fifth in level 5. The main drivers of its export expansion are 4 and 3, containing the dynamic HT products
that have been relocating to the developing world. Latin America’s main market presence is in levels 6, 5
and 3, but with a more even spread than in East Asia. Its main drivers have again been levels 3 and 4,
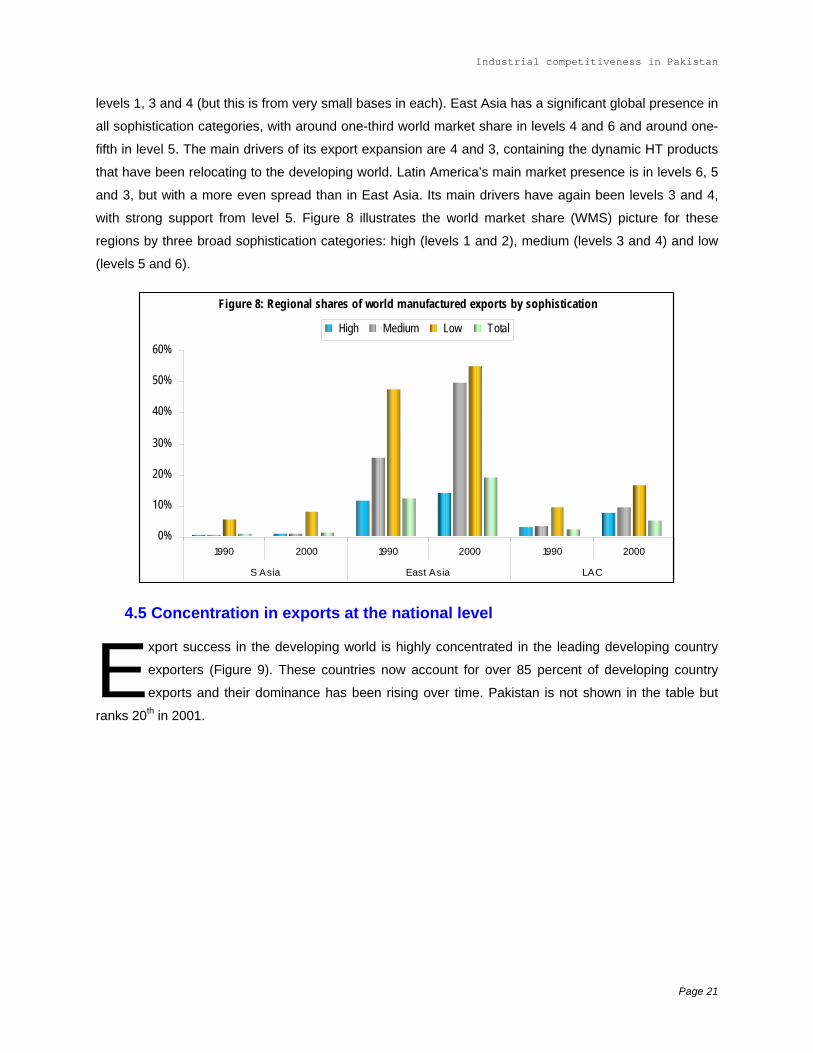
with strong support from level 5. Figure 8 illustrates the world market share (WMS) picture for these
regions by three broad sophistication categories: high (levels 1 and 2), medium (levels 3 and 4) and low
(levels 5 and 6).
Figure 8: Regional shares of world manufactured exports by sophistication
0%
10%
20%
30%
40%
50%
60%
1990 2000 1990 2000 1990 2000
S Asia East Asia LAC
High Medium Low Total
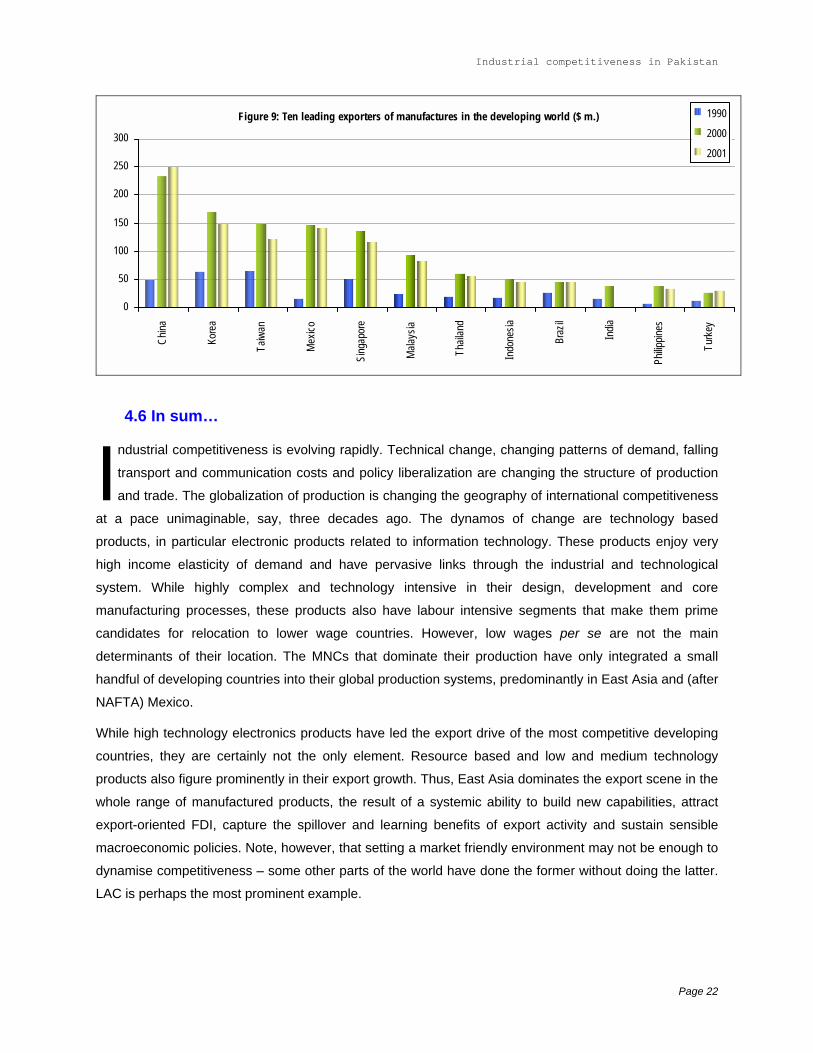
4.5 Concentration in exports at the national level
Export success in the developing world is highly concentrated in the leading developing country
exporters (Figure 9). These countries now account for over 85 percent of developing country
exports and their dominance has been rising over time. Pakistan is not shown in the table but
ranks 20th in 2001.
Page 21
Industrial competitiveness in Pakistan
Figure 9: Ten leading exporters of manufactures in the developing world ($ m.)
0
50
100
150
200
250
300
Chin
a
Kor
ea
Taiw
an
Mex
ico
Sing
apor
e
Mala
ysia
Tha
iland
Indo
nesia
Bra
zil
India
Phil
ippine
s
Tur
key
1990
2000
2001
4.6 In sum…
I ndustrial competitiveness is evolving rapidly. Technical change, changing patterns of demand, falling
transport and communication costs and policy liberalization are changing the structure of production
and trade. The globalization of production is changing the geography of international competitiveness
at a pace unimaginable, say, three decades ago. The dynamos of change are technology based
products, in particular electronic products related to information technology. These products enjoy very
high income elasticity of demand and have pervasive links through the industrial and technological
system. While highly complex and technology intensive in their design, development and core
manufacturing processes, these products also have labour intensive segments that make them prime
candidates for relocation to lower wage countries. However, low wages per se are not the main
determinants of their location. The MNCs that dominate their production have only integrated a small
handful of developing countries into their global production systems, predominantly in East Asia and (after
NAFTA) Mexico.
While high technology electronics products have led the export drive of the most competitive developing
countries, they are certainly not the only element. Resource based and low and medium technology
products also figure prominently in their export growth. Thus, East Asia dominates the export scene in the
whole range of manufactured products, the result of a systemic ability to build new capabilities, attract
export-oriented FDI, capture the spillover and learning benefits of export activity and sustain sensible
macroeconomic policies. Note, however, that setting a market friendly environment may not be enough to
dynamise competitiveness – some other parts of the world have done the former without doing the latter.
LAC is perhaps the most prominent example.
Page 22
Industrial competitiveness in Pakistan
South Asia is a weak performer in the competitiveness stakes. Its world market shares remain small and
its export structure dominated by low technology and low sophistication products. As shown below, its
economies have not tapped the mainsprings of export dynamism in a globalising world.
5. Pakistan: the current policy environment for manufacturing
5.1 Trade policy
I nternational competitiveness requires ready access to international inputs at close to world prices and
a domestic market subject to competitive pressure, between domestic producers and between them
and imports. Experience in Pakistan and elsewhere suggests that highly protected domestic markets
not only reduce the incentive to export, but also penalise the economy by allowing inefficient domestic
producers to extract policy-induced rents from domestic consumers. While there is a plausible theoretical
case for infant industry support of activities with strong learning effects and positive externalities,
experience suggests that if such a policy is to be pursued it should be time-bound and performance
linked. Theory also suggests that tariff protection is not the most economically efficient means of
providing such support, although in practice it has been by far the most common.
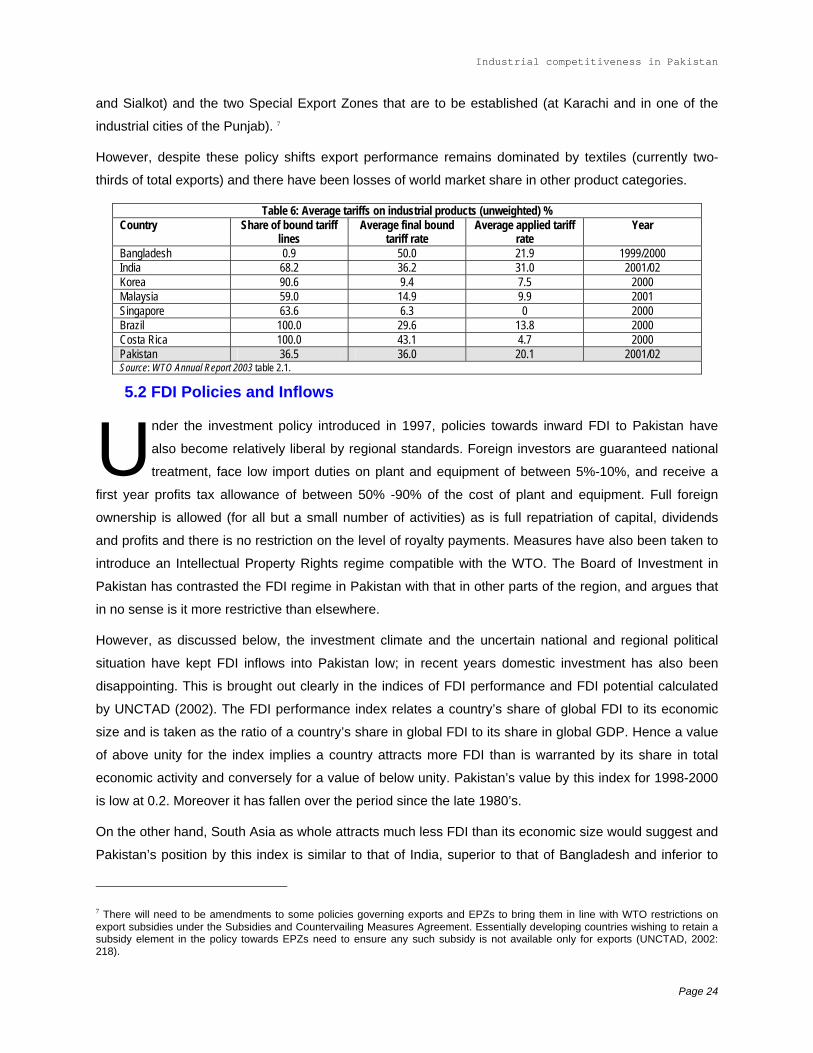
Pakistan has liberalised its trade policies significantly over the last decade or so. At the present it is one
of the more open trade regimes in South Asia, although South Asia itself remains relatively protectionist
by international standards. Pakistan has unilaterally reduced import tariffs so that its applied rates are
often below the bound rates to which it is committed by WTO membership. Table 6 shows average
manufacturing tariffs for selected economies and Pakistan circa 2001/02. The average for Pakistan has
fallen since then as the maximum tariff was reduced from 30% to 25% in 2002 and most tariffs are now in
one of four tiers from 5% to 25%, but a few sensitive items (like motor vehicles and certain textile goods)
continue to have higher rates. There has also been a phasing out of quantitative import restrictions for
balance of payments purposes and a running down of the system of exemptions from tariffs (the Statutory
Rules Orders). The simple average applied tariff of around 20% in 2001/02 must be compared with an
average of 56% in 1995 and nearly 80% 1985.6
Exporters meeting minimum local value-added ratios are eligible for import duty drawbacks for imports of
raw materials and plant and equipment, which face modest tariffs of 5% or 10%. Full access to imported
inputs duty-free and other fiscal concessions are available to firms located in EPZs (at Karachi, Risalpur
6 The figure for 1995 comes from WTO (2002) and for 1985 (of 77%) from World Bank (2002) Table 2.7.
Page 23
Industrial competitiveness in Pakistan
and Sialkot) and the two Special Export Zones that are to be established (at Karachi and in one of the
industrial cities of the Punjab). 7
However, despite these policy shifts export performance remains dominated by textiles (currently two-
thirds of total exports) and there have been losses of world market share in other product categories.
Table 6: Average tariffs on industrial products (unweighted) % Country Share of bound tariff
lines Average final bound
tariff rate Average applied tariff
rate Year
Bangladesh 0.9 50.0 21.9 1999/2000 India 68.2 36.2 31.0 2001/02 Korea 90.6 9.4 7.5 2000 Malaysia 59.0 14.9 9.9 2001 Singapore 63.6 6.3 0 2000 Brazil 100.0 29.6 13.8 2000 Costa Rica 100.0 43.1 4.7 2000 Pakistan 36.5 36.0 20.1 2001/02 Source: WTO Annual Report 2003 table 2.1.
5.2 FDI Policies and Inflows
U nder the investment policy introduced in 1997, policies towards inward FDI to Pakistan have
also become relatively liberal by regional standards. Foreign investors are guaranteed national
treatment, face low import duties on plant and equipment of between 5%-10%, and receive a
first year profits tax allowance of between 50% -90% of the cost of plant and equipment. Full foreign
ownership is allowed (for all but a small number of activities) as is full repatriation of capital, dividends
and profits and there is no restriction on the level of royalty payments. Measures have also been taken to
introduce an Intellectual Property Rights regime compatible with the WTO. The Board of Investment in
Pakistan has contrasted the FDI regime in Pakistan with that in other parts of the region, and argues that
in no sense is it more restrictive than elsewhere.
However, as discussed below, the investment climate and the uncertain national and regional political
situation have kept FDI inflows into Pakistan low; in recent years domestic investment has also been
disappointing. This is brought out clearly in the indices of FDI performance and FDI potential calculated
by UNCTAD (2002). The FDI performance index relates a country’s share of global FDI to its economic
size and is taken as the ratio of a country’s share in global FDI to its share in global GDP. Hence a value
of above unity for the index implies a country attracts more FDI than is warranted by its share in total
economic activity and conversely for a value of below unity. Pakistan’s value by this index for 1998-2000
is low at 0.2. Moreover it has fallen over the period since the late 1980’s.
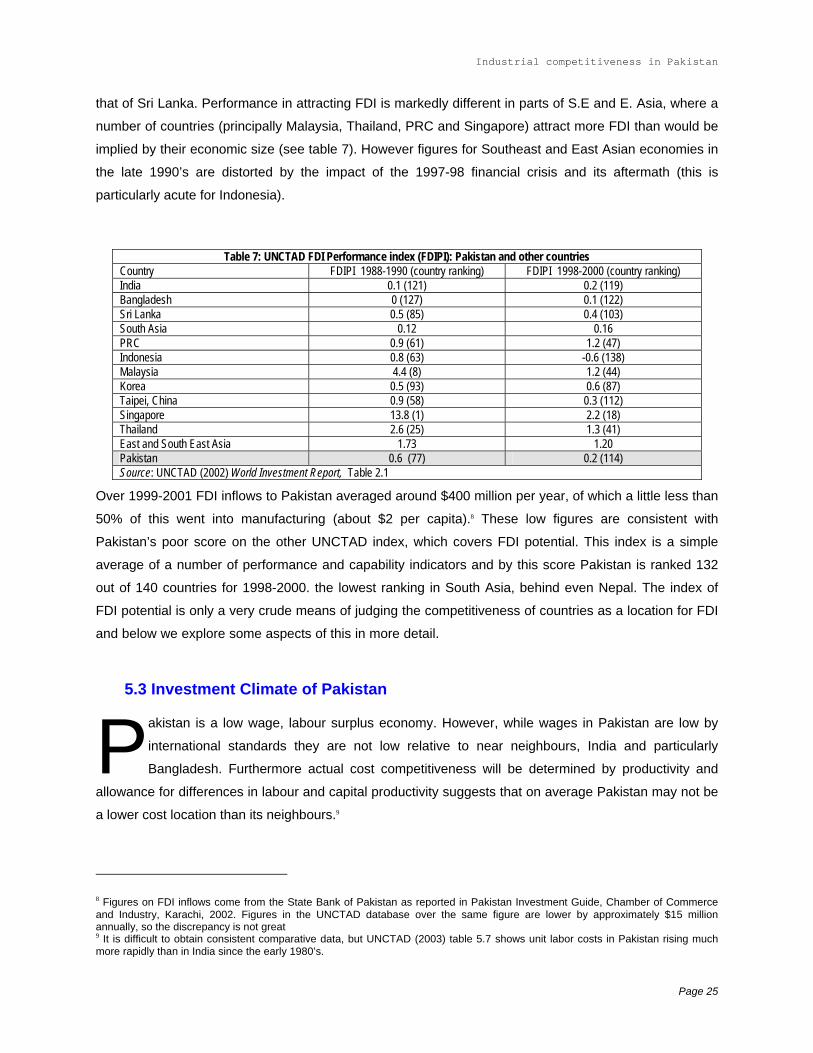
On the other hand, South Asia as whole attracts much less FDI than its economic size would suggest and
Pakistan’s position by this index is similar to that of India, superior to that of Bangladesh and inferior to
7 There will need to be amendments to some policies governing exports and EPZs to bring them in line with WTO restrictions on export subsidies under the Subsidies and Countervailing Measures Agreement. Essentially developing countries wishing to retain a subsidy element in the policy towards EPZs need to ensure any such subsidy is not available only for exports (UNCTAD, 2002: 218).
Page 24
Industrial competitiveness in Pakistan
that of Sri Lanka. Performance in attracting FDI is markedly different in parts of S.E and E. Asia, where a
number of countries (principally Malaysia, Thailand, PRC and Singapore) attract more FDI than would be
implied by their economic size (see table 7). However figures for Southeast and East Asian economies in
the late 1990’s are distorted by the impact of the 1997-98 financial crisis and its aftermath (this is
particularly acute for Indonesia).
Table 7: UNCTAD FDI Performance index (FDIPI): Pakistan and other countries Country FDIPI 1988-1990 (country ranking) FDIPI 1998-2000 (country ranking) India 0.1 (121) 0.2 (119) Bangladesh 0 (127) 0.1 (122) Sri Lanka 0.5 (85) 0.4 (103) South Asia 0.12 0.16 PRC 0.9 (61) 1.2 (47) Indonesia 0.8 (63) -0.6 (138) Malaysia 4.4 (8) 1.2 (44) Korea 0.5 (93) 0.6 (87) Taipei, China 0.9 (58) 0.3 (112) Singapore 13.8 (1) 2.2 (18) Thailand 2.6 (25) 1.3 (41) East and South East Asia 1.73 1.20 Pakistan 0.6 (77) 0.2 (114) Source: UNCTAD (2002) World Investment Report, Table 2.1
Over 1999-2001 FDI inflows to Pakistan averaged around $400 million per year, of which a little less than
50% of this went into manufacturing (about $2 per capita).8 These low figures are consistent with
Pakistan’s poor score on the other UNCTAD index, which covers FDI potential. This index is a simple
average of a number of performance and capability indicators and by this score Pakistan is ranked 132
out of 140 countries for 1998-2000. the lowest ranking in South Asia, behind even Nepal. The index of
FDI potential is only a very crude means of judging the competitiveness of countries as a location for FDI
and below we explore some aspects of this in more detail.
5.3 Investment Climate of Pakistan
Pakistan is a low wage, labour surplus economy. However, while wages in Pakistan are low by
international standards they are not low relative to near neighbours, India and particularly
Bangladesh. Furthermore actual cost competitiveness will be determined by productivity and
allowance for differences in labour and capital productivity suggests that on average Pakistan may not be
a lower cost location than its neighbours.9
8 Figures on FDI inflows come from the State Bank of Pakistan as reported in Pakistan Investment Guide, Chamber of Commerce and Industry, Karachi, 2002. Figures in the UNCTAD database over the same figure are lower by approximately $15 million annually, so the discrepancy is not great 9 It is difficult to obtain consistent comparative data, but UNCTAD (2003) table 5.7 shows unit labor costs in Pakistan rising much more rapidly than in India since the early 1980’s.
Page 25
Industrial competitiveness in Pakistan
It is widely acknowledged that slow growth in private investment, particularly in large-scale manufacturing,
has been one of the key constraints on Pakistan’s economic growth. Part of the explanation lies in the
uncertain political scene, but more narrowly economic and institutional aspects of the general investment
climate have also had a negative impact on investment decisions.
It is a comon complaint from the private sector that Pakistan still has a heavily regulated business
environment. A particular cause for concern is the lengthy delay in customs clearance. The average time
to clear customs, it is argued, is both higher than in neighbours and little different to what it was a decade
ago. Delays at customs make it very difficult for business to keep optimal levels of inventories and
undermine the notion of ‘just-in-time’ planning. However there is an awareness of these problems and in
particular of the need to streamline tax administration and measures have been introduced to reform the
Central Bureau of Revenue. For example, a system of self-assessment has been introduced with a view
to minimizing contact with tax officials, and there has been an experiment with a new form of customs
documentation designed to minimize the number of forms to be completed with a view to speeding up
customs clearance.
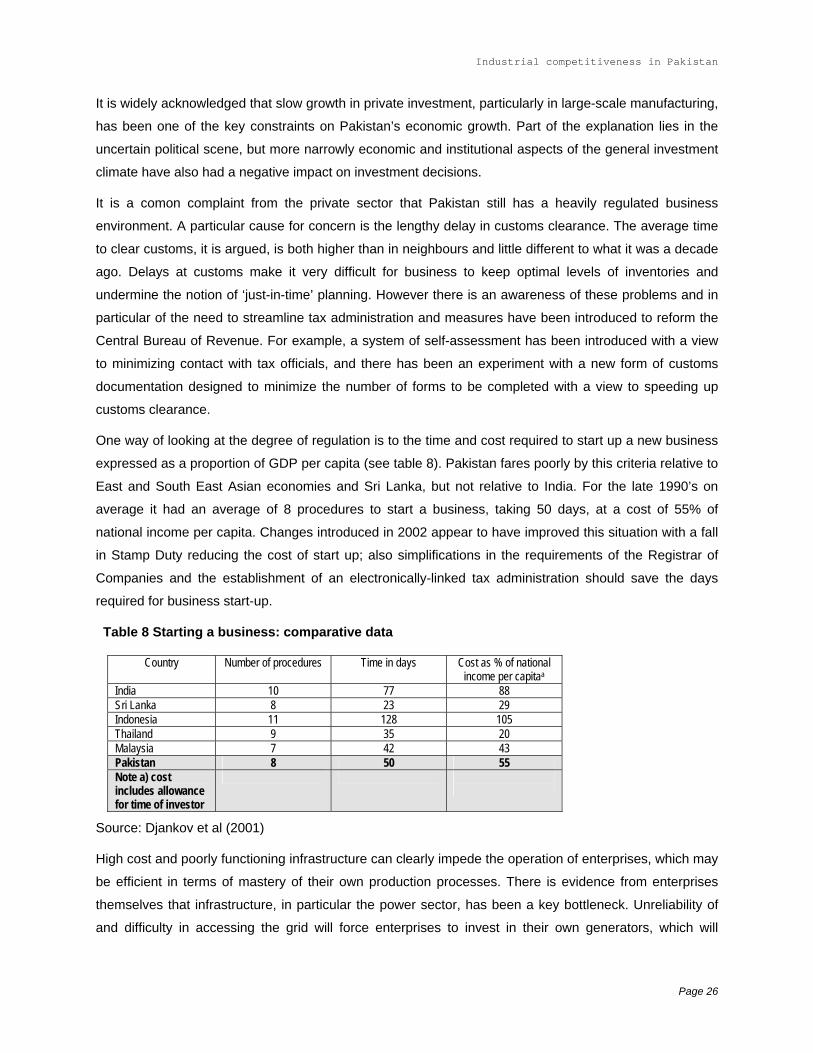
One way of looking at the degree of regulation is to the time and cost required to start up a new business
expressed as a proportion of GDP per capita (see table 8). Pakistan fares poorly by this criteria relative to
East and South East Asian economies and Sri Lanka, but not relative to India. For the late 1990’s on
average it had an average of 8 procedures to start a business, taking 50 days, at a cost of 55% of
national income per capita. Changes introduced in 2002 appear to have improved this situation with a fall
in Stamp Duty reducing the cost of start up; also simplifications in the requirements of the Registrar of
Companies and the establishment of an electronically-linked tax administration should save the days
required for business start-up.
Table 8 Starting a business: comparative data
Country Number of procedures Time in days Cost as % of national income per capitaa
India 10 77 88 Sri Lanka 8 23 29 Indonesia 11 128 105 Thailand 9 35 20 Malaysia 7 42 43 Pakistan 8 50 55 Note a) cost includes allowance for time of investor
Source: Djankov et al (2001)
High cost and poorly functioning infrastructure can clearly impede the operation of enterprises, which may
be efficient in terms of mastery of their own production processes. There is evidence from enterprises
themselves that infrastructure, in particular the power sector, has been a key bottleneck. Unreliability of
and difficulty in accessing the grid will force enterprises to invest in their own generators, which will
Page 26
Industrial competitiveness in Pakistan
normally be a high cost source of power supply. In the telecom sector there is a shortage of fixed line
connections. The time taken to get a telephone connection is still high by international standards and
waiting times for connections have not fallen over recent years. Connection costs for phone lines are also
high by international standards and are very much below those in India. These constraints and high costs
in telecoms are a contributory factor in the relatively low internet usage amongst enterprises in Pakistan.
Transport has also been discussed as a potential bottleneck, particularly in relation to exports. In relation
to ports, for example there are informal estimates that suggest that port handling costs in Karachi and
Qasim are 50% higher than in Bombay. These infrastructure deficiencies clearly need to be addressed to
strengthen the competitiveness environment.
6. Benchmarking Pakistan’s performance
6.1 Manufacturing value added (MVA)
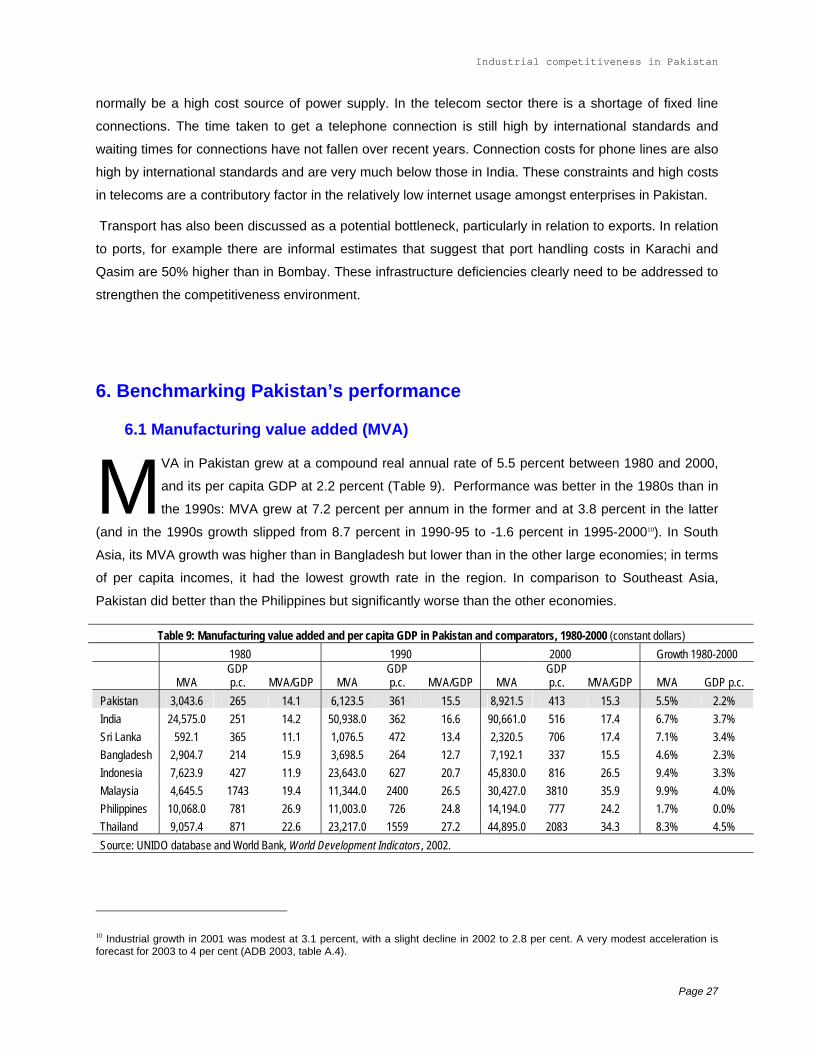
M VA in Pakistan grew at a compound real annual rate of 5.5 percent between 1980 and 2000,
and its per capita GDP at 2.2 percent (Table 9). Performance was better in the 1980s than in
the 1990s: MVA grew at 7.2 percent per annum in the former and at 3.8 percent in the latter
(and in the 1990s growth slipped from 8.7 percent in 1990-95 to -1.6 percent in 1995-200010). In South
Asia, its MVA growth was higher than in Bangladesh but lower than in the other large economies; in terms
of per capita incomes, it had the lowest growth rate in the region. In comparison to Southeast Asia,
Pakistan did better than the Philippines but significantly worse than the other economies.
Table 9: Manufacturing value added and per capita GDP in Pakistan and comparators, 1980-2000 (constant dollars) 1980 1990 2000 Growth 1980-2000
MVA GDP p.c. MVA/GDP MVA
GDP p.c. MVA/GDP MVA
GDP p.c. MVA/GDP MVA GDP p.c.
Pakistan 3,043.6 265 14.1 6,123.5 361 15.5 8,921.5 413 15.3 5.5% 2.2% India 24,575.0 251 14.2 50,938.0 362 16.6 90,661.0 516 17.4 6.7% 3.7% Sri Lanka 592.1 365 11.1 1,076.5 472 13.4 2,320.5 706 17.4 7.1% 3.4% Bangladesh 2,904.7 214 15.9 3,698.5 264 12.7 7,192.1 337 15.5 4.6% 2.3% Indonesia 7,623.9 427 11.9 23,643.0 627 20.7 45,830.0 816 26.5 9.4% 3.3% Malaysia 4,645.5 1743 19.4 11,344.0 2400 26.5 30,427.0 3810 35.9 9.9% 4.0% Philippines 10,068.0 781 26.9 11,003.0 726 24.8 14,194.0 777 24.2 1.7% 0.0% Thailand 9,057.4 871 22.6 23,217.0 1559 27.2 44,895.0 2083 34.3 8.3% 4.5% Source: UNIDO database and World Bank, World Development Indicators, 2002.
10 Industrial growth in 2001 was modest at 3.1 percent, with a slight decline in 2002 to 2.8 per cent. A very modest acceleration is forecast for 2003 to 4 per cent (ADB 2003, table A.4).
Page 27
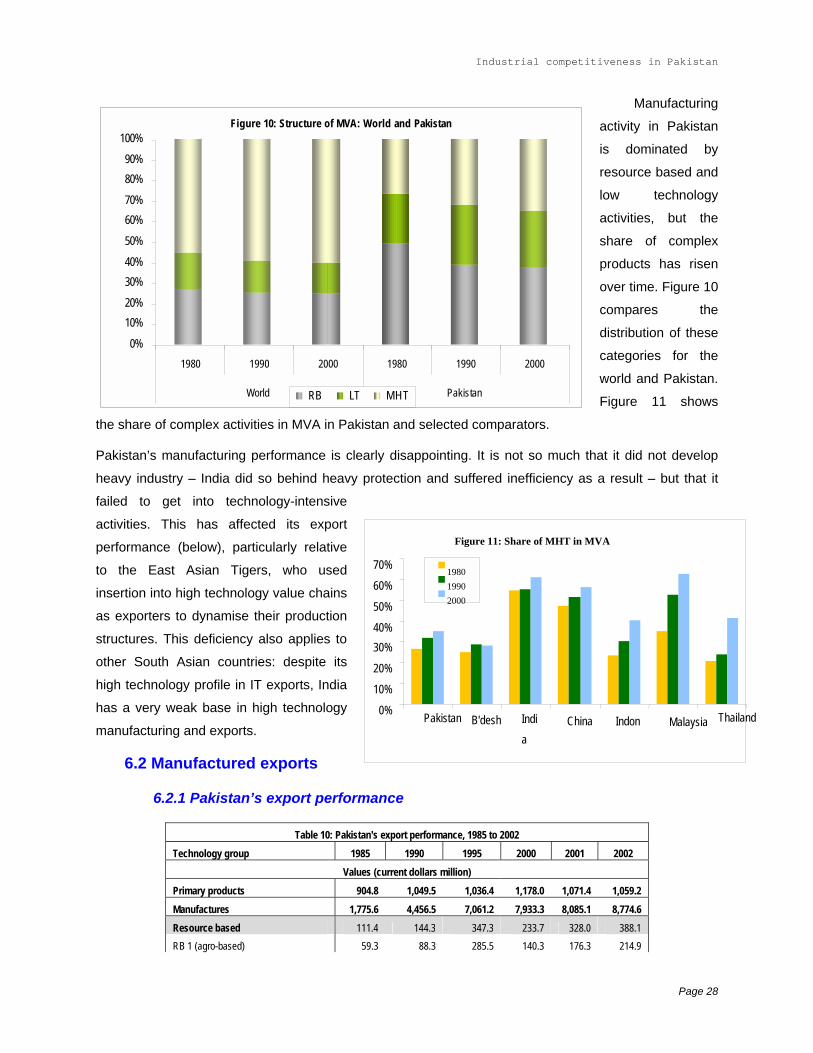
Industrial competitiveness in Pakistan
Manufacturing
activity in Pakistan
is dominated by
resource based and
low technology
activities, but the
share of complex
products has risen
over time. Figure 10
compares the
distribution of these
categories for the
world and Pakistan.
Figure 11 shows
the share of complex activities in MVA in Pakistan and selected comparators.
Figure 10: Structure of MVA: World and Pakistan
0%
10%20%
30%40%
50%
60%70%
80%90%
100%
1980 1990 2000 1980 1990 2000
World Pakistan RB LT MHT
Pakistan’s manufacturing performance is clearly disappointing. It is not so much that it did not develop
heavy industry – India did so behind heavy protection and suffered inefficiency as a result – but that it
failed to get into technology-intensive
activities. This has affected its export
performance (below), particularly relative
to the East Asian Tigers, who used
insertion into high technology value chains
as exporters to dynamise their production
structures. This deficiency also applies to
other South Asian countries: despite its
high technology profile in IT exports, India
has a very weak base in high technology
manufacturing and exports.
200019901980
ThailandMalaysia Indon China India
B'desh Pakistan
70%
60%
50%
40%30%
20%
10%
0%
Figure 11: Share of MHT in MVA
6.2 Manufactured exports
6.2.1 Pakistan’s export performance
Table 10: Pakistan's export performance, 1985 to 2002 Technology group 1985 1990 1995 2000 2001 2002
Values (current dollars million) Primary products 904.8 1,049.5 1,036.4 1,178.0 1,071.4 1,059.2 Manufactures 1,775.6 4,456.5 7,061.2 7,933.3 8,085.1 8,774.6 Resource based 111.4 144.3 347.3 233.7 328.0 388.1 RB 1 (agro-based) 59.3 88.3 285.5 140.3 176.3 214.9
Page 28
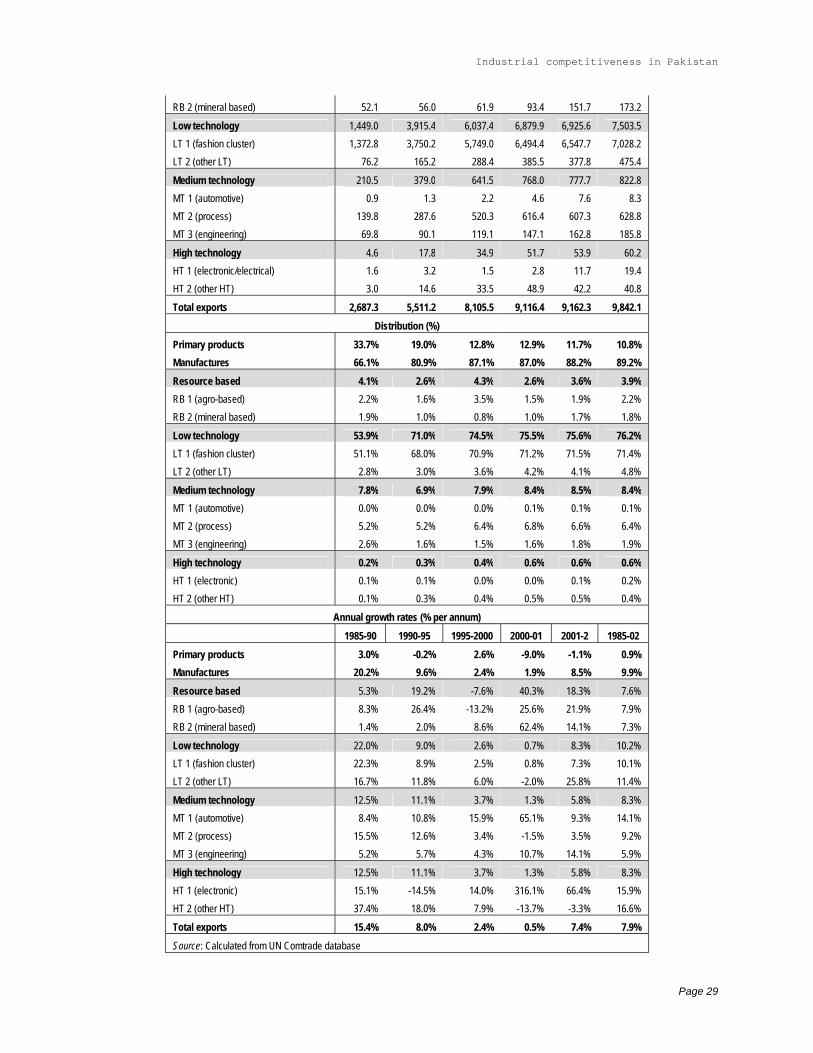
Industrial competitiveness in Pakistan
RB 2 (mineral based) 52.1 56.0 61.9 93.4 151.7 173.2
Low technology 1,449.0 3,915.4 6,037.4 6,879.9 6,925.6 7,503.5 LT 1 (fashion cluster) 1,372.8 3,750.2 5,749.0 6,494.4 6,547.7 7,028.2 LT 2 (other LT) 76.2 165.2 288.4 385.5 377.8 475.4
Medium technology 210.5 379.0 641.5 768.0 777.7 822.8 MT 1 (automotive) 0.9 1.3 2.2 4.6 7.6 8.3 MT 2 (process) 139.8 287.6 520.3 616.4 607.3 628.8 MT 3 (engineering) 69.8 90.1 119.1 147.1 162.8 185.8
High technology 4.6 17.8 34.9 51.7 53.9 60.2 HT 1 (electronic/electrical) 1.6 3.2 1.5 2.8 11.7 19.4 HT 2 (other HT) 3.0 14.6 33.5 48.9 42.2 40.8
Total exports 2,687.3 5,511.2 8,105.5 9,116.4 9,162.3 9,842.1 Distribution (%)
Primary products 33.7% 19.0% 12.8% 12.9% 11.7% 10.8% Manufactures 66.1% 80.9% 87.1% 87.0% 88.2% 89.2% Resource based 4.1% 2.6% 4.3% 2.6% 3.6% 3.9% RB 1 (agro-based) 2.2% 1.6% 3.5% 1.5% 1.9% 2.2% RB 2 (mineral based) 1.9% 1.0% 0.8% 1.0% 1.7% 1.8%
Low technology 53.9% 71.0% 74.5% 75.5% 75.6% 76.2% LT 1 (fashion cluster) 51.1% 68.0% 70.9% 71.2% 71.5% 71.4% LT 2 (other LT) 2.8% 3.0% 3.6% 4.2% 4.1% 4.8%
Medium technology 7.8% 6.9% 7.9% 8.4% 8.5% 8.4% MT 1 (automotive) 0.0% 0.0% 0.0% 0.1% 0.1% 0.1% MT 2 (process) 5.2% 5.2% 6.4% 6.8% 6.6% 6.4% MT 3 (engineering) 2.6% 1.6% 1.5% 1.6% 1.8% 1.9%
High technology 0.2% 0.3% 0.4% 0.6% 0.6% 0.6% HT 1 (electronic) 0.1% 0.1% 0.0% 0.0% 0.1% 0.2% HT 2 (other HT) 0.1% 0.3% 0.4% 0.5% 0.5% 0.4%
Annual growth rates (% per annum) 1985-90 1990-95 1995-2000 2000-01 2001-2 1985-02
Primary products 3.0% -0.2% 2.6% -9.0% -1.1% 0.9% Manufactures 20.2% 9.6% 2.4% 1.9% 8.5% 9.9% Resource based 5.3% 19.2% -7.6% 40.3% 18.3% 7.6% RB 1 (agro-based) 8.3% 26.4% -13.2% 25.6% 21.9% 7.9% RB 2 (mineral based) 1.4% 2.0% 8.6% 62.4% 14.1% 7.3%
Low technology 22.0% 9.0% 2.6% 0.7% 8.3% 10.2% LT 1 (fashion cluster) 22.3% 8.9% 2.5% 0.8% 7.3% 10.1% LT 2 (other LT) 16.7% 11.8% 6.0% -2.0% 25.8% 11.4%
Medium technology 12.5% 11.1% 3.7% 1.3% 5.8% 8.3% MT 1 (automotive) 8.4% 10.8% 15.9% 65.1% 9.3% 14.1% MT 2 (process) 15.5% 12.6% 3.4% -1.5% 3.5% 9.2% MT 3 (engineering) 5.2% 5.7% 4.3% 10.7% 14.1% 5.9%
High technology 12.5% 11.1% 3.7% 1.3% 5.8% 8.3% HT 1 (electronic) 15.1% -14.5% 14.0% 316.1% 66.4% 15.9% HT 2 (other HT) 37.4% 18.0% 7.9% -13.7% -3.3% 16.6%
Total exports 15.4% 8.0% 2.4% 0.5% 7.4% 7.9% Source: Calculated from UN Comtrade database
Page 29
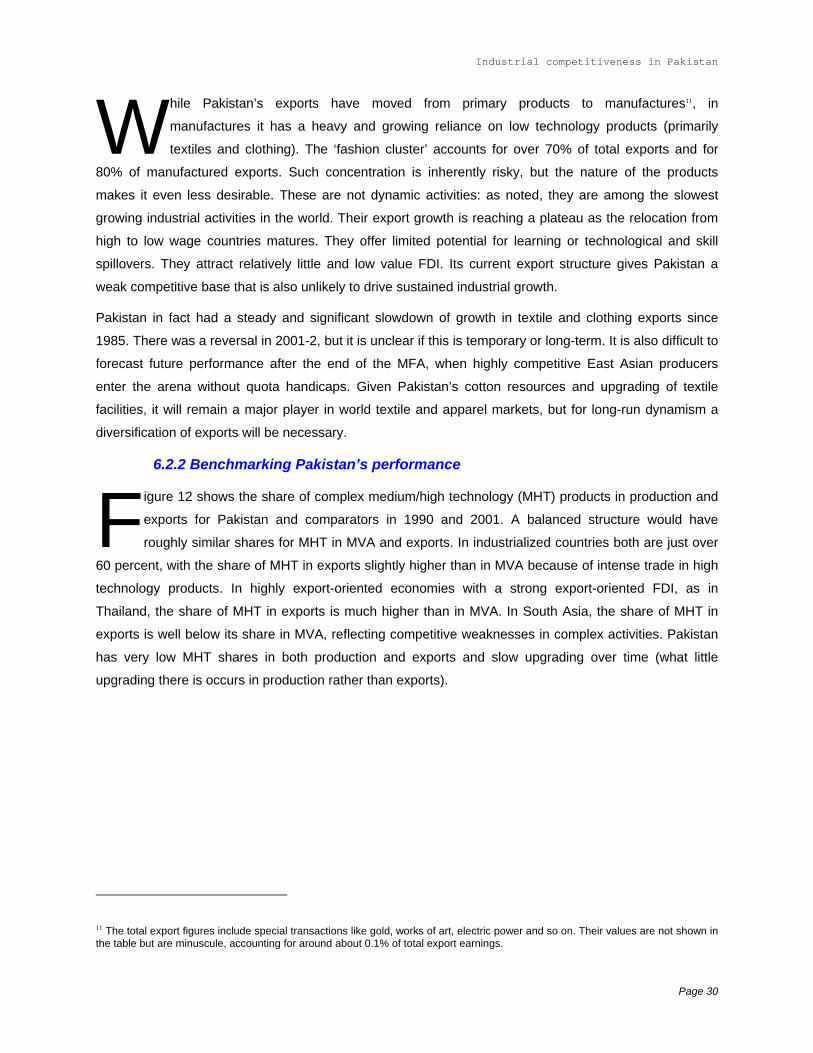
Industrial competitiveness in Pakistan
W hile Pakistan’s exports have moved from primary products to manufactures11, in
manufactures it has a heavy and growing reliance on low technology products (primarily
textiles and clothing). The ‘fashion cluster’ accounts for over 70% of total exports and for
80% of manufactured exports. Such concentration is inherently risky, but the nature of the products
makes it even less desirable. These are not dynamic activities: as noted, they are among the slowest
growing industrial activities in the world. Their export growth is reaching a plateau as the relocation from
high to low wage countries matures. They offer limited potential for learning or technological and skill
spillovers. They attract relatively little and low value FDI. Its current export structure gives Pakistan a
weak competitive base that is also unlikely to drive sustained industrial growth.
Pakistan in fact had a steady and significant slowdown of growth in textile and clothing exports since
1985. There was a reversal in 2001-2, but it is unclear if this is temporary or long-term. It is also difficult to
forecast future performance after the end of the MFA, when highly competitive East Asian producers
enter the arena without quota handicaps. Given Pakistan’s cotton resources and upgrading of textile
facilities, it will remain a major player in world textile and apparel markets, but for long-run dynamism a
diversification of exports will be necessary.
6.2.2 Benchmarking Pakistan’s performance
Figure 12 shows the share of complex medium/high technology (MHT) products in production and
exports for Pakistan and comparators in 1990 and 2001. A balanced structure would have
roughly similar shares for MHT in MVA and exports. In industrialized countries both are just over
60 percent, with the share of MHT in exports slightly higher than in MVA because of intense trade in high
technology products. In highly export-oriented economies with a strong export-oriented FDI, as in
Thailand, the share of MHT in exports is much higher than in MVA. In South Asia, the share of MHT in
exports is well below its share in MVA, reflecting competitive weaknesses in complex activities. Pakistan
has very low MHT shares in both production and exports and slow upgrading over time (what little
upgrading there is occurs in production rather than exports).
11 The total export figures include special transactions like gold, works of art, electric power and so on. Their values are not shown in the table but are minuscule, accounting for around about 0.1% of total export earnings.
Page 30
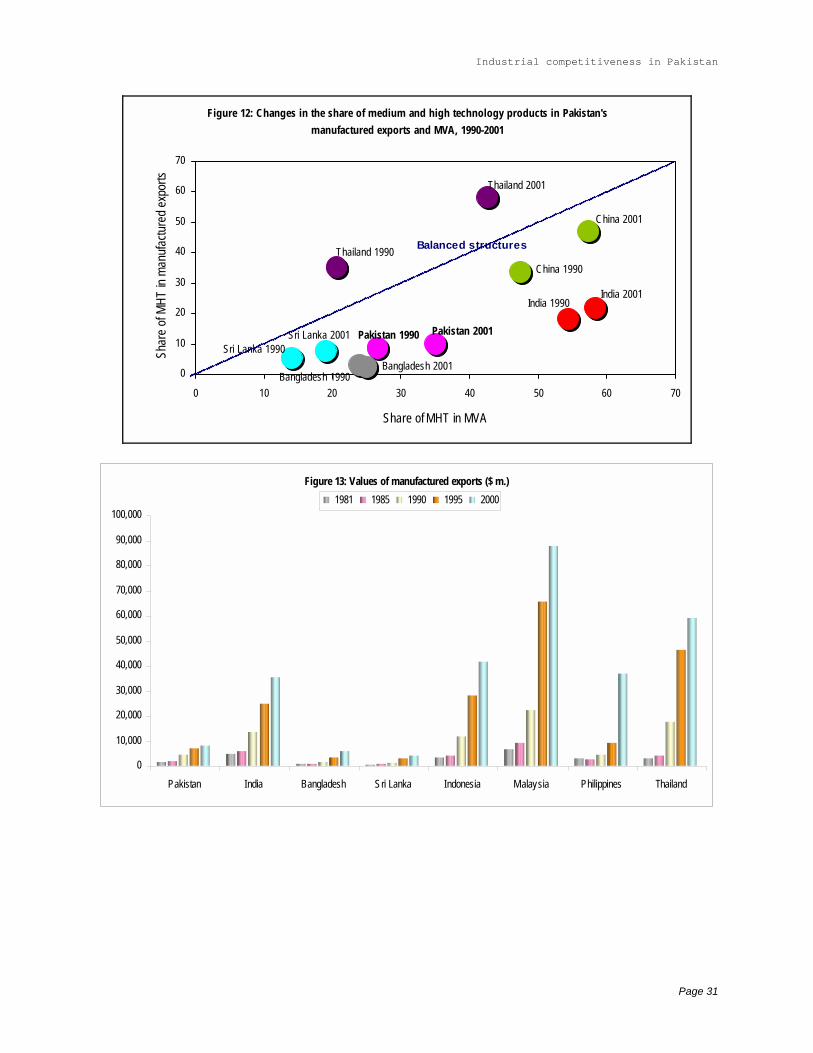
Industrial competitiveness in Pakistan
Figure 12: Changes in the share of medium and high technology products in Pakistan's manufactured exports and MVA, 1990-2001
0
10
20
30
40
50
60
70
0 10 20 30 40 50 60 7
Share of MHT in MVA
Shar
e of M
HT in
man
ufactu
red e
xpor
t
0
s
Pakistan 1990
Bangladesh 2001
Sri Lanka 2001
India 1990India 2001
Thailand 2001
China 1990
Bangladesh 1990
China 2001
Pakistan 2001
Thailand 1990
Sri Lanka 1990
Balanced structures
Figure 13: Values of manufactured exports ($ m.)
0
10,000
20,000
30,000
40,000
50,000
60,000
70,000
80,000
90,000
100,000
Pakistan India Bangladesh Sri Lanka Indonesia Malaysia Philippines Thailand
1981 1985 1990 1995 2000
Page 31
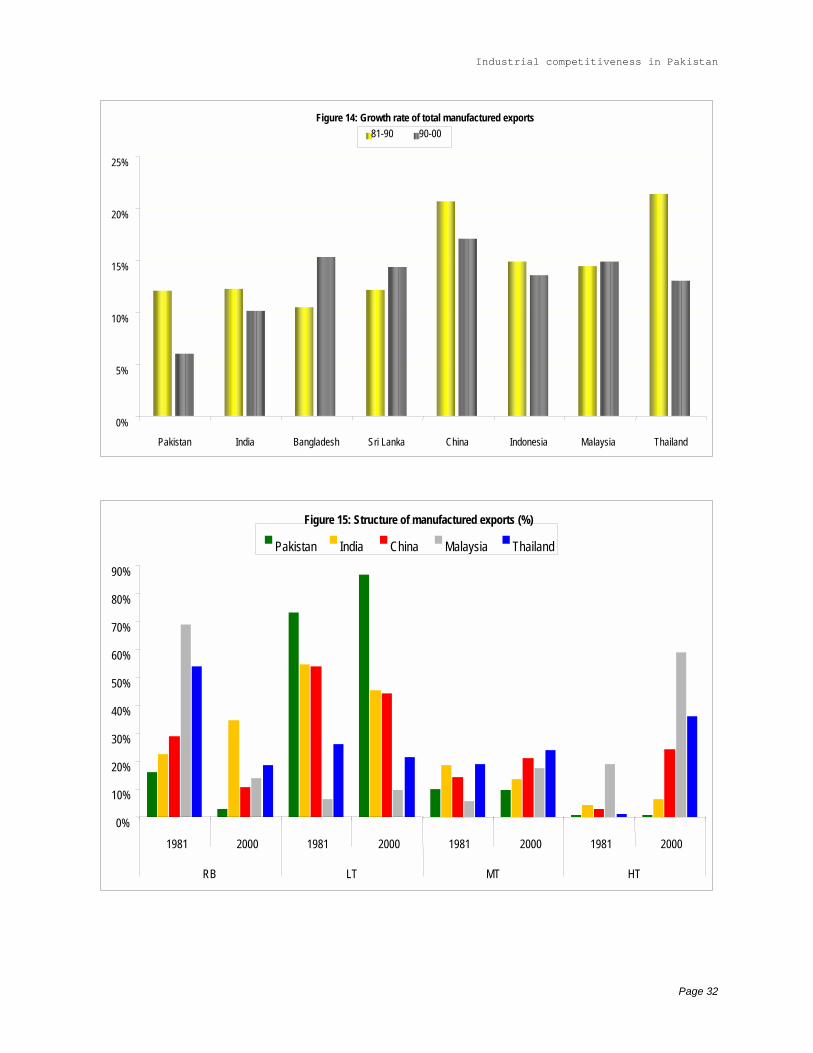
Industrial competitiveness in Pakistan
Figure 14: Growth rate of total manufactured exports81-90 90-00
25%
20%
15%
10%
5%
0%
Pakistan India Bangladesh Sri Lanka China Indonesia Malaysia Thailand
Figure 15: Structure of manufactured exports (%)
0%
10%
20%
30%
40%
50%
60%
70%
80%
90%
1981 2000 1981 2000 1981 2000 1981 2000
RB LT MT HT
Pakistan India China Malaysia Thailand
Page 32
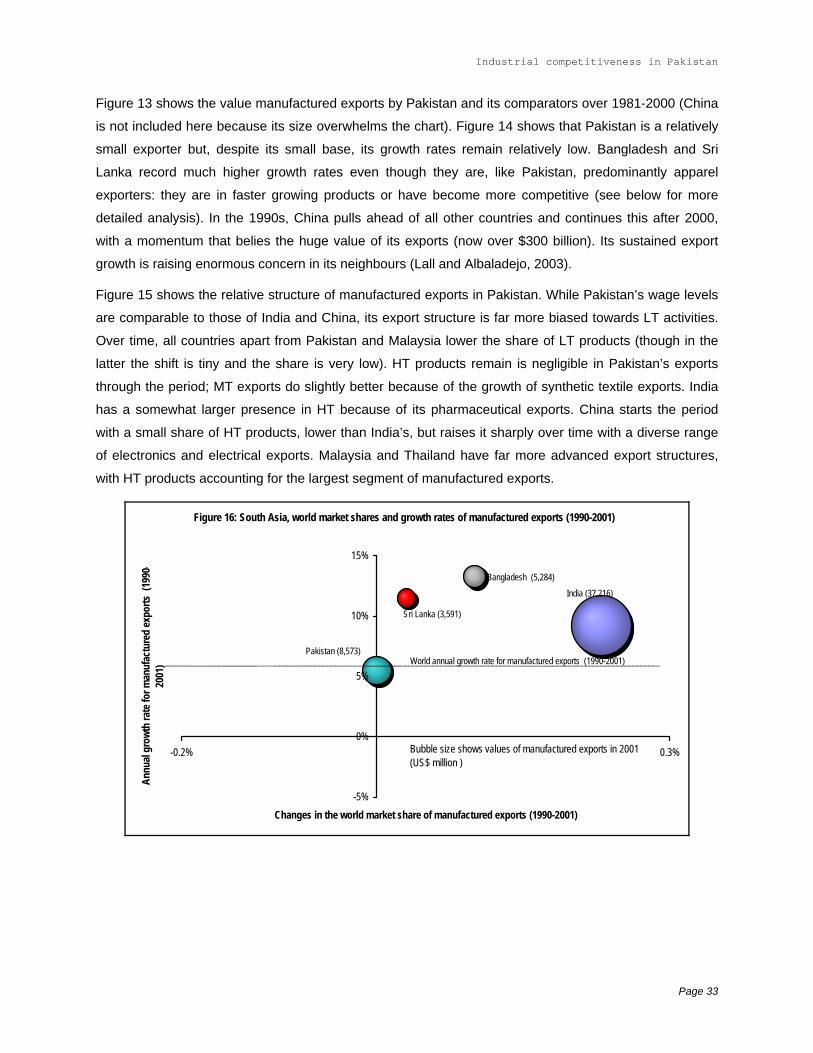
Industrial competitiveness in Pakistan
Figure 13 shows the value manufactured exports by Pakistan and its comparators over 1981-2000 (China
is not included here because its size overwhelms the chart). Figure 14 shows that Pakistan is a relatively
small exporter but, despite its small base, its growth rates remain relatively low. Bangladesh and Sri
Lanka record much higher growth rates even though they are, like Pakistan, predominantly apparel
exporters: they are in faster growing products or have become more competitive (see below for more
detailed analysis). In the 1990s, China pulls ahead of all other countries and continues this after 2000,
with a momentum that belies the huge value of its exports (now over $300 billion). Its sustained export
growth is raising enormous concern in its neighbours (Lall and Albaladejo, 2003).
Figure 15 shows the relative structure of manufactured exports in Pakistan. While Pakistan’s wage levels
are comparable to those of India and China, its export structure is far more biased towards LT activities.
Over time, all countries apart from Pakistan and Malaysia lower the share of LT products (though in the
latter the shift is tiny and the share is very low). HT products remain is negligible in Pakistan’s exports
through the period; MT exports do slightly better because of the growth of synthetic textile exports. India
has a somewhat larger presence in HT because of its pharmaceutical exports. China starts the period
with a small share of HT products, lower than India’s, but raises it sharply over time with a diverse range
of electronics and electrical exports. Malaysia and Thailand have far more advanced export structures,
with HT products accounting for the largest segment of manufactured exports.
Figure 16: South Asia, world market shares and growth rates of manufactured exports (1990-2001)
-5%
0%
5%
10%
15%
-0.2% 0.3%
Changes in the world market share of manufactured exports (1990-2001)
Annu
al gr
owth
rate
for m
anuf
actu
red
expo
rts (
1990
-20
01)
Bubble size shows values of manufactured exports in 2001 (US$ million )
India (37,216)
Sri Lanka (3,591)
Bangladesh (5,284)
World annual growth rate for manufactured exports (1990-2001)Pakistan (8,573)
Page 33
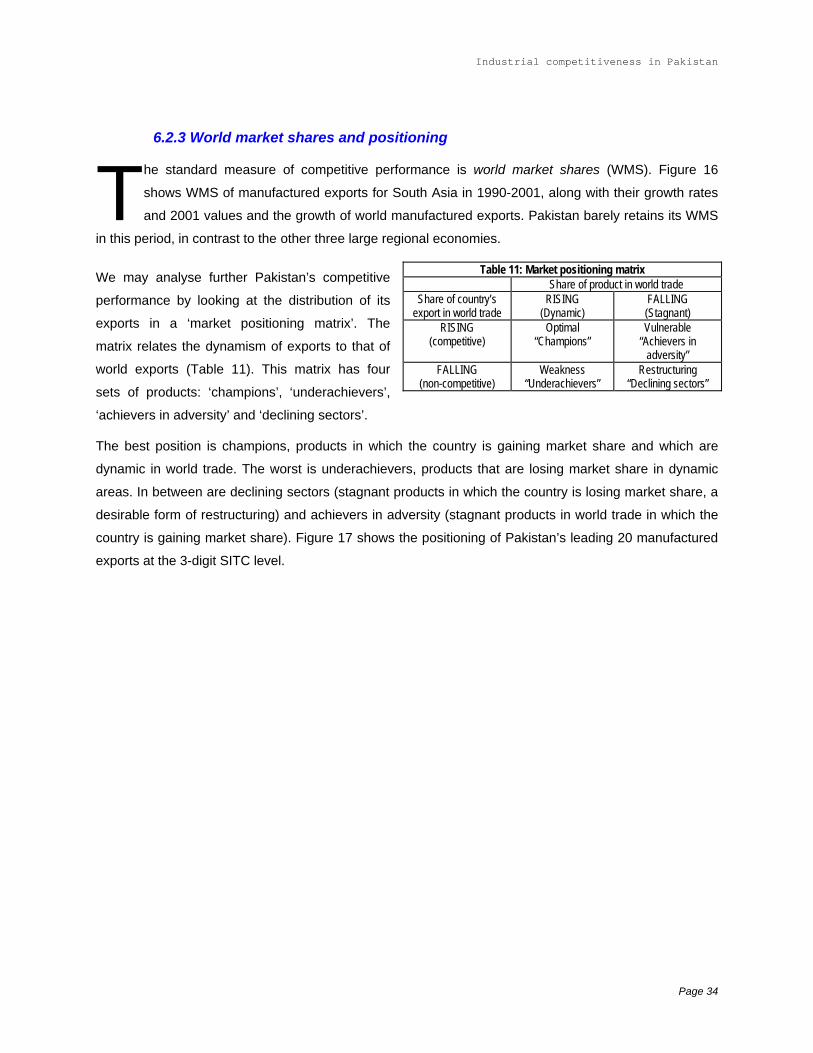
Industrial competitiveness in Pakistan
6.2.3 World market shares and positioning
The standard measure of competitive performance is world market shares (WMS). Figure 16
shows WMS of manufactured exports for South Asia in 1990-2001, along with their growth rates
and 2001 values and the growth of world manufactured exports. Pakistan barely retains its WMS
in this period, in contrast to the other three large regional economies.
Table 11: Market positioning matrix Share of product in world trade
Share of country’s export in world trade
RISING (Dynamic)
FALLING (Stagnant)
RISING (competitive)
Optimal “Champions”
Vulnerable “Achievers in
adversity” FALLING
(non-competitive) Weakness
“Underachievers” Restructuring
“Declining sectors”
We may analyse further Pakistan’s competitive
performance by looking at the distribution of its
exports in a ‘market positioning matrix’. The
matrix relates the dynamism of exports to that of
world exports (Table 11). This matrix has four
sets of products: ‘champions’, ‘underachievers’,
‘achievers in adversity’ and ‘declining sectors’.
The best position is champions, products in which the country is gaining market share and which are
dynamic in world trade. The worst is underachievers, products that are losing market share in dynamic
areas. In between are declining sectors (stagnant products in which the country is losing market share, a
desirable form of restructuring) and achievers in adversity (stagnant products in world trade in which the
country is gaining market share). Figure 17 shows the positioning of Pakistan’s leading 20 manufactured
exports at the 3-digit SITC level.
Page 34
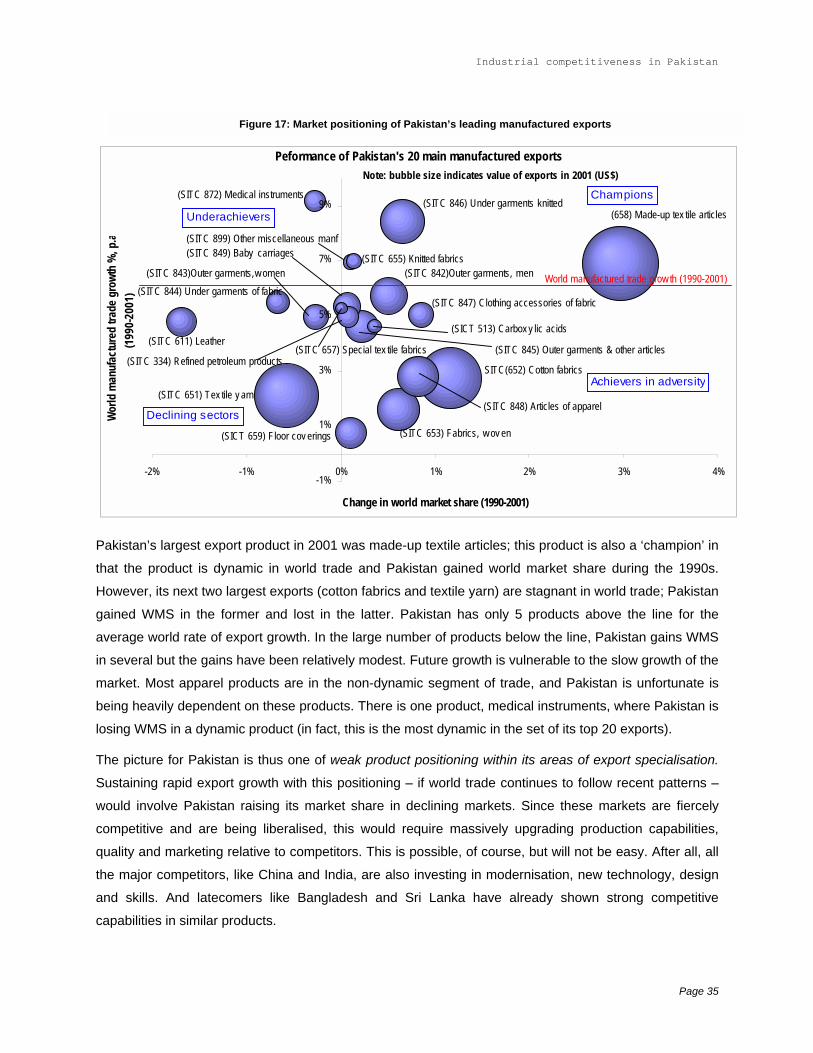
Industrial competitiveness in Pakistan
Peformance of Pakistan's 20 main manufactured exports
-1%
1%
3%
5%
7%
9%
-2% -1% 0% 1% 2% 3% 4%
Change in world market share (1990-2001)
Wor
ld m
anuf
actu
red
trade
gro
wth
%, p
.a
(199
0-20
01)
Underachievers
Champions
Achievers in adversity
Declining sectors
Note: bubble size indicates value of exports in 2001 (US$)
SITC(652) Cotton fabrics
(SITC 651) Tex tile y arn
(658) Made-up tex tile articles
(SITC 657) Special tex tile fabrics
(SICT 659) Floor cov erings
(SITC 872) Medical instruments
(SITC 611) Leather(SICT 513) Carbox y lic acids
(SITC 899) Other miscellaneous manf
(SITC 845) Outer garments & other articles
(SITC 844) Under garments of fabric
(SITC 848) Articles of apparel
(SITC 849) Baby carriages
(SITC 842)Outer garments, men
(SITC 334) Refined petroleum products
(SITC 847) Clothing accessories of fabric
(SITC 655) Knitted fabrics
(SITC 653) Fabrics, w ov en
(SITC 843)Outer garments,w omen
(SITC 846) Under garments knitted
Figure 17: Market positioning of Pakistan’s leading manufactured exports
World manufactured trade grow th (1990-2001)
Pakistan’s largest export product in 2001 was made-up textile articles; this product is also a ‘champion’ in
that the product is dynamic in world trade and Pakistan gained world market share during the 1990s.
However, its next two largest exports (cotton fabrics and textile yarn) are stagnant in world trade; Pakistan
gained WMS in the former and lost in the latter. Pakistan has only 5 products above the line for the
average world rate of export growth. In the large number of products below the line, Pakistan gains WMS
in several but the gains have been relatively modest. Future growth is vulnerable to the slow growth of the
market. Most apparel products are in the non-dynamic segment of trade, and Pakistan is unfortunate is
being heavily dependent on these products. There is one product, medical instruments, where Pakistan is
losing WMS in a dynamic product (in fact, this is the most dynamic in the set of its top 20 exports).
The picture for Pakistan is thus one of weak product positioning within its areas of export specialisation.
Sustaining rapid export growth with this positioning – if world trade continues to follow recent patterns –
would involve Pakistan raising its market share in declining markets. Since these markets are fiercely
competitive and are being liberalised, this would require massively upgrading production capabilities,
quality and marketing relative to competitors. This is possible, of course, but will not be easy. After all, all
the major competitors, like China and India, are also investing in modernisation, new technology, design
and skills. And latecomers like Bangladesh and Sri Lanka have already shown strong competitive
capabilities in similar products.
Page 35
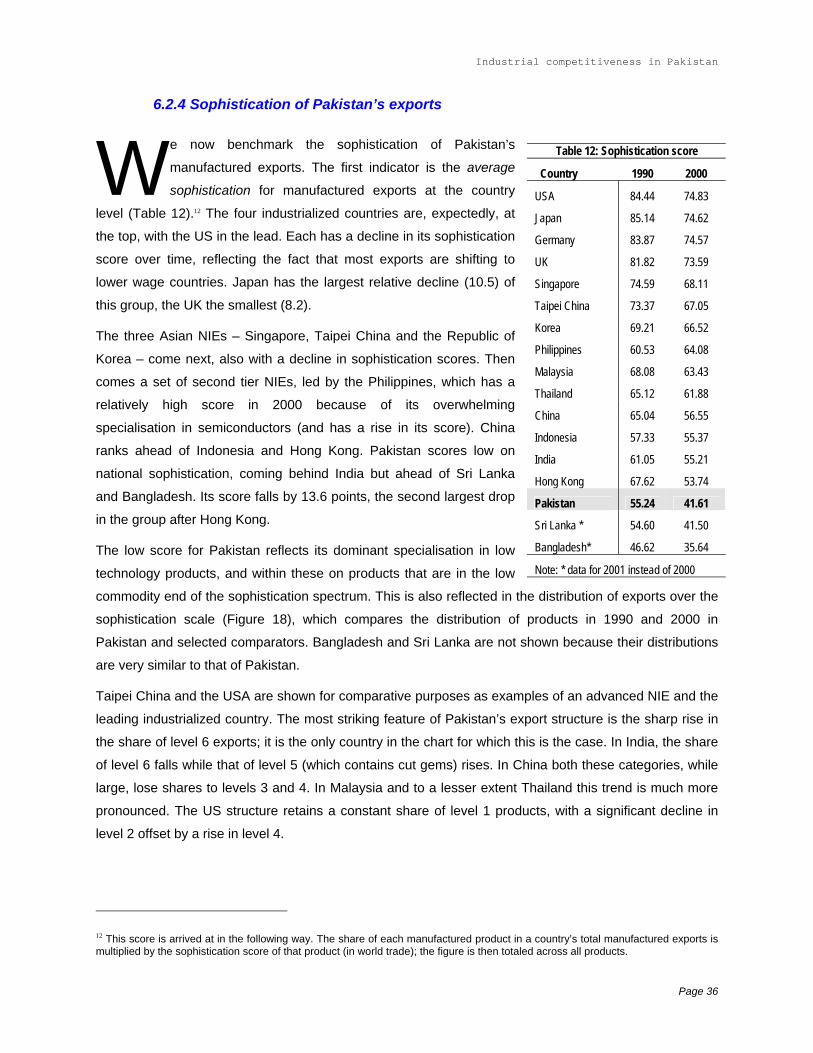
Industrial competitiveness in Pakistan
6.2.4 Sophistication of Pakistan’s exports
W e now benchmark the sophistication of Pakistan’s
manufactured exports. The first indicator is the average
sophistication for manufactured exports at the country
level (Table 12).12 The four industrialized countries are, expectedly, at
the top, with the US in the lead. Each has a decline in its sophistication
score over time, reflecting the fact that most exports are shifting to
lower wage countries. Japan has the largest relative decline (10.5) of
this group, the UK the smallest (8.2).
The three Asian NIEs – Singapore, Taipei China and the Republic of
Korea – come next, also with a decline in sophistication scores. Then
comes a set of second tier NIEs, led by the Philippines, which has a
relatively high score in 2000 because of its overwhelming
specialisation in semiconductors (and has a rise in its score). China
ranks ahead of Indonesia and Hong Kong. Pakistan scores low on
national sophistication, coming behind India but ahead of Sri Lanka
and Bangladesh. Its score falls by 13.6 points, the second largest drop
in the group after Hong Kong.
The low score for Pakistan reflects its dominant specialisation in low
technology products, and within these on products that are in the low
commodity end of the sophistication spectrum. This is also reflected in the distribution of exports over the
sophistication scale (Figure 18), which compares the distribution of products in 1990 and 2000 in
Pakistan and selected comparators. Bangladesh and Sri Lanka are not shown because their distributions
are very similar to that of Pakistan.
Table 12: Sophistication score
Country 1990 2000
USA 84.44 74.83
Japan 85.14 74.62
Germany 83.87 74.57
UK 81.82 73.59
Singapore 74.59 68.11
Taipei China 73.37 67.05
Korea 69.21 66.52
Philippines 60.53 64.08
Malaysia 68.08 63.43
Thailand 65.12 61.88
China 65.04 56.55
Indonesia 57.33 55.37
India 61.05 55.21
Hong Kong 67.62 53.74
Pakistan 55.24 41.61
Sri Lanka * 54.60 41.50
Bangladesh* 46.62 35.64
Note: * data for 2001 instead of 2000
Taipei China and the USA are shown for comparative purposes as examples of an advanced NIE and the
leading industrialized country. The most striking feature of Pakistan’s export structure is the sharp rise in
the share of level 6 exports; it is the only country in the chart for which this is the case. In India, the share
of level 6 falls while that of level 5 (which contains cut gems) rises. In China both these categories, while
large, lose shares to levels 3 and 4. In Malaysia and to a lesser extent Thailand this trend is much more
pronounced. The US structure retains a constant share of level 1 products, with a significant decline in
level 2 offset by a rise in level 4.
12 This score is arrived at in the following way. The share of each manufactured product in a country’s total manufactured exports is multiplied by the sophistication score of that product (in world trade); the figure is then totaled across all products.
Page 36
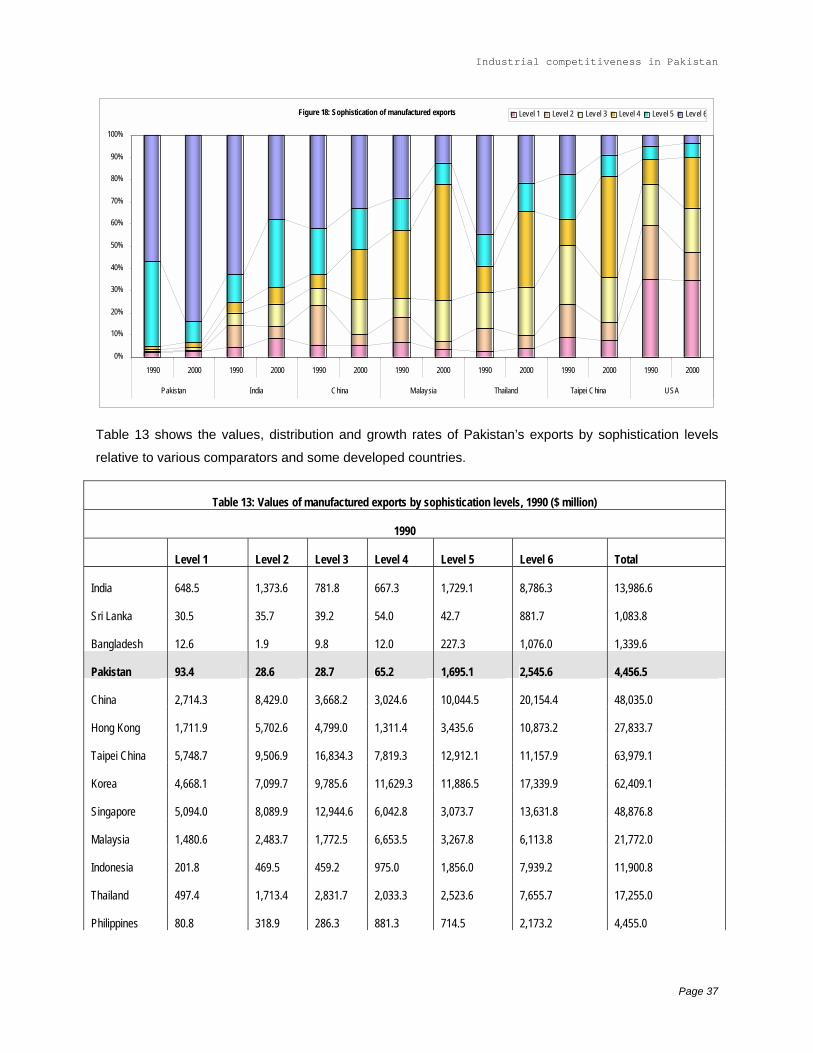
Industrial competitiveness in Pakistan
Figure 18: Sophistication of manufactured exports
0%
10%
20%
30%
40%
50%
60%
70%
80%
90%
100%
1990 2000 1990 2000 1990 2000 1990 2000 1990 2000 1990 2000 1990 2000
Pakistan India China Malaysia Thailand Taipei China USA
Level 1 Level 2 Level 3 Level 4 Level 5 Level 6
Table 13 shows the values, distribution and growth rates of Pakistan’s exports by sophistication levels
relative to various comparators and some developed countries.
Table 13: Values of manufactured exports by sophistication levels, 1990 ($ million)
1990
Level 1 Level 2 Level 3 Level 4 Level 5 Level 6 Total
India 648.5 1,373.6 781.8 667.3 1,729.1 8,786.3 13,986.6
Sri Lanka 30.5 35.7 39.2 54.0 42.7 881.7 1,083.8
Bangladesh 12.6 1.9 9.8 12.0 227.3 1,076.0 1,339.6
Pakistan 93.4 28.6 28.7 65.2 1,695.1 2,545.6 4,456.5
China 2,714.3 8,429.0 3,668.2 3,024.6 10,044.5 20,154.4 48,035.0
Hong Kong 1,711.9 5,702.6 4,799.0 1,311.4 3,435.6 10,873.2 27,833.7
Taipei China 5,748.7 9,506.9 16,834.3 7,819.3 12,912.1 11,157.9 63,979.1
Korea 4,668.1 7,099.7 9,785.6 11,629.3 11,886.5 17,339.9 62,409.1
Singapore 5,094.0 8,089.9 12,944.6 6,042.8 3,073.7 13,631.8 48,876.8
Malaysia 1,480.6 2,483.7 1,772.5 6,653.5 3,267.8 6,113.8 21,772.0
Indonesia 201.8 469.5 459.2 975.0 1,856.0 7,939.2 11,900.8
Thailand 497.4 1,713.4 2,831.7 2,033.3 2,523.6 7,655.7 17,255.0
Philippines 80.8 318.9 286.3 881.3 714.5 2,173.2 4,455.0
Page 37
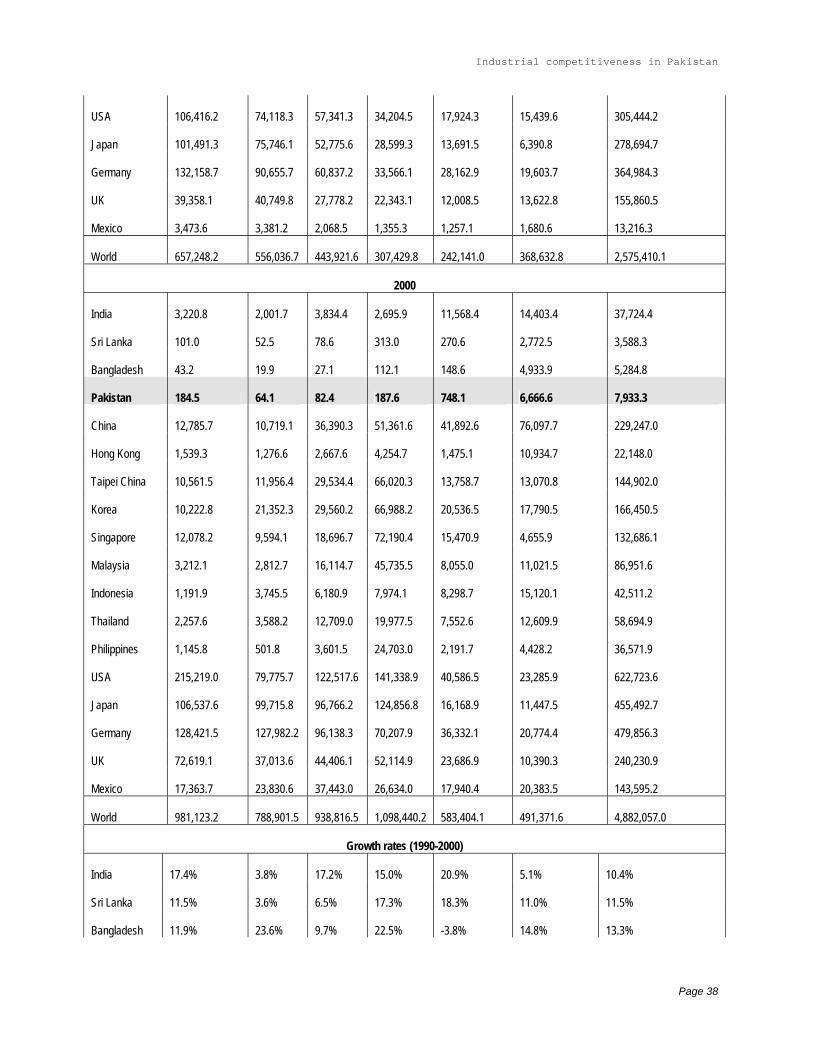
Industrial competitiveness in Pakistan
USA 106,416.2 74,118.3 57,341.3 34,204.5 17,924.3 15,439.6 305,444.2
Japan 101,491.3 75,746.1 52,775.6 28,599.3 13,691.5 6,390.8 278,694.7
Germany 132,158.7 90,655.7 60,837.2 33,566.1 28,162.9 19,603.7 364,984.3
UK 39,358.1 40,749.8 27,778.2 22,343.1 12,008.5 13,622.8 155,860.5
Mexico 3,473.6 3,381.2 2,068.5 1,355.3 1,257.1 1,680.6 13,216.3
World 657,248.2 556,036.7 443,921.6 307,429.8 242,141.0 368,632.8 2,575,410.1
2000
India 3,220.8 2,001.7 3,834.4 2,695.9 11,568.4 14,403.4 37,724.4
Sri Lanka 101.0 52.5 78.6 313.0 270.6 2,772.5 3,588.3
Bangladesh 43.2 19.9 27.1 112.1 148.6 4,933.9 5,284.8
Pakistan 184.5 64.1 82.4 187.6 748.1 6,666.6 7,933.3
China 12,785.7 10,719.1 36,390.3 51,361.6 41,892.6 76,097.7 229,247.0
Hong Kong 1,539.3 1,276.6 2,667.6 4,254.7 1,475.1 10,934.7 22,148.0
Taipei China 10,561.5 11,956.4 29,534.4 66,020.3 13,758.7 13,070.8 144,902.0
Korea 10,222.8 21,352.3 29,560.2 66,988.2 20,536.5 17,790.5 166,450.5
Singapore 12,078.2 9,594.1 18,696.7 72,190.4 15,470.9 4,655.9 132,686.1
Malaysia 3,212.1 2,812.7 16,114.7 45,735.5 8,055.0 11,021.5 86,951.6
Indonesia 1,191.9 3,745.5 6,180.9 7,974.1 8,298.7 15,120.1 42,511.2
Thailand 2,257.6 3,588.2 12,709.0 19,977.5 7,552.6 12,609.9 58,694.9
Philippines 1,145.8 501.8 3,601.5 24,703.0 2,191.7 4,428.2 36,571.9
USA 215,219.0 79,775.7 122,517.6 141,338.9 40,586.5 23,285.9 622,723.6
Japan 106,537.6 99,715.8 96,766.2 124,856.8 16,168.9 11,447.5 455,492.7
Germany 128,421.5 127,982.2 96,138.3 70,207.9 36,332.1 20,774.4 479,856.3
UK 72,619.1 37,013.6 44,406.1 52,114.9 23,686.9 10,390.3 240,230.9
Mexico 17,363.7 23,830.6 37,443.0 26,634.0 17,940.4 20,383.5 143,595.2
World 981,123.2 788,901.5 938,816.5 1,098,440.2 583,404.1 491,371.6 4,882,057.0
Growth rates (1990-2000)
India 17.4% 3.8% 17.2% 15.0% 20.9% 5.1% 10.4%
Sri Lanka 11.5% 3.6% 6.5% 17.3% 18.3% 11.0% 11.5%
Bangladesh 11.9% 23.6% 9.7% 22.5% -3.8% 14.8% 13.3%
Page 38
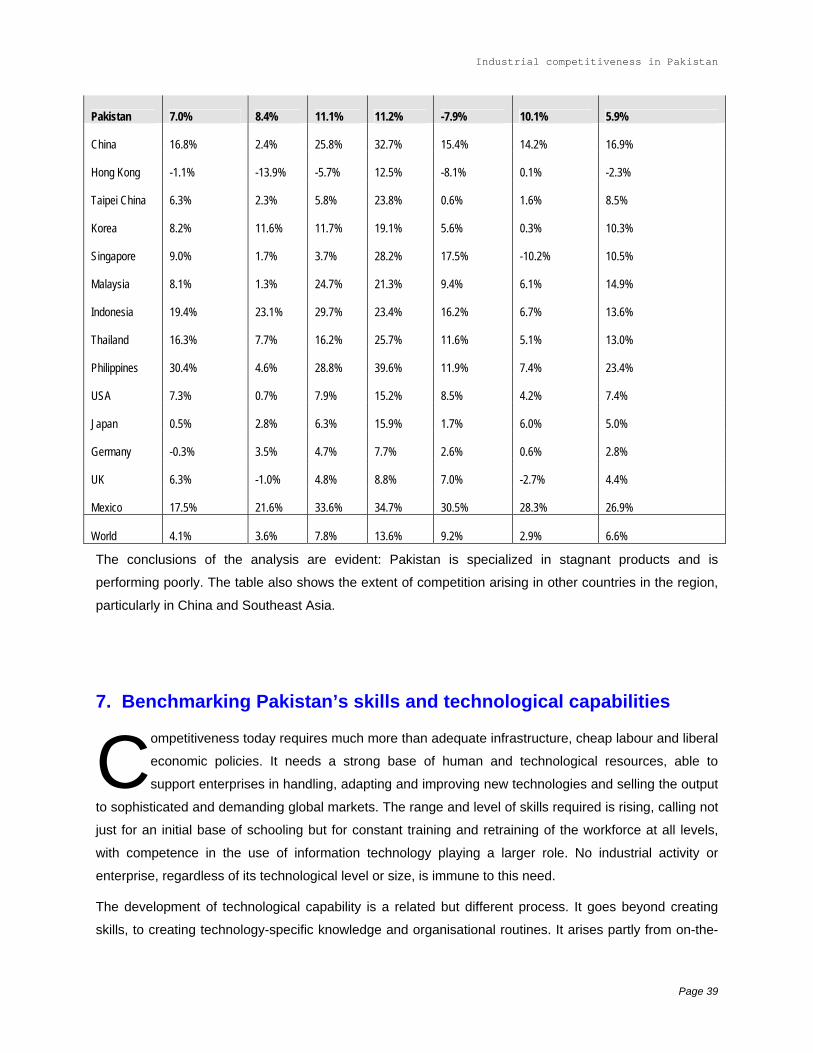
Industrial competitiveness in Pakistan
Pakistan 7.0% 8.4% 11.1% 11.2% -7.9% 10.1% 5.9%
China 16.8% 2.4% 25.8% 32.7% 15.4% 14.2% 16.9%
Hong Kong -1.1% -13.9% -5.7% 12.5% -8.1% 0.1% -2.3%
Taipei China 6.3% 2.3% 5.8% 23.8% 0.6% 1.6% 8.5%
Korea 8.2% 11.6% 11.7% 19.1% 5.6% 0.3% 10.3%
Singapore 9.0% 1.7% 3.7% 28.2% 17.5% -10.2% 10.5%
Malaysia 8.1% 1.3% 24.7% 21.3% 9.4% 6.1% 14.9%
Indonesia 19.4% 23.1% 29.7% 23.4% 16.2% 6.7% 13.6%
Thailand 16.3% 7.7% 16.2% 25.7% 11.6% 5.1% 13.0%
Philippines 30.4% 4.6% 28.8% 39.6% 11.9% 7.4% 23.4%
USA 7.3% 0.7% 7.9% 15.2% 8.5% 4.2% 7.4%
Japan 0.5% 2.8% 6.3% 15.9% 1.7% 6.0% 5.0%
Germany -0.3% 3.5% 4.7% 7.7% 2.6% 0.6% 2.8%
UK 6.3% -1.0% 4.8% 8.8% 7.0% -2.7% 4.4%
Mexico 17.5% 21.6% 33.6% 34.7% 30.5% 28.3% 26.9%
World 4.1% 3.6% 7.8% 13.6% 9.2% 2.9% 6.6%
The conclusions of the analysis are evident: Pakistan is specialized in stagnant products and is
performing poorly. The table also shows the extent of competition arising in other countries in the region,
particularly in China and Southeast Asia.
7. Benchmarking Pakistan’s skills and technological capabilities
Competitiveness today requires much more than adequate infrastructure, cheap labour and liberal
economic policies. It needs a strong base of human and technological resources, able to
support enterprises in handling, adapting and improving new technologies and selling the output
to sophisticated and demanding global markets. The range and level of skills required is rising, calling not
just for an initial base of schooling but for constant training and retraining of the workforce at all levels,
with competence in the use of information technology playing a larger role. No industrial activity or
enterprise, regardless of its technological level or size, is immune to this need.
The development of technological capability is a related but different process. It goes beyond creating
skills, to creating technology-specific knowledge and organisational routines. It arises partly from on-the-
Page 39
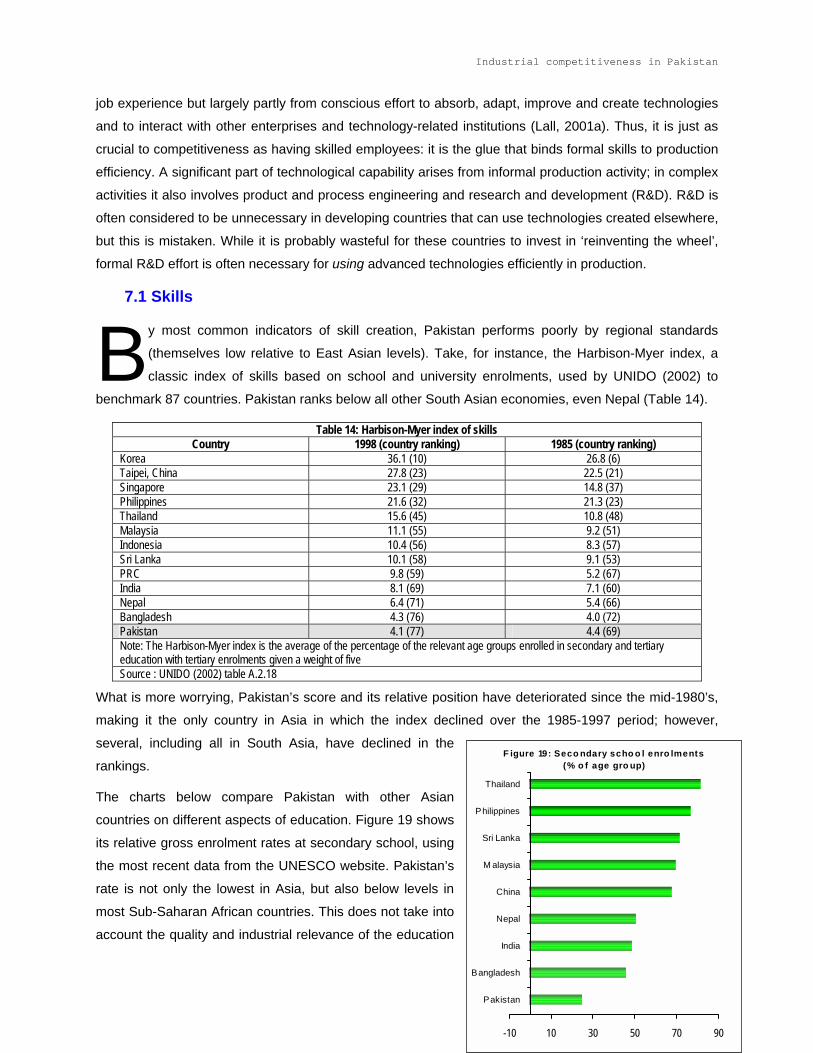
Industrial competitiveness in Pakistan
job experience but largely partly from conscious effort to absorb, adapt, improve and create technologies
and to interact with other enterprises and technology-related institutions (Lall, 2001a). Thus, it is just as
crucial to competitiveness as having skilled employees: it is the glue that binds formal skills to production
efficiency. A significant part of technological capability arises from informal production activity; in complex
activities it also involves product and process engineering and research and development (R&D). R&D is
often considered to be unnecessary in developing countries that can use technologies created elsewhere,
but this is mistaken. While it is probably wasteful for these countries to invest in ‘reinventing the wheel’,
formal R&D effort is often necessary for using advanced technologies efficiently in production.
7.1 Skills
By most common indicators of skill creation, Pakistan performs poorly by regional standards
(themselves low relative to East Asian levels). Take, for instance, the Harbison-Myer index, a
classic index of skills based on school and university enrolments, used by UNIDO (2002) to
benchmark 87 countries. Pakistan ranks below all other South Asian economies, even Nepal (Table 14).
Table 14: Harbison-Myer index of skills Country 1998 (country ranking) 1985 (country ranking)
Korea 36.1 (10) 26.8 (6) Taipei, China 27.8 (23) 22.5 (21) Singapore 23.1 (29) 14.8 (37) Philippines 21.6 (32) 21.3 (23) Thailand 15.6 (45) 10.8 (48) Malaysia 11.1 (55) 9.2 (51) Indonesia 10.4 (56) 8.3 (57) Sri Lanka 10.1 (58) 9.1 (53) PRC 9.8 (59) 5.2 (67) India 8.1 (69) 7.1 (60) Nepal 6.4 (71) 5.4 (66) Bangladesh 4.3 (76) 4.0 (72) Pakistan 4.1 (77) 4.4 (69) Note: The Harbison-Myer index is the average of the percentage of the relevant age groups enrolled in secondary and tertiary education with tertiary enrolments given a weight of five Source : UNIDO (2002) table A.2.18
Page 40
F igure 19: Seco ndary scho o l enro lments (% o f age gro up)
-10 10 30 50 70 90
Pakistan
Bangladesh
India
Nepal
China
M alaysia
Sri Lanka
Philippines
Thailand
What is more worrying, Pakistan’s score and its relative position have deteriorated since the mid-1980’s,
making it the only country in Asia in which the index declined over the 1985-1997 period; however,
several, including all in South Asia, have declined in the
rankings.
The charts below compare Pakistan with other Asian
countries on different aspects of education. Figure 19 shows
its relative gross enrolment rates at secondary school, using
the most recent data from the UNESCO website. Pakistan’s
rate is not only the lowest in Asia, but also below levels in
most Sub-Saharan African countries. This does not take into
account the quality and industrial relevance of the education
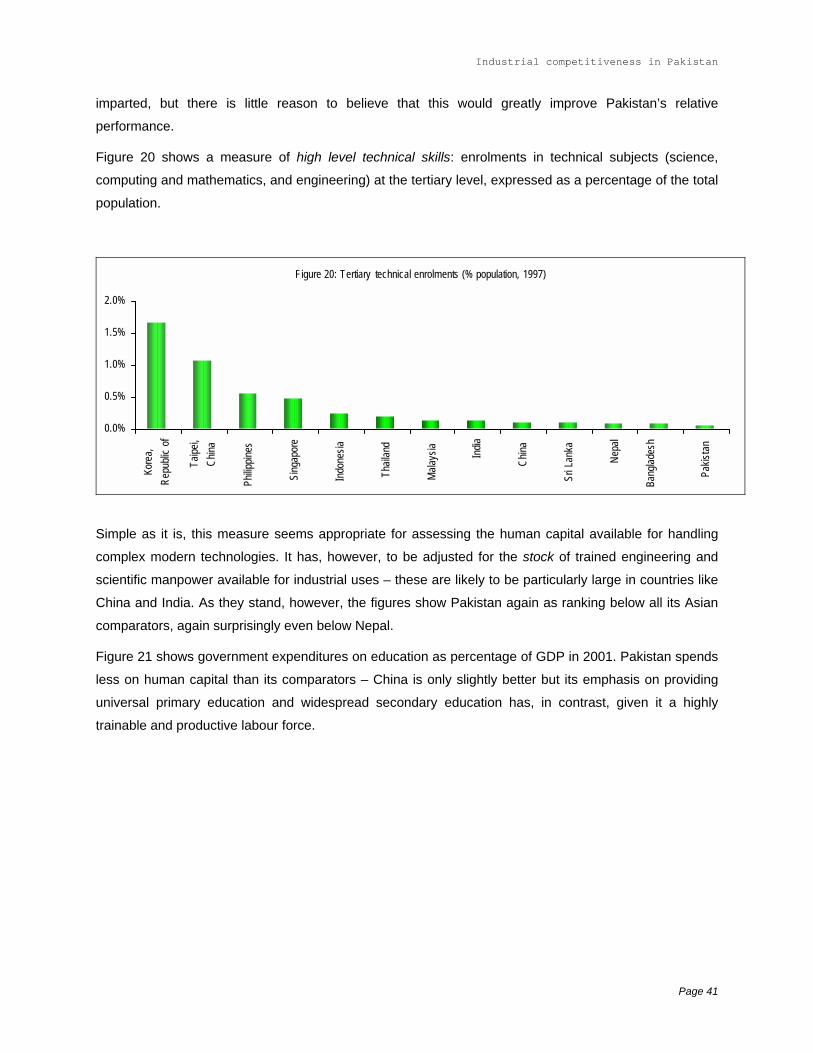
Industrial competitiveness in Pakistan
imparted, but there is little reason to believe that this would greatly improve Pakistan’s relative
performance.
Figure 20 shows a measure of high level technical skills: enrolments in technical subjects (science,
computing and mathematics, and engineering) at the tertiary level, expressed as a percentage of the total
population.
Figure 20: Tertiary technical enrolments (% population, 1997)
0.0%
0.5%
1.0%
1.5%
2.0%
Kore
a,Re
publi
c of
Taipe
i,Ch
ina
Philip
pines
Sing
apor
e
Indo
nesia
Thail
and
Mala
ysia
India
China
Sri L
anka
Nepa
l
Bang
lades
h
Pakis
tan
Simple as it is, this measure seems appropriate for assessing the human capital available for handling
complex modern technologies. It has, however, to be adjusted for the stock of trained engineering and
scientific manpower available for industrial uses – these are likely to be particularly large in countries like
China and India. As they stand, however, the figures show Pakistan again as ranking below all its Asian
comparators, again surprisingly even below Nepal.
Figure 21 shows government expenditures on education as percentage of GDP in 2001. Pakistan spends
less on human capital than its comparators – China is only slightly better but its emphasis on providing
universal primary education and widespread secondary education has, in contrast, given it a highly
trainable and productive labour force.
Page 41
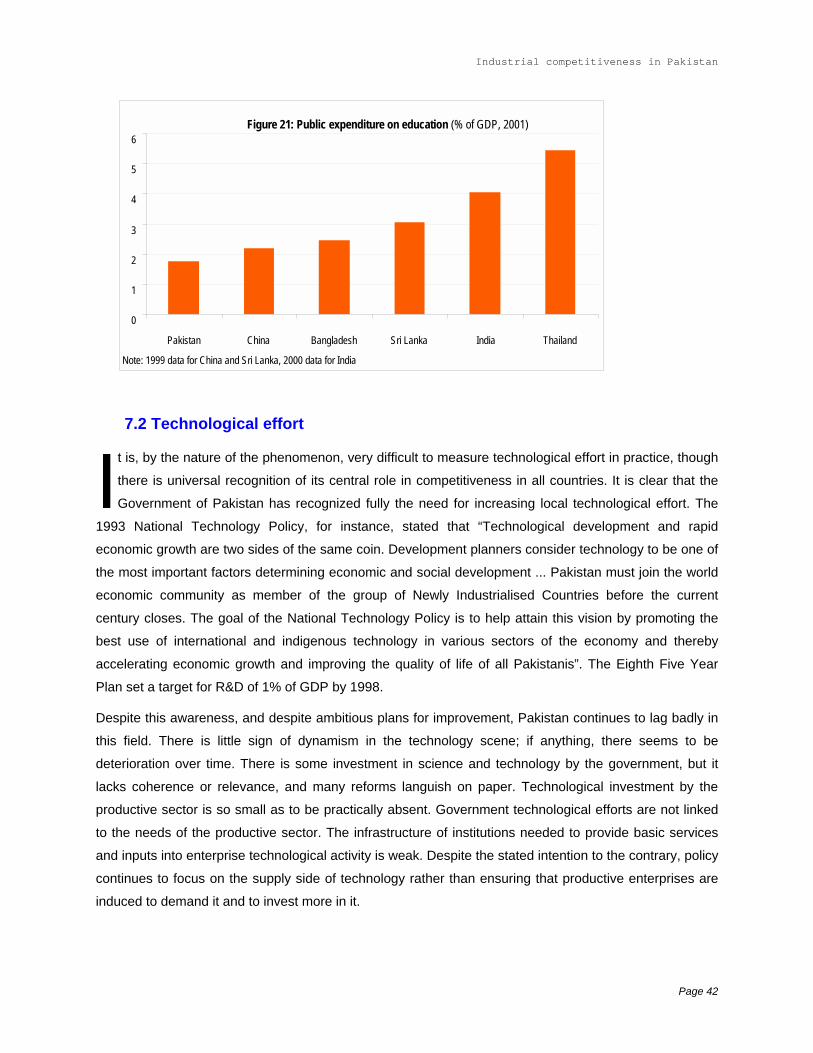
Industrial competitiveness in Pakistan
Figure 21: Public expenditure on education (% of GDP, 2001)6
5
4
3
2
1
0
Pakistan China Bangladesh Sri Lanka India Thailand
Note: 1999 data for China and Sri Lanka, 2000 data for India
7.2 Technological effort
I t is, by the nature of the phenomenon, very difficult to measure technological effort in practice, though
there is universal recognition of its central role in competitiveness in all countries. It is clear that the
Government of Pakistan has recognized fully the need for increasing local technological effort. The
1993 National Technology Policy, for instance, stated that “Technological development and rapid
economic growth are two sides of the same coin. Development planners consider technology to be one of
the most important factors determining economic and social development ... Pakistan must join the world
economic community as member of the group of Newly Industrialised Countries before the current
century closes. The goal of the National Technology Policy is to help attain this vision by promoting the
best use of international and indigenous technology in various sectors of the economy and thereby
accelerating economic growth and improving the quality of life of all Pakistanis”. The Eighth Five Year
Plan set a target for R&D of 1% of GDP by 1998.
Despite this awareness, and despite ambitious plans for improvement, Pakistan continues to lag badly in
this field. There is little sign of dynamism in the technology scene; if anything, there seems to be
deterioration over time. There is some investment in science and technology by the government, but it
lacks coherence or relevance, and many reforms languish on paper. Technological investment by the
productive sector is so small as to be practically absent. Government technological efforts are not linked
to the needs of the productive sector. The infrastructure of institutions needed to provide basic services
and inputs into enterprise technological activity is weak. Despite the stated intention to the contrary, policy
continues to focus on the supply side of technology rather than ensuring that productive enterprises are
induced to demand it and to invest more in it.
Page 42
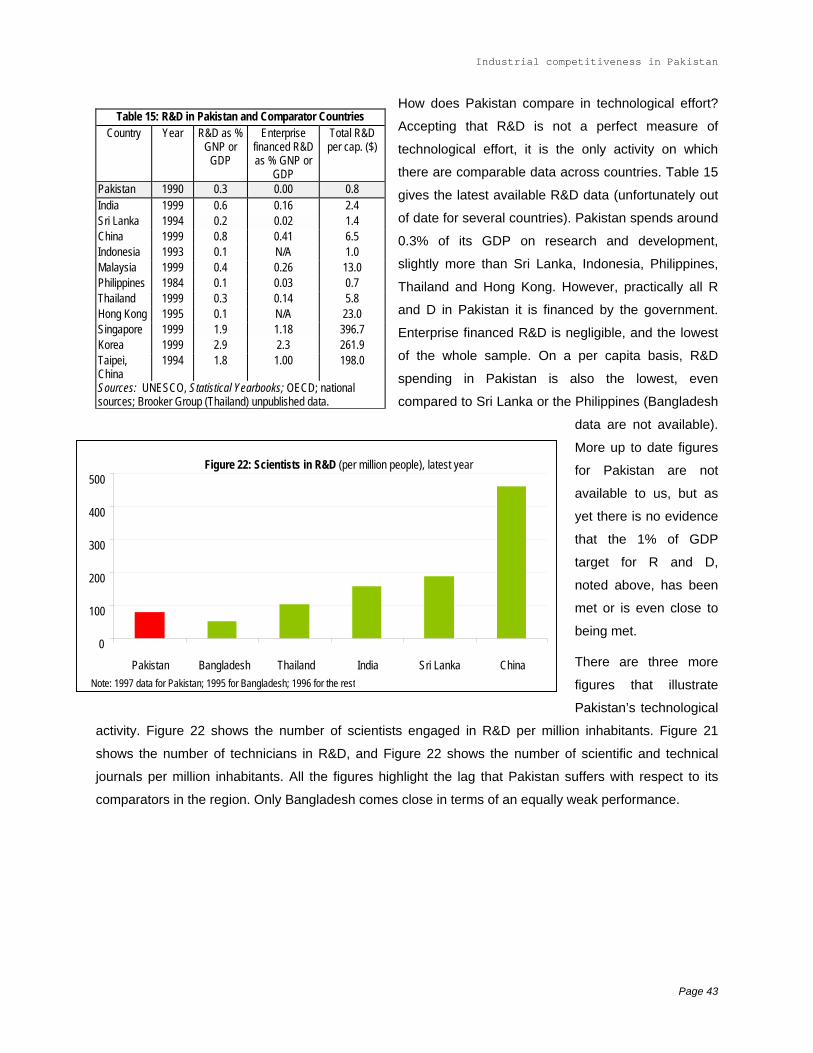
Industrial competitiveness in Pakistan
How does Pakistan compare in technological effort?
Accepting that R&D is not a perfect measure of
technological effort, it is the only activity on which
there are comparable data across countries. Table 15
gives the latest available R&D data (unfortunately out
of date for several countries). Pakistan spends around
0.3% of its GDP on research and development,
slightly more than Sri Lanka, Indonesia, Philippines,
Thailand and Hong Kong. However, practically all R
and D in Pakistan it is financed by the government.
Enterprise financed R&D is negligible, and the lowest
of the whole sample. On a per capita basis, R&D
spending in Pakistan is also the lowest, even
compared to Sri Lanka or the Philippines (Bangladesh
data are not available).
More up to date figures
for Pakistan are not
available to us, but as
yet there is no evidence
that the 1% of GDP
target for R and D,
noted above, has been
met or is even close to
being met.
Table 15: R&D in Pakistan and Comparator Countries Country Year R&D as %
GNP or GDP
Enterprise financed R&D as % GNP or
GDP
Total R&D per cap. ($)
Pakistan 1990 0.3 0.00 0.8 India 1999 0.6 0.16 2.4 Sri Lanka 1994 0.2 0.02 1.4 China 1999 0.8 0.41 6.5 Indonesia 1993 0.1 N/A 1.0 Malaysia 1999 0.4 0.26 13.0 Philippines 1984 0.1 0.03 0.7 Thailand 1999 0.3 0.14 5.8 Hong Kong 1995 0.1 N/A 23.0 Singapore 1999 1.9 1.18 396.7 Korea 1999 2.9 2.3 261.9 Taipei, China
1994 1.8 1.00 198.0
Sources: UNESCO, Statistical Yearbooks; OECD; national sources; Brooker Group (Thailand) unpublished data.
There are three more
figures that illustrate
Pakistan’s technological
activity. Figure 22 shows the number of scientists engaged in R&D per million inhabitants. Figure 21
shows the number of technicians in R&D, and Figure 22 shows the number of scientific and technical
journals per million inhabitants. All the figures highlight the lag that Pakistan suffers with respect to its
comparators in the region. Only Bangladesh comes close in terms of an equally weak performance.
Note: 1997 data for Pakistan; 1995 for Bangladesh; 1996 for the restChinaSri LankaIndiaThailandBangladesh Pakistan
500
400
300
200
100
0
Figure 22: Scientists in R&D (per million people), latest year
Page 43
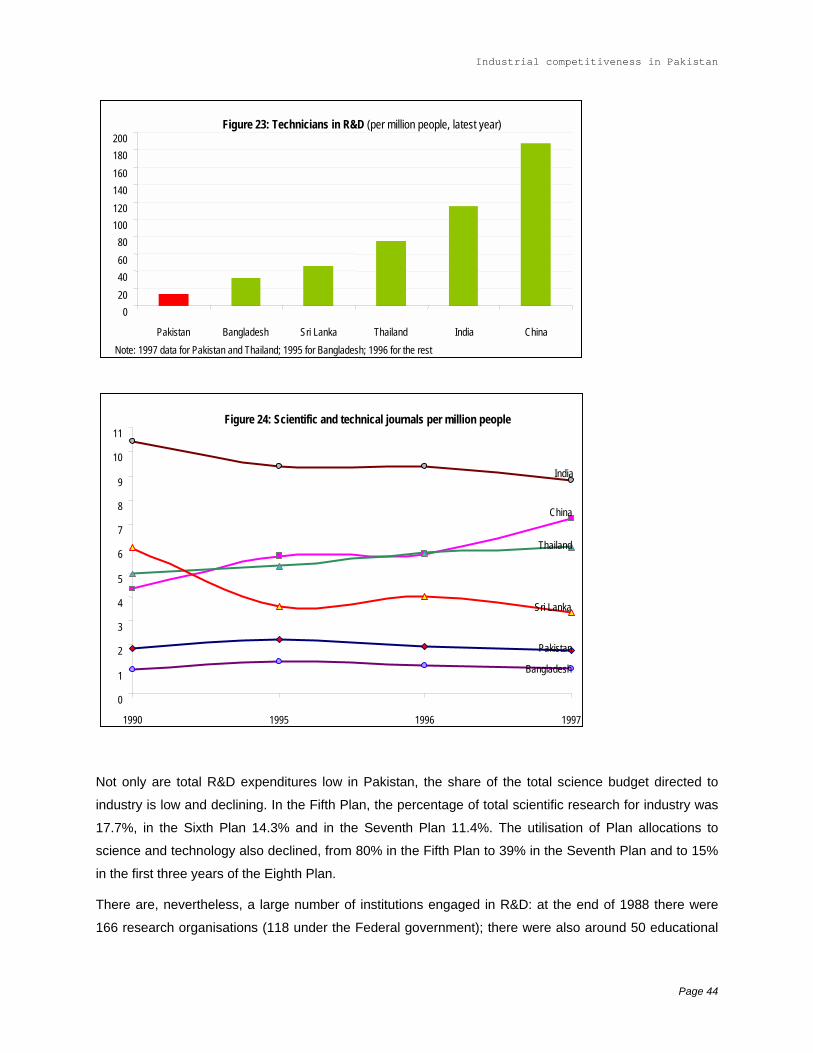
Industrial competitiveness in Pakistan
Figure 23: Technicians in R&D (per million people, latest year)200180160140120100
80604020
0
Pakistan Bangladesh Sri Lanka Thailand India ChinaNote: 1997 data for Pakistan and Thailand; 1995 for Bangladesh; 1996 for the rest
Figure 24: Scientific and technical journals per million people11
10India
9
8 China7
Thailand6
5
4 Sri Lanka
3
Pakistan2Bangladesh1
0
1990 1995 1996 1997
Not only are total R&D expenditures low in Pakistan, the share of the total science budget directed to
industry is low and declining. In the Fifth Plan, the percentage of total scientific research for industry was
17.7%, in the Sixth Plan 14.3% and in the Seventh Plan 11.4%. The utilisation of Plan allocations to
science and technology also declined, from 80% in the Fifth Plan to 39% in the Seventh Plan and to 15%
in the first three years of the Eighth Plan.
There are, nevertheless, a large number of institutions engaged in R&D: at the end of 1988 there were
166 research organisations (118 under the Federal government); there were also around 50 educational
Page 44

Industrial competitiveness in Pakistan
institutions that could conduct research. The technology infrastructure organisations like the Pakistan
Standards Institute and a number of technical extension and training services also conduct R&D. In
general, however, it appears that the structure is de-linked from the productive sector.13 Industrial firms, to
the extent that they are even aware of these institutions, have a low opinion of their capabilities and
services offered. Universities are even further removed from productive activity and the consciousness of
industry managers than the public sector laboratories. Among SMEs, which need institutional support
most, there is also very limited awareness of the technology institutions, and the institutions (with some
notable exceptions) fail to reach out to them to assess and address their technical needs.
One indirect indicator of technology effort relevant to export competitiveness is the number of ISO 9000
certificates awarded at the national level. While this relates to quality management rather than technical
effort, and covers all activities and not only manufacturing, it is roughly in line with export performance.
Table 16 shows the number of ISO 9000 certificates granted till end-2002 in Pakistan and comparators.
Pakistan has enjoyed a significant rise in the number of awards, particularly since 1999, but still lags
behind major competitors.
Table 16: ISO 9000 Certificates: 1993 to end-2002 Countries Jan. June Dec. Dec. Dec. Dec. Dec. Dec. Dec. Dec. 1993 1994 1995 1996 1997 1998 1999 2000 2001 2002 Pakistan 1 7 22 56 145 194 611 539 795 India 8 328 1023 1665 2865 3344 5200 5682 5554 8110 Bangladesh 1 1 4 25 25 38 43 Sri Lanka 1 1 7 22 38 59 82 155 322 China 10 150 507 3406 5698 8245 15109 25657 57783 75755 Korea, Republic 27 226 619 892 5806 7729 11533 15424 17676 14520 Taipei, China 43 337 1354 1889 2608 3173 3807 4319 5405 3182 Singapore 243 662 1180 1808 2909 3000 3140 3900 3513 5379 Hong Kong 69 336 739 1312 1637 1940 2150 2570 3814 3868 Malaysia 122 258 690 1123 1610 1707 1921 2355 3195 3733 Indonesia 1 22 125 340 1273 1442 1525 1860 1395 1947 Philippines 13 102 155 629 668 723 1027 961 766 Thailand 3 24 143 182 1104 1236 1527 2553 3870 4556
Source: International Standards Organization website
82
Finally, let us consider inflows of technology into Pakistan through licensing, as measured by payments
overseas of royalties and technical fees. Figure 23 shows such payments on a per capita basis over time
and Figure 24 the dollar values of the payments and their rate of growth in the late 1990s. The
comparators here are India, China and Bangladesh (plus Thailand for Figure 24).
13 This is based on the (unpublished) findings of a Commonwealth Secretariat mission to Pakistan in 1998 to analyse export competitiveness. One of the present authors (Lall) led that mission. The situation may, of course, have improved significantly since that time.
Page 45
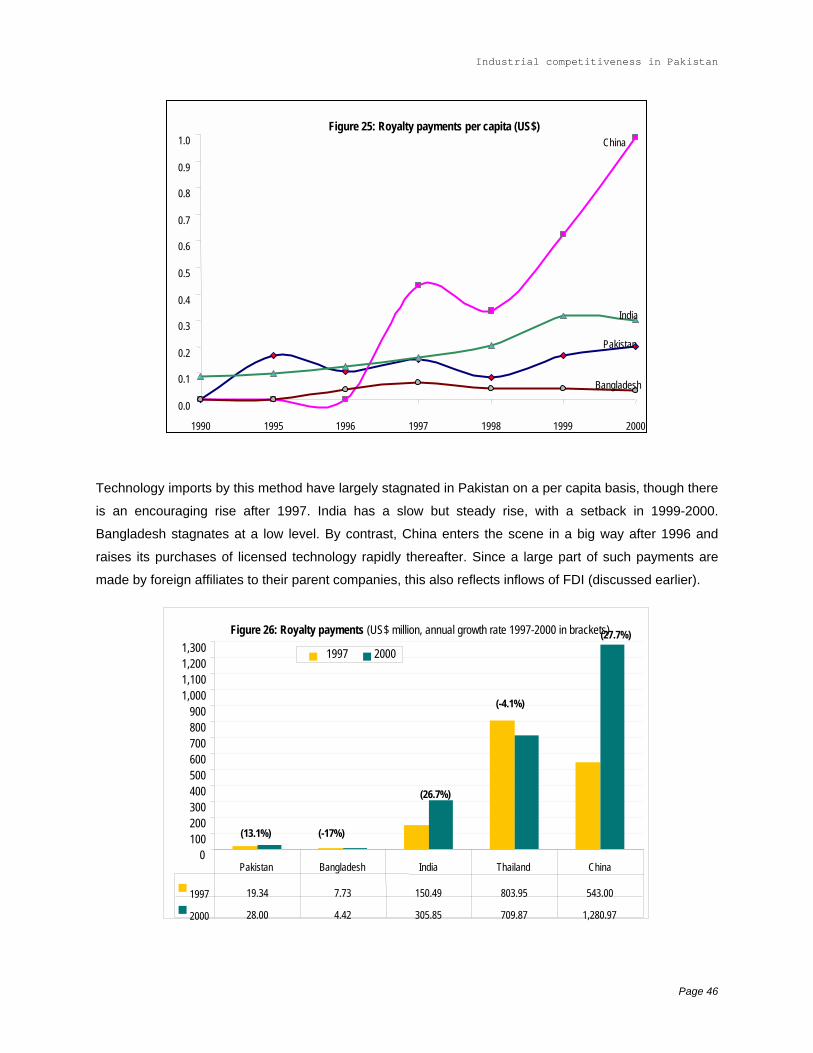
Industrial competitiveness in Pakistan
Figure 25: Royalty payments per capita (US$)1.0 China
0.9
0.8
0.7
0.6
0.5
0.4India
0.3Pakistan
0.2
0.1 Bangladesh
0.0
1990 1995 1996 1997 1998 1999 2000
Technology imports by this method have largely stagnated in Pakistan on a per capita basis, though there
is an encouraging rise after 1997. India has a slow but steady rise, with a setback in 1999-2000.
Bangladesh stagnates at a low level. By contrast, China enters the scene in a big way after 1996 and
raises its purchases of licensed technology rapidly thereafter. Since a large part of such payments are
made by foreign affiliates to their parent companies, this also reflects inflows of FDI (discussed earlier).
Figure 26: Royalty payments (US$ million, annual growth rate 1997-2000 in brackets)(27.7%)
0100 200 300 400 500 600 700 800 900
1,0001,1001,2001,300 1997 2000
(-4.1%)
(26.7%)
(13.1%) (-17%)
Pakistan Bangladesh India Thailand China
19.34 7.73 150.49 803.95 543.001997
28.00 4.42 305.85 709.87 1,280.972000
Page 46
Industrial competitiveness in Pakistan
In sum, the picture of the main ‘drivers’ of competitiveness in Pakistan – human resources, technological
effort, technology inflows and supporting institutions – seems clear and consistent, and it is far from
encouraging. Pakistan has a weak base for building competitive capabilities and there is little sign that it
is improving over time in response to growing international challenges. Its long experience in textiles and
clothing seems to have given it an adequate competitive base in these activities, but even here new niche
markets need to be sought out to keep pace with international competition. The base of skills and
capabilities in essentially low and stable technologies may not, in other words, allow Pakistan to diversify
into the more dynamic and complex activities that are the new engines of export growth in the global
economy. And the base may not be sufficient to attract foreign capital and technology into export-oriented
activities in competition with many other low wage economies that are vying for similar investments.
The indicators used here are preliminary and need much more refinement. They are very general,
sometimes out of date and based on secondary information. They cannot capture the intricacies of skill
creation and technological effort ‘on the ground’ in Pakistani industry and it may well be the case that in
reality there is more of both than they suggest. However, to the extent that they indicate, even roughly,
the underlying structure of capabilities relative to competitors, they are a cause for serious concern.
8. Lessons from East Asia
8.1 Trade and industrial policy
The economies of East Asia, both the first tier newly industrialized economies or NIEs (Korea,
Taipei, China, Hong Kong and Singapore) and a second tier group (Thailand, Malaysia, the
Philippines, and more recently China) offer a dramatic illustration of what rapid growth of
manufactured exports can achieve. These economies are located at various positions on the ladder of
comparative advantage, but to varying degrees they have each succeeded in diversifying out of traditional
primary exports into more dynamic manufactured goods.
The precise mechanism through countries can benefit from a greater openness to trade and a rising
share of exports in total economic activity has been the subject of much discussion and several
possibilities have been identified.
•
First, there is the route of demand expansion, since by breaking into export markets firms can
overcome the constraint imposed by the absolute size and dynamism of the domestic market.14
Insofar as increasing returns to scale in production are important this will reinforce the advantage
14 For example, Bhagwati has contrasted past East Asian experience with that of India (and by implication Pakistan) where growth of the domestic market was constrained by the expansion of agriculture, which cannot grow beyond 4% a year on a sustained basis (cited in Quibria 2002:28).
Page 47
Industrial competitiveness in Pakistan
of operating at higher output levels due to exporting and cost reductions can lead to gains in
export market share and further cost reductions in a cumulative process.
•
•
•
•
•
Second, exporting by exposing firms to foreign competition, technology and marketing networks
can lead to productivity gains unattainable in the domestic market. For example, contacts with
foreign buyers initially in the clothing sector and latterly in branches like electronics, meant that
East and South East Asian firms were integrated into international production networks and
received access to foreign designs and technologies. They were also under constant pressure
from these buyers to remain cost competitive.15
Third, exports generate foreign exchange that allows the purchase of imports. For producers
gains from imports can be static, if they are lower cost than domestic supplies, or dynamic if they
are capital goods that embody a superior technology that generates future productivity gains. For
consumers gains will arise if imports represent new or cheaper products.16
Fourth, insofar as an export-oriented strategy generates more FDI flows than would otherwise
occur and insofar as FDI creates positive externalities, there will be additional benefits that go
beyond the monetary value of exports.
From a policy perspective understanding the precise mechanisms involved may be less important than
formulating the policy package needed to stimulate export growth. Advice given to countries wishing to
raise their export growth is based conventionally on a combination of
adequate price incentives, defined as a competitive real exchange and measures to reduce any
anti-export bias arising from import protection;
access to imported inputs required for export production at world prices, for example through tariff
reform, import duty drawbacks or duty-free access in export processing zones.
As we discuss further below, these trade measures need to be combined with non-trade aspects such as
investment in physical (ports, roads, power supplies) and social (an educated and trained workforce)
infrastructure and support for technology upgrading.
In practice amongst the high growth NIEs there were substantial national variations in the way exports
were promoted with governments using a range of additional (often non-trade) measures to raise the
profitability of exporting. These included
! selective import tariff protection for home market sales, the profits from which were used to cross-
subsidize exports (Korea, Taipei, China);
15 There is considerable evidence from firm and plant level studies that exporting firms tend to have higher productivity as compared with equivalent domestic-oriented firms. The interpretation of this is ambiguous however since causation may run from high productivity to exporting rather than vice versa. 16 Further, theoretically if openness to trade allows a more rapid technological catch-up, for example through the import of capital equipment embodying new technology, then in endogenous growth models openness can be shown to accelerate economic growth.
Page 48
Industrial competitiveness in Pakistan
! access to credits by exporters either for investment or export trade financing, often at subsidized
interest rates (most NIEs);
! tax concessions to investors, including exporters, in the form of tax holidays or accelerated
depreciation allowances (all NIEs);
! preferential allocation of licenses to exporters, for example for technology imports or investment
(Korea and Taipei, China);
! directed finance to strengthen the position of selected and favored enterprises (most NIEs);
! provision of subsidized infrastructure and factory space, for example as part of EPZs (Malaysia,
Thailand, Taipei, China);
! provision of R and D facilities in government institutes (particularly Singapore, Korea), as well as
tax credits for enterprise R and D (all NIEs);
! restriction of wages through controls over union activity and wage bargaining (Korea, Taipei,
China, Malaysia) or subsidization of public housing (Singapore).
This range of interventions was used at different times with varying degrees of success and with the more
direct measures, such as licensing controls and import protection, most significant in the 1960’s and
1970’s. Their net effect was to create rents or supernormal profits for manufacturing exporters. In the
NIEs, in general, such rents tended to be reinvested in further manufacturing expansion rather than
wasted in luxury consumption or speculative ventures. The combination of this set of measures is what is
normally described as industrial policy and its effectiveness has been the subject of considerable debate
even in the context of the first tier NIEs.17
In the current context of economies like Pakistan wishing to diversity their export structure and establish
links with global value chains this experience needs to be understood, but not copied simplistically.
Selective bureaucratic interventions in support of individual firms in general have had a poor track record,
apart from the early experience of the Republic of Korea and Taipei, China. For example, efforts in
Malaysia to support heavy industry through public sector investment proved disappointing with
subsequent privatization of the enterprises (Jomo 1997). In Thailand selective interventions on behalf of
individual firms have been described as marked by ‘patronage and rent-seeking’ rather than by a clear
strategy of industrial upgrading (Christensen et al 1997). In Indonesia credit flows from banks were
received predominantly by politically favoured groups and efforts at ‘technological leapfrogging’ principally
in the national aircraft project were judged a high cost failure (Hill 1995).
Further in the South Asian context where there has been a long tradition of direct government
involvement, current policy is based on withdrawal of government from direct intervention over enterprise
17 For contrasting views on the impact of industrial policy in Taipei, China see Wade (1990, 1994) and Smith (200) and on Korea see Amsden (1989) and Pack (2000).
Page 49
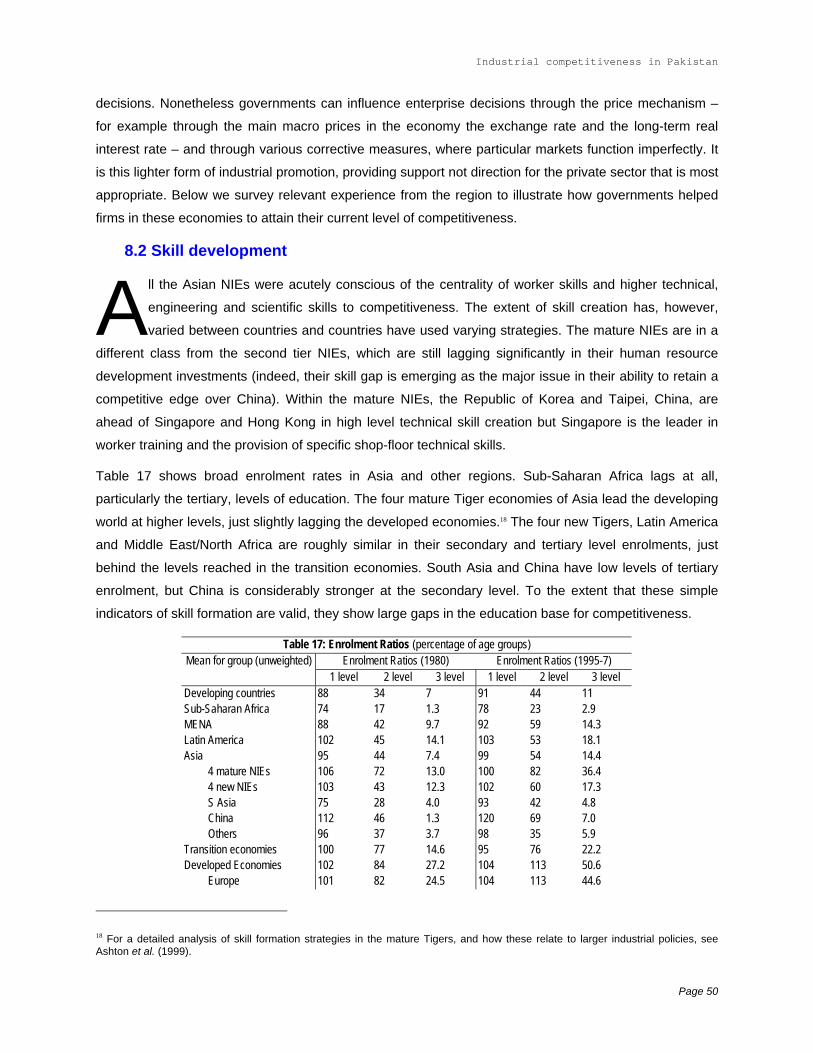
Industrial competitiveness in Pakistan
decisions. Nonetheless governments can influence enterprise decisions through the price mechanism –
for example through the main macro prices in the economy the exchange rate and the long-term real
interest rate – and through various corrective measures, where particular markets function imperfectly. It
is this lighter form of industrial promotion, providing support not direction for the private sector that is most
appropriate. Below we survey relevant experience from the region to illustrate how governments helped
firms in these economies to attain their current level of competitiveness.
8.2 Skill development
All the Asian NIEs were acutely conscious of the centrality of worker skills and higher technical,
engineering and scientific skills to competitiveness. The extent of skill creation has, however,
varied between countries and countries have used varying strategies. The mature NIEs are in a
different class from the second tier NIEs, which are still lagging significantly in their human resource
development investments (indeed, their skill gap is emerging as the major issue in their ability to retain a
competitive edge over China). Within the mature NIEs, the Republic of Korea and Taipei, China, are
ahead of Singapore and Hong Kong in high level technical skill creation but Singapore is the leader in
worker training and the provision of specific shop-floor technical skills.
Table 17 shows broad enrolment rates in Asia and other regions. Sub-Saharan Africa lags at all,
particularly the tertiary, levels of education. The four mature Tiger economies of Asia lead the developing
world at higher levels, just slightly lagging the developed economies.18 The four new Tigers, Latin America
and Middle East/North Africa are roughly similar in their secondary and tertiary level enrolments, just
behind the levels reached in the transition economies. South Asia and China have low levels of tertiary
enrolment, but China is considerably stronger at the secondary level. To the extent that these simple
indicators of skill formation are valid, they show large gaps in the education base for competitiveness.
Table 17: Enrolment Ratios (percentage of age groups) Mean for group (unweighted) Enrolment Ratios (1980) Enrolment Ratios (1995-7)
1 level 2 level 3 level 1 level 2 level 3 level Developing countries 88 34 7 91 44 11 Sub-Saharan Africa 74 17 1.3 78 23 2.9 MENA 88 42 9.7 92 59 14.3 Latin America 102 45 14.1 103 53 18.1 Asia 95 44 7.4 99 54 14.4 4 mature NIEs 106 72 13.0 100 82 36.4 4 new NIEs 103 43 12.3 102 60 17.3 S Asia 75 28 4.0 93 42 4.8 China 112 46 1.3 120 69 7.0 Others 96 37 3.7 98 35 5.9 Transition economies 100 77 14.6 95 76 22.2 Developed Economies 102 84 27.2 104 113 50.6 Europe 101 82 24.5 104 113 44.6
18 For a detailed analysis of skill formation strategies in the mature Tigers, and how these relate to larger industrial policies, see Ashton et al. (1999).
Page 50
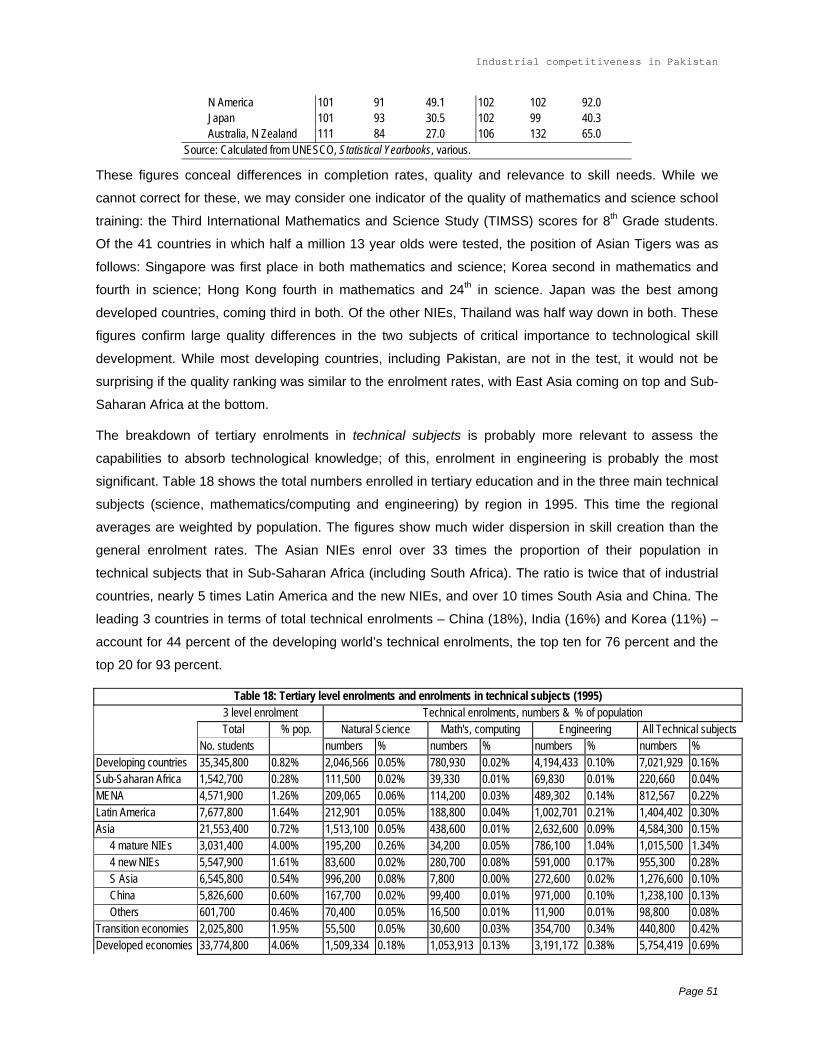
Industrial competitiveness in Pakistan
N America 101 91 49.1 102 102 92.0 Japan 101 93 30.5 102 99 40.3 Australia, N Zealand 111 84 27.0 106 132 65.0 Source: Calculated from UNESCO, Statistical Yearbooks, various.
These figures conceal differences in completion rates, quality and relevance to skill needs. While we
cannot correct for these, we may consider one indicator of the quality of mathematics and science school
training: the Third International Mathematics and Science Study (TIMSS) scores for 8th Grade students.
Of the 41 countries in which half a million 13 year olds were tested, the position of Asian Tigers was as
follows: Singapore was first place in both mathematics and science; Korea second in mathematics and
fourth in science; Hong Kong fourth in mathematics and 24th in science. Japan was the best among
developed countries, coming third in both. Of the other NIEs, Thailand was half way down in both. These
figures confirm large quality differences in the two subjects of critical importance to technological skill
development. While most developing countries, including Pakistan, are not in the test, it would not be
surprising if the quality ranking was similar to the enrolment rates, with East Asia coming on top and Sub-
Saharan Africa at the bottom.
The breakdown of tertiary enrolments in technical subjects is probably more relevant to assess the
capabilities to absorb technological knowledge; of this, enrolment in engineering is probably the most
significant. Table 18 shows the total numbers enrolled in tertiary education and in the three main technical
subjects (science, mathematics/computing and engineering) by region in 1995. This time the regional
averages are weighted by population. The figures show much wider dispersion in skill creation than the
general enrolment rates. The Asian NIEs enrol over 33 times the proportion of their population in
technical subjects that in Sub-Saharan Africa (including South Africa). The ratio is twice that of industrial
countries, nearly 5 times Latin America and the new NIEs, and over 10 times South Asia and China. The
leading 3 countries in terms of total technical enrolments – China (18%), India (16%) and Korea (11%) –
account for 44 percent of the developing world’s technical enrolments, the top ten for 76 percent and the
top 20 for 93 percent.
Table 18: Tertiary level enrolments and enrolments in technical subjects (1995) 3 level enrolment Technical enrolments, numbers & % of population
Total % pop. Natural Science Math's, computing Engineering All Technical subjects No. students numbers % numbers % numbers % numbers % Developing countries 35,345,800 0.82% 2,046,566 0.05% 780,930 0.02% 4,194,433 0.10% 7,021,929 0.16% Sub-Saharan Africa 1,542,700 0.28% 111,500 0.02% 39,330 0.01% 69,830 0.01% 220,660 0.04% MENA 4,571,900 1.26% 209,065 0.06% 114,200 0.03% 489,302 0.14% 812,567 0.22% Latin America 7,677,800 1.64% 212,901 0.05% 188,800 0.04% 1,002,701 0.21% 1,404,402 0.30% Asia 21,553,400 0.72% 1,513,100 0.05% 438,600 0.01% 2,632,600 0.09% 4,584,300 0.15% 4 mature NIEs 3,031,400 4.00% 195,200 0.26% 34,200 0.05% 786,100 1.04% 1,015,500 1.34% 4 new NIEs 5,547,900 1.61% 83,600 0.02% 280,700 0.08% 591,000 0.17% 955,300 0.28% S Asia 6,545,800 0.54% 996,200 0.08% 7,800 0.00% 272,600 0.02% 1,276,600 0.10% China 5,826,600 0.60% 167,700 0.02% 99,400 0.01% 971,000 0.10% 1,238,100 0.13% Others 601,700 0.46% 70,400 0.05% 16,500 0.01% 11,900 0.01% 98,800 0.08% Transition economies 2,025,800 1.95% 55,500 0.05% 30,600 0.03% 354,700 0.34% 440,800 0.42% Developed economies 33,774,800 4.06% 1,509,334 0.18% 1,053,913 0.13% 3,191,172 0.38% 5,754,419 0.69%
Page 51

Industrial competitiveness in Pakistan
Europe 12,297,400 3.17% 876,734 0.23% 448,113 0.12% 1,363,772 0.35% 2,688,619 0.69% N America 16,430,800 5.54% 543,600 0.18% 577,900 0.19% 904,600 0.31% 2,026,100 0.68% Japan 3,917,700 0.49% N/A N/A N/A N/A 805,800 0.10% 805,800 0.10% Australia, NZ 1,128,900 5.27% 89,000 0.42% 27,900 0.13% 117,000 0.55% 233,900 1.09% Source: Calculated from UNESCO (1997) and national sources
Table 18 illustrates some of the differences. The NIEs with the strongest technological ambitions, the
Republic of Korea, Taipei China and Singapore, invested most in training scientists and engineers (but
Korea is far in advance of Taipei China, which in turn is in advance of Singapore, see Figure 27). Their
governments set up new universities and directed curricula towards technical subjects, encouraged
foreign education, and attracted back trained nationals. Moreover, governments did not always provide
substantial direct funding for higher education: in Korea, for instance, the bulk of higher education is
funded privately, with the government playing a guiding and catalytic role. By contrast, Singapore poured
enormous public resources into tertiary education.
Figure 27: Technical enrolments at tertiary levels (% population) 1985 and 1997
0.0
0.2
0.4
0.6
0.8
1.0
1.2
1.4
1.6
1.8
Kore
a
Finlan
d
Taiw
an
Germ
any
USA
Japa
n
Philip
pines
H. K
ong
Sing
apor
e
Mexic
o
Turke
y
Indo
nesia
Thail
and
Malay
sia
China
Singapore’s training system is of particular interest to countries seeking to develop specialised skills for
attracting export-oriented FDI – the provision of such skills has been one of its major ‘selling points’ in
targeting high technology MNCs. Countries such as Pakistan, with a large ‘skills deficit’ could usefully
reflect on how best to emulate aspects of this system. Box 3 describes elements of this system.
Page 52
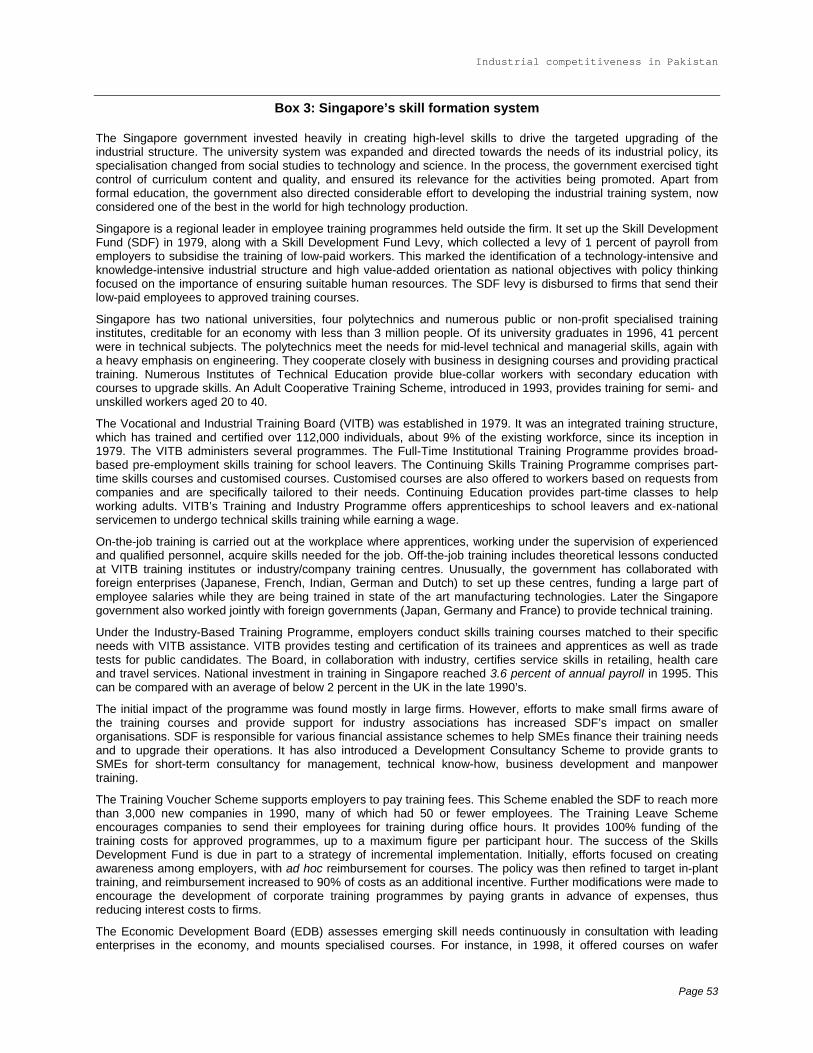
Industrial competitiveness in Pakistan
Box 3: Singapore’s skill formation system
The Singapore government invested heavily in creating high-level skills to drive the targeted upgrading of the industrial structure. The university system was expanded and directed towards the needs of its industrial policy, its specialisation changed from social studies to technology and science. In the process, the government exercised tight control of curriculum content and quality, and ensured its relevance for the activities being promoted. Apart from formal education, the government also directed considerable effort to developing the industrial training system, now considered one of the best in the world for high technology production.
Singapore is a regional leader in employee training programmes held outside the firm. It set up the Skill Development Fund (SDF) in 1979, along with a Skill Development Fund Levy, which collected a levy of 1 percent of payroll from employers to subsidise the training of low-paid workers. This marked the identification of a technology-intensive and knowledge-intensive industrial structure and high value-added orientation as national objectives with policy thinking focused on the importance of ensuring suitable human resources. The SDF levy is disbursed to firms that send their low-paid employees to approved training courses.
Singapore has two national universities, four polytechnics and numerous public or non-profit specialised training institutes, creditable for an economy with less than 3 million people. Of its university graduates in 1996, 41 percent were in technical subjects. The polytechnics meet the needs for mid-level technical and managerial skills, again with a heavy emphasis on engineering. They cooperate closely with business in designing courses and providing practical training. Numerous Institutes of Technical Education provide blue-collar workers with secondary education with courses to upgrade skills. An Adult Cooperative Training Scheme, introduced in 1993, provides training for semi- and unskilled workers aged 20 to 40.
The Vocational and Industrial Training Board (VITB) was established in 1979. It was an integrated training structure, which has trained and certified over 112,000 individuals, about 9% of the existing workforce, since its inception in 1979. The VITB administers several programmes. The Full-Time Institutional Training Programme provides broad-based pre-employment skills training for school leavers. The Continuing Skills Training Programme comprises part-time skills courses and customised courses. Customised courses are also offered to workers based on requests from companies and are specifically tailored to their needs. Continuing Education provides part-time classes to help working adults. VITB’s Training and Industry Programme offers apprenticeships to school leavers and ex-national servicemen to undergo technical skills training while earning a wage.
On-the-job training is carried out at the workplace where apprentices, working under the supervision of experienced and qualified personnel, acquire skills needed for the job. Off-the-job training includes theoretical lessons conducted at VITB training institutes or industry/company training centres. Unusually, the government has collaborated with foreign enterprises (Japanese, French, Indian, German and Dutch) to set up these centres, funding a large part of employee salaries while they are being trained in state of the art manufacturing technologies. Later the Singapore government also worked jointly with foreign governments (Japan, Germany and France) to provide technical training.
Under the Industry-Based Training Programme, employers conduct skills training courses matched to their specific needs with VITB assistance. VITB provides testing and certification of its trainees and apprentices as well as trade tests for public candidates. The Board, in collaboration with industry, certifies service skills in retailing, health care and travel services. National investment in training in Singapore reached 3.6 percent of annual payroll in 1995. This can be compared with an average of below 2 percent in the UK in the late 1990’s.
The initial impact of the programme was found mostly in large firms. However, efforts to make small firms aware of the training courses and provide support for industry associations has increased SDF’s impact on smaller organisations. SDF is responsible for various financial assistance schemes to help SMEs finance their training needs and to upgrade their operations. It has also introduced a Development Consultancy Scheme to provide grants to SMEs for short-term consultancy for management, technical know-how, business development and manpower training.
The Training Voucher Scheme supports employers to pay training fees. This Scheme enabled the SDF to reach more than 3,000 new companies in 1990, many of which had 50 or fewer employees. The Training Leave Scheme encourages companies to send their employees for training during office hours. It provides 100% funding of the training costs for approved programmes, up to a maximum figure per participant hour. The success of the Skills Development Fund is due in part to a strategy of incremental implementation. Initially, efforts focused on creating awareness among employers, with ad hoc reimbursement for courses. The policy was then refined to target in-plant training, and reimbursement increased to 90% of costs as an additional incentive. Further modifications were made to encourage the development of corporate training programmes by paying grants in advance of expenses, thus reducing interest costs to firms.
The Economic Development Board (EDB) assesses emerging skill needs continuously in consultation with leading enterprises in the economy, and mounts specialised courses. For instance, in 1998, it offered courses on wafer
Page 53

Industrial competitiveness in Pakistan
fabrication, process operation and control, precision engineering, high-end digital media production, and computer networking. The EDB also started an International Manpower Programme in 1991 to help companies based in Singapore to attract skilled personnel from around the world. There has been a significant shift in the workforce to more highly skilled jobs. The proportion of professional and technical workers has risen from 15.7 percent in 1990 to 23.1 percent in 1995.
Source: Lall (2001a)
8.3 Technological effort
The East Asian NIEs – Hong Kong excepted – have all stimulated domestic technological effort,
often with a spectacular degree of success. They have been acutely aware of the need for such
effort. The Republic of Korea and Taipei China emphasised local R&D because their export and
industrialization drive was led by national firms: competing in technology intensive activities required local
R&D not only to absorb new technologies, but also because foreign companies refused to license new
technology once their licensees emerged as direct competitors.
Figure 28: Enterprise finance R&D (% GDP), latest av ailable y ear
0.0
0.5
1.0
1.5
2.0
2.5
3.0
Swed
en
Kore
a
Japa
n
USA
Germ
any
Taiw
an
UK
Sing
apor
e
S. A
frica
Braz
il
Malay
sia
China India
Arge
ntina
Mexic
o
Hong
Kon
g
Thail
and
Philip
pines
A strong local innovation base allowed them to develop their own technologies and to offer subcontracting
services to technology leaders as OEM (original equipment manufacture) services. OEM contracts were
an important avenue for learning by national firms, an effective way to 'leverage' foreign technology
(Cyhn, 2001, Hobday, 1995, Mathew and Cho, 1999). But even Singapore, which depends heavily on
technology via FDI, found it essential to raise local R&D to retain a competitive edge with rising wages.
Page 54
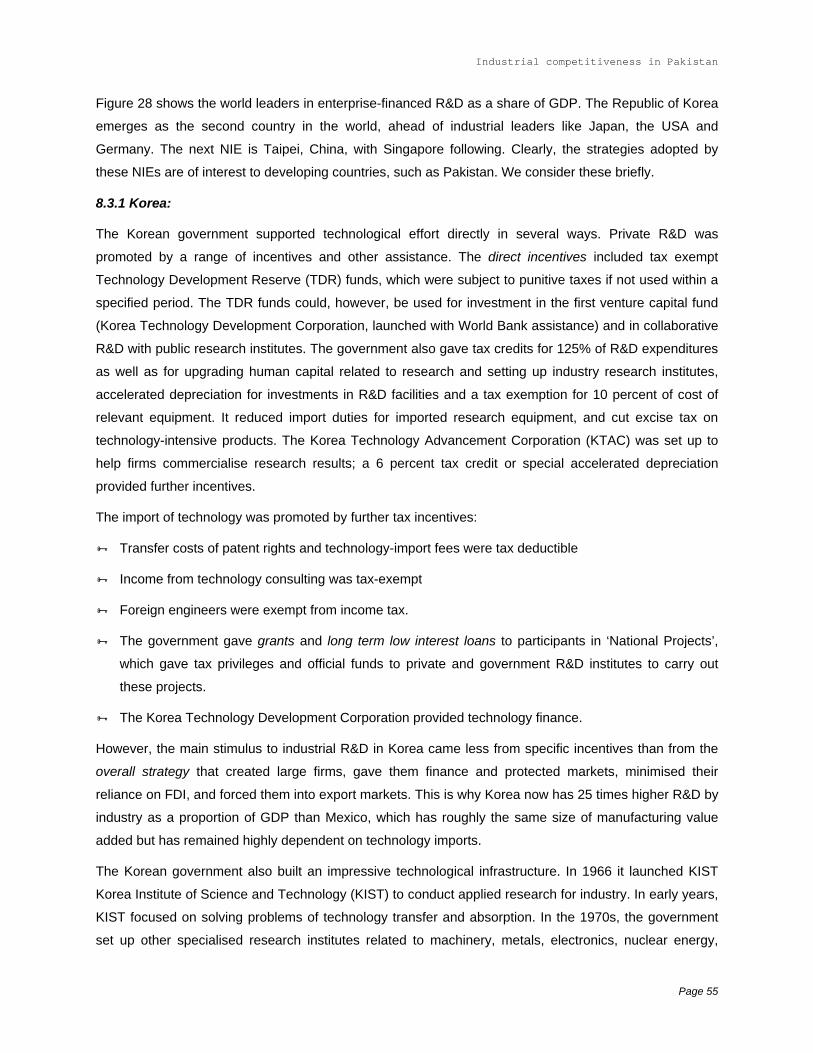
Industrial competitiveness in Pakistan
Figure 28 shows the world leaders in enterprise-financed R&D as a share of GDP. The Republic of Korea
emerges as the second country in the world, ahead of industrial leaders like Japan, the USA and
Germany. The next NIE is Taipei, China, with Singapore following. Clearly, the strategies adopted by
these NIEs are of interest to developing countries, such as Pakistan. We consider these briefly.
8.3.1 Korea:
The Korean government supported technological effort directly in several ways. Private R&D was
promoted by a range of incentives and other assistance. The direct incentives included tax exempt
Technology Development Reserve (TDR) funds, which were subject to punitive taxes if not used within a
specified period. The TDR funds could, however, be used for investment in the first venture capital fund
(Korea Technology Development Corporation, launched with World Bank assistance) and in collaborative
R&D with public research institutes. The government also gave tax credits for 125% of R&D expenditures
as well as for upgrading human capital related to research and setting up industry research institutes,
accelerated depreciation for investments in R&D facilities and a tax exemption for 10 percent of cost of
relevant equipment. It reduced import duties for imported research equipment, and cut excise tax on
technology-intensive products. The Korea Technology Advancement Corporation (KTAC) was set up to
help firms commercialise research results; a 6 percent tax credit or special accelerated depreciation
provided further incentives.
The import of technology was promoted by further tax incentives:
Transfer costs of patent rights and technology-import fees were tax deductible !
!
!
!
!
Income from technology consulting was tax-exempt
Foreign engineers were exempt from income tax.
The government gave grants and long term low interest loans to participants in ‘National Projects’,
which gave tax privileges and official funds to private and government R&D institutes to carry out
these projects.
The Korea Technology Development Corporation provided technology finance.
However, the main stimulus to industrial R&D in Korea came less from specific incentives than from the
overall strategy that created large firms, gave them finance and protected markets, minimised their
reliance on FDI, and forced them into export markets. This is why Korea now has 25 times higher R&D by
industry as a proportion of GDP than Mexico, which has roughly the same size of manufacturing value
added but has remained highly dependent on technology imports.
The Korean government also built an impressive technological infrastructure. In 1966 it launched KIST
Korea Institute of Science and Technology (KIST) to conduct applied research for industry. In early years,
KIST focused on solving problems of technology transfer and absorption. In the 1970s, the government
set up other specialised research institutes related to machinery, metals, electronics, nuclear energy,
Page 55
Industrial competitiveness in Pakistan
resources, chemicals, telecommunications, standards, shipbuilding, marine sciences, and so on. These
were largely spun off from KIST, and by the end of the decade there were 16 public R&D institutions. In
1981 the government decided to reduce their number and rationalise their operations. The institutes were
merged into 9 under the supervision of the Ministry of Science and Technology. KIST was merged with
Korea Advanced Institute of Science (KAIS) to become KAIST, but was separated again — as KIST — in
1989.
The government’s strategic thrust in this sphere was mainly a series of National R&D Projects launched in
1982. These were large-scale projects regarded as too risky for industry to tackle alone but considered in
the country’s industrial interest. National Projects were conducted jointly by industry, public research
institutes and the government, and covered activities like semiconductors, computers, fine chemicals,
machinery, material science and plant system engineering. ‘Centres of Excellence’ were set up to boost
long-term competitiveness in these fields. National Projects were a continuation of policies to identify and
develop Korea’s dynamic comparative advantage, with the government orchestrating the different actors
involved, underwriting a part of the risks, providing large financial grants, and filling in gaps that the
market could not remedy.
Since the early 1980s a number of laws were passed to promote SMEs, leading to a perceptible rise in
their share of economic activity (over 1975-86 the share of SMEs in employment, sales and value added
rose by at least 25 per cent). This policy support was crucial to the reversal in their performance: it
covered SME start-up, productivity improvement, technology development and export promotion. A host
of tax incentives was provided to firms participating in these programs, as well as finance at subsidised
rates for using support services, credit guarantees, government procurement and the setting up of a
specialised bank to finance SMEs. A number of other institutions were set up to help SMEs (such as the
Small and Medium Industry Promotion Corporation to provide financial, technical and training assistance
and the Industrial Development Bank to provide finance). The government raised its budget contribution
to the program, though SMEs had to pay a part of the costs of most services provided to them.
To promote subcontracting to SMEs, the government enacted a law designating parts and components
that had to be procured through them and not made in-house by large firms. By 1987 about 1200 items
were so designated, involving 337 principal firms and some 2200 subcontractors, mainly in the
machinery, electrical, electronic and shipbuilding fields. By this time, subcontracting accounted for about
43% of manufacturing output and 65-77% of the output values of the electrical, transport equipment and
other machinery industries. Generous financial and fiscal support was provided to subcontracting SMEs
to support their operations and technology. Subcontracting SMEs were exempted from stamp tax and
were granted tax deductions for a certain percentage of their investments in laboratory/inspection
equipment and for all their expenses on technical consultancy. Subcontracting promotion councils were
set up by industry and within the Korea Federation of Small Business to help SME contracting, arbitrate
disputes and monitor contract implementation.
Page 56
Industrial competitiveness in Pakistan
8.3.2 Taipei China
While the growth of R&D there has some similarities to Korea, there are important structural differences.
The government had a more arm’s length relationship with industry and did not promote the growth of
large private conglomerates. It started to promote the development of local R&D capabilities in the late
1950s, when its growing trade dependence reinforced the need to enhance local innovative effort to
upgrade and diversify exports. A Science and Technology Program started in 1979, targeting energy,
production automation, information science and materials science technologies for development. In 1982,
biotechnology, electro-optics, hepatitis control and food technology were added to this list. The Science
and Technology Development Plan (1986-95) continued strategic technology targeting, aiming at total
R&D of 2 percent of GDP for 1995; it did not quite achieve this — it reached 1.8 percent by that year.
Around half of R&D in Taipei, China is financed by the government, though the contribution has come
down over time. Private sector R&D has been weak relative to Korea because of the preponderance of
small and medium enterprises (SMEs), which cannot afford the large minimum investments involved in
much of industrial research. However, enterprise R&D has risen over time as some firms (like Acer and
Tatung) have grown to become large multinationals. Such R&D has been encouraged over the years by a
variety of incentives:
Provision of funds for venture capital !
!
!
!
!
!
!
Financing for enterprises that developed ‘strategic’ industrial products (of which 151 were selected in
1982 and 214 in 1987)
Measures to encourage product development by private firms by providing matching interest-free
loans and up to 25 percent of grants for approved projects
Full tax deductibility for R&D expenses, with accelerated depreciation for research equipment
Special incentives for enterprises based in the Hsinchu Science Park (with government financial
institutions able to invest up to 49 percent of the capital)
Requiring larger firms to invest (0.5-1.5 percent of sales, depending on the activity) on R&D.
The government launched several research consortia, funded jointly with industry, to develop critical
high technology products like a new generation automobile engine, 16M DRAM and 4M SRAM chips.
The technology infrastructure in Taipei China holds particular interest for the way in which it supports
SMEs (that account for the bulk of its hi-tech production and exports). The Medium and Small Business
Administration supports SME development and co-ordinates the various agencies that provide financial,
management, accounting, technological and marketing assistance to SMEs. Financial assistance is
provided by the Taiwan Medium Business Bank, the Bank of Taiwan, the Small and Medium Business
Credit Guarantee Fund, and the Small Business Integrated Assistance Centre. Management and
technology assistance is provided by the China Productivity Centre, the Industrial Technology Research
Page 57
Industrial competitiveness in Pakistan
Institute (ITRI) and a number of industrial technology centres (for metal industry, textiles, biotechnology,
food, and information). The government covers up to 50-70 percent of consultation fees for management
and technical consultancy services for SMEs. The Medium and Small Business Administration has
established a fund for SME promotion of NT$ 10 billion. The “Centre-Satellite Factory Promotion
Program” integrates smaller factories around a principal one, supported by vendor assistance and
productivity raising efforts.
Several technology research institutes support R&D in the private sector. The China Textile Research
Centre, set up in 1959 to inspect exports, was expanded to include training, quality systems, technology
development and directly acquiring foreign technology. The Metal Industries Development Centre was set
up in 1963 to work on practical development, testing and quality control work in metalworking industries. It
later established a CAD/CAM centre to provide training and software to firms in this industry. The
Precision Instrument Development Centre fabricated instruments and promoted the instrument
manufacturing industry, and later moved into advanced areas like vacuum and electro-optics technology.
The most important centre was the Industrial Technology Research Institute (ITRI). ITRI conducted R&D
for technology projects considered too risky by the private sector. It had seven laboratories, dealing with
chemicals, mechanical industries, electronics, energy and mining, materials research, measurement
standards and electro-optics, but electronics was the institute's principal focus, with its Electronics
Research & Service (ERSO) division accounting for two-thirds of the Institute's $450 million budget.
ERSO has spun off laboratories as private companies including United Microelectronics Corporation
(UMC) in 1979 and Taiwan Semiconductor Manufacturing Company (TSMC) in 1986, the country’s most
successful integrated circuit makers. The Institute for the Information Industry (III) was set up to
complement ITRI’s work on hardware by developing and introducing software technology.
The government also occasionally played a lead role in importing very advanced technologies. It entered
into a joint venture with Philips to set up the Taiwan Semiconductor Manufacturing Company, the first
wafer fabrication plant in the country (today one of the leaders in the world). The government strongly
encouraged industry to contract research to universities, and half of the National Science Council’s
research grants (about $200 million per year) provided matching funds to industry for such contracts. The
Program for the Promotion of Technology Transfer maintained close contact with foreign firms with
leading-edge technologies in order to facilitate the transfer of those technologies to Taipei, China.
The China Productivity Centre (CPC) promoted automation in industry to cope with rising wages and
increasing needs for precision and quality. The CPC sent out teams of engineers to visit plants
throughout the country and demonstrate the best means of automation and solve relevant technical
problems, at the rate of approximately 500 visits making some 2000 suggestions per year. CPC also
carried out more than 500 research projects on improving production efficiency and linked enterprises to
research centres to solve more complex technical problems. The government set up a science town in
Hsinchu, with 13,000 researchers in two universities, six national laboratories (including ITRI) and a huge
Page 58
Industrial competitiveness in Pakistan
technology institute, as well as some 150 companies specialising in electronics. The science town makes
special effort to attract start-ups and provides them with prefabricated factory space, tax holidays and
generous grants. Finally, it is useful to note a new tool of technology policy in Taipei China – innovation
consortia. Box 4 describes their use.
Box 4: Innovation consortia as a technology ‘leveraging’ tool in Taipei China
IBM unveiled its new PowerPC microprocessor, a product made by IBM, Motorola and Apple, in New York in June 1995. It was followed one day later by the unveiling in Taipei of PowerPC based products by a group of 30 firms from Taipei, China. The local firms had not done this on their own. They were part of an innovation alliance, the Taiwan New PC Consortium formed by a government research institution, the Computing and Communications Laboratory (CCL), set up in 1993 to bring together firms from all parts of the IT industry in Taipei, China. Its purpose was to transfer, master and diffuse the new PowerPC technology over the whole range of products from PCs and peripherals to software and multimedia applications as well as to semiconductor manufacturers. The firms involved were relatively small by international standards, and CCL brought them together and negotiated on their behalf with IBM and Motorola. Taipei, China is emerging as a player in the automotive industry, particularly in the expanding China market, driven by its development of a 1.2 litre 4-valve engine. Again, this is the product of a public-private collaborative research endeavour involving three companies, which have now jointly created the Taiwan Engine Company to produce the product. Thus, the R&D consortium is an inter-firm organizational form that Taipei, China has adapted to its own purposes as a vehicle for catch-up industry creation and technological upgrading.
The R&D consortia were formed hesitantly in the 1980s, but flourished in the 1990s as institutional forms were found which encourage firms to cooperate in raising their technological levels to the point where they can compete successfully in advanced technology industries. Many of these alliances or consortia are in the information technology sectors, covering personal computers, work stations, multiprocessors and multimedia, as well as a range of consumer products and telecommunications and data switching systems and products. But they have also emerged in other sectors such as automotive engines, motor cycles, electric vehicles, and now in the services and financial sector as well. Several such alliances could be counted in the late-1990s, bringing together firms, and public sector research institutes, with the added organizational input of trade associations, and catalytic financial assistance from government. The alliances form an essential component of the national system of innovation.
Taipei, China’s high technology industrial success rests on a capacity to leverage resources and pursue a strategy of rapid catch-up. Its firms tap into advanced markets through various forms of contract manufacturing, and are able to leverage new levels of technological capability from these arrangements. This is an advanced form of “technological learning”, in which the most significant players have not been giant firms (as in Japan or Korea), but small and medium-sized enterprises whose entrepreneurial flexibility and adaptability have been the key to their success. Underpinning this success are the efforts of public sector research and development institutes, such as the Industrial Technology Research Institute (ITRI). Since its founding in 1973 ITRI and its laboratories have acted as a prime vehicle for the leveraging of advanced technologies from abroad, and for their rapid diffusion or dissemination to local firms. This cooperation between public and private sectors, to overcome the scale disadvantages of small firms, is a characteristic feature of the country’s technological upgrading strategies, and the creation of new high technology sectors such as semiconductors.
All the models involve ITRI securing access to a new technology on behalf of local firms – usually a technology source located overseas, in the U.S.A., Japan or Europe. This is common to the operation of all the R&D alliance organizational forms. ITRI thereby acts as the “vehicle” or gateway for firms to access a technology that would otherwise be beyond them. At the same time, it offers a single point of contact for a large advanced firm (such as IBM or Intel or Sun Microsystems) that can license its technology to local firms without having to deal with many small firms simultaneously. The consortia therefore are of mutual benefit. The key issues involved in forming these alliances are not so much whether they provide benefits, which may be taken as given, but how the difficulties involved in securing cooperation between otherwise competing firms are identified and overcome.
Source: Mathews (2001)
8.3.3 Singapore
The Singapore government launched a S$2 billion five year technology plan in 1991. A number of
sectors (information technology, microelectronics, electronic systems, materials technology, advanced
Page 59
Industrial competitiveness in Pakistan
manufacturing technology, energy and water resources, environment, biotechnology, food and agro-
technology and medical sciences) were selected for development. An R&D target of 2% of GDP by 1995
was set; as with Taipei, China, however, the target was not met (in Singapore’s case by a larger margin).
The new science and technology plan, launched in 1997, doubled Science and Technology expenditures,
to S$4 billion over 5 years, of which 30% is directed to strategic industries picked by the government.
There are several schemes in Singapore to promote R&D by the private sector.
The Research Incentive Scheme for Companies (RISC) gives grants to set up ‘Centres of Excellence’
in strategic technologies, and is open to all companies.
!
!
!
!
!
!
The R&D Assistance Scheme (RDAS) gives grants for specific product and process research that
promotes enterprise competitiveness, and is also open to all companies.
The Cooperative Research Program gives grants to local enterprises (at least 30% local equity) to
develop their technological capabilities by working together with universities and research institutions.
The National Science and Technology Board initiates research consortia to allow companies and
research institutes to pool their resources for R&D, and five consortia are already in existence (on
marine technology, aerospace, enterprise security architecture, digital media and advanced
packaging).
The Innovation Development Scheme (IDS) provides a 50 percent grant to all promising innovation
projects; the latest round provided S$130 million to 90 companies, local and foreign, in April, 1997.
More recently, the government is promoting high tech entrepreneurial start-ups similar in spirit and
style to Silicon Valley. Whereas earlier local start-ups were mainly in manufacturing and primarily as
suppliers and contract manufacturers to MNCs, the new ones are more based on product innovation
and focused on IT, software, Internet applications, biotechnology and life sciences. Venture capital
(VC) and ‘business angels’ have become increasingly important as a source for funding. The VC
industry began to take off rapidly from the mid-1990s, with the funds managed exceeding S$10 billion
in 2000. In 1999, 71 start-ups received S$252 million of VC funding, with 50% in information and
communications/media technologies, 15% in electronics, 17% in transportation and logistics, and
12% in industrial products. In particular, spin-offs from universities and public R&D institutions are
increasing in frequency.
According to the government, these schemes have succeeded in raising the share of private R&D in
Singapore to 65% of the total. The Singapore government also plays a catalytic role in promoting selected
technologies.
These experiences in the first tier NIEs are clearly at a technological level well above that of Pakistan at
present. Nonetheless they serve to show what can be achieved over a relatively brief period of time with
Page 60
Industrial competitiveness in Pakistan
well thought out initiatives of public-private collaboration. The challenge for Pakistan will be to forge
suitable alliances to foster technological capability in sectors operating at a lower technological level.
Singapore is perhaps the leading example in the developing world of strategic attraction of FDI to build
export competitiveness and develop a sophisticated industrial sector. Its strategy was not a passive
opening up to global investment flows. It was the use of complex, detailed and finely honed interventions
to build the capabilities needed to attract export-oriented FDI, promote Singapore as a desirable location
for export-oriented activity and target the activities and firms that were fitted into its strategic plans. The
only country that matches this achievement is not in the developing world but in Europe: Ireland. Ireland
has transformed itself from a backward agricultural economy on the periphery of Europe to one of its
fastest growing high technology centres, driven by export-oriented FDI in electronics, pharmaceuticals
and IT services. Box 5 describes the Singapore strategy on FDI. The approach of developing clusters of
related activities closely linked with FDI inflows and with a single planning body overseeing the overall
competitiveness strategy offers ideas for countries like Pakistan to adapt to their own circumstances.
Box 5: FDI strategy in Singapore The Singapore philosophy on foreign investment is that multinationals are to be exploited (‘tapped’ is the favourite word) for the competitive assets they bring to the country that will contribute to its industrial development. The government’s goal is always to maximise learning, technological acquisition, rapid movement up the industrial ladder, and the skills and incomes of its working population. To this end it is willing to contribute capital, tax concessions, infrastructure, education and skills training, and a stable and friendly business environment. While the country is well integrated into international production networks in certain sectors, its fortunes are not tied to those of particular multinational companies, which (like local companies) the government refuses to help if they are unable to compete in the rapidly changing local environment and the world market. Thus over time many multinational factories in Singapore have closed their doors – particularly in low-value, labour-intensive product lines and processes like simple electronic components and consumer goods – and shut down completely or relocated to neighbouring countries, with the Singapore government’s blessing.
The decisions of MNCs about what new technologies to bring into Singapore are strongly influenced by the incentives and direction offered by the government. The Singapore government is the only one in the region, which, like many governments in Western countries, gives grants to firms for complying with specified requirements. These are often to do with entering particular (advanced) technologies. The government supports these incentives, acting in consultation with MNCs (or anticipating through proactive planning) by providing the necessary skilled manpower.
In many instances, it is the speed and flexibility of government response that gives Singapore the competitive edge compared with other competing host countries. In particular, the boom in investment in offshore production by MNCs in the electronics industry in the 1970s and the early 1980s created a major opportunity. The government responded by ensuring that all supporting industries, transport and communication infrastructure, as well as the relevant skill development programmes, were in place to attract these industries to Singapore.
This concentration of resources helps Singapore to achieve significant agglomeration economies and hence first-mover advantages, and has allowed it set up many advanced electronics related industries. An example is the disk-drive industry, where all the major US disk-drive makers have located their assembly plants in Singapore. These industries demanded not only electronics components and PCB assembly support, but also various precision engineering-related supporting industries such as tool and die, plastic injection moulding, electroplating and others. These supporting industries have been actively promoted by the government as part of a “clustering” approach to ensure the competitiveness of the downstream industries.
As labour and land costs have risen, the Singapore government has encouraged MNCs to reconfigure their operations on a regional basis, relocating the lower end operations in other countries and making Singapore their regional headquarters to undertake the higher end manufacturing and other functions. This has often led MNCs to set up regional marketing, distribution, service and R&D centres to service the ASEAN and Asia-Pacific region. To promote such reconfiguration, various incentives
Page 61
Industrial competitiveness in Pakistan
have been offered under the regional headquarters scheme, the international procurement office scheme, the international logistics centre scheme, and the approved trader scheme. There are now some 4,000 foreign firms located in Singapore, about half of them being regional headquarters. Some 80 of these regional headquarters have an average expenditure in Singapore of around US$18 million per year
The management of industrial policy and FDI targeting has been centralised in the Economic Development Board (EDB), part of the Ministry of Trade and Industry (MTI) that gave overall strategic direction. EDB was endowed with the authority to coordinate all activities relating to industrial competitiveness and FDI, and given the resources to hire qualified and well-paid professional staff (essential to manage discretionary policy efficiently and honestly). Over time the agency has become the global benchmark for FDI promotion and approval procedures. Its ability to coordinate the needs of foreign investors with measures to raise local skills and capabilities has also been critical – and a feature that many other FDI agencies lack. The government conducts periodic strategic and competitiveness studies to chart the industrial evolution and upgrading of the economy: the latest was published in 1998 (Ministry of Trade and Industry). Unlike many other countries, MNC leaders are actively involved in the strategy formulation process and are given a strong stake in the development of the economy.
Since its 1991 Strategic Economic Plan, the government has focused its strategy around industrial clusters. The term cluster was not used to denote geographical agglomerations (though in view of the tiny size of the economy all industry is in fact very tightly concentrated) but inter-linked activities in a value chain. In the manufacturing sector the cluster program (called ‘Manufacturing 2000’), the government analyses the strengths and weaknesses of leading industrial clusters, and undertakes FDI promotion and local capability/institution building to promote their future competitiveness. One explicit objective of the program is to avoid the kind of industrial ‘hollowing out’ experienced by Hong Kong (and many other industrial countries).
As an eminent Singaporean analyst, Professor Chia Siow Yue, put it, “The key element of Manufacturing 2000 is the development of industry clusters, that is, the complex of vertically and horizontally linked supporting industries and resources that collectively make the end products or services competitive. The strategy is to upgrade capabilities across the entire value chain in each industry cluster, including product and process development, production, engineering and strategic marketing. The cluster approach has been adopted for major sectors including electronics.”
This strategy has allowed Singapore, for instance, to become the leading centre for hard disk drive production in the world, with considerable local linkages with advanced suppliers and R&D institutions. In 1994, the government set up an S$1 billion Cluster Development Fund (expanded to S$2 billion later) to support specific clusters like a new wafer fabrication park. It also launched a Co-Investment Program to provide official equity financing for joint ventures and for strategic ventures, not just in Singapore but also overseas (as long as this serves its competitive interests). The EDB can take equity stakes to support cluster development by addressing critical gaps and improving local enterprises.
For instance, the EDB co-invested in a local firm SemiTech jointly with Texas Instruments, HP and Canon to make 16M DRAMs. The government also offers start-up grants to attract MNCs to particular areas thought critical to particular industry clusters. The hard-disk drive industry led to the growth of sophisticated local suppliers such as Advanced Systems Automation (making advanced wafer packaging equipment) and Manufacturing Integration Technology (semiconductor testing equipment). The government set up the Institute of Microelectronics in 1991 to conduct R&D and train highly specialised personnel. It encouraged groups of companies to undertake joint technology development (e.g. to improve packaging technologies such as ball grid array). The EDB sometimes takes equity stakes to promote particular technologies, for instance in wafer fabrication facilities.
Source: Lall (2001a)
8.3.4 Thailand
In recent years, there have been growing concerns about the competitive weakness of Thai industry, and
more specifically about the limited intensity of technology development in industry (the technologically
‘shallow’ path of industrial growth) which has contributed to competitive weakness. While Thai industry
has developed considerable capabilities to implement imported technologies, there exists a persuasive
case for the need to deepen and diversify its technology base, and in particular a concern about the
Page 62
Industrial competitiveness in Pakistan
limited technological capabilities in the small-scale sector which pose an increasingly important constraint
on product/process upgrading and export development.
Thailand’s science and technology development over the last 20-30 years differs significantly from that of
the more technologically advanced NIEs that have already made a fundamental transition from a system
focused on developing scientific and technological capabilities in public institutes to one based on firm-
centered structures of innovative activities and capabilities. For example, the current intensity of R&D
performed by business enterprises in Thailand lags around 10-15 years behind the level in Korea in the
early 1980s when that country had a similar level of industrial and manufacturing development as
contemporary Thailand, and the intensity of business-performed R&D in Thailand would need to be
increased to around 20 times its present level in order to ‘catch up’ with the intensity in Korea at that
corresponding earlier stage of industrial development.
The required scale and intensity of investment calls for a deep and pervasive learning process in industry.
This must occur at two levels: (a) individual firms will need to change deeply rooted perspectives on
technology that have dominated industrial investment behavior for 30-40 years, in particular to learn
about the costs, risks and returns involved in investment in types of technological activity and capability
with which they have very limited familiarity; and (b) groups of firms in industries, clusters and value
chains will need to develop much more significant collective efforts in the technology arena in order to
enhance competitiveness, and also to increase the significance of those linked structures of industrial
production within the Thai economy.
At present, the most important thresholds of technological capability that most Thai firms, and in particular
Thai SMEs, need to cross are concerned with increasing the efficiency with which existing technologies
are acquired, used and operated. Even for most larger firms and a few advanced SMEs, the thresholds
involve building their design and engineering capabilities as a basis for starting significant technology
development activities. Only for a few firms that have already built the requisite levels of capability is the
relevant threshold about deepening it further to build up R&D capabilities and activities.
The structure of institutions supporting industrial technology development in Thailand has evolved very
little over the past decade. This contrasts with the considerable innovation and evolution seen in first tier
NIEs. A major study on technology policy in Thailand (Arnold et al 2000) made a series of
recommendations arguing, amongst other things, that
- the direction of policy should shift from a situation where the majority of R&D and related activities
is done in public sector institutes to one where the public sector builds up firm technology
capabilities and implements policies to strengthen firms’ investments in their own capabilities;
Page 63
Industrial competitiveness in Pakistan
- to build capability in industrial firms a grant-based incentive structure is preferable to the use of
tax incentrives for technology related expenditure. A specific proposal involves the establishment
of a fund to support “innovative” activities of the business sector in the form of matching funds or
selective grants;
- an extensive training support program under the umbrella of the Skill Development Fund is
required.
- there should be a greater emphasis on the roles of industry groups and associations, and support
for the development of collective activities aimed at improving the capabilities of members and
the clusters in which they operate.
- policies towards inward FDI should seek to encourage technology upgrading within the local
economy, since there is evidence that contrary to popularly held perspectives in Thailand, the
roles and strategies of multinational corporations (MNC) subsidiaries seem to be shifting towards
a more positive technology development role than in the past. This offers the potential for
generating significant spillovers to the rest of the economy as local affiliates of MNCs appear to
have much more flexibility with regard to their technological behavior and to the localization of
‘deeper’ technological activities.
Page 64
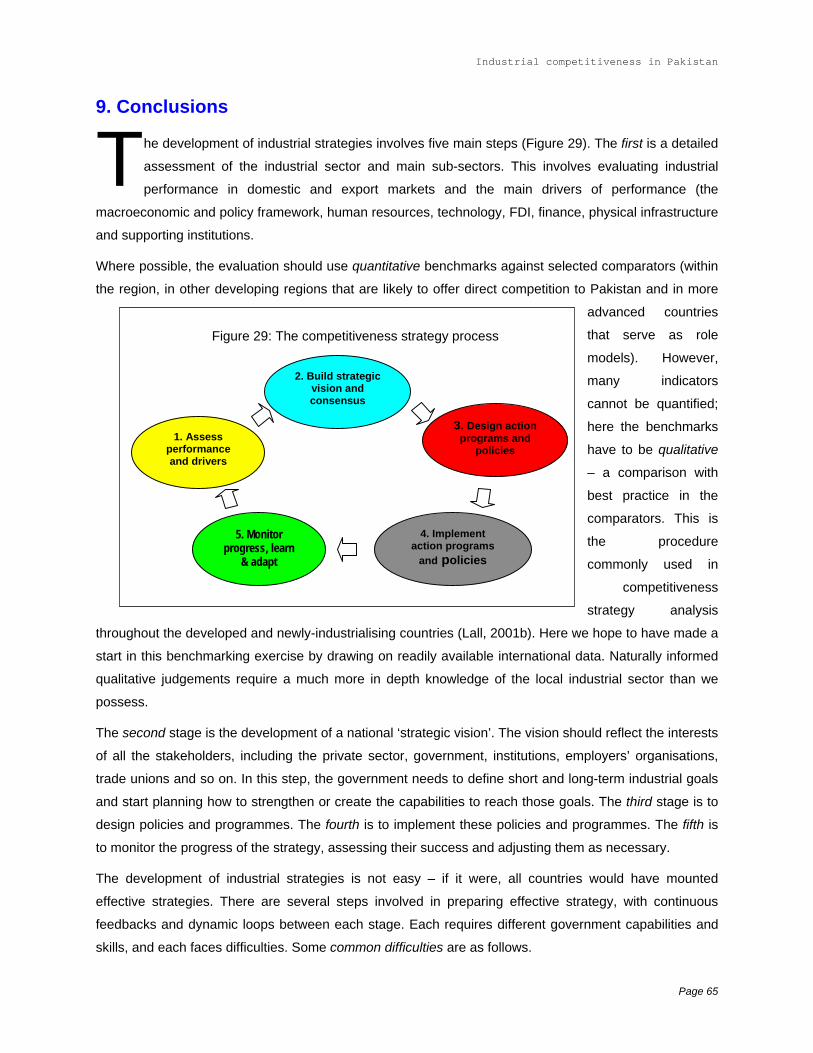
Industrial competitiveness in Pakistan
T9. Con
he development of industrial strategies involves five main steps (Figure 29). The first is a detailed
assessment of the industrial sector and main sub-sectors. This involves evaluating industrial
performance in domestic and export markets and the main drivers of performance (the
macroeconomic and policy framework, human resources, technology, FDI, finance, physical infrastructure
and supporting institutions.
clusions
Where possible, the evaluation should use quantitative benchmarks against selected comparators (within
the region, in other developing regions that are likely to offer direct competition to Pakistan and in more
advanced countries
that serve as role
models). However,
many indicators
cannot be quantified;
here the benchmarks
have to be qualitative
– a comparison with
best practice in the
comparators. This is
the procedure
commonly used in
competitiveness
strategy analysis
throughout the developed and newly-industrialising countries (Lall, 2001b). Here we hope to have made a
start in this benchmarking exercise by drawing on readily available international data. Naturally informed
qualitative judgements require a much more in depth knowledge of the local industrial sector than we
possess.
Figure 29: The competitiveness strategy process
1. Assess performance and drivers
5. Monitor progress, learn
& adapt
4. Implement action programs
and policies
3. Design action programs and
policies
2. Build strategic vision and consensus
The second stage is the development of a national ‘strategic vision’. The vision should reflect the interests
of all the stakeholders, including the private sector, government, institutions, employers’ organisations,
trade unions and so on. In this step, the government needs to define short and long-term industrial goals
and start planning how to strengthen or create the capabilities to reach those goals. The third stage is to
design policies and programmes. The fourth is to implement these policies and programmes. The fifth is
to monitor the progress of the strategy, assessing their success and adjusting them as necessary.
The development of industrial strategies is not easy – if it were, all countries would have mounted
effective strategies. There are several steps involved in preparing effective strategy, with continuous
feedbacks and dynamic loops between each stage. Each requires different government capabilities and
skills, and each faces difficulties. Some common difficulties are as follows.
Page 65
Industrial competitiveness in Pakistan
To start with, most governments are not structured for designing and mounting effective industrial
strategy. The responsibilities and functions that affect industrial competitiveness are scattered over an
array of ministries and institutions: finance, trade, industry, labour, education, science and technology and
others. These often have different objectives and do not communicate with each other on a regular basis.
International experience suggests the value of setting up an industrial competitiveness agency headed at
a very senior political level that can mount a strategy to cut across competing interests and coordinate the
ministries concerned. In the Pakistan context this might involve combining the work of the Export
Promotion Bureau and the Board of Investment, for example.
Then comes the task of allocating resources, at various levels. At the highest level, it has to be decided
which generic areas – education, infrastructure, finance, science and technology and so on – have to be
addressed. This needs a strategic ‘vision’ of what the main engines of industrial competitiveness are
going to be. At the sectoral and sub-sectoral levels, the government has to decide on which activities to
support, not ‘picking winners’ in detail, but allowing winners to emerge in the sets of activities that hold
most promise of long-term economic and technological growth. These activities have to be identified from
clusters of inter-linked industrial activities that share strong technological externalities, use the existing
base of skills and capabilities, can develop good backward linkages and face rising competition both
locally and abroad. The best way to proceed is to examine closely the experience of countries that have
similar endowments but have been successful in developing competitive bases. This is an art rather than
a science, and involves considerable benchmarking and policy analysis.
The ‘bottom line’ of all strategies is, of course, how well they can be designed and implemented in
practice. Government capabilities are therefore vital. The history of development policy is replete with
cases of failed policies. The failure of some interventions does not, of course, mean that all interventions
are undesirable: as long as market failures exist, a wholesale reliance on free markets will be inefficient
compared to a situation where policy can improve or create markets.
We note that there are already various initiatives in place in Pakistan concerning competitiveness and
technological upgrading (Government of Pakistan 2003). Official statements have recognized clearly the
need for amongst other things
- export diversification
- development of clusters
- firm-level technological upgrading
- the encouragement of export-oriented FDI.
The key issue therefore is how to go about achieving these important objectives. As we do not presume
to know the effectiveness of current measures, we would simply make a few basic points.
Page 66
Industrial competitiveness in Pakistan
First, in the light of the international benchmarks noted above adequate government support for a
competitiveness strategy requires a significant commitment in terms of public investment in relevant
technical and general education, as well as the strengthening of public R and D activities. Some of these
problems will require long-run, not short-run solutions.
Second, there are a number of obvious weaknesses in the area of physical infrastructure, particularly
power, that the recent investment climate survey has highlighted. Any further measures to improve the
investment climate, whether reducing bureaucratic restrictions or ensuring continued macro stability, will
also help in competitiveness terms.
Third, it is at the firm level that critical competitiveness problems need to be addressed and here the role
of government is to facilitate and support. The issue is whether the current plans –such as the measures
to support technological upgrading and joint ventures with foreign investors through an Upgradation Fund
– go far enough. In principle support can take a range of forms including the standard tax incentives for
training and R and D expenditure, cost sharing for various consultancy services (as covered by the
upgrading fund), a lower level version of innovation consortia (see box 4), and the provision of finance for
technology support, particularly a form of venture capital for relatively high risk initiatives or matching
grants for innovative activities.
Page 67
Industrial competitiveness in Pakistan
Bibliography
Arnold, E., Bell, M., Bessant, J.,and Brimble, P (2000) Enhancing Policy and Institutional Support for Industrial Technology Development in Thailand: The Overall Policy Framework and the Development of the Industrial Innovation System, report prepared for the World Bank and the National Science and Technology Development Agency, December.
ADB (2003) Asian Development Outlook, Asian Development Bank, Manila
Amsden, A (1989) Asia’s Next Giant, Oxford University Press, Oxford.
Ashton, D., Green, F., James, D. and Sung, J. (1999) Education and Training for Development in East Asia, London: Routledge. Christensen. S, Dollar, D, Siamwalla.A and Vichyanond, P (1997) ‘Thailand: the institutional and political underpinnings of growth’ in D.Leipziger (editor) Lessons from East Asia, University of Michigan Press, Ann Arbor. Djankov. S, la Porta, R, Lopez de Silanes.F and Shleifer.A (2001) The Regulation of Entry, mimeo World Bank website. Government of Pakistan (2003) Trade Policy 2003-04, Speech by Humayun Akhtar Khan, Federal Minister for Commerce, July 19th. Hill, H. (1995) ‘Indonesia from Chronic Drop-Out to Miracle’ Journal of International Development, vol 7, no 5. Jomo, K.S (1997) South East Asia’s Misunderstood Miracle, Westview Press, Boulder.
Krugman, P. (1996), ‘Making Sense of the Competitiveness Debate’, Oxford Review of Economic Policy. vol 12, no 3.
Lall, S. (2001a) Competitiveness, Technology and Skills, Cheltenham: Edward Elgar.
Lall, S. (2001b) ‘Competitiveness indices and developing countries: an economic evaluation of the Global Competitiveness Report’, World Development, vol 29, no 9.
Lall, S. and Albaladejo, M. (2003) ‘China’s export surge: the competitive implications for Southeast Asia’, Oxford: Queen Elizabeth House, report for the World Bank, East Asia Department.
Mathews, J. A. (2001) ‘The origins and dynamics of Taiwan’s R&D consortia’, Research Policy, 30.
Mathews, J. A. and Cho, D.S (2000) Tiger Technology: the creation of a semi-conductor industry East Asia, Cambridge University Press, Cambridge.
Narula, R. (2003) Globalization and Technology, Cambridge: Polity Press.
Pack, H (2000) ‘Industrial Policy: growth elixir or poison?’ World Bank Research Observer, vol 15, no 1.
Porter, M (1990) The Competitive Advantage of Nations, MacmiIlan, London. Quibria, M (2001) ‘Growth and Poverty: lessons from the East Asian Miracle revisited’ ADB Institute, Research Paper 33, Tokyo. Smith, H (2000) Industrial policy in Taiwan and Korea in the 1980’s, Edward Elgar, Cheltenham. UNCTAD, (1997) World Investment Report, UN, New York 1997.
Page 68
Industrial competitiveness in Pakistan
Page 69
UNCTAD, (2002) World Investment Report, UN, New York, 2002. UNCTAD (2003) Trade and Development Report, UN, New York 2003
UNIDO (2002) Industrial Development Report 2002/2003, Vienna: UN Industrial Development Organization.
Wade, R (1994) ‘Selective Industrial Policies in East Asia: is the East Asian Miracle right?’ in Miracle or Design, Lessons from the East Asian Experience, Overseas Development Council, Washington DC.
Wade, R (1990) Governing the Market, Princetown University Press, Princetown.
WTO (2002) Trade Policy Review::Pakistan, Report by the Secretariat, January, Geneva.
World Bank (2002) Pakistan Development Policy Review: a new dawn? April 3rd, Report No 23916-Pak