Indusind Bank - initiating coverage-Jun-12-EDEL
40
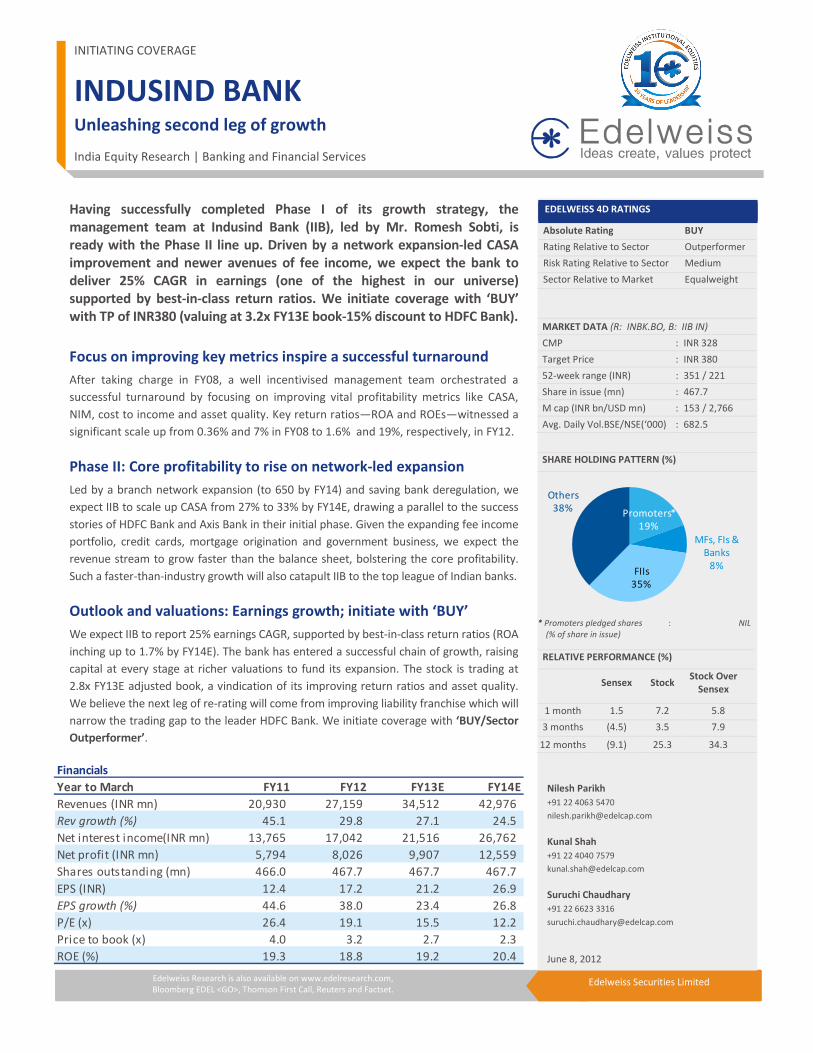
1 Edelweiss Securities Limited Edelweiss Research is also available on www.edelresearch.com, Bloomberg EDEL <GO>, Thomson First Call, Reuters and Factset. Edelweiss Securities Limited INDUSIND BANK Unleashing second leg of growth India Equity Research | Banking and Financial Services Having successfully completed Phase I of its growth strategy, the management team at Indusind Bank (IIB), led by Mr. Romesh Sobti, is ready with the Phase II line up. Driven by a network expansion-led CASA improvement and newer avenues of fee income, we expect the bank to deliver 25% CAGR in earnings (one of the highest in our universe) supported by best-in-class return ratios. We initiate coverage with ‘BUY’ with TP of INR380 (valuing at 3.2x FY13E book-15% discount to HDFC Bank). Focus on improving key metrics inspire a successful turnaround After taking charge in FY08, a well incentivised management team orchestrated a successful turnaround by focusing on improving vital profitability metrics like CASA, NIM, cost to income and asset quality. Key return ratios—ROA and ROEs—witnessed a significant scale up from 0.36% and 7% in FY08 to 1.6% and 19%, respectively, in FY12. Phase II: Core profitability to rise on network-led expansion Led by a branch network expansion (to 650 by FY14) and saving bank deregulation, we expect IIB to scale up CASA from 27% to 33% by FY14E, drawing a parallel to the success stories of HDFC Bank and Axis Bank in their initial phase. Given the expanding fee income portfolio, credit cards, mortgage origination and government business, we expect the revenue stream to grow faster than the balance sheet, bolstering the core profitability. Such a faster-than-industry growth will also catapult IIB to the top league of Indian banks. Outlook and valuations: Earnings growth; initiate with ‘BUY’ We expect IIB to report 25% earnings CAGR, supported by best-in-class return ratios (ROA inching up to 1.7% by FY14E). The bank has entered a successful chain of growth, raising capital at every stage at richer valuations to fund its expansion. The stock is trading at 2.8x FY13E adjusted book, a vindication of its improving return ratios and asset quality. We believe the next leg of re-rating will come from improving liability franchise which will narrow the trading gap to the leader HDFC Bank. We initiate coverage with ‘BUY/Sector Outperformer’. INITIATING COVERAGE EDELWEISS 4D RATINGS Absolute Rating BUY Rating Relative to Sector Outperformer Risk Rating Relative to Sector Medium Sector Relative to Market Equalweight MARKET DATA (R: INBK.BO, B: IIB IN) CMP : INR 328 Target Price : INR 380 52-week range (INR) : 351 / 221 Share in issue (mn) : 467.7 M cap (INR bn/USD mn) : 153 / 2,766 Avg. Daily Vol.BSE/NSE(‘000) : 682.5 SHARE HOLDING PATTERN (%) * Promoters pledged shares (% of share in issue) : NIL RELATIVE PERFORMANCE (%) Sensex Stock Stock Over Sensex 1 month 1.5 7.2 5.8 3 months (4.5) 3.5 7.9 12 months (9.1) 25.3 34.3 June 8, 2012 Nilesh Parikh +91 22 4063 5470 [email protected] Kunal Shah +91 22 4040 7579 [email protected] Suruchi Chaudhary +91 22 6623 3316 [email protected] Promoters* 19% MFs, FIs & Banks 8% FIIs 35% Others 38% Financials Year to March FY11 FY12 FY13E FY14E Revenues (INR mn) 20,930 27,159 34,512 42,976 Rev growth (%) 45.1 29.8 27.1 24.5 Net interest income(INR mn) 13,765 17,042 21,516 26,762 Net profit (INR mn) 5,794 8,026 9,907 12,559 Shares outstanding (mn) 466.0 467.7 467.7 467.7 EPS (INR) 12.4 17.2 21.2 26.9 EPS growth (%) 44.6 38.0 23.4 26.8 P/E (x) 26.4 19.1 15.5 12.2 Price to book (x) 4.0 3.2 2.7 2.3 ROE (%) 19.3 18.8 19.2 20.4
Transcript of Indusind Bank - initiating coverage-Jun-12-EDEL
1 Edelweiss Securities Limited
Edelweiss Research is also available on www.edelresearch.com,
Bloomberg EDEL <GO>, Thomson First Call, Reuters and Factset. Edelweiss Securities Limited
INDUSIND BANK
Unleashing second leg of growth
India Equity Research | Banking and Financial Services
Having successfully completed Phase I of its growth strategy, the
management team at Indusind Bank (IIB), led by Mr. Romesh Sobti, is
ready with the Phase II line up. Driven by a network expansion-led CASA
improvement and newer avenues of fee income, we expect the bank to
deliver 25% CAGR in earnings (one of the highest in our universe)
supported by best-in-class return ratios. We initiate coverage with ‘BUY’
with TP of INR380 (valuing at 3.2x FY13E book-15% discount to HDFC Bank).
Focus on improving key metrics inspire a successful turnaround
After taking charge in FY08, a well incentivised management team orchestrated a
successful turnaround by focusing on improving vital profitability metrics like CASA,
NIM, cost to income and asset quality. Key return ratios—ROA and ROEs—witnessed a
significant scale up from 0.36% and 7% in FY08 to 1.6% and 19%, respectively, in FY12.
Phase II: Core profitability to rise on network-led expansion
Led by a branch network expansion (to 650 by FY14) and saving bank deregulation, we
expect IIB to scale up CASA from 27% to 33% by FY14E, drawing a parallel to the success
stories of HDFC Bank and Axis Bank in their initial phase. Given the expanding fee income
portfolio, credit cards, mortgage origination and government business, we expect the
revenue stream to grow faster than the balance sheet, bolstering the core profitability.
Such a faster-than-industry growth will also catapult IIB to the top league of Indian banks.
Outlook and valuations: Earnings growth; initiate with ‘BUY’
We expect IIB to report 25% earnings CAGR, supported by best-in-class return ratios (ROA
inching up to 1.7% by FY14E). The bank has entered a successful chain of growth, raising
capital at every stage at richer valuations to fund its expansion. The stock is trading at
2.8x FY13E adjusted book, a vindication of its improving return ratios and asset quality.
We believe the next leg of re-rating will come from improving liability franchise which will
narrow the trading gap to the leader HDFC Bank. We initiate coverage with ‘BUY/Sector
Outperformer’.
INITIATING COVERAGE
EDELWEISS 4D RATINGS
Absolute Rating BUY
Rating Relative to Sector Outperformer
Risk Rating Relative to Sector Medium
Sector Relative to Market Equalweight
MARKET DATA (R: INBK.BO, B: IIB IN)
CMP : INR 328
Target Price : INR 380
52-week range (INR) : 351 / 221
Share in issue (mn) : 467.7
M cap (INR bn/USD mn) : 153 / 2,766
Avg. Daily Vol.BSE/NSE(‘000) : 682.5
SHARE HOLDING PATTERN (%)
* Promoters pledged shares
(% of share in issue)
: NIL
RELATIVE PERFORMANCE (%)
Sensex Stock Stock Over
Sensex
1 month 1.5 7.2 5.8
3 months (4.5) 3.5 7.9
12 months (9.1) 25.3 34.3
June 8, 2012
Nilesh Parikh
+91 22 4063 5470
Kunal Shah
+91 22 4040 7579
Suruchi Chaudhary
+91 22 6623 3316 [email protected]
Promoters*
19%
MFs, FIs &
Banks
8%FIIs
35%
Others
38%
Financials
Year to March FY11 FY12 FY13E FY14E
Revenues (INR mn) 20,930 27,159 34,512 42,976
Rev growth (%) 45.1 29.8 27.1 24.5
Net interest income(INR mn) 13,765 17,042 21,516 26,762
Net profit (INR mn) 5,794 8,026 9,907 12,559
Shares outstanding (mn) 466.0 467.7 467.7 467.7
EPS (INR) 12.4 17.2 21.2 26.9
EPS growth (%) 44.6 38.0 23.4 26.8
P/E (x) 26.4 19.1 15.5 12.2
Price to book (x) 4.0 3.2 2.7 2.3
ROE (%) 19.3 18.8 19.2 20.4
2 Edelweiss Securities Limited
Banking and Financial Services
Investment rationale
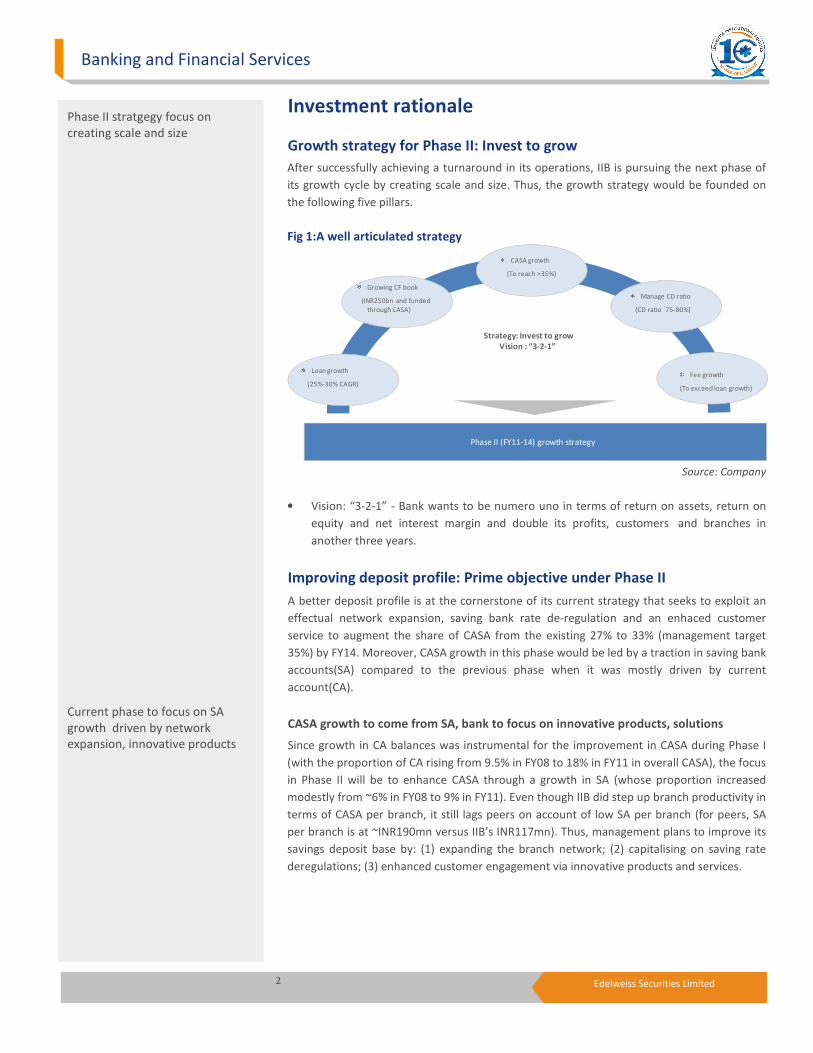
Growth strategy for Phase II: Invest to grow
After successfully achieving a turnaround in its operations, IIB is pursuing the next phase of
its growth cycle by creating scale and size. Thus, the growth strategy would be founded on
the following five pillars.
Fig 1:A well articulated strategy
Strategy: Invest to grow
Vision : “3-2-1”
Loan growth
(25%-30% CAGR)
Growing CF book
(INR250bn and funded
through CASA)
CASA growth
(To reach >35%)
Fee growth
(To exceed loan growth)
Manage CD ratio
(CD ratio 75-80%)
Phase II (FY11-14) growth strategy
Source: Company
• Vision: “3-2-1” - Bank wants to be numero uno in terms of return on assets, return on
equity and net interest margin and double its profits, customers and branches in
another three years.
Improving deposit profile: Prime objective under Phase II
A better deposit profile is at the cornerstone of its current strategy that seeks to exploit an
effectual network expansion, saving bank rate de-regulation and an enhaced customer
service to augment the share of CASA from the existing 27% to 33% (management target
35%) by FY14. Moreover, CASA growth in this phase would be led by a traction in saving bank
accounts(SA) compared to the previous phase when it was mostly driven by current
account(CA).
CASA growth to come from SA, bank to focus on innovative products, solutions
Since growth in CA balances was instrumental for the improvement in CASA during Phase I
(with the proportion of CA rising from 9.5% in FY08 to 18% in FY11 in overall CASA), the focus
in Phase II will be to enhance CASA through a growth in SA (whose proportion increased
modestly from ~6% in FY08 to 9% in FY11). Even though IIB did step up branch productivity in
terms of CASA per branch, it still lags peers on account of low SA per branch (for peers, SA
per branch is at ~INR190mn versus IIB’s INR117mn). Thus, management plans to improve its
savings deposit base by: (1) expanding the branch network; (2) capitalising on saving rate
deregulations; (3) enhanced customer engagement via innovative products and services.
Phase II stratgegy focus on
creating scale and size
Current phase to focus on SA
growth driven by network
expansion, innovative products

3 Edelweiss Securities Limited
Indusind Bank
Chart 1:SA/branch vis-à-vis peers
0
70
140
210
280
350
Axis Bank HDFC Bank Kotak Mahindra
Bank
IndusInd Bank Yes Bank
(IN
R m
n)
Saving Deposit / branch
Source: Company
Massive branch expansion to create nationwide presence and build density
In the initial part of Phase I (FY09-10), IIB had focused on improving productivity by
reorganising the branch architecture and, hence, opened only 30 branches. From FY11 , the
bank has stepped up branch expansion, which we expect to continue in Phase II. The bank
currently has a nationwide presence with 400 branches and 674 ATMs. Further, it intends to
widen the reach and exit FY14 with 650 branches, entailing opening around 125 branches
over the next two years. The strategy for branch expansion would revolve around creating
density—as 75% of the new branches will be set up in existing centres.
With most of the regulatory compliance (in terms of branch opening) in place and the RBI
relaxing its stance on branch opening, we believe IIB will close in on its target to open ~650
branches by FY14E. This spurt in number of branches will provide the bank with the much
needed visibility, which in turn will help it ramp up new client acquisition (by having an
increased distribution capability) thus helping it maintain desired growth .
Capitalising on savings rate deregulation to accelerate deposit base
With the saving bank rate deregulation already coming to the fore, the management
capitalised on the opportunity by hiking interest rates on its savings bank deposits (5.5% for
<INR0.1mn and 6% for >INR0.1mn accounts). The bank’s rate are currently at a level greater
than its peers by ~150-200bps. The effect of this can be seen in the increased savings base
(from INR33bn in Q2FY12 to INR47bn in Q4FY12 , 93% QoQ increase in new to bank clients
saving deposits).
Enhanced customer engagement
With the focus on improving SA base, management launched various innovative initiatives
like allowing customers to choose the denomination of bank notes at ATMs, enabling
customers/family to withdraw from ATMs without using cards, cheques scan on bank
statements etc., to enhance customer service standards and customer engagement. We
expect these initiatives to enhance the bank’s visibility in tier 2 cities, which in turn will help
attract new customer base.
Branch network to reach 650 by
FY14 – focusing on creating
density
4 Edelweiss Securities Limited
Banking and Financial Services
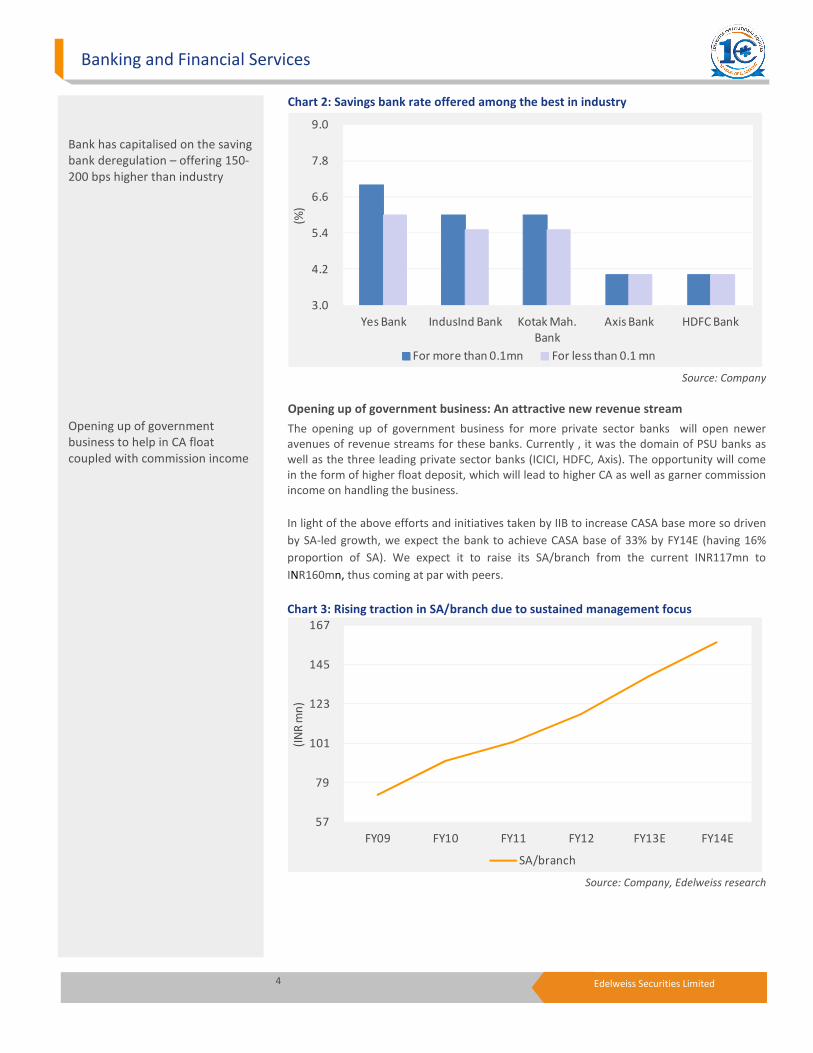
Chart 2: Savings bank rate offered among the best in industry
3.0
4.2
5.4
6.6
7.8
9.0
Yes Bank IndusInd Bank Kotak Mah.
Bank
Axis Bank HDFC Bank
(%)
For more than 0.1mn For less than 0.1 mn Source: Company
Opening up of government business: An attractive new revenue stream
The opening up of government business for more private sector banks will open newer
avenues of revenue streams for these banks. Currently , it was the domain of PSU banks as
well as the three leading private sector banks (ICICI, HDFC, Axis). The opportunity will come
in the form of higher float deposit, which will lead to higher CA as well as garner commission
income on handling the business.
In light of the above efforts and initiatives taken by IIB to increase CASA base more so driven
by SA-led growth, we expect the bank to achieve CASA base of 33% by FY14E (having 16%
proportion of SA). We expect it to raise its SA/branch from the current INR117mn to
INR160mn, thus coming at par with peers.
Chart 3: Rising traction in SA/branch due to sustained management focus
57
79
101
123
145
167
FY09 FY10 FY11 FY12 FY13E FY14E
(IN
R m
n)
SA/branch Source: Company, Edelweiss research
Bank has capitalised on the saving
bank deregulation – offering 150-
200 bps higher than industry
Opening up of government
business to help in CA float
coupled with commission income
5 Edelweiss Securities Limited
Indusind Bank
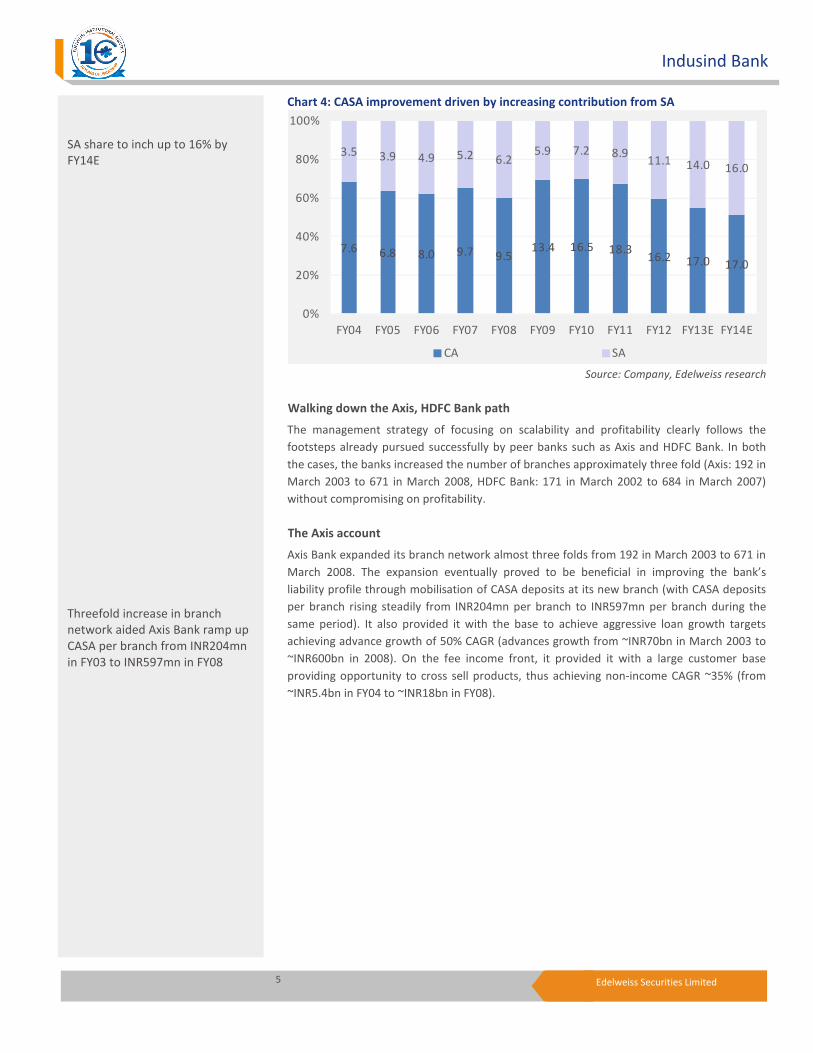
Chart 4: CASA improvement driven by increasing contribution from SA
7.6 6.8 8.0 9.7 9.513.4 16.5 18.3
16.2 17.0 17.0
3.5 3.9 4.9 5.2 6.25.9 7.2 8.9
11.1 14.0 16.0
0%
20%
40%
60%
80%
100%
FY04 FY05 FY06 FY07 FY08 FY09 FY10 FY11 FY12 FY13E FY14E
CA SA
Source: Company, Edelweiss research
Walking down the Axis, HDFC Bank path
The management strategy of focusing on scalability and profitability clearly follows the
footsteps already pursued successfully by peer banks such as Axis and HDFC Bank. In both
the cases, the banks increased the number of branches approximately three fold (Axis: 192 in
March 2003 to 671 in March 2008, HDFC Bank: 171 in March 2002 to 684 in March 2007)
without compromising on profitability.
The Axis account
Axis Bank expanded its branch network almost three folds from 192 in March 2003 to 671 in
March 2008. The expansion eventually proved to be beneficial in improving the bank’s
liability profile through mobilisation of CASA deposits at its new branch (with CASA deposits
per branch rising steadily from INR204mn per branch to INR597mn per branch during the
same period). It also provided it with the base to achieve aggressive loan growth targets
achieving advance growth of 50% CAGR (advances growth from ~INR70bn in March 2003 to
~INR600bn in 2008). On the fee income front, it provided it with a large customer base
providing opportunity to cross sell products, thus achieving non-income CAGR ~35% (from
~INR5.4bn in FY04 to ~INR18bn in FY08).
SA share to inch up to 16% by
FY14E
Threefold increase in branch
network aided Axis Bank ramp up
CASA per branch from INR204mn
in FY03 to INR597mn in FY08
6 Edelweiss Securities Limited
Banking and Financial Services
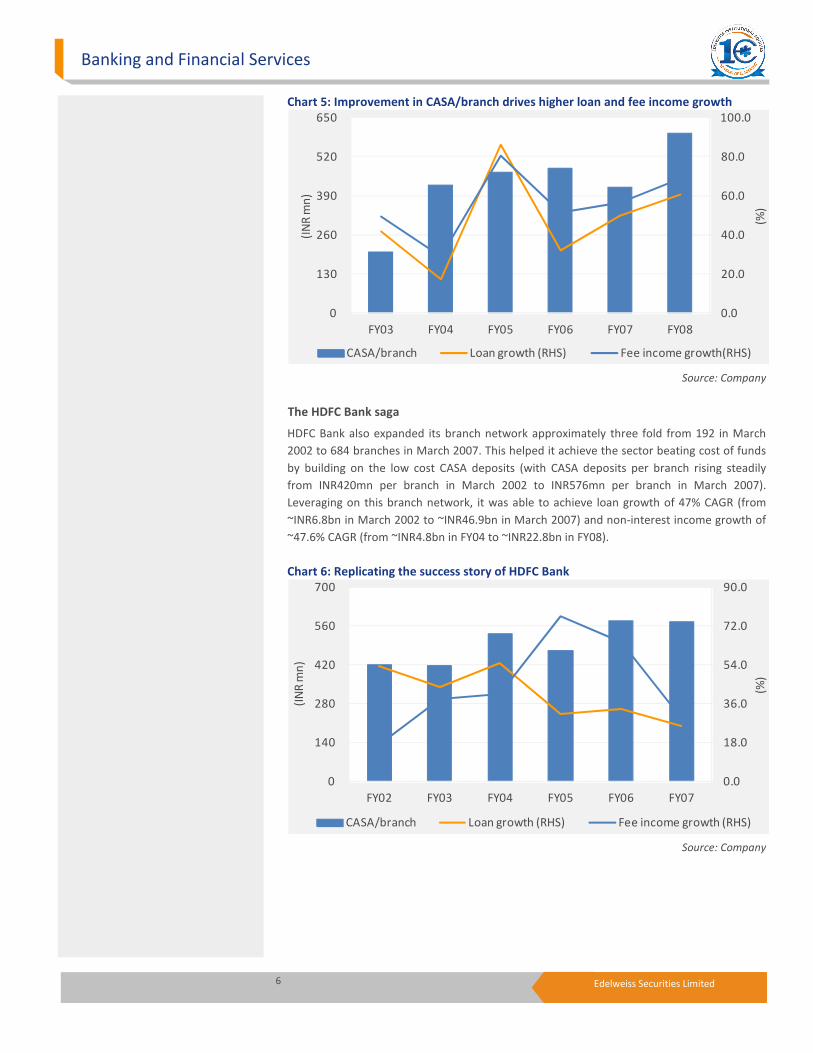
Chart 5: Improvement in CASA/branch drives higher loan and fee income growth
0.0
20.0
40.0
60.0
80.0
100.0
0
130
260
390
520
650
FY03 FY04 FY05 FY06 FY07 FY08
(%)
(IN
R m
n)
CASA/branch Loan growth (RHS) Fee income growth(RHS)
Source: Company
The HDFC Bank saga
HDFC Bank also expanded its branch network approximately three fold from 192 in March
2002 to 684 branches in March 2007. This helped it achieve the sector beating cost of funds
by building on the low cost CASA deposits (with CASA deposits per branch rising steadily
from INR420mn per branch in March 2002 to INR576mn per branch in March 2007).
Leveraging on this branch network, it was able to achieve loan growth of 47% CAGR (from
~INR6.8bn in March 2002 to ~INR46.9bn in March 2007) and non-interest income growth of
~47.6% CAGR (from ~INR4.8bn in FY04 to ~INR22.8bn in FY08).
Chart 6: Replicating the success story of HDFC Bank
0.0
18.0
36.0
54.0
72.0
90.0
0
140
280
420
560
700
FY02 FY03 FY04 FY05 FY06 FY07
(%)
(IN
R m
n)
CASA/branch Loan growth (RHS) Fee income growth (RHS)
Source: Company

7 Edelweiss Securities Limited
Indusind Bank
Higher-than-industry loan growth
IIB has laid emphasis on achieving 25% loan growth over the next 2-3 years (above the
industry average loan growth of 16-17%). Having increased the share of consumer finance
(CF) from 44% in FY11 to ~50% in FY12 on back of strong growth in CVs, we believe going
forward CF and corporate banking (CCB) growth will track similar run-rate, in line with
management strategy of maintaining loan mix at 50% .
Chart 7: IIB loan growth to be above industry average
12.0
17.8
23.6
29.4
35.2
41.0
FY09 FY10 FY11 FY12 FY13E FY14E
(%)
Loan growth Industry loan growth
Source: Company, Edelweiss research
Chart 8: Optimal loan book mix of ~50% CF and 50% CCB to be maintained
5745 44 49 50
4355 56 51 50
0%
20%
40%
60%
80%
100%
FY09 FY10 FY11 FY12 FY14E
Consumer finance Corporate and commercial banking
Source: Company, Edelweiss research
Focusing on CF
At the beginning of Phase II, the management had articulated the intention of achieving an
equal mix between corporate and consumer book and to fund the increase in the consumer
book via CASA base. During FY12, given the elevated interest rates, – bank consciously
choose to scale up the fixed rate – commercial vehicles segment to restrict the decline in
NIMs on the existing fixed rate book . This, along with the opportunity thrown up by the CV
segment , consumer finance (CF) segment scaled up to ~50% in FY12 itself. On the other
Target of 25% CAGR over the next
2 years – higher than industry
CF book to retain 50% share
driven by CVs and stepping up of
the LAP portfolio
8 Edelweiss Securities Limited
Banking and Financial Services
hand, also as part of the conscious strategy, IIB restricted growth in corporate book by selling
down loans via inter-bank participation. We believe that CF book will post ~25% CAGR over
FY12-14E comprising ~50% of the total loan book. We expect growth to be driven by: (1)
increased sales in commercial vehicle segment (with increased thrust towards LCV and entry
level four-wheelers); (2) commercial equipment; (3) used vehicle segment; and (4) loan
against property segment which is expected to scale up about ~15% of the CF book. This
renewed focus on used vehicle segment, in turn, will help maintain the desired NIMs (as
these have high yields).
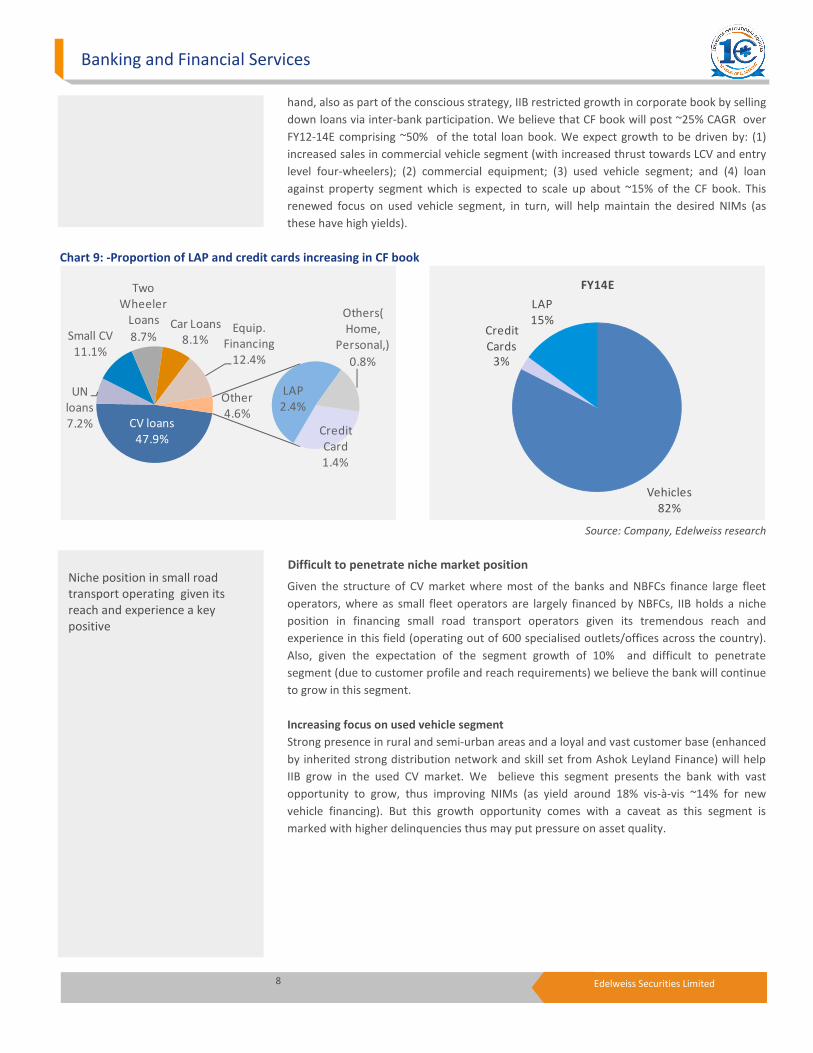
Chart 9: -Proportion of LAP and credit cards increasing in CF book
CV loans
47.9%
UN
loans
7.2%
Small CV
11.1%
Two
Wheeler
Loans
8.7%Car Loans
8.1%Equip.
Financing
12.4%
Credit
Card
1.4%
LAP
2.4%
Others(
Home,
Personal,)
0.8%
Other
4.6%
Source: Company, Edelweiss research
Difficult to penetrate niche market position
Given the structure of CV market where most of the banks and NBFCs finance large fleet
operators, where as small fleet operators are largely financed by NBFCs, IIB holds a niche
position in financing small road transport operators given its tremendous reach and
experience in this field (operating out of 600 specialised outlets/offices across the country).
Also, given the expectation of the segment growth of 10% and difficult to penetrate
segment (due to customer profile and reach requirements) we believe the bank will continue
to grow in this segment.
Increasing focus on used vehicle segment
Strong presence in rural and semi-urban areas and a loyal and vast customer base (enhanced
by inherited strong distribution network and skill set from Ashok Leyland Finance) will help
IIB grow in the used CV market. We believe this segment presents the bank with vast
opportunity to grow, thus improving NIMs (as yield around 18% vis-à-vis ~14% for new
vehicle financing). But this growth opportunity comes with a caveat as this segment is
marked with higher delinquencies thus may put pressure on asset quality.
Vehicles
82%
Credit
Cards
3%
LAP
15%
FY14E
Niche position in small road
transport operating given its
reach and experience a key
positive
9 Edelweiss Securities Limited
Indusind Bank
Chart 10: CF book to sustain 25% CAGR over FY12-14E
65,000
108,000
151,000
194,000
237,000
280,000
Q4
FY
10
Q1
FY
11
Q2
FY
11
Q3
FY
11
Q4
FY
11
Q1
FY
12
Q2
FY
12
Q3
FY
12
Q4
FY
12
FY
14
E
(IN
R m
n)
CF book
Source: Company, Edelweiss research
Chart 11: Average yield on CF book - above CCB book thus helping to increase margins
7.0
9.6
12.2
14.8
17.4
20.0
Q2FY11 Q3FY11 Q4FY11 Q1FY12 Q2FY12 Q3FY12 Q4FY12
(%)
CF average yield CCB average yield
Source: Company
Working capital focus to continue for CCB book
We expect the CCB book to post 25% CAGR over FY12-14E, thus contributing ~50% to total
loan book. Focus will continue to be funding the working capital requirements rather than
long-term project finance. The management expects the mix of the CCB segment to sustain
at the current level.
Working capital financing to
continue to be focus segment in
CCB book

10 Edelweiss Securities Limited
Banking and Financial Services
Chart 12: Growth in CCB book to be driven by working capital finance
47.9 48.655.8 55.3
47.054.9 54.5 54.4 53.3
37.2 36.830.6 31.3
34.827.6 28.1 28.5 29.9
14.9 14.6 13.6 13.4 18.2 17.5 17.4 17.0 16.8
0%
20%
40%
60%
80%
100%
Q4FY10 Q1FY11 Q2FY11 Q3FY11 Q4FY11 Q1FY12 Q2FY12 Q3FY12 Q4FY12
Corp and inv. banking Commercial banking Loan to small businesses
Source: Company
Chart 13: Superior quality as majority of lending figures in investment grade
Source: Company
Focus on non-interest income growth
IIB plans to strengthen its fee income (targeting to grow fee income more than loan growth)
by focusing on (new) fee enhancers, coupled with raising growth momentum in existing
segments of structured trade ,treasury products and foreign exchange business.
• Scaling up of investment banking practice
With the unit housing strong capabilities across areas, viz., debt syndication, credit
structuring and advisory and private equity advisory, management strategy is to
leverage the bank’s client base and strong relationships to provide highly customised
investment banking solutions so that effective partnership can be extended to clients in
their growth.
Investment grade Sub investment grade
Fee income growth to grow faster
than balance sheet

11 Edelweiss Securities Limited
Indusind Bank
• Full suite asset portfolio
The bank plans to energize its retail bank offering by providing full suite asset portfolio
by leveraging on products like LAP (loan against property), credit card, and mortgage
origination for HDFC.
• Leveraging on credit card business acquired from Deutsche Bank
The bank could have developed the credit card business organically, but it bid for the
Deutsche bank’s card portfolio in India to grab the opportunity to jump start the
business. Key benefits that management has by this acquisition are: 1) An evolved and
stable system platform and 2) strong product range with deep relationships with credit
card programme partners. Further, management as its part of strategy aims to grow this
credit card portfolio to ~INR8bn(~1.3% of loan book ) from INR 2.7 bn currently, with
focus on affluent customers.
• Fee for mortgage origination for HDFC
It has recently tied up with HDFC Ltd to sell its mortgage product for fee-based income.
It is likely to earn a fee of 90bps on these loans; if it also cross-sells mortgage insurance
products, it will earn an additional fee of 50bps (currently, the conversion rate is 1 out
of 3), with an option to buy back 30% of the book. The management plans to leverage
this relationship to increase its fee-based component (given that mortgage product is
not the bank’s expertise, it does not intent to focus on it fully).
Chart 14: Contributors to the core fee income
0%
20%
40%
60%
80%
100%
FY10 FY11 FY12 FY13E FY14E
Trade & Remittances Foreign Exchange Income
TPP Distribution Income (Insurance, MF) General Banking Fees
Loan Processing Fees Investment Banking Source: Company, Edelweiss research
Credit cards portfolio to reach
INR 8 bn (1.3% of loan book)
12 Edelweiss Securities Limited
Banking and Financial Services
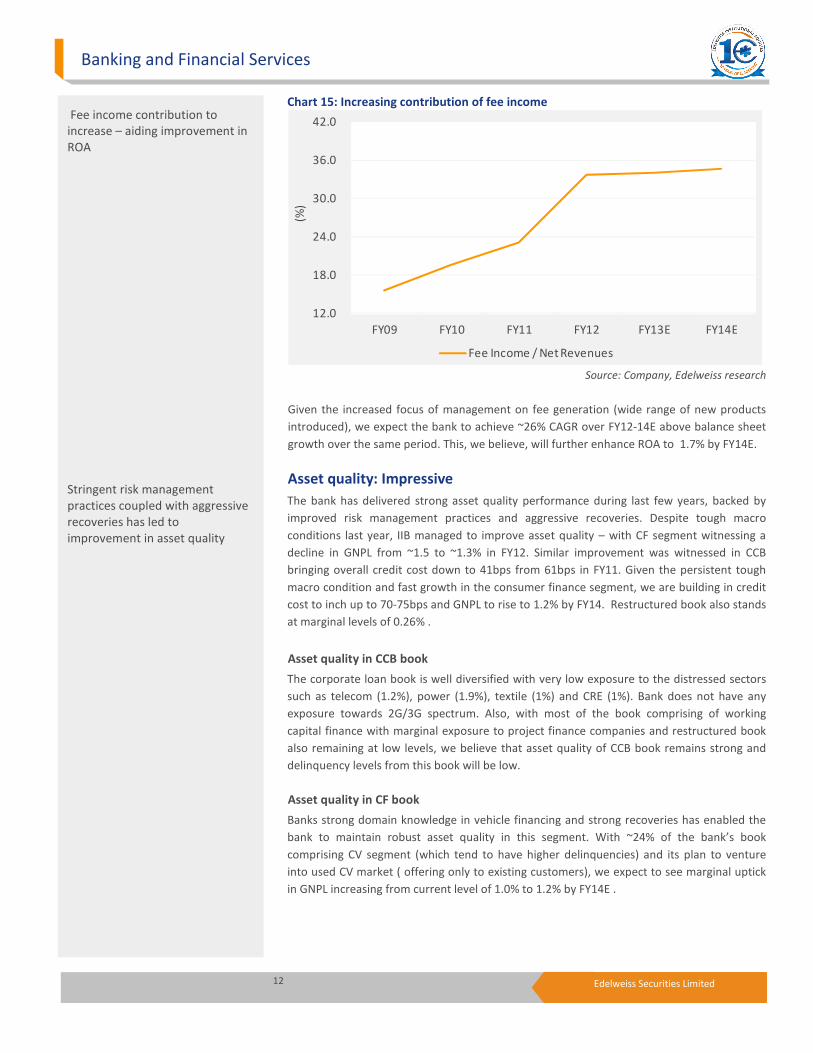
Chart 15: Increasing contribution of fee income
12.0
18.0
24.0
30.0
36.0
42.0
FY09 FY10 FY11 FY12 FY13E FY14E
(%)
Fee Income / Net Revenues Source: Company, Edelweiss research
Given the increased focus of management on fee generation (wide range of new products
introduced), we expect the bank to achieve ~26% CAGR over FY12-14E above balance sheet
growth over the same period. This, we believe, will further enhance ROA to 1.7% by FY14E.
Asset quality: Impressive
The bank has delivered strong asset quality performance during last few years, backed by
improved risk management practices and aggressive recoveries. Despite tough macro
conditions last year, IIB managed to improve asset quality – with CF segment witnessing a
decline in GNPL from ~1.5 to ~1.3% in FY12. Similar improvement was witnessed in CCB
bringing overall credit cost down to 41bps from 61bps in FY11. Given the persistent tough
macro condition and fast growth in the consumer finance segment, we are building in credit
cost to inch up to 70-75bps and GNPL to rise to 1.2% by FY14. Restructured book also stands
at marginal levels of 0.26% .
Asset quality in CCB book
The corporate loan book is well diversified with very low exposure to the distressed sectors
such as telecom (1.2%), power (1.9%), textile (1%) and CRE (1%). Bank does not have any
exposure towards 2G/3G spectrum. Also, with most of the book comprising of working
capital finance with marginal exposure to project finance companies and restructured book
also remaining at low levels, we believe that asset quality of CCB book remains strong and
delinquency levels from this book will be low.
Asset quality in CF book
Banks strong domain knowledge in vehicle financing and strong recoveries has enabled the
bank to maintain robust asset quality in this segment. With ~24% of the bank’s book
comprising CV segment (which tend to have higher delinquencies) and its plan to venture
into used CV market ( offering only to existing customers), we expect to see marginal uptick
in GNPL increasing from current level of 1.0% to 1.2% by FY14E .
Fee income contribution to
increase – aiding improvement in
ROA
Stringent risk management
practices coupled with aggressive
recoveries has led to
improvement in asset quality

13 Edelweiss Securities Limited
Indusind Bank
Chart 16: Segmental composition of GNPLs in CF book
0.0
1.0
2.0
3.0
4.0
5.0
CV Uitlity Const equip 3W 2W Cars
(%)
Q4FY11 Q4FY12
Source: Company
Chart 17: Marginal decline in asset quality due to increased focus on used vehicles
0.0
0.4
0.8
1.2
1.6
2.0
FY09 FY10 FY11 FY12 FY13E FY14E
(%)
GNPA NNPA
Source: Company, Edelweiss research
We have build in marginal uptick
in NPLs due to higher share of
used vehicles segment

14 Edelweiss Securities Limited
Banking and Financial Services
Financial outlook
We expect the bank to grow its net profit by 25% CAGR to INR12.6bn over FY12-14E. Key
driver for higher-than-industry earnings growth will be improving margins and faster than
balance sheet fee income growth which will offset some increase being built for provisioning
cost. Pre-provisioing profit growth is expected to trend higher, given strong operating
profitability .
Chart 18: Earning to post 25% CAGR over FY12-14E
18.0
47.6
77.2
106.8
136.4
166.0
1,186
3,985
6,784
9,582
12,381
15,180
FY09 FY10 FY11 FY12 FY13E FY14E
(%)
(IN
R m
n)
PAT PAT growth (RHS)
Source: Company, Edelweiss research
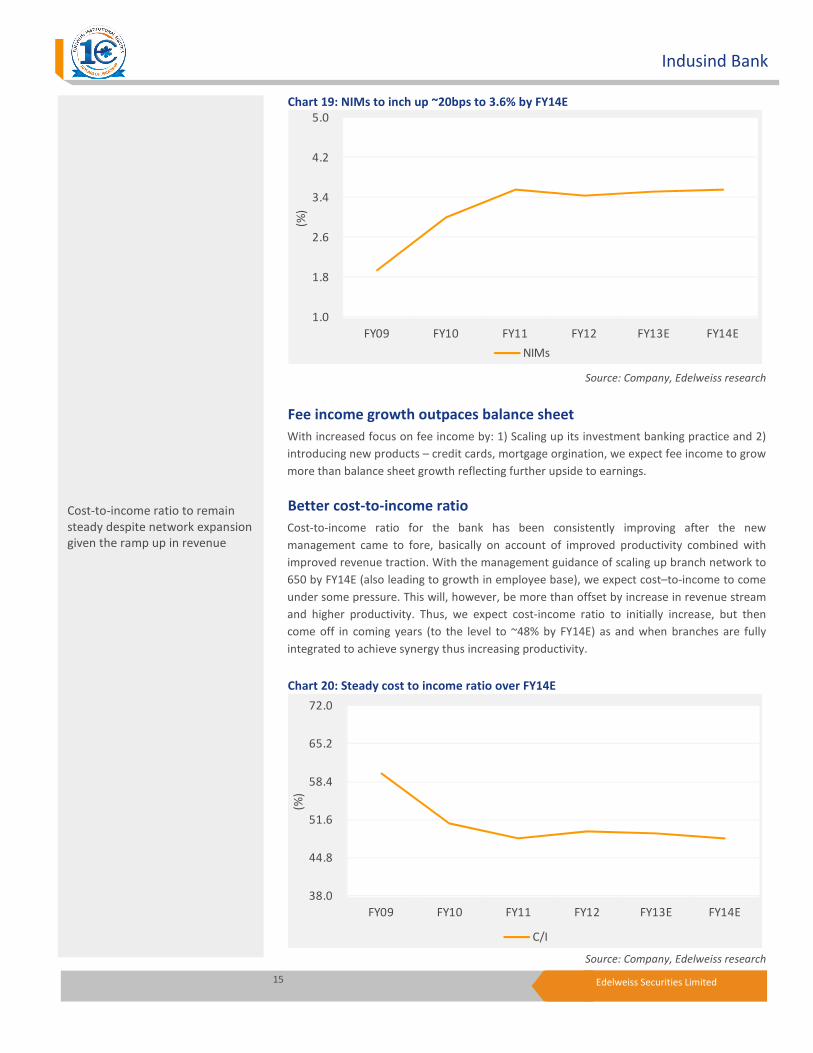
NIMs set to improve
Margins for the bank have been continuously improving, up from ~1.46% in FY08 to ~3.56%
in FY11.This can be attributed to rising share of CASA deposits from ~15% in FY08 to ~27% in
FY11, helping the bank to lower COF from 7.6% in FY08 to 5.9% in FY11. However, in FY12,
we saw margins coming off 21bps as cost of funds moved up, whereas lending yield was
restricted due to the fixed nature of the consumer finance book. Going forward, we expect
margins to improve 20bps to 3.6% (calculated) as multiple levers come to play: 1) CASA
moving up from current levels of 27% to 33% by FY14; 2) stable lending yield, despite
likelihood of borrowing cost coming down over next 2 years, due to fixed nature of the book;
3) increase in share of high yielding CV book offseting the rise in share of LAP (lower yield
compared with the overall CF book). Better NIMs, coupled with steady 20%+ earnings asset
growth, will ensure a robust ~25% CAGR in NII over FY12-14.
We expects NIMs to improve by
20 bps by FY14
15 Edelweiss Securities Limited
Indusind Bank
Chart 19: NIMs to inch up ~20bps to 3.6% by FY14E
1.0
1.8
2.6
3.4
4.2
5.0
FY09 FY10 FY11 FY12 FY13E FY14E
(%)
NIMs Source: Company, Edelweiss research
Fee income growth outpaces balance sheet
With increased focus on fee income by: 1) Scaling up its investment banking practice and 2)
introducing new products – credit cards, mortgage orgination, we expect fee income to grow
more than balance sheet growth reflecting further upside to earnings.
Better cost-to-income ratio
Cost-to-income ratio for the bank has been consistently improving after the new
management came to fore, basically on account of improved productivity combined with
improved revenue traction. With the management guidance of scaling up branch network to
650 by FY14E (also leading to growth in employee base), we expect cost–to-income to come
under some pressure. This will, however, be more than offset by increase in revenue stream
and higher productivity. Thus, we expect cost-income ratio to initially increase, but then
come off in coming years (to the level to ~48% by FY14E) as and when branches are fully
integrated to achieve synergy thus increasing productivity.
Chart 20: Steady cost to income ratio over FY14E
38.0
44.8
51.6
58.4
65.2
72.0
FY09 FY10 FY11 FY12 FY13E FY14E
(%)
C/I
Source: Company, Edelweiss research
Cost-to-income ratio to remain
steady despite network expansion
given the ramp up in revenue
16 Edelweiss Securities Limited
Banking and Financial Services
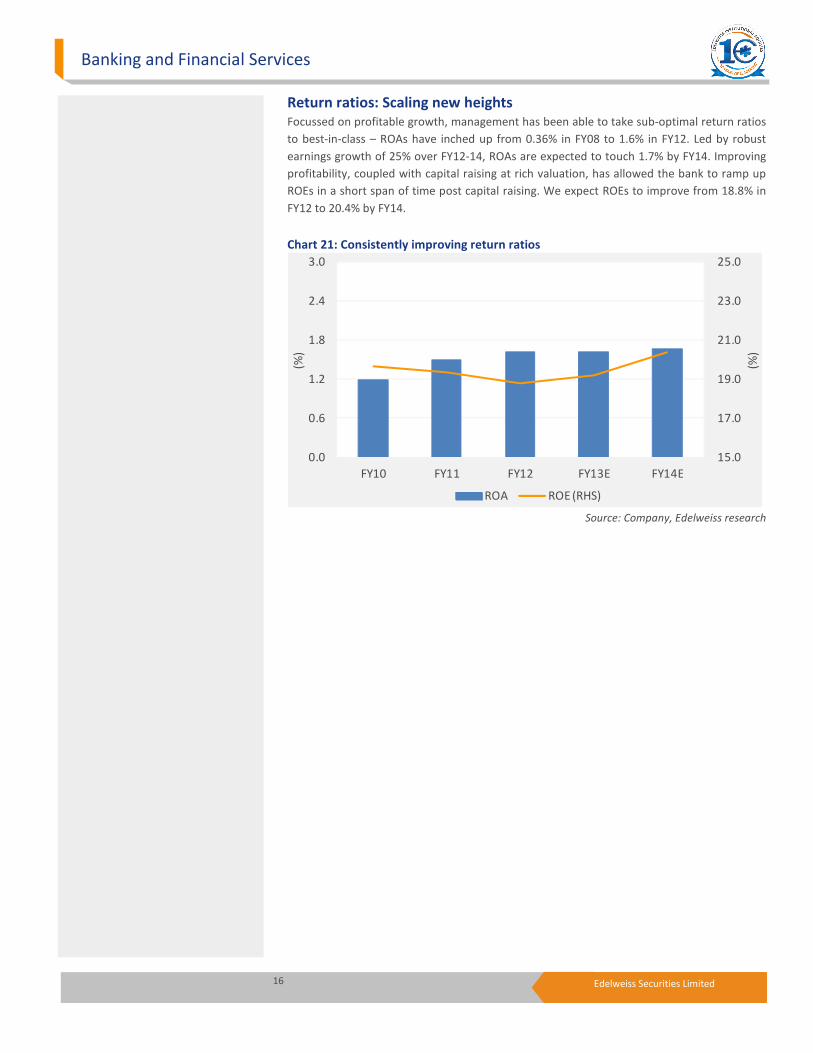
Return ratios: Scaling new heights
Focussed on profitable growth, management has been able to take sub-optimal return ratios
to best-in-class – ROAs have inched up from 0.36% in FY08 to 1.6% in FY12. Led by robust
earnings growth of 25% over FY12-14, ROAs are expected to touch 1.7% by FY14. Improving
profitability, coupled with capital raising at rich valuation, has allowed the bank to ramp up
ROEs in a short span of time post capital raising. We expect ROEs to improve from 18.8% in
FY12 to 20.4% by FY14.
Chart 21: Consistently improving return ratios
15.0
17.0
19.0
21.0
23.0
25.0
0.0
0.6
1.2
1.8
2.4
3.0
FY10 FY11 FY12 FY13E FY14E
(%)
(%)
ROA ROE (RHS) Source: Company, Edelweiss research
17 Edelweiss Securities Limited
Indusind Bank
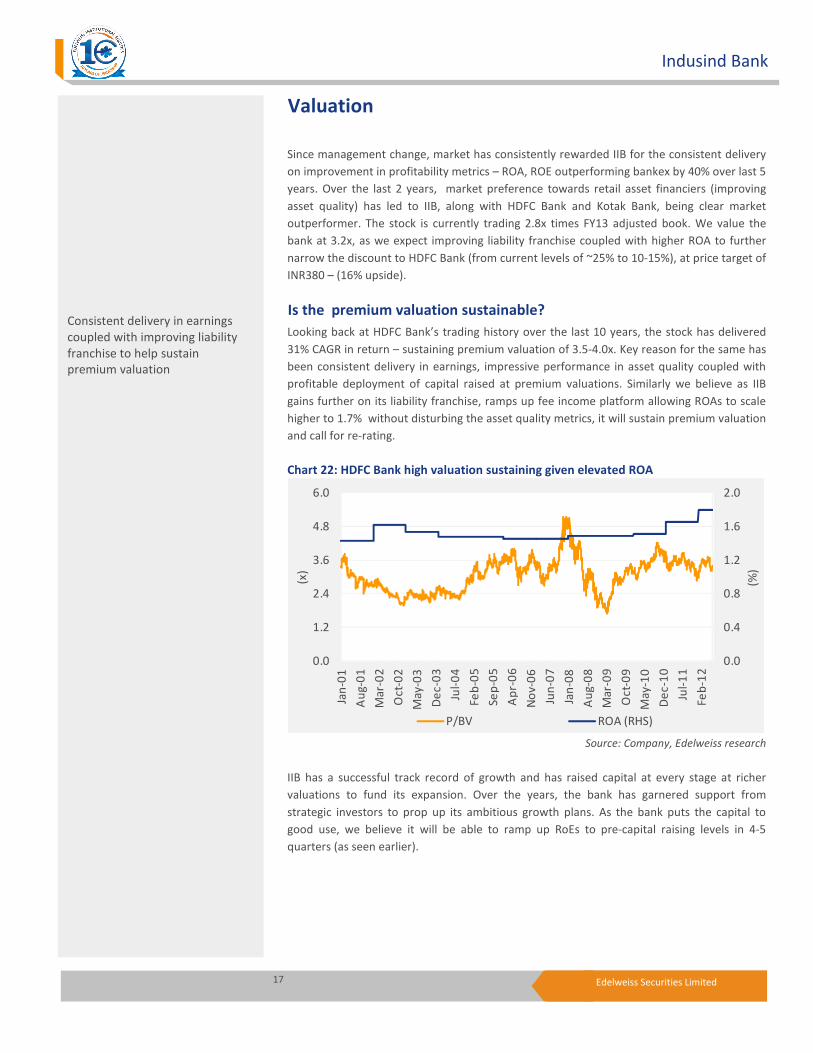
Valuation
Since management change, market has consistently rewarded IIB for the consistent delivery
on improvement in profitability metrics – ROA, ROE outperforming bankex by 40% over last 5
years. Over the last 2 years, market preference towards retail asset financiers (improving
asset quality) has led to IIB, along with HDFC Bank and Kotak Bank, being clear market
outperformer. The stock is currently trading 2.8x times FY13 adjusted book. We value the
bank at 3.2x, as we expect improving liability franchise coupled with higher ROA to further
narrow the discount to HDFC Bank (from current levels of ~25% to 10-15%), at price target of
INR380 – (16% upside).
Is the premium valuation sustainable?
Looking back at HDFC Bank’s trading history over the last 10 years, the stock has delivered
31% CAGR in return – sustaining premium valuation of 3.5-4.0x. Key reason for the same has
been consistent delivery in earnings, impressive performance in asset quality coupled with
profitable deployment of capital raised at premium valuations. Similarly we believe as IIB
gains further on its liability franchise, ramps up fee income platform allowing ROAs to scale
higher to 1.7% without disturbing the asset quality metrics, it will sustain premium valuation
and call for re-rating.
Chart 22: HDFC Bank high valuation sustaining given elevated ROA
0.0
0.4
0.8
1.2
1.6
2.0
0.0
1.2
2.4
3.6
4.8
6.0
Jan
-01
Au
g-0
1
Ma
r-0
2
Oc
t-0
2
Ma
y-0
3
De
c-0
3
Jul-
04
Fe
b-0
5
Se
p-0
5
Ap
r-0
6
No
v-0
6
Jun
-07
Jan
-08
Au
g-0
8
Ma
r-0
9
Oc
t-0
9
Ma
y-1
0
De
c-1
0
Jul-
11
Fe
b-1
2
(%)
(x)
P/BV ROA (RHS) Source: Company, Edelweiss research
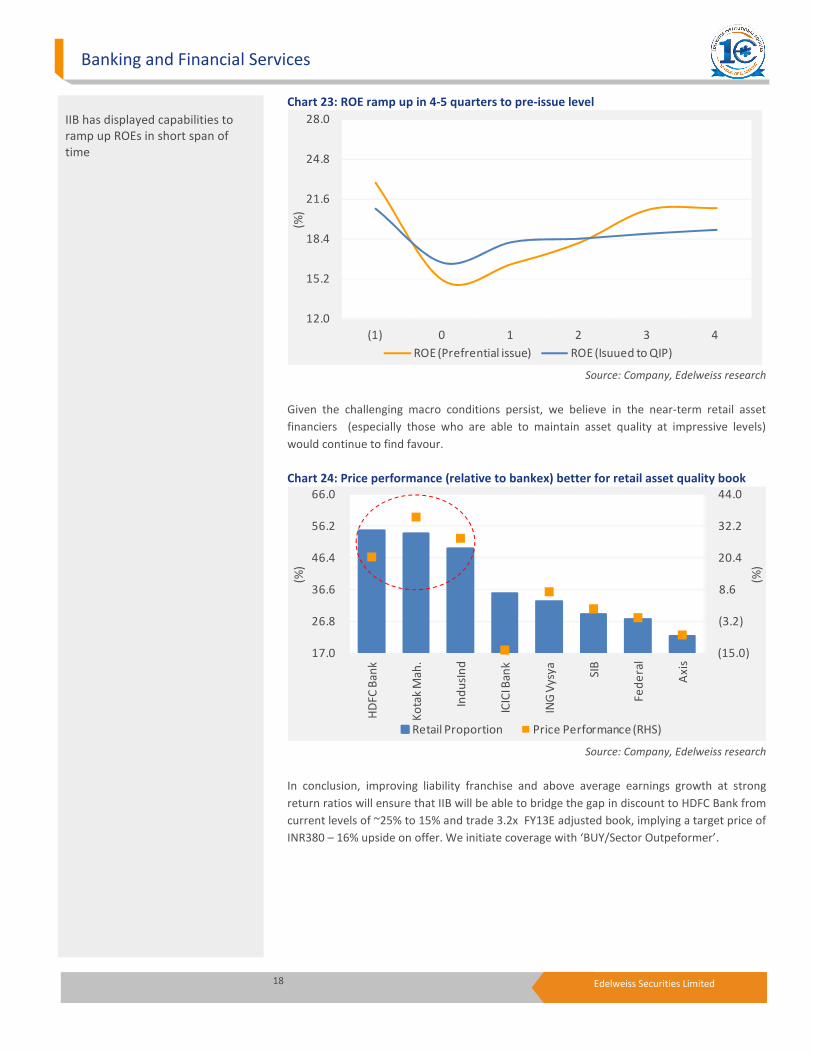
IIB has a successful track record of growth and has raised capital at every stage at richer
valuations to fund its expansion. Over the years, the bank has garnered support from
strategic investors to prop up its ambitious growth plans. As the bank puts the capital to
good use, we believe it will be able to ramp up RoEs to pre-capital raising levels in 4-5
quarters (as seen earlier).
Consistent delivery in earnings
coupled with improving liability
franchise to help sustain
premium valuation
18 Edelweiss Securities Limited
Banking and Financial Services
Chart 23: ROE ramp up in 4-5 quarters to pre-issue level
12.0
15.2
18.4
21.6
24.8
28.0
(1) 0 1 2 3 4
(%)
ROE (Prefrential issue) ROE (Isuued to QIP) Source: Company, Edelweiss research
Given the challenging macro conditions persist, we believe in the near-term retail asset
financiers (especially those who are able to maintain asset quality at impressive levels)
would continue to find favour.
Chart 24: Price performance (relative to bankex) better for retail asset quality book
(15.0)
(3.2)
8.6
20.4
32.2
44.0
17.0
26.8
36.6
46.4
56.2
66.0
HD
FC
Ba
nk
Ko
tak
Ma
h.
Ind
usI
nd
ICIC
I Ba
nk
ING
Vy
sya
SIB
Fe
de
ral
Ax
is
(%)
(%)
Retail Proportion Price Performance (RHS) Source: Company, Edelweiss research
In conclusion, improving liability franchise and above average earnings growth at strong
return ratios will ensure that IIB will be able to bridge the gap in discount to HDFC Bank from
current levels of ~25% to 15% and trade 3.2x FY13E adjusted book, implying a target price of
INR380 – 16% upside on offer. We initiate coverage with ‘BUY/Sector Outpeformer’.
IIB has displayed capabilities to
ramp up ROEs in short span of
time

19 Edelweiss Securities Limited
Indusind Bank
Chart 25: Discount to HDFC Bank dipping as difference in ROA is declining
0.0
0.3
0.5
0.8
1.0
1.3
0.0
18.0
36.0
54.0
72.0
90.0
Jan
-08
Ap
r-0
8
Jul-
08
Oc
t-0
8
Jan
-09
Ap
r-0
9
Jul-
09
Oc
t-0
9
Jan
-10
Ap
r-1
0
Jul-
10
Oc
t-1
0
Jan
-11
Ap
r-1
1
Jul-
11
Oc
t-1
1
Jan
-12
Ap
r-1
2
(%)
(%)
Discount to HDFC Bank ROA differential to HDFC Bank (RHS) Source: Company, Edelweiss research
Table 1: Valuation snapshot
Rating CMP Mcap EPS CAGR (%)
(INR) (USD bn) FY13E FY14E FY13E FY14E FY13E FY14E FY13E FY14E FY12-14E FY13E FY14E FY13E FY14E
Private Banks
Axis BUY 1,049 7.8 643 761 1.6 1.4 119 140 8.8 7.5 16.6 19.8 19.6 1.6 1.5
Federal BUY 431 1.3 353 414 1.2 1.0 51 64 8.5 6.8 18.5 14.3 16.0 1.4 1.5
HDFC Bank HOLD 539 22.8 147 174 3.7 3.1 26 33 20.7 16.2 22.8 19.9 20.5 1.9 2.0
ICICI Bank* BUY 659 17.2 513 569 1.3 1.2 66 77 10.0 8.6 16.8 12.0 12.8 1.6 1.7
ING Vysya BUY 343 0.9 266 320 1.3 1.1 34 43 10.0 8.0 18.4 11.5 13.9 1.1 1.1
South Indian HOLD 24 0.5 20 24 1.2 1.0 3 5 6.9 4.7 19.1 21.3 21.9 1.1 1.1
Yes BUY 345 2.2 163 201 2.1 1.7 35 43 9.8 8.1 24.5 22.2 23.5 1.6 1.5
IndusInd Bank BUY 328 2.8 118 141 2.8 2.3 21 27 15.5 12.2 25.1 19.2 20.4 1.6 1.7
Kotak REDUCE 574 7.7 192 220 3.0 2.6 26 31 22.0 18.6 18.3 14.8 15.2 2.4 2.4
ROA (%)ROE (%)Adj. BV P/ABV EPS (INR) P/E (x)
Source: Edelweiss research
Note: * Adjusted for subsidiaries
20 Edelweiss Securities Limited
Banking and Financial Services
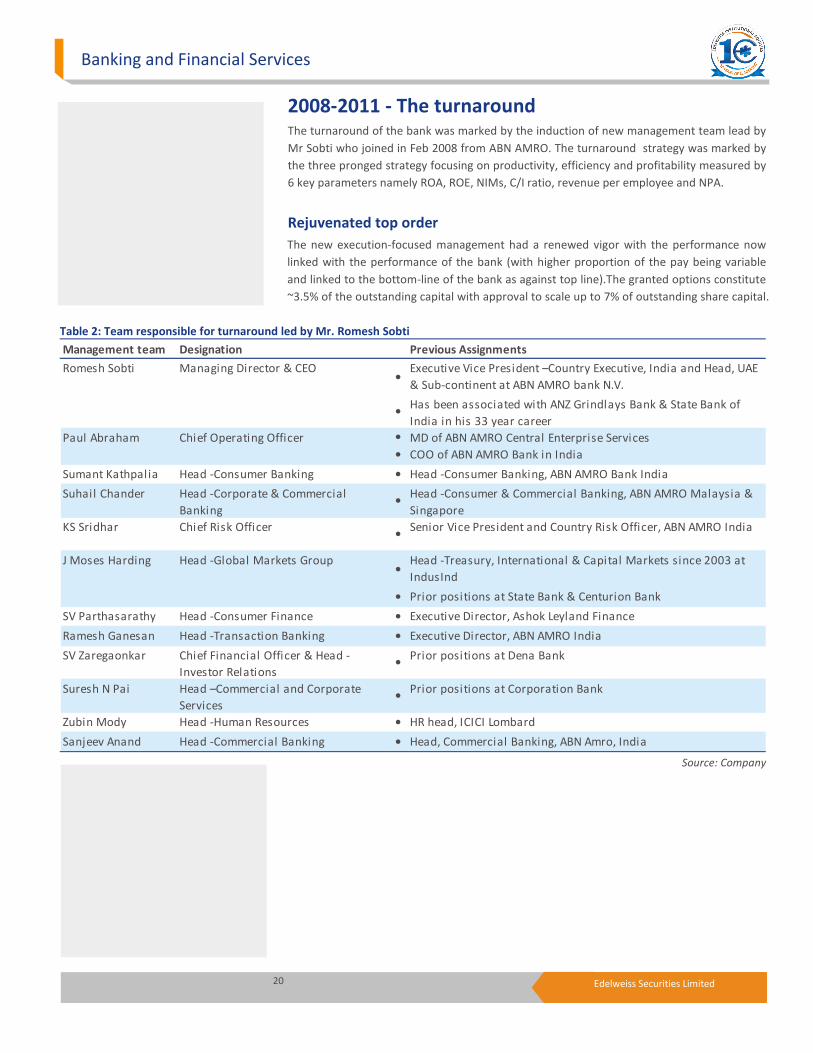
2008-2011 - The turnaround The turnaround of the bank was marked by the induction of new management team lead by
Mr Sobti who joined in Feb 2008 from ABN AMRO. The turnaround strategy was marked by
the three pronged strategy focusing on productivity, efficiency and profitability measured by
6 key parameters namely ROA, ROE, NIMs, C/I ratio, revenue per employee and NPA.
Rejuvenated top order
The new execution-focused management had a renewed vigor with the performance now
linked with the performance of the bank (with higher proportion of the pay being variable
and linked to the bottom-line of the bank as against top line).The granted options constitute
~3.5% of the outstanding capital with approval to scale up to 7% of outstanding share capital.
Table 2: Team responsible for turnaround led by Mr. Romesh Sobti
Management team Designation Previous Assignments
Romesh Sobti Managing Director & CEO�
Executive Vice President –Country Executive, India and Head, UAE
& Sub-continent at ABN AMRO bank N.V.
�Has been associated with ANZ Grindlays Bank & State Bank of
India in his 33 year career
Paul Abraham Chief Operating Officer � MD of ABN AMRO Central Enterprise Services
� COO of ABN AMRO Bank in India
Sumant Kathpalia Head -Consumer Banking � Head -Consumer Banking, ABN AMRO Bank India
Suhail Chander Head -Corporate & Commercial
Banking�
Head -Consumer & Commercial Banking, ABN AMRO Malaysia &
Singapore
KS Sridhar Chief Risk Officer�
Senior Vice President and Country Risk Officer, ABN AMRO India
J Moses Harding Head -Global Markets Group�
Head -Treasury, International & Capital Markets since 2003 at
IndusInd
� Prior positions at State Bank & Centurion Bank
SV Parthasarathy Head -Consumer Finance � Executive Director, Ashok Leyland Finance
Ramesh Ganesan Head -Transaction Banking � Executive Director, ABN AMRO India
SV Zaregaonkar Chief Financial Officer & Head -
Investor Relations�
Prior positions at Dena Bank
Suresh N Pai Head –Commercial and Corporate
Services�
Prior positions at Corporation Bank
Zubin Mody Head -Human Resources � HR head, ICICI Lombard
Sanjeev Anand Head -Commercial Banking � Head, Commercial Banking, ABN Amro, India
Source: Company
21 Edelweiss Securities Limited
Indusind Bank
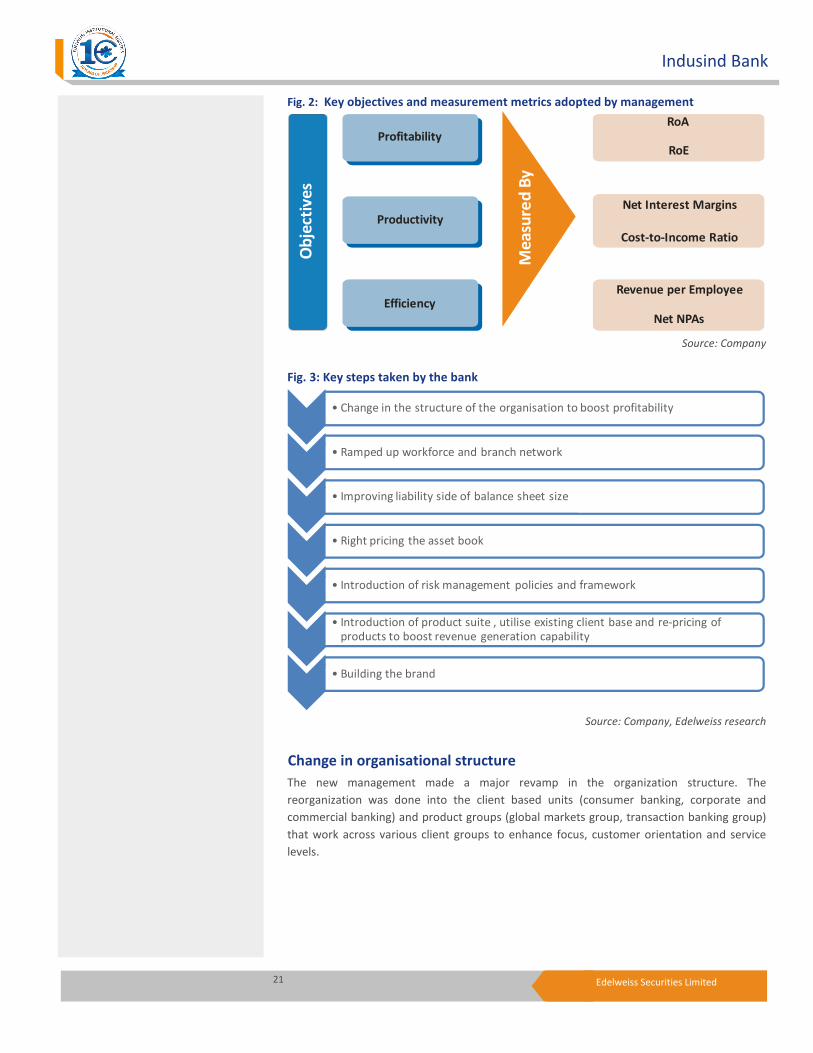
Fig. 2: Key objectives and measurement metrics adopted by management
Ob
ject
ive
s
Me
asu
red
By
ProfitabilityRoA
Productivity
Efficiency
RoE
Net Interest Margins
Cost-to-Income Ratio
Revenue per Employee
Net NPAs
Source: Company
Fig. 3: Key steps taken by the bank
• Change in the structure of the organisation to boost profitability
• Ramped up workforce and branch network
• Improving liability side of balance sheet size
• Right pricing the asset book
• Introduction of risk management policies and framework
• Introduction of product suite , utilise existing client base and re-pricing of
products to boost revenue generation capability
• Building the brand
Source: Company, Edelweiss research
Change in organisational structure
The new management made a major revamp in the organization structure. The
reorganization was done into the client based units (consumer banking, corporate and
commercial banking) and product groups (global markets group, transaction banking group)
that work across various client groups to enhance focus, customer orientation and service
levels.
22 Edelweiss Securities Limited
Banking and Financial Services
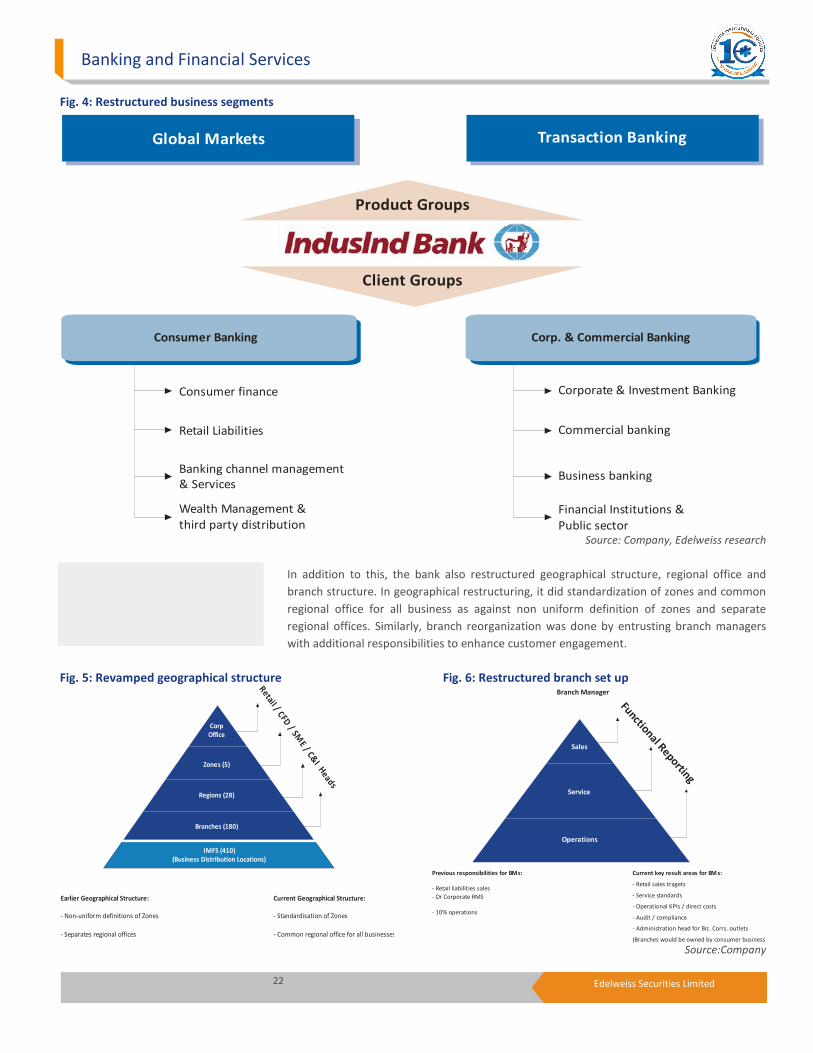
Fig. 4: Restructured business segments
Global Markets Transaction Banking
Consumer Banking Corp. & Commercial Banking
Consumer finance
Retail Liabilities
Banking channel management
& Services
Wealth Management &
third party distribution
Corporate & Investment Banking
Commercial banking
Business banking
Financial Institutions &
Public sector
Product Groups
Client Groups
Source: Company, Edelweiss research
In addition to this, the bank also restructured geographical structure, regional office and
branch structure. In geographical restructuring, it did standardization of zones and common
regional office for all business as against non uniform definition of zones and separate
regional offices. Similarly, branch reorganization was done by entrusting branch managers
with additional responsibilities to enhance customer engagement.
Fig. 5: Revamped geographical structure Fig. 6: Restructured branch set up
IMFS (410)
(Business Distribution Locations)
Branches (180)
Regions (28)
Zones (5)
Corp
Office
Retail / CFD / SM
E / C&I H
eads
Earlier Geographical Structure:
- Non-uniform definitions of Zones
- Separates regional offices
Current Geographical Structure:
- Standardisation of Zones
- Common regional office for all businesses
Source:Company
Operations
Service
Sales
Functional Reporting
Previous responsibilities for B s:M
- Retail liabilities sales
- Or Corporate RMS
- 10% operations
Current key result areas for B s:M
- Retail sales tragets
- Service standards
- Operational KPIs / direct costs
- Audit / compliance
- Administration head for Biz. Corrs. outlets
(Branches would be owned by consumer business)
Branch Manager

23 Edelweiss Securities Limited
Indusind Bank
Energising the workforce
The bank added new workforce especially on the client facing roles to match its business
expansion initiatives. Introduction of performance linked /variable pay in line with industry
best practices enabled the bank to attract talent with majority of the pool being drawn from
peer banks and foreign banks. As a result, number of employees increased significantly from
2869 in FY08 to 7008 in FY11.
Improving liability side of balance sheet
Building CASA
1) Launching of new product suite
2) Specialised team for CASA expansion
3) Focus on propriety and small business
4) Restructuring branch network
Realization of term deposits
Increased focus on below INR1.5mn
accounts
Broad basing wholesale deposits
Set up teams to tap corporative banks and PSUs to increase client base for such
deposits
Tenor mapping
Focus on well matched short term loans to mitigate this risk
Improving Liability side of Balance Sheet
Source: Company
Right-pricing the asset book
The new management adopted a strategy to rightly price its asset book by: 1) Differential
risk-based loan pricing for each customer segments; 2) increasing focus on small business
and mid corporate; 3) gaining strong traction in high yielding consumer finance division; 4)
churning old loans with new higher yielding loans; and 5) focusing on priority sector lending,
thereby achieving the RBI prescribed targets (thus, not having to invest in low-yield RIDF
bonds).
Revamping risk organisation
Asset quality has been key focus area for the new management across both corporate and
commercial banking book and consumer financing book. In CF book, the bank took
aggressive move to clean up the books, better risk management practices (has set up
centralized risk and strong risk management functions) and leveraged on its strong domain
knowledge (as a result of merger with ALFL). In addition to this vehicle loans were only
sourced by banks own branches and agents under IMFSL * (which has better knowledge of
customer profile and better collection efficiency) rather than through DSA route thus
improving the asset quality.
*Note IMFSL is IndusInd Marketing and Financial Services Limited

24 Edelweiss Securities Limited
Banking and Financial Services
Revenue generation capability
Prior to FY08 the banks poor profitability was due to low income generation capability. The
non interest income generation was also weak because of its limited product suite. This
prompted management to broaden the fee income base and increase its contribution to
bank’s bottom-line. The new management under took several steps to build its capabilities in
corporate and investment banking space and in the fee based product space.
Fig. 7: Steps taken to enhance revenue generation capabilities
New product group to
increse the product suite
• Introduction of two
groups
• Transaction banking
• Cash Management
• Trade and Financing
• Supply Chain Financing
• Global Remitances
• Commodity
Financing
• Global Market Group
• Corporate Forex
• Propriety Trading
• Money and Capital Market services
Leveraging the existing
customer base
• Focus on cross selling
of products
• Use of relationship manager and managed
sales to increase
customer engagement
• Enhanced loan
processing charges and fee from transactional
services
Improved pricing power
• Realignment of pricing
of its basic products
• Demand drafts
• Lockers
• Increased focus on building momentum in
third party sales
• Insurance
• Mutual funds
Source: Company
Branding
Fig. 8: Campaigns launched in various media to increase brand visibility
Source: Company
25 Edelweiss Securities Limited
Indusind Bank
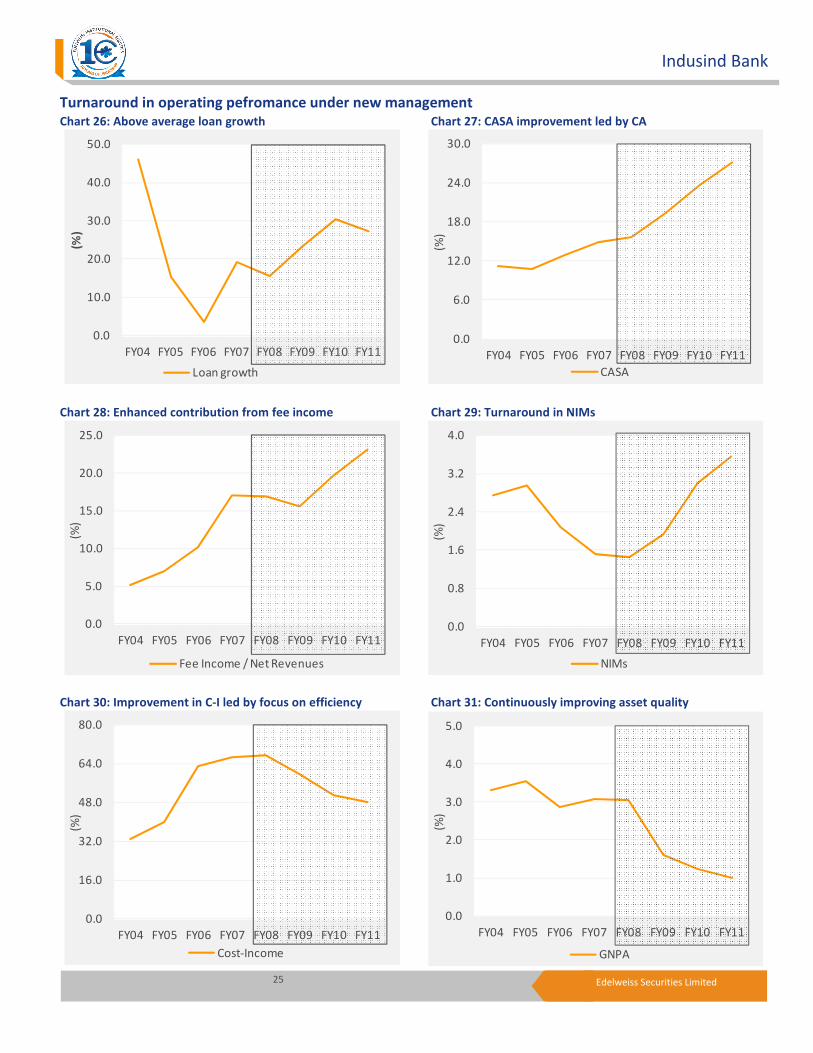
Turnaround in operating pefromance under new management
Chart 26: Above average loan growth Chart 27: CASA improvement led by CA
0.0
10.0
20.0
30.0
40.0
50.0
FY04 FY05 FY06 FY07 FY08 FY09 FY10 FY11
(%)
Loan growth Chart 28: Enhanced contribution from fee income Chart 29: Turnaround in NIMs
0.0
5.0
10.0
15.0
20.0
25.0
FY04 FY05 FY06 FY07 FY08 FY09 FY10 FY11
(%)
Fee Income / Net Revenues
Chart 30: Improvement in C-I led by focus on efficiency Chart 31: Continuously improving asset quality
0.0
16.0
32.0
48.0
64.0
80.0
FY04 FY05 FY06 FY07 FY08 FY09 FY10 FY11
(%)
Cost-Income
0.0
6.0
12.0
18.0
24.0
30.0
FY04 FY05 FY06 FY07 FY08 FY09 FY10 FY11
(%)
CASA
0.0
0.8
1.6
2.4
3.2
4.0
FY04 FY05 FY06 FY07 FY08 FY09 FY10 FY11
(%)
NIMs
0.0
1.0
2.0
3.0
4.0
5.0
FY04 FY05 FY06 FY07 FY08 FY09 FY10 FY11
(%)
GNPA
26 Edelweiss Securities Limited
Banking and Financial Services
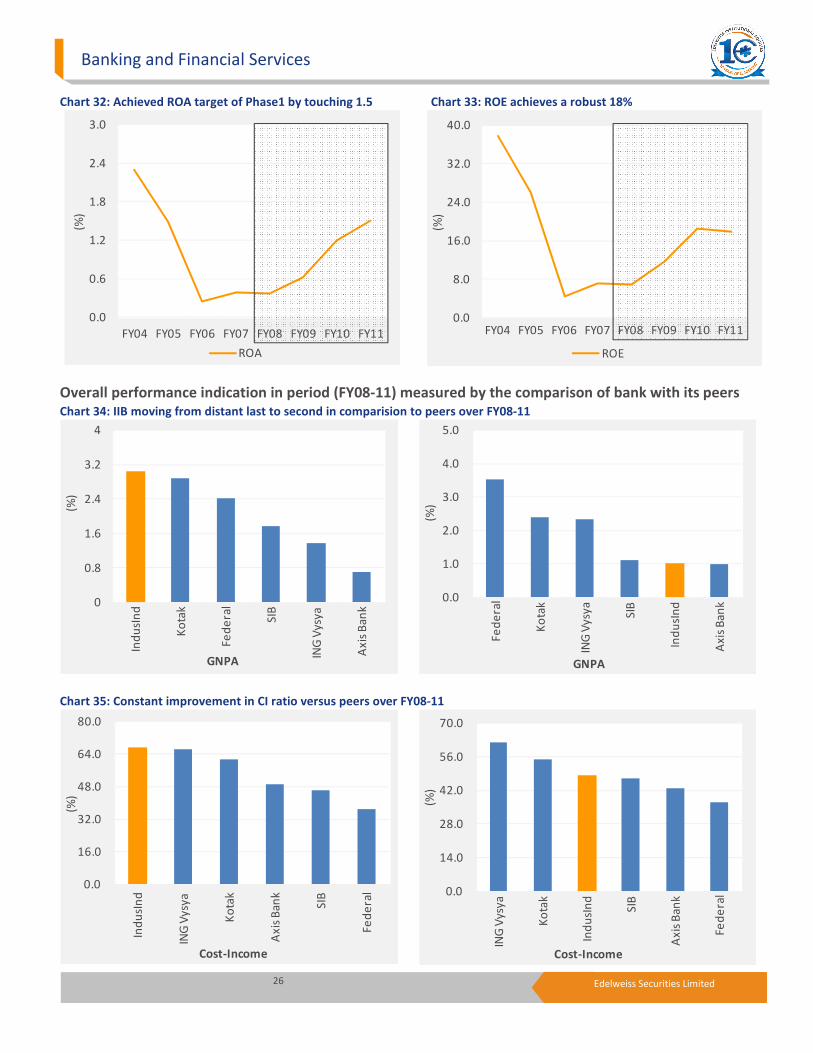
Chart 32: Achieved ROA target of Phase1 by touching 1.5 Chart 33: ROE achieves a robust 18%
0.0
0.6
1.2
1.8
2.4
3.0
FY04 FY05 FY06 FY07 FY08 FY09 FY10 FY11
(%)
ROA
Overall performance indication in period (FY08-11) measured by the comparison of bank with its peers Chart 34: IIB moving from distant last to second in comparision to peers over FY08-11
0
0.8
1.6
2.4
3.2
4
Ind
usI
nd
Ko
tak
Fe
de
ral
SIB
ING
Vy
sya
Ax
is B
an
k
(%)
GNPA
Chart 35: Constant improvement in CI ratio versus peers over FY08-11
0.0
16.0
32.0
48.0
64.0
80.0
Ind
usI
nd
ING
Vy
sya
Ko
tak
Ax
is B
an
k
SIB
Fe
de
ral
(%)
Cost-Income
0.0
1.0
2.0
3.0
4.0
5.0
Fe
de
ral
Ko
tak
ING
Vy
sya
SIB
Ind
usI
nd
Ax
is B
an
k
(%)
GNPA
0.0
14.0
28.0
42.0
56.0
70.0
ING
Vy
sya
Ko
tak
Ind
usI
nd
SIB
Ax
is B
an
k
Fe
de
ral
(%)
Cost-Income
0.0
8.0
16.0
24.0
32.0
40.0
FY04 FY05 FY06 FY07 FY08 FY09 FY10 FY11
(%)
ROE
27 Edelweiss Securities Limited
Indusind Bank
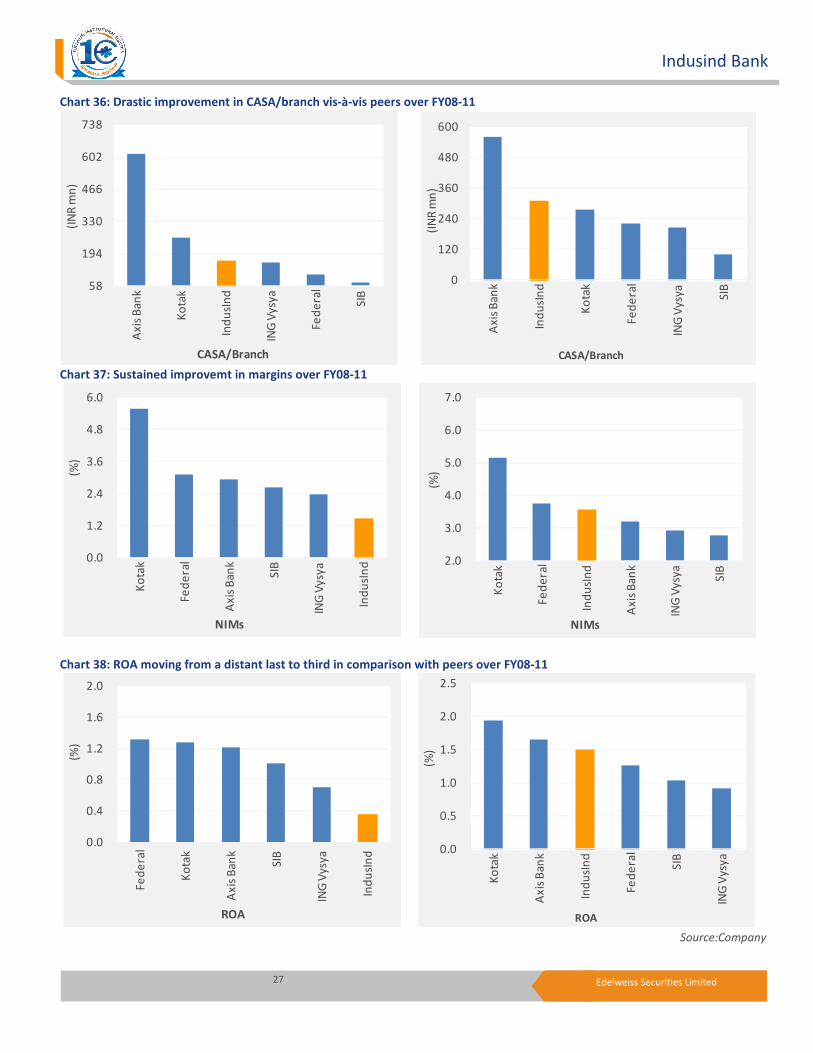
Chart 36: Drastic improvement in CASA/branch vis-à-vis peers over FY08-11
58
194
330
466
602
738A
xis
Ba
nk
Ko
tak
Ind
usI
nd
ING
Vy
sya
Fe
de
ral
SIB
(IN
R m
n)
CASA/Branch
Chart 37: Sustained improvemt in margins over FY08-11
0.0
1.2
2.4
3.6
4.8
6.0
Ko
tak
Fe
de
ral
Ax
is B
an
k
SIB
ING
Vy
sya
Ind
usI
nd
(%)
NIMs
Chart 38: ROA moving from a distant last to third in comparison with peers over FY08-11
0.0
0.4
0.8
1.2
1.6
2.0
Fe
de
ral
Ko
tak
Ax
is B
an
k
SIB
ING
Vy
sya
Ind
usI
nd
(%)
ROA
Source:Company
0
120
240
360
480
600
Ax
is B
an
k
Ind
usI
nd
Ko
tak
Fe
de
ral
ING
Vy
sya
SIB
(IN
R m
n)
CASA/Branch
2.0
3.0
4.0
5.0
6.0
7.0
Ko
tak
Fe
de
ral
Ind
usI
nd
Ax
is B
an
k
ING
Vy
sya
SIB
(%)
NIMs
0.0
0.5
1.0
1.5
2.0
2.5
Ko
tak
Ax
is B
an
k
Ind
usI
nd
Fe
de
ral
SIB
ING
Vy
sya
(%)
ROA
28 Edelweiss Securities Limited
Banking and Financial Services
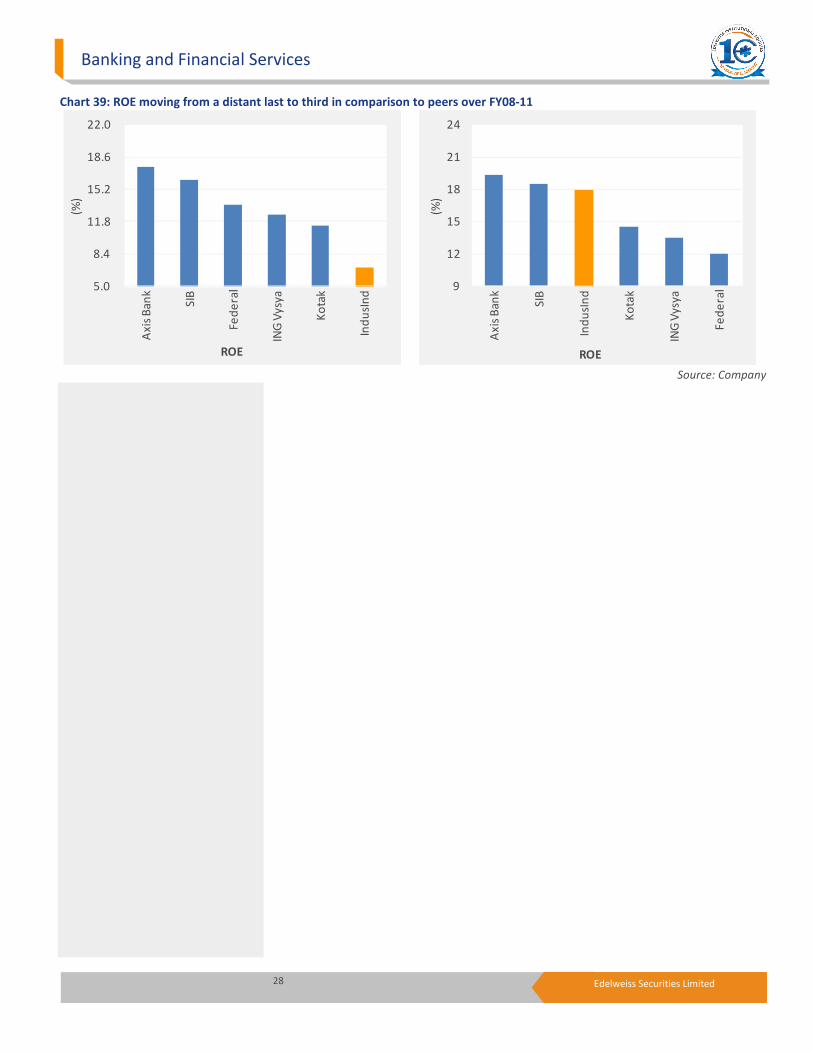
Chart 39: ROE moving from a distant last to third in comparison to peers over FY08-11
5.0
8.4
11.8
15.2
18.6
22.0
Ax
is B
an
k
SIB
Fe
de
ral
ING
Vy
sya
Ko
tak
Ind
usI
nd
(%)
ROE
Source: Company
9
12
15
18
21
24
Ax
is B
an
k
SIB
Ind
usI
nd
Ko
tak
ING
Vy
sya
Fe
de
ral
(%)
ROE
29 Edelweiss Securities Limited
Indusind Bank
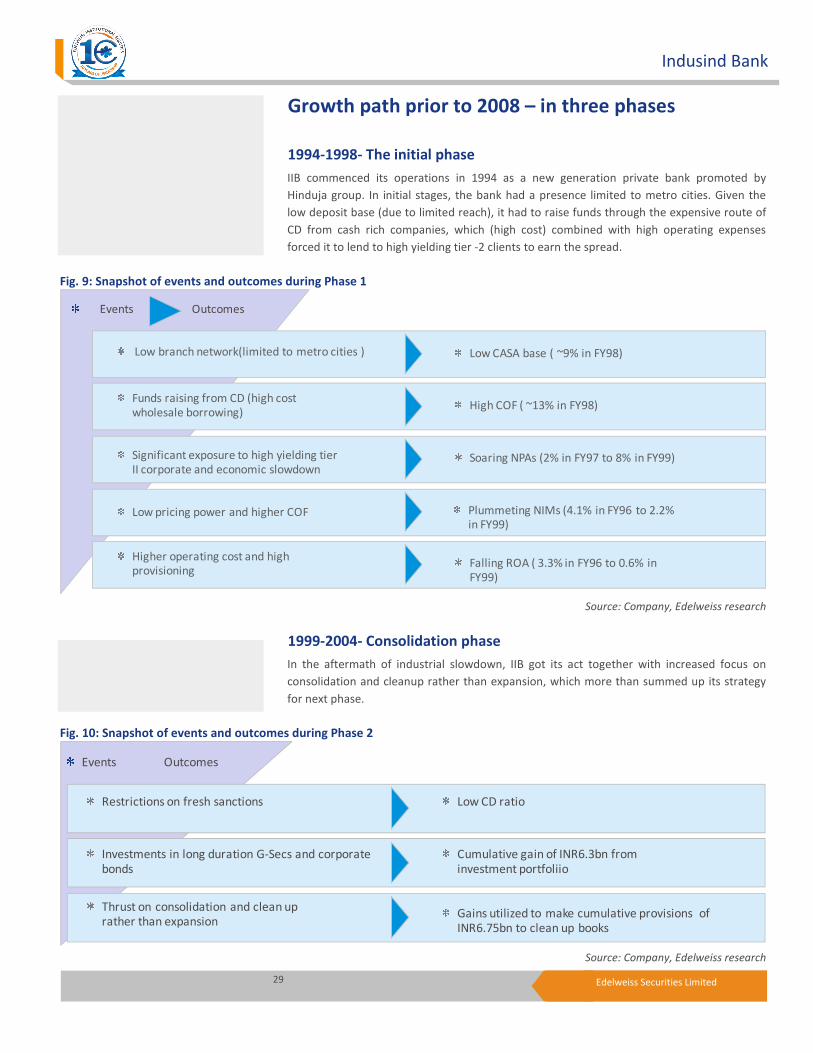
Growth path prior to 2008 – in three phases
1994-1998- The initial phase
IIB commenced its operations in 1994 as a new generation private bank promoted by
Hinduja group. In initial stages, the bank had a presence limited to metro cities. Given the
low deposit base (due to limited reach), it had to raise funds through the expensive route of
CD from cash rich companies, which (high cost) combined with high operating expenses
forced it to lend to high yielding tier -2 clients to earn the spread.
Fig. 9: Snapshot of events and outcomes during Phase 1
Events Outcomes
Low branch network(limited to metro cities )
Funds raising from CD (high cost
wholesale borrowing)
Significant exposure to high yielding tier
II corporate and economic slowdown
Low pricing power and higher COF
Higher operating cost and high
provisioning
Low CASA base ( ~9% in FY98)
High COF ( ~13% in FY98)
Soaring NPAs (2% in FY97 to 8% in FY99)
Plummeting NIMs (4.1% in FY96 to 2.2%
in FY99)
Falling ROA ( 3.3% in FY96 to 0.6% in
FY99)
Source: Company, Edelweiss research
1999-2004- Consolidation phase
In the aftermath of industrial slowdown, IIB got its act together with increased focus on
consolidation and cleanup rather than expansion, which more than summed up its strategy
for next phase.
Fig. 10: Snapshot of events and outcomes during Phase 2
Events Outcomes
Restrictions on fresh sanctions
Investments in long duration G-Secs and corporate
bonds
Thrust on consolidation and clean up rather than expansion
Low CD ratio
Cumulative gain of INR6.3bn from
investment portfoliio
Gains utilized to make cumulative provisions of INR6.75bn to clean up books
Source: Company, Edelweiss research
30 Edelweiss Securities Limited
Banking and Financial Services
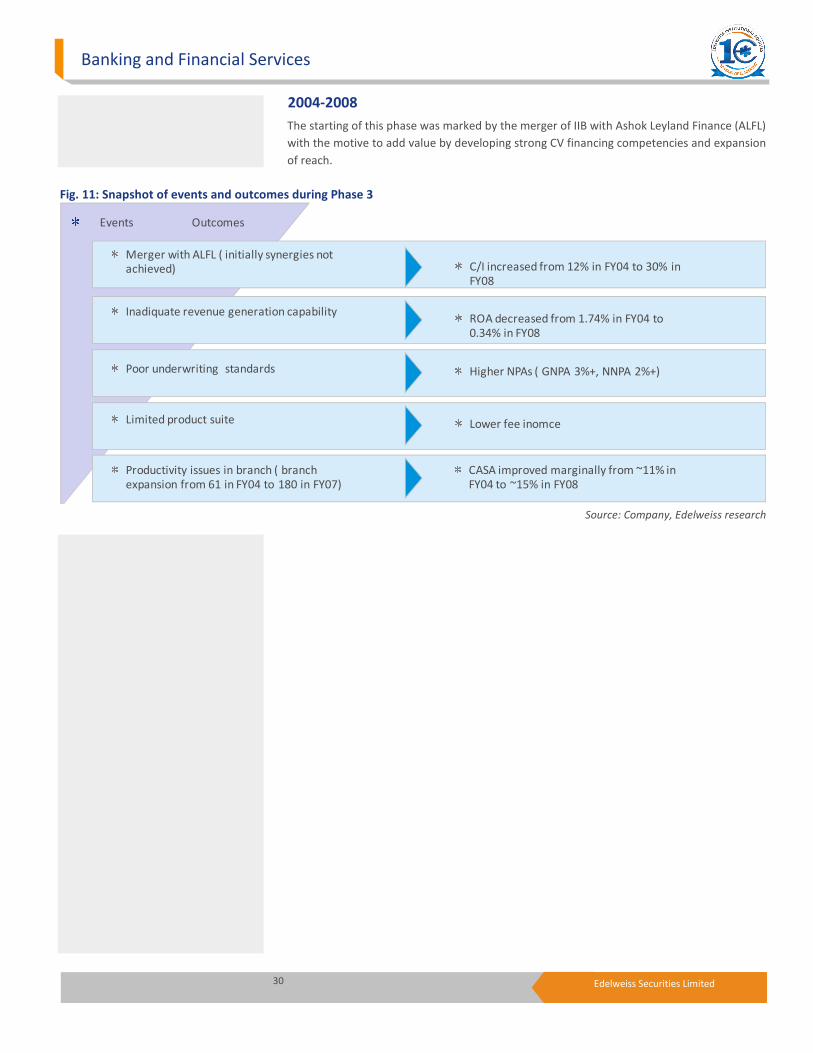
2004-2008
The starting of this phase was marked by the merger of IIB with Ashok Leyland Finance (ALFL)
with the motive to add value by developing strong CV financing competencies and expansion
of reach.
Fig. 11: Snapshot of events and outcomes during Phase 3
Events Outcomes
Merger with ALFL ( initially synergies not
achieved)
Inadiquate revenue generation capability
Poor underwriting standards
Limited product suite
Productivity issues in branch ( branch
expansion from 61 in FY04 to 180 in FY07)
C/I increased from 12% in FY04 to 30% in
FY08
ROA decreased from 1.74% in FY04 to
0.34% in FY08
Higher NPAs ( GNPA 3%+, NNPA 2%+)
Lower fee inomce
CASA improved marginally from ~11% in
FY04 to ~15% in FY08
Source: Company, Edelweiss research
31 Edelweiss Securities Limited
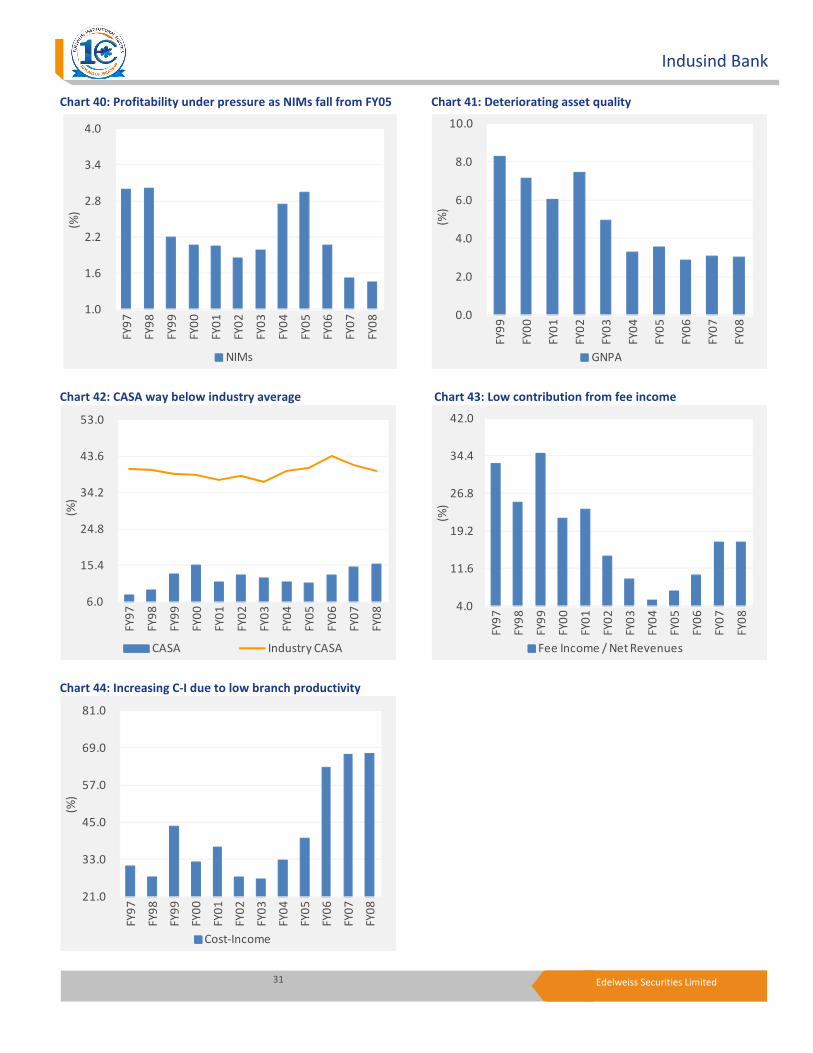
Indusind Bank
Chart 40: Profitability under pressure as NIMs fall from FY05 Chart 41: Deteriorating asset quality
1.0
1.6
2.2
2.8
3.4
4.0 F
Y9
7
FY
98
FY
99
FY
00
FY
01
FY
02
FY
03
FY
04
FY
05
FY
06
FY
07
FY
08
(%)
NIMs Chart 42: CASA way below industry average Chart 43: Low contribution from fee income
6.0
15.4
24.8
34.2
43.6
53.0
FY
97
FY
98
FY
99
FY
00
FY
01
FY
02
FY
03
FY
04
FY
05
FY
06
FY
07
FY
08
(%)
CASA Industry CASA Chart 44: Increasing C-I due to low branch productivity
21.0
33.0
45.0
57.0
69.0
81.0
FY
97
FY
98
FY
99
FY
00
FY
01
FY
02
FY
03
FY
04
FY
05
FY
06
FY
07
FY
08
(%)
Cost-Income
0.0
2.0
4.0
6.0
8.0
10.0
FY
99
FY
00
FY
01
FY
02
FY
03
FY
04
FY
05
FY
06
FY
07
FY
08
(%)
GNPA
4.0
11.6
19.2
26.8
34.4
42.0
FY
97
FY
98
FY
99
FY
00
FY
01
FY
02
FY
03
FY
04
FY
05
FY
06
FY
07
FY
08
(%)
Fee Income / Net Revenues
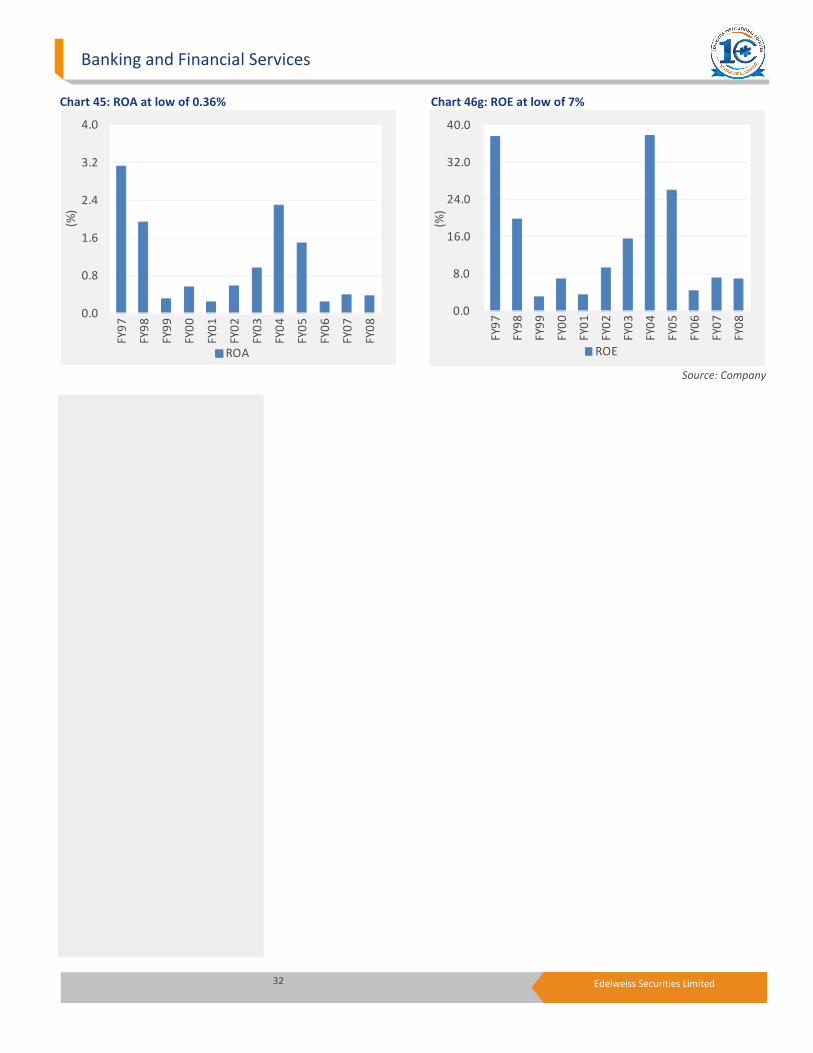
32 Edelweiss Securities Limited
Banking and Financial Services
Chart 45: ROA at low of 0.36% Chart 46g: ROE at low of 7%
0.0
0.8
1.6
2.4
3.2
4.0F
Y9
7
FY
98
FY
99
FY
00
FY
01
FY
02
FY
03
FY
04
FY
05
FY
06
FY
07
FY
08
(%)
ROA Source: Company
0.0
8.0
16.0
24.0
32.0
40.0
FY
97
FY
98
FY
99
FY
00
FY
01
FY
02
FY
03
FY
04
FY
05
FY
06
FY
07
FY
08
(%)
ROE
33 Edelweiss Securities Limited
Indusind Bank
Company description
IndusInd Bank (IIB) derives its name and inspiration from the Indus Valley civilization.
The Bank, formally inaugurated in April 1994 by Dr. Manmohan Singh, now the Prime
Minister of India and then the Finance Minister, started with a capital base of INR1000mn
(USD32mn at the prevailing exchange rate), of which INR600mn was raised through private
placement from Indian Residents while the balance INR400mn (USD13 mn) was contributed
by Non-Resident Indians.The bank was promoted by the Hinduja group
The bank caters to the needs of both consumer and corporate customers. It has a robust
technology platform supporting multi-channel delivery capabilities. IndusInd Bank has 400
branches, and 674 ATMs spread across 254 geographic locations of the country .The Bank
also has 2 Representative offices, one each in London and Dubai.
The bank believes in driving its business through technology. It has multi-lateral tie-ups with
other banks providing access to their ATMs for its customers. It enjoys clearing bank status
for both major stock exchanges - BSE and NSE - and three major commodity exchanges in the
country - MCX, NCDEX, and NMCE. It also offers DP facilities for stock and commodity
segments. The Bank has been bestowed with the mandate of being a Settlement Banker for
six tea auction centres
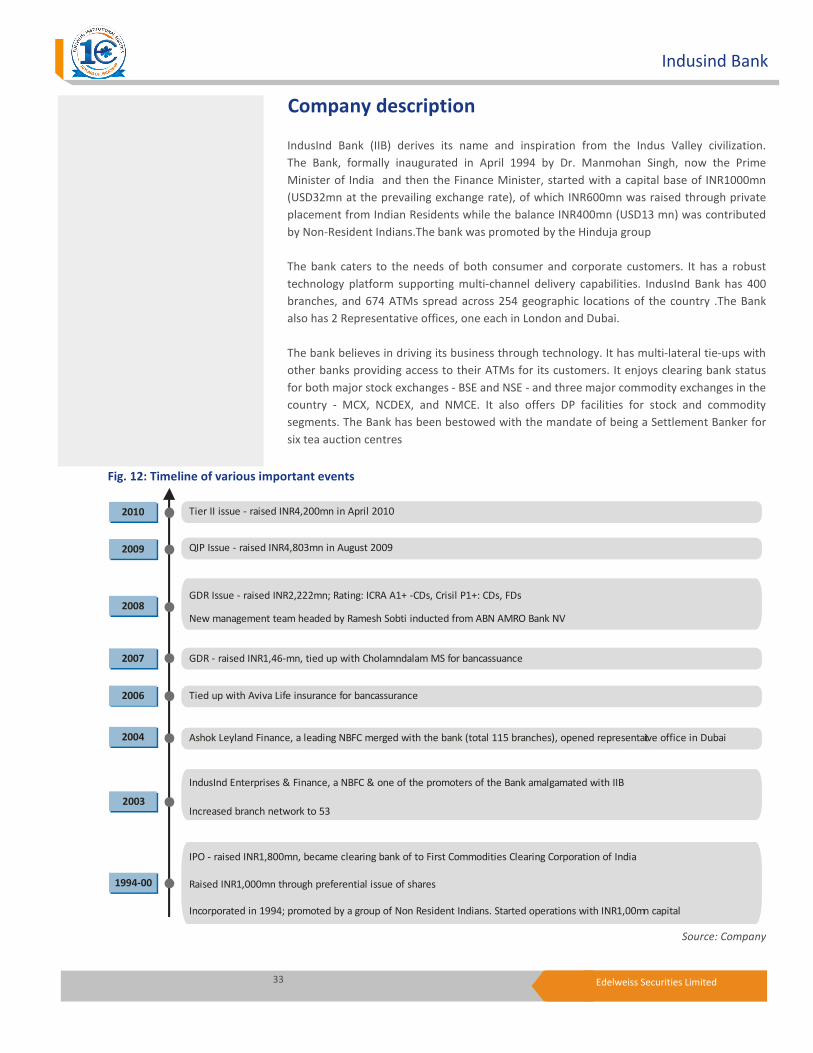
Fig. 12: Timeline of various important events
Tier II issue - raised INR4,200mn in April 2010
QIP Issue - raised INR4,803mn in August 2009
GDR Issue - raised INR2,222mn; Rating: ICRA A1+ -CDs, Crisil P1+: CDs, FDs
New management team headed by Ramesh Sobti inducted from ABN AMRO Bank NV
GDR - raised INR1,46-mn, tied up with Cholamndalam MS for bancassuance
Tied up with Aviva Life insurance for bancassurance
Ashok Leyland Finance, a leading NBFC merged with the bank (total 115 branches), opened representative office in Dubai
IndusInd Enterprises & Finance, a NBFC & one of the promoters of the Bank amalgamated with IIB
Increased branch network to 53
IPO - raised INR1,800mn, became clearing bank of to First Commodities Clearing Corporation of India
Raised INR1,000mn through preferential issue of shares
Incorporated in 1994; promoted by a group of Non Resident Indians. Started operations with INR1,00mn capital
2010
2009
2008
2007
2006
2004
2003
1994-00
Source: Company
34 Edelweiss Securities Limited
Banking and Financial Services
Keys risks
� The bank plans to achieve the desired CASA growth by expanding its branch network
from a current level of 400 branches to 650 branches by FY14E. Risk emanates from the
fact that if the bank is not able to achieve the desired level of integration among
branches then cost may shoot up.
• A major risk that the bank is facing is human capital risk. With most of the core team
members coming from ABN, a unique concentration of employees have been created.
Thus, when Mr Romesh Sobti leaves or retires and if this team also moves away for
some reason, there is risk of a huge human capital crunch situation.
• The promoter stake in the bank is currently high at ~20% and needs to be pruned down
to 10% by December 2012 (RBI directive). This poses dilution risk for the bank.
35 Edelweiss Securities Limited
Indusind Bank
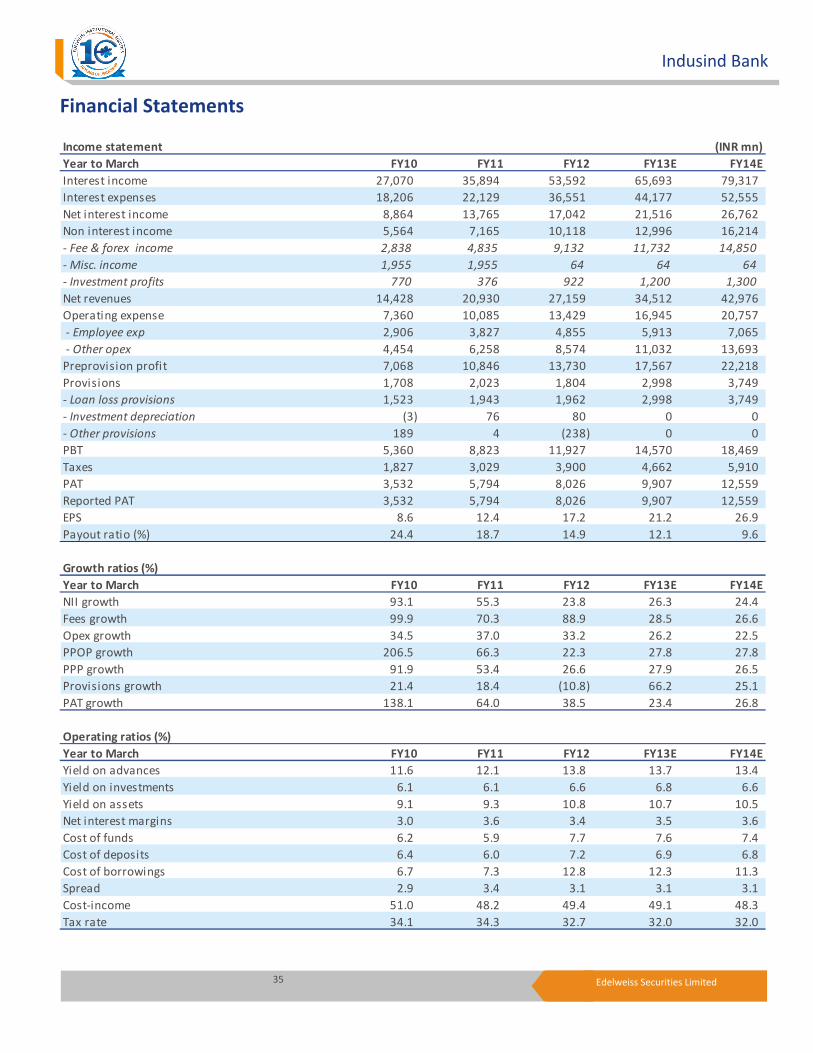
Financial Statements Income statement (INR mn)
Year to March FY10 FY11 FY12 FY13E FY14E
Interest income 27,070 35,894 53,592 65,693 79,317
Interest expenses 18,206 22,129 36,551 44,177 52,555
Net interest income 8,864 13,765 17,042 21,516 26,762
Non interest income 5,564 7,165 10,118 12,996 16,214
- Fee & forex income 2,838 4,835 9,132 11,732 14,850
- Misc. income 1,955 1,955 64 64 64
- Investment profits 770 376 922 1,200 1,300
Net revenues 14,428 20,930 27,159 34,512 42,976
Operating expense 7,360 10,085 13,429 16,945 20,757
- Employee exp 2,906 3,827 4,855 5,913 7,065
- Other opex 4,454 6,258 8,574 11,032 13,693
Preprovision profit 7,068 10,846 13,730 17,567 22,218
Provisions 1,708 2,023 1,804 2,998 3,749
- Loan loss provisions 1,523 1,943 1,962 2,998 3,749
- Investment depreciation (3) 76 80 0 0
- Other provisions 189 4 (238) 0 0
PBT 5,360 8,823 11,927 14,570 18,469
Taxes 1,827 3,029 3,900 4,662 5,910
PAT 3,532 5,794 8,026 9,907 12,559
Reported PAT 3,532 5,794 8,026 9,907 12,559
EPS 8.6 12.4 17.2 21.2 26.9
Payout ratio (%) 24.4 18.7 14.9 12.1 9.6
Growth ratios (%)
Year to March FY10 FY11 FY12 FY13E FY14E
NII growth 93.1 55.3 23.8 26.3 24.4
Fees growth 99.9 70.3 88.9 28.5 26.6
Opex growth 34.5 37.0 33.2 26.2 22.5
PPOP growth 206.5 66.3 22.3 27.8 27.8
PPP growth 91.9 53.4 26.6 27.9 26.5
Provisions growth 21.4 18.4 (10.8) 66.2 25.1
PAT growth 138.1 64.0 38.5 23.4 26.8
Operating ratios (%)
Year to March FY10 FY11 FY12 FY13E FY14E
Yield on advances 11.6 12.1 13.8 13.7 13.4
Yield on investments 6.1 6.1 6.6 6.8 6.6
Yield on assets 9.1 9.3 10.8 10.7 10.5
Net interest margins 3.0 3.6 3.4 3.5 3.6
Cost of funds 6.2 5.9 7.7 7.6 7.4
Cost of deposits 6.4 6.0 7.2 6.9 6.8
Cost of borrowings 6.7 7.3 12.8 12.3 11.3
Spread 2.9 3.4 3.1 3.1 3.1
Cost-income 51.0 48.2 49.4 49.1 48.3
Tax rate 34.1 34.3 32.7 32.0 32.0

36 Edelweiss Securities Limited
Banking and Financial Services
Balance sheet (INR mn)
Year to March FY10 FY11 FY12E FY13E FY14E
Liabilities
Equity capital 4,107 4,660 4,677 4,677 4,677
Reserves 17,550 33,589 42,631 51,338 62,697
Net worth 21,656 38,249 47,308 56,015 67,374
Sub bonds/pref cap 0 0 600 1,100 1,600
Deposits 267,102 343,654 423,616 518,931 639,849
Borrowings 49,343 55,254 86,220 103,853 129,771
Other l iabil ities 13,278 17,496 18,108 11,551 14,274
Total 351,379 454,652 575,851 691,450 852,868
Assets
Loans 205,506 261,657 350,640 438,299 547,874
Gilts 85,251 100,219 99,876 124,557 153,924
Others 18,768 35,290 45,844 50,577 55,832
Cash & equi 26,032 40,246 55,396 59,627 73,567
Fixed assets 4,132 3,711 6,459 7,139 7,767
Other assets 11,691 13,531 17,638 11,251 13,903
Total 351,379 454,652 575,851 691,450 852,868
Balance sheet ratios (%)
Credit growth 30.3 27.7 34.0 25.0 25.0
Deposit growth 20.8 28.7 23.3 22.5 23.3
EA growth 30.2 30.4 26.1 22.0 23.5
SLR ratio 26.9 25.1 19.6 20.0 20.0
C-D ratio 77.0 76.4 83.1 84.8 85.9
Low-cost deposits 23.7 27.2 27.3 31.0 33.0
Gross NPA ratio 1.2 1.0 1.0 1.1 1.2
Net NPA ratio 0.5 0.3 0.3 0.3 0.3
Provision coverage 60.1 72.6 72.7 72.5 72.0
Incremental sl ippage 1.4 0.9 1.4 1.5 1.5
Net NPA / Equity 4.7 1.9 2.0 2.4 2.8
Capital adequacy 15.3 15.9 13.9 13.4 12.9
- Tier 1 9.7 12.3 11.4 10.9 10.4
Book value 52.7 82.1 101.1 119.8 144.1
ROA decomposition (%)
Year to March FY10 FY11 FY12E FY13E FY14E
Net interest income/Assets 3.0 3.6 3.4 3.5 3.6
Fees/Assets 1.6 1.8 1.9 1.9 2.0
Investment profits/Assets 0.3 0.1 0.2 0.2 0.2
Net revenues/Assets 4.9 5.4 5.5 5.6 5.7
Operating expense/Assets (2.5) (2.6) (2.7) (2.8) (2.8)
Provisions/Assets (0.6) (0.5) (0.4) (0.5) (0.5)
Taxes/Assets (0.6) (0.8) (0.8) (0.8) (0.8)
Total costs/Assets (3.7) (3.9) (3.9) (4.0) (4.0)
ROA 1.2 1.5 1.6 1.6 1.7
Equity/Assets 6.1 7.7 8.6 8.4 8.2
ROAE 19.7 19.3 18.8 19.2 20.4
37 Edelweiss Securities Limited
Indusind Bank
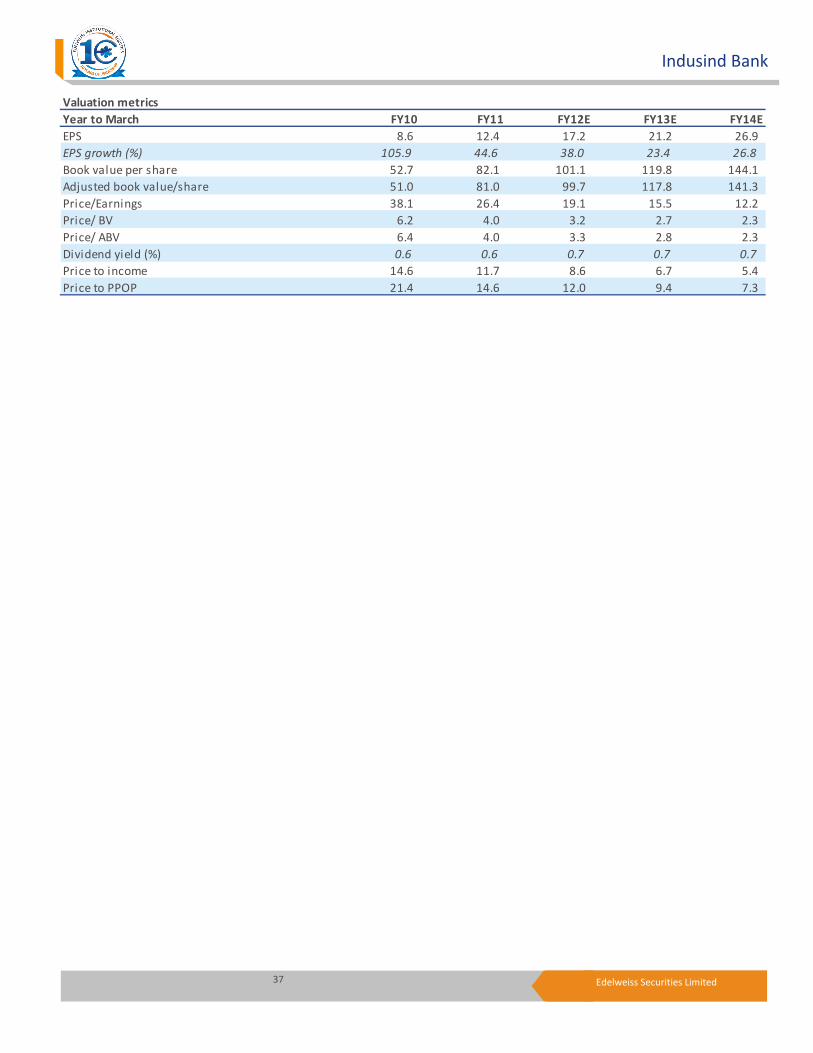
Valuation metrics
Year to March FY10 FY11 FY12E FY13E FY14E
EPS 8.6 12.4 17.2 21.2 26.9
EPS growth (%) 105.9 44.6 38.0 23.4 26.8
Book value per share 52.7 82.1 101.1 119.8 144.1
Adjusted book value/share 51.0 81.0 99.7 117.8 141.3
Price/Earnings 38.1 26.4 19.1 15.5 12.2
Price/ BV 6.2 4.0 3.2 2.7 2.3
Price/ ABV 6.4 4.0 3.3 2.8 2.3
Dividend yield (%) 0.6 0.6 0.7 0.7 0.7
Price to income 14.6 11.7 8.6 6.7 5.4
Price to PPOP 21.4 14.6 12.0 9.4 7.3

38 Edelweiss Securities Limited
Banking and Financial Services
Company Absolute
reco
Relative
reco
Relative
risk
Company Absolute
reco
Relative
reco
Relative
Risk
Allahabad Bank REDUCE SU H Axis Bank BUY SO M
Bank of Baroda HOLD SP L Federal Bank BUY SO M
HDFC HOLD SP L HDFC Bank HOLD SP L
ICICI Bank BUY SO L Indian Overseas Bank HOLD SU H
Infrastructure Development Finance Co
Ltd
BUY SO M ING Vysya BUY SO M
Karnataka Bank BUY SO L Kotak Mahindra Bank REDUCE SU L
LIC Housing Finance HOLD SP M Mahindra & Mahindra Financial
Services
BUY SO M
Manappuram General Finance HOLD SU M Multi Commodity Exchange BUY SO M
Power Finance Corp BUY SO L Oriental Bank Of Commerce BUY SO H
Reliance Capital BUY SO M Punjab National Bank REDUCE SU M
Shriram City Union Finance BUY SO H Rural Electrification Corporation BUY SO L
State Bank of India HOLD SP M South Indian Bank HOLD SP M
Yes Bank BUY SO M Union Bank Of India HOLD SP H
RATING & INTERPRETATION
ABSOLUTE RATING
Ratings Expected absolute returns over 12 months
Buy More than 15%
Hold Between 15% and - 5%
Reduce Less than -5%
RELATIVE RETURNS RATING
Ratings Criteria
Sector Outperformer (SO) Stock return > 1.25 x Sector return
Sector Performer (SP) Stock return > 0.75 x Sector return
Stock return < 1.25 x Sector return
Sector Underperformer (SU) Stock return < 0.75 x Sector return
Sector return is market cap weighted average return for the coverage universe
within the sector
RELATIVE RISK RATING
Ratings Criteria
Low (L) Bottom 1/3rd percentile in the sector
Medium (M) Middle 1/3rd percentile in the sector
High (H) Top 1/3rd percentile in the sector
Risk ratings are based on Edelweiss risk model
SECTOR RATING
Ratings Criteria
Overweight (OW) Sector return > 1.25 x Nifty return
Equalweight (EW) Sector return > 0.75 x Nifty return
Sector return < 1.25 x Nifty return
Underweight (UW) Sector return < 0.75 x Nifty return
39 Edelweiss Securities Limited
Indusind Bank
Edelweiss Securities Limited, Edelweiss House, off C.S.T. Road, Kalina, Mumbai – 400 098.
Board: (91-22) 4009 4400, Email: [email protected]
Vikas Khemani Head Institutional Equities [email protected] +91 22 2286 4206
Nischal Maheshwari Co-Head Institutional Equities & Head, Research [email protected] +91 22 4063 5476
Nirav Sheth Head Sales [email protected] +91 22 4040 7499
Coverage group(s) of stocks by primary analyst(s): Banking and Financial Services
Allahabad Bank, Axis Bank, Bank of Baroda, Federal Bank, HDFC, HDFC Bank, ICICI Bank, Infrastructure Development Finance Co Ltd, Indian Overseas Bank,
Karnataka Bank, Kotak Mahindra Bank, LIC Housing Finance, Manappuram General Finance, Mahindra & Mahindra Financial Services, Oriental Bank Of
Commerce, Punjab National Bank, Power Finance Corp, Reliance Capital, Rural Electrification Corporation, State Bank of India, Shriram City Union Finance,
South Indian Bank, Union Bank Of India, ING Vysya, Yes Bank
Distribution of Ratings / Market Cap
Edelweiss Research Coverage Universe
Rating Distribution* 104 60 18 183
* 1 stocks under review
Market Cap (INR) 114 58 11
Date Company Title Price (INR) Recos
Recent Research
31-May-12 MCX A rare commodity; Initiating
Coverage
935 Buy
31-May-12 Axis
Bank
The axiom of profitable
growth;
Visit Note
1,001 Buy
24-May-12 Rural
Electrification
Corporation
In fine fettle, but restructuring
rears its head;
Result Update
171 Buy
> 50bn Between 10bn and 50 bn < 10bn
Buy Hold Reduce Total
Rating Interpretation
Buy appreciate more than 15% over a 12-month period
Hold appreciate up to 15% over a 12-month period
Reduce depreciate more than 5% over a 12-month period
Rating Expected to
40 Edelweiss Securities Limited
Banking and Financial Services
Access the entire repository of Edelweiss Research on www.edelresearch.com
DISCLAIMER General Disclaimer:
This document has been prepared by Edelweiss Securities Limited (Edelweiss). Edelweiss, its holding company and associate companies are a full service, integrated
investment banking, portfolio management and brokerage group. Our research analysts and sales persons provide important input into our investment banking
activities. This document does not constitute an offer or solicitation for the purchase or sale of any financial instrument or as an official confirmation of any
transaction. The information contained herein is from publicly available data or other sources believed to be reliable, but we do not represent that it is accurate or
complete and it should not be relied on as such. Edelweiss or any of its affiliates/ group companies shall not be in any way responsible for any loss or damage that
may arise to any person from any inadvertent error in the information contained in this report. This document is provided for assistance only and is not intended to
be and must not alone be taken as the basis for an investment decision. The user assumes the entire risk of any use made of this information. Each recipient of this
document should make such investigation as it deems necessary to arrive at an independent evaluation of an investment in the securities of companies referred to
in this document (including the merits and risks involved), and should consult his own advisors to determine the merits and risks of such investment. The investment
discussed or views expressed may not be suitable for all investors. We and our affiliates, group companies, officers, directors, and employees may: (a) from time to
time, have long or short positions in, and buy or sell the securities thereof, of company (ies) mentioned herein or (b) be engaged in any other transaction involving
such securities and earn brokerage or other compensation or act as advisor or lender/borrower to such company (ies) or have other potential conflict of interest
with respect to any recommendation and related information and opinions. This information is strictly confidential and is being furnished to you solely for your
information. This information should not be reproduced or redistributed or passed on directly or indirectly in any form to any other person or published, copied, in
whole or in part, for any purpose. This report is not directed or intended for distribution to, or use by, any person or entity who is a citizen or resident of or located
in any locality, state, country or other jurisdiction, where such distribution, publication, availability or use would be contrary to law, regulation or which would
subject Edelweiss and affiliates/ group companies to any registration or licensing requirements within such jurisdiction. The distribution of this document in certain
jurisdictions may be restricted by law, and persons in whose possession this document comes, should inform themselves about and observe, any such restrictions.
The information given in this document is as of the date of this report and there can be no assurance that future results or events will be consistent with this
information. This information is subject to change without any prior notice. Edelweiss reserves the right to make modifications and alterations to this statement as
may be required from time to time. However, Edelweiss is under no obligation to update or keep the information current. Nevertheless, Edelweiss is committed to
providing independent and transparent recommendation to its client and would be happy to provide any information in response to specific client queries. Neither
Edelweiss nor any of its affiliates, group companies, directors, employees, agents or representatives shall be liable for any damages whether direct, indirect, special
or consequential including lost revenue or lost profits that may arise from or in connection with the use of the information. Past performance is not necessarily a
guide to future performance. The disclosures of interest statements incorporated in this document are provided solely to enhance the transparency and should not
be treated as endorsement of the views expressed in the report. Edelweiss Securities Limited generally prohibits its analysts, persons reporting to analysts and their
dependents from maintaining a financial interest in the securities or derivatives of any companies that the analysts cover. The information provided in this document
remains, unless otherwise stated, the copyright of Edelweiss. All layout, design, original artwork, concepts and other Intellectual Properties, remains the property
and copyright Edelweiss and may not be used in any form or for any purpose whatsoever by any party without the express written permission of the copyright
holders.
Analyst Certification:
The analyst for this report certifies that all of the views expressed in this report accurately reflect his or her personal views about the subject company or companies
and its or their securities, and no part of his or her compensation was, is or will be, directly or indirectly related to specific recommendations or views expressed in
this report.
Analyst holding in the stock: No.
Additional Disclaimer for U.S. Persons
This research report is a product of Edelweiss Securities Limited, which is the employer of the research analyst(s) who has prepared the research report. The
research analyst(s) preparing the research report is/are resident outside the United States (U.S.) and are not associated persons of any U.S. regulated broker-dealer
and therefore the analyst(s) is/are not subject to supervision by a U.S. broker-dealer, and is/are not required to satisfy the regulatory licensing requirements of
FINRA or required to otherwise comply with U.S. rules or regulations regarding, among other things, communications with a subject company, public appearances
and trading securities held by a research analyst account.
This report is intended for distribution by Edelweiss Securities Limited only to "Major Institutional Investors" as defined by Rule 15a-6(b)(4) of the U.S. Securities and
Exchange Act, 1934 (the Exchange Act) and interpretations thereof by U.S. Securities and Exchange Commission (SEC) in reliance on Rule 15a 6(a)(2). If the recipient
of this report is not a Major Institutional Investor as specified above, then it should not act upon this report and return the same to the sender. Further, this report
may not be copied, duplicated and/or transmitted onward to any U.S. person, which is not the Major Institutional Investor.
In reliance on the exemption from registration provided by Rule 15a-6 of the Exchange Act and interpretations thereof by the SEC in order to conduct certain
business with Major Institutional Investors, Edelweiss Securities Limited has entered into an agreement with a U.S. registered broker-dealer, Marco Polo Securities
Inc. ("Marco Polo").
Transactions in securities discussed in this research report should be effected through Marco Polo or another U.S. registered broker dealer.
Copyright 2009 Edelweiss Research (Edelweiss Securities Ltd). All rights reserved