INDSTAT: The UNIDO industrial statistics databases · INDSTAT: The UNIDO industrial statistics...
66
INDSTAT: The UNIDO industrial statistics databases Valentin Todorov [email protected] 1 1 United Nations Industrial Development Organization, Vienna 24 November 2015 Todorov (UNIDO) UNIDO databases 24 November 2015 1 / 66
Transcript of INDSTAT: The UNIDO industrial statistics databases · INDSTAT: The UNIDO industrial statistics...

INDSTAT: The UNIDO industrial statistics
databases
Valentin Todorov
1United Nations Industrial Development Organization, Vienna
24 November 2015
Todorov (UNIDO) UNIDO databases 24 November 2015 1 / 66
Outline
1 Introduction: Manufacturing and industrial statistics
2 Structural Statistics for Industry
UNIDO databases
UNIDO Statistical Process
Recommended use and limitations of the INDSTAT databases
3 Imputation of key indicators
4 Industrial statistics for business structure
5 Summary and conclusions
Todorov (UNIDO) UNIDO databases 24 November 2015 2 / 66

Introduction: Manufacturing and industrial statistics
Outline
1 Introduction: Manufacturing and industrial statistics
2 Structural Statistics for Industry
UNIDO databases
UNIDO Statistical Process
Recommended use and limitations of the INDSTAT databases
3 Imputation of key indicators
4 Industrial statistics for business structure
5 Summary and conclusions
Todorov (UNIDO) UNIDO databases 24 November 2015 3 / 66

Introduction: Manufacturing and industrial statistics
Manufacturing and industrial statistics
• Industrial development is a driver of structural change which is
key in the process of economic development.
• Industrial statistics allow to identify and rank the key production
sectors, major economic zones in the country, major size classes• Specialized and structural statistics on industry (as well as on
other economic sectors) are demanded more than ever byresearchers and analysts to assess implications of the process ofthe globalization to individual countries:
I Synthesized data on world development trends.I Internationally comparable data to assess the growth and
structure of one region in the world vis-a-vis others.I A complete set of data on their field of interest to avoid
measurement discrepancies.I Regular data production to update/correct policy measures.
Todorov (UNIDO) UNIDO databases 24 November 2015 4 / 66

Introduction: Manufacturing and industrial statistics
The Industrial Sector
In general, industrial statistics are statistics reflecting characteristics
and economic activities of the units engaged in a class of industrial
activities that are defined in terms of the International Standard
Industrial Classification of All Economic Activities (ISIC)
(IRIS 2008)
The industrial sector corresponds to:
ISIC Revision 3 ISIC Revision 4
C Mining and quarrying B Mining and quarrying
D Manufacturing C Manufacturing
E Electricity, gas and water supply D Electricity, gas, steam and air condition-
ing supply
E Water supply; sewerage, waste manage-
ment and remediation activities
Todorov (UNIDO) UNIDO databases 24 November 2015 5 / 66

Introduction: Manufacturing and industrial statistics
The Industrial Sector: Sections (cont.)
Section B: Mining and quarrying
This includes the activities relating to extraction of minerals
occurring naturally as solids (coal and ores), liquids (petroleum) or
gases (natural gas).
Section C: Manufacturing
Manufacturing, according to international recommendations, is
defined as the physical or chemical transformation of materials or
components into new products, whether the work is performed by
power-driven machines or by hand, whether it is done in a factory or
in the worker’s home, and whether the products are sold at wholesale
or retail.
Todorov (UNIDO) UNIDO databases 24 November 2015 6 / 66

Introduction: Manufacturing and industrial statistics
The Industrial Sector: Sections
Section D: Electricity, gas, steam and air conditioning supply
Economic activities included under this section are the activity of
providing electric power, natural gas, steam, hot water and the like
through a permanent infrastructure (network) of lines, mains and
pipes.
Section E: Water supply; sewerage, waste management and
remediation activities
This section includes activities related to the management (including
collection, treatment and disposal) of various forms of waste, such as
solid or non-solid industrial or household waste, as well as
contaminated sites. Activities of water supply are also grouped in this
section.
Todorov (UNIDO) UNIDO databases 24 November 2015 7 / 66
Introduction: Manufacturing and industrial statistics
Divisions, Groups and Classes in Manufacturing: Example
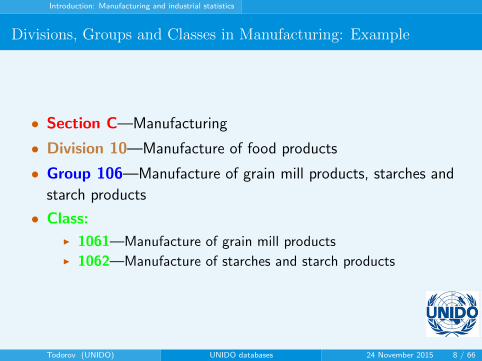
• Section C—Manufacturing
• Division 10—Manufacture of food products
• Group 106—Manufacture of grain mill products, starches and
starch products
• Class:
I 1061—Manufacture of grain mill productsI 1062—Manufacture of starches and starch products
Todorov (UNIDO) UNIDO databases 24 November 2015 8 / 66

Introduction: Manufacturing and industrial statistics
Main data sources
Information about the domestic production
By ISIC at 3- or 4-digit level (readily available at the National
statistical offices).
1. Employment (number of employees)
2. Compensation of employees
3. Gross output
4. Intermediate consumption
5. Value added
6. Gross fixed assets at the end of the reference year and the gross
fixed capital formation
7. Index numbers of industrial production
Todorov (UNIDO) UNIDO databases 24 November 2015 9 / 66

Introduction: Manufacturing and industrial statistics
Main data sources (2)
Foreign trade statistics
Available from e.g. UN COMTRADE.
1. Export of manufactured goods
2. Import of manufactured goods
For an overall assessment of the performance of the manufacturing
sector in relation to the economy as a whole, data are needed on the
following indicators:
1. Population
2. Gross domestic product (GDP)
3. Manufacturing value added (MVA)
Todorov (UNIDO) UNIDO databases 24 November 2015 10 / 66

Structural Statistics for Industry
Outline
1 Introduction: Manufacturing and industrial statistics
2 Structural Statistics for Industry
UNIDO databases
UNIDO Statistical Process
Recommended use and limitations of the INDSTAT databases
3 Imputation of key indicators
4 Industrial statistics for business structure
5 Summary and conclusions
Todorov (UNIDO) UNIDO databases 24 November 2015 11 / 66

Structural Statistics for Industry UNIDO databases
Structural Statistics for Industry: UNIDO databases
UNIDO databases
• Cover the industry sector
• Refer to economic statistics, mainly production and trade
related, not technological or environmental data
• Include statistical data from the annual observation within the
quality assurance framework (no experimental or one-time study
data)
• Official data supplied by NSOs (abided by the resolution of UN
Statistics Commission)
• Further details:
http://www.unido.org/index.php?id=1002103
• Follow the UNIDO Quality Framework (Upadhyaya and Todorov,
2008, 2012)Todorov (UNIDO) UNIDO databases 24 November 2015 12 / 66

Structural Statistics for Industry UNIDO databases
Industrial statistics databases
Industrial statistics database (INDSTAT/MINSTAT)
• contains annual figures according to industrial sectors (ISIC), country and
year
• comprises data for 175 countries; 1963 to the latest available year.
• data are in current prices, national currency; can be presented in current
USD
• Example: GCC data availability
I Bahrain: 1992—2010 (only 2-digits)I Kuwait: 2005—2012I Oman: 1993—2012I Qatar: 2005—2010 (mainly 2-digits)I Saudi Arabia: 1996 and 2006I United Arab Emirates: only total manufacturing in the recent
years
• consists of historically formed databases, which are generally comparable
over time and across countries differ at the ISIC Revision and level of detail.
• Further details: http://www.unido.org/index.php?id=1002103
Todorov (UNIDO) UNIDO databases 24 November 2015 13 / 66

Structural Statistics for Industry UNIDO databases
Industrial statistics databases
INDSTAT/MINSTAT Variables
1. Number of establishments
2. Number of employees
3. Number of female employees
4. Wages and salaries
5. Gross output
6. Value added
7. Gross fixed capital formation
8. Index numbers of industrial production
Todorov (UNIDO) UNIDO databases 24 November 2015 14 / 66

Structural Statistics for Industry UNIDO databases
Industrial statistics databases
INDSTAT/MINSTAT Variables (cont.)
• Data for these indicators are readily available in most national
industrial census and survey results.
• Data are related ⇒ several other relative variables can becomputed:
I number of employees per establishment,I wages and salaries per employee,I value added output ratio ...
Todorov (UNIDO) UNIDO databases 24 November 2015 15 / 66

Structural Statistics for Industry UNIDO databases
UNIDO Statistics online portal
Todorov (UNIDO) UNIDO databases 24 November 2015 16 / 66

Structural Statistics for Industry UNIDO databases
UNIDO Statistics at the Google Public Data Explorer
Todorov (UNIDO) UNIDO databases 24 November 2015 17 / 66

Structural Statistics for Industry UNIDO databases
Industrial demand supply database (IDSB)
Industrial demand supply database (IDSB)
• Data pertain to manufacturing; arranged according to ISIC
Revision 3 and 4, at the 4 digit level (127, resp. 137 industries)
• Data are presented by country, manufacturing sector and year.
• Data are derived from output data reported by NSOs together
with UNIDO estimates for ISIC-based international trade data
(utilizing UN Commodity Trade Statistics Database,
COMTRADE)
• Further details:
http://www.unido.org/index.php?id=1002106
Todorov (UNIDO) UNIDO databases 24 November 2015 18 / 66

Structural Statistics for Industry UNIDO databases
Industrial demand supply database (IDSB)
Industrial demand supply database (IDSB)
• IDSB comprises data for 94 countries; 1990—2012, ISIC Revision
3 and 4. Coverage in terms of years, as well as data items, may
vary from country to country depending on data availability
• Further details:
http://www.unido.org/index.php?id=1002106
Todorov (UNIDO) UNIDO databases 24 November 2015 19 / 66

Structural Statistics for Industry UNIDO databases
Industrial demand supply database (IDSB)
IDSB Variables
1. Domestic output
2. Total imports
3. Total exports
4. Apparent consumption
5. Imports from industrialized countries
6. Imports from developing countries
7. Exports to industrialized countries
8. Exports to developing countries.
Todorov (UNIDO) UNIDO databases 24 November 2015 20 / 66

Structural Statistics for Industry UNIDO databases
Industrial demand supply database (IDSB)
IDSB Variables (cont.)
The following relation between the above items exists:
• Total imports = Imports from industrialized countries + Imports
from developing countries
• Total exports = Exports to industrialized countries + Exports to
developing countries
• Apparent consumption = Domestic output + Total
imports—Total exports
Todorov (UNIDO) UNIDO databases 24 November 2015 21 / 66

Structural Statistics for Industry UNIDO databases
MVA Database
MVA Database (MVAExplorer)
• Includes data for GDP and MVA at current and constant prices
for around 200 countries and territories from 1990 onwards.
• Compiled from external sources (WDI, UNSD, OECD, etc.)
• Used to estimate the GDP and MVA growth rates, MVA share in
GDP, MVA per capita and the MVA structure by world regions
• Augmented with estimates by UNIDO up to the current year
based on historical trends (Boudt, Todorov, Updhyaya, 2009)
Todorov (UNIDO) UNIDO databases 24 November 2015 22 / 66

Structural Statistics for Industry UNIDO databases
UNIDO industrial statistics databases: summary
• INDSTAT DB
• MINSTAT DB
• by ISIC and by country
• Number of establishments
• Number of employees
• Number of female
employees
• Wages and salaries
• Gross output
• Value added
• Gross fixed capital
formation
• Index numbers of
industrial production
• MVA DB
• by country
• GDP at current prices
• GDP at constant
prices
• MVA at current prices
• MVA at constant
prices
• Population
• IDSB
• by ISIC and by country
• Output = Y
• Import= M
• Export = X
• Apparent consumption
= C
C = Y + M − X
Todorov (UNIDO) UNIDO databases 24 November 2015 23 / 66
Structural Statistics for Industry UNIDO Statistical Process
UNIDO Statistical Process: GSBPM
Todorov (UNIDO) UNIDO databases 24 November 2015 24 / 66

Structural Statistics for Industry UNIDO Statistical Process
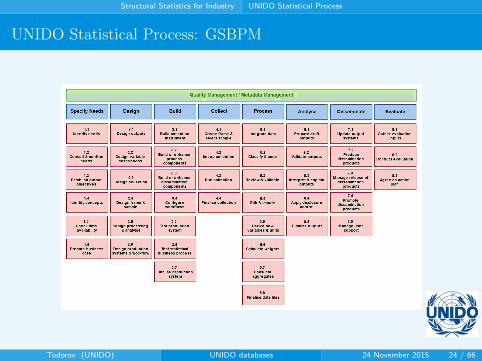
UNIDO Statistical Process
1. Initialization
I Pre-filling of the out-going UNIDO General Industrial Statistics
Questionnaire with previously reported statistical data and
metadataI Excel formatI In the appropriate language - English, French or SpanishI Automated using the available data and metadata
2. Data Collection
I NSO: the completed and returned to UNIDO by the NSO
questionnaires (excel format, rarely hard copy) are entered into
the system and are ready for further validation and processingI OECD: Data for OECD member countries (excel format) are
ready for further validation and processing
Todorov (UNIDO) UNIDO databases 24 November 2015 25 / 66

Structural Statistics for Industry UNIDO Statistical Process
UNIDO Statistical Process
3. Transformation/ProcessingI The data collected from the primary or secondary sources are
further transformed to a ready-to use data set.I The data transformation is done in five stages, which not only
constitute an operational framework for UNIDO statisticians,
but also provides additional description of statistics (generated
metadata which are attributed to each data item)I After undergoing the complete processing phase the incoming
and generated data and metadata are stored in the databases
4. DisseminationI International Yearbook of Industrial StatisticsI INDSTAT, MINSTAT and IDSB CD and online productsI Web Country StatisticsI Ad hock requests
Todorov (UNIDO) UNIDO databases 24 November 2015 26 / 66
Structural Statistics for Industry UNIDO Statistical Process
Operational framework: stages
• Stage 1—responses to national questionnaires. Detection and ifpossible correction of obvious reporting errors
I Used for pre-filling the following edition of the questionnaireI Data are considered official
• Stage 2—incorporation of published national data.
I Inconsistent data are corrected using supplementary information
from national publicationsI Published in International Yearbook of Industrial StatisticsI Data are considered official
Todorov (UNIDO) UNIDO databases 24 November 2015 27 / 66

Structural Statistics for Industry UNIDO Statistical Process
Operational framework: stages
• Stage 3—disaggregation of data. Data are adjusted to eliminatethe departures from the level of ISIC aggregation
I using national and international sourcesI using supplementary data
• Stage 4—automatic disaggregation and interpolation. Missingdata are estimated applying related proportion or interpolationwhenever applicable
I For ISIC Revision 3, 2-digit only
• Stage 5—estimation of provisional data for the latest years.
I Selected variables only
Todorov (UNIDO) UNIDO databases 24 November 2015 28 / 66

Structural Statistics for Industry Recommended use and limitations of the INDSTAT databases
Recommended use of IDNSTAT
• The INDSTAT Database together with detailed internationaltrade statistics provides statistical basis for empirical economicresearch, for instance, on
I Manufacturing production and its growth, location and pattern;I International trade in relation to manufacturing production,
comparative advantage and international specialization;I Production factors of manufacturing (e.g., labour, physical
capital);I Manufacturing productivity (e.g., LP, TFP);I Structure (e.g., value-added structure, trade structure,
employment structure market structure) of the manufacturing
sector.
Todorov (UNIDO) UNIDO databases 24 November 2015 29 / 66

Structural Statistics for Industry Recommended use and limitations of the INDSTAT databases
Limitations of the INDSTAT databases
• Deviations from ISIC
I Data reported (or retrieved) in national classification ⇒ needs
to be converted using concordance tableI Different ISIC revisions ⇒ also needs to be converted using
concordance tableI Many countries report data at a high level of aggregation (3- or
2-digits)I Use of a large number of combined ISIC 4-digit categories.
• Data coverage
I incomplete or varying degrees of coverage of establishments
(different cutoff points);I non-reporting of data by surveyed establishments, andI the failure to adjust for non-response.
Todorov (UNIDO) UNIDO databases 24 November 2015 30 / 66
Structural Statistics for Industry Recommended use and limitations of the INDSTAT databases
Limitations of the INDSTAT databases
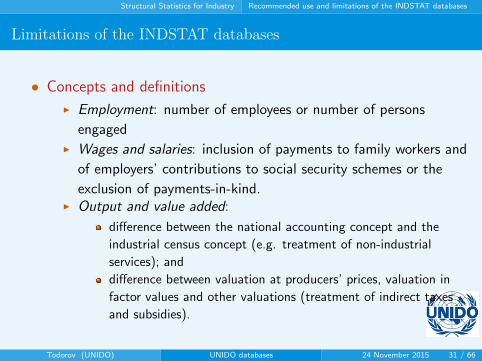
• Concepts and definitions
I Employment: number of employees or number of persons
engagedI Wages and salaries: inclusion of payments to family workers and
of employers’ contributions to social security schemes or the
exclusion of payments-in-kind.I Output and value added:
difference between the national accounting concept and the
industrial census concept (e.g. treatment of non-industrial
services); and
difference between valuation at producers’ prices, valuation in
factor values and other valuations (treatment of indirect taxes
and subsidies).
Todorov (UNIDO) UNIDO databases 24 November 2015 31 / 66

Structural Statistics for Industry Recommended use and limitations of the INDSTAT databases
Limitations of the INDSTAT databases
• Missing data
I Incomplete period coverage - significant time lag between data
reporting and the latest reference yearI Incomplete variable coverageI Census or survey performed once in, say, five yearsI Missing data for years when changing the ISIC revisionI Data suppressed due to confidentiality reasons (at 3- or 2-digit
level)I In many cases it is not clear if the data are missing or are 0s
Todorov (UNIDO) UNIDO databases 24 November 2015 32 / 66
Structural Statistics for Industry Recommended use and limitations of the INDSTAT databases
Limitations of the INDSTAT databases
• Significant differences to other data sets, e.g. the National
Accounts MVA database
• Lack of relevant deflators (e.g. for value added) at sub-sectoral
levels: does not enable the user to convert properly the available
time series on value added at current prices to corresponding
time series at constant prices.
• Inconsistency and incoherence of existing indexes of industrial
production
• Lack of data by size class
Todorov (UNIDO) UNIDO databases 24 November 2015 33 / 66

Imputation of key indicators
Outline
1 Introduction: Manufacturing and industrial statistics
2 Structural Statistics for Industry
UNIDO databases
UNIDO Statistical Process
Recommended use and limitations of the INDSTAT databases
3 Imputation of key indicators
4 Industrial statistics for business structure
5 Summary and conclusions
Todorov (UNIDO) UNIDO databases 24 November 2015 34 / 66

Imputation of key indicators
Imputation in international statistics
Survey data (micro)
• Multiple variables observed for a sample of observation units
from a population at one point in time
• Gaps in the data are classified as:
I Item non-responseI Unit non-responseI Variables not included in the survey
Time series data (macro)
• Contain data for multiple time periods
• Contain data for aggregate (or macro) units (sections)
• Sections are usually countries
• Variables are usually statistical indicators (like GDP, MVA, etc.)Todorov (UNIDO) UNIDO databases 24 November 2015 35 / 66

Imputation of key indicators
Example 1: Estimating the Manufacturing Value Added
Manufacturing Value Added
• MVA is the key indicator of a country’s industrial production
• Published in UNIDO’s International Yearbook of Industrial
Statistics
• Main data source is World Development Indicators (WDI) of
World Bank
• Data missing for many countries and years
• A time-gap of at least one year (between the latest year andcurrent year)
I Using data from other sourcesI Nowcasting methods to fill in the missing data up to the current
year
Todorov (UNIDO) UNIDO databases 24 November 2015 36 / 66

Imputation of key indicators
Example 1: Using MVA estimates
Overall growth trends of world MVA by selected country groups at
constant 2005 prices
Todorov (UNIDO) UNIDO databases 24 November 2015 37 / 66
Imputation of key indicators
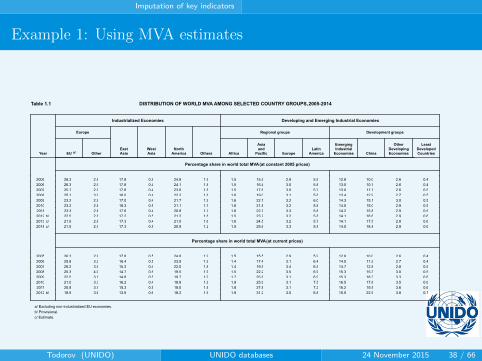
Example 1: Using MVA estimates
Table 1.1 DISTRIBUTION OF WORLD MVA AMONG SELECTED COUNTRY GROUPS, 2005-2014
Year EU OtherWestAsia
EastAsia
NorthAmerica Others Africa
LatinAmerica
Asiaand
Pacific Europe
EmergingIndustrial
Economies
LeastDevelopedCountriesChina
Europe Regional groups Development groups
Industrialized Economies Developing and Emerging Industrial Economies
OtherDevelopingEconomiesa/
Percentage share in world total MVA (at constant 2005 prices)
2005 26.3 2.9 0.517.8 24.8 1.9 1.5 5.915.5 2.9 12.8 0.410.0 2.6
2006 26.3 2.9 0.417.8 24.1 1.8 1.5 5.816.4 3.0 13.0 0.410.7 2.6
2007 25.7 2.9 0.417.8 23.6 1.8 1.5 5.717.6 3.0 13.0 0.511.7 2.6
2008 25.1 3.0 0.418.0 22.2 1.8 1.6 5.819.0 3.1 13.4 0.512.9 2.7
2009 23.2 2.9 0.417.0 21.7 1.9 1.6 6.022.1 3.2 14.3 0.515.1 3.0
2010 23.2 2.8 0.518.3 21.1 1.7 1.6 5.821.8 3.2 14.0 0.515.0 2.9
2011 23.3 2.8 0.417.6 20.8 1.7 1.6 5.822.7 3.3 14.2 0.515.8 2.9
2012 22.5 2.8 0.517.2 21.2 1.6 1.5 5.823.7 3.2 14.1 0.616.6 2.9b/
2013 21.9 2.8 0.417.3 21.0 1.6 1.6 5.724.5 3.2 14.1 0.617.5 2.8c/
2014 21.5 2.7 0.517.3 20.9 1.2 1.5 5.525.6 3.3 14.0 0.618.4 2.9c/
Percentage share in world total MVA (at current prices)
2005 26.3 2.9 0.517.8 24.8 1.9 1.5 5.915.5 2.9 12.8 0.410.0 2.6
2006 25.8 3.2 0.516.4 23.9 1.9 1.4 6.417.4 3.1 14.0 0.411.2 2.7
2007 26.2 3.5 0.415.3 22.0 1.8 1.4 6.519.5 3.4 14.7 0.512.8 2.8
2008 25.3 4.0 0.514.7 19.5 1.9 1.5 6.922.2 3.5 15.3 0.515.3 3.0
2009 22.5 3.1 0.514.8 19.7 1.9 1.7 6.925.8 3.1 15.3 0.618.3 3.3
2010 21.0 3.3 0.416.2 18.8 1.9 1.9 7.525.9 3.1 16.5 0.617.8 3.5
2011 20.8 3.7 0.515.3 18.0 1.8 1.8 7.227.8 3.1 16.2 0.619.5 3.6
2012 18.9 3.6 0.613.9 18.2 1.9 1.9 6.831.2 3.0 15.5 0.722.9 3.8b/
a/ Excluding non-industrialized EU economies.
b/ Provisional.
c/ Estimate.
Todorov (UNIDO) UNIDO databases 24 November 2015 38 / 66

Imputation of key indicators
Example 1: GCC data availability
GDP and MVA at 2005 constant prices, GDP and MVA at current
price and population for the GCC countries in 2010 (million USD)
country gdpcod mvacod gdpcud mvacud pop
1 Bahrain 17792456 2397058 25713571 4136828 1251513
2 Kuwait 86235753 6064283 119934675 6625807 2991580
3 Oman 41930341 3587469 58813004 5486858 2802768
4 Qatar 92687851 6946035 125122249 13512260 1749713
5 Saudi Arabia 435991918 47654154 526811467 58178933 27258387
6 UAE 204448097 22887522 287421928 28934786 8441537
• The numbers shown in red are not available in the World Bank
database and were compiled by UNIDOTodorov (UNIDO) UNIDO databases 24 November 2015 39 / 66

Imputation of key indicators
Example 2: Reclassification
• Some countries do not use standard international classifications (e.g.
ISIC/NACE classification of economic activities) or
• do not provide historical data on this basis or
• we need a long time series but the world changes and new revisions of the
standard classification are adopted:
• ⇒ Data are converted according to a mapping of different classification
systems. Where the mapping is not a clear-cut one to one basis, this
introduces an element of imputation.
Data UNIDO
Revision From available Database Comment
ISIC Revision 2 1968 1963-2004 INDSTAT 3 discontinued in 2006
ISIC Revision 3 1990 1990-2012 INDSTAT 4 3- and 4-digits
ISIC Revision 4 2008 2005-2012 INDSTAT 4 3- and 4-digits
ISIC Revision 3 1990 1963-2012 INDSTAT 2 2-digits, data imputed
Todorov (UNIDO) UNIDO databases 24 November 2015 40 / 66

Imputation of key indicators
Example 3: Studying the Structural changes in manufacturing
• Structural changeI Structure or Structural change have become widely used in
economic research, however with different meanings and
interpretationsI The most common meaning refers to long-term persistent shifts
in the sectoral composition of economic systems.I Patterns of industrial production and international trade are two
sides of one coin: they both reflect the level and the structure
of industrial activity in a country.I Detailed and relatively complete structural statistics for
international trade data are readily available from UN
COMTRADE.I We need similarly detailed and complete structural statistics for
industrial production: UNIDO INDSTAT.
Todorov (UNIDO) UNIDO databases 24 November 2015 41 / 66

Imputation of key indicators
Example 3: Studying the Structural changes in manufacturing
Bahrain Kuwait Oman Qatar Saudi Arabia UAE
20002009
Share of manufactured exports in total exports (in per cent)
per
cent
05
1015
2025
3035
Source: UN COMTRADE and UNIDO Database
Todorov (UNIDO) UNIDO databases 24 November 2015 42 / 66

Imputation of key indicators
Example 3: Studying the Structural changes in manufacturing
Bahrain Kuwait Oman Qatar Saudi Arabia UAE
20002006
Share of medium− and high−tech VA for the GCC countries (in per cent)
per
cent
010
2030
4050
Source: UNIDO Database
Todorov (UNIDO) UNIDO databases 24 November 2015 43 / 66

Imputation of key indicators
A. Nowcasting MVA
• GDP data are available up to the current year:
I For earlier years the actual GDP values are usedI For the most recent one or two years the GDP values are
derived from the nowcasts of GDP growth rates reported in the
World Economic Outlook of IMF (see Artis, 1996)
• MVA—a time-gap of at least one year: nowcasting
• MVA is strongly connected to the GDP
• ⇒ this suggests to nowcast MVA on the basis of the estimated
relationship between contemporaneous values of MVA and GDP
Todorov (UNIDO) UNIDO databases 24 November 2015 44 / 66
Imputation of key indicators
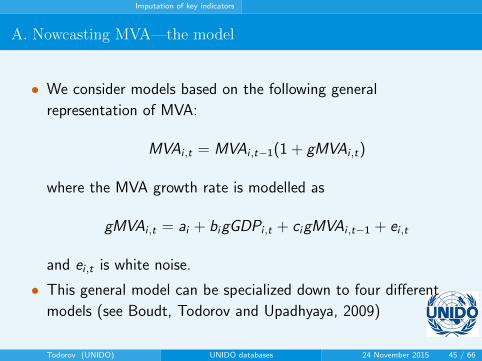
A. Nowcasting MVA—the model
• We consider models based on the following general
representation of MVA:
MVAi ,t = MVAi ,t−1(1 + gMVAi ,t)
where the MVA growth rate is modelled as
gMVAi ,t = ai + bigGDPi ,t + cigMVAi ,t−1 + ei ,t
and ei ,t is white noise.
• This general model can be specialized down to four different
models (see Boudt, Todorov and Upadhyaya, 2009)
Todorov (UNIDO) UNIDO databases 24 November 2015 45 / 66

Imputation of key indicators
B. Imputation INDSTAT: Cross-sectional time series data
• Four different types of time series data structures (Denk andWeber, 2011):
1. Single univariate time series
2. Single multivariate time series
3. Cross-sectional univariate time series
4. Cross-sectional multivariate time series
• Missingness patterns The relevance and applicability of missingdata techniques depends on:
1. missing items;
2. missing periods,
3. missing variables, and
4. missing sections (countries).
Todorov (UNIDO) UNIDO databases 24 November 2015 46 / 66

Imputation of key indicators
B. Imputation INDSTAT: Description of the data set
Variables of interest
1. GO - Gross output
2. VA - Value added
3. WS - Wages and salaries
4. EMP - Number of employees
Auxiliary variables
1. IIP - Index of Industrial Production
2. MVA - Manufacturing Value Added (from SNA)
3. IMVA - Index of MVA
4. CPI - Consumer price index
Todorov (UNIDO) UNIDO databases 24 November 2015 47 / 66
Imputation of key indicators
B. Imputation INDSTAT: Description of the data set
The following variables will not be considered:
• GFCF - Gross fixed capital formation—the economic relation to
GO and VA is too weak
• EST - Number of establishments—too heterogeneous due to
difference in definitions
Todorov (UNIDO) UNIDO databases 24 November 2015 48 / 66
Imputation of key indicators
B. Imputation INDSTAT: Deterministic approach based on
economic relations
• Impute the four variables of interest using economic relationships
between the variables.
• Start with estimation of the missing observations for Gross
output based on available production indexes or Value added.
• Estimate Value added, Wages and salaries and Employment on
the basis of past trends in the relationships between output and
these three variables.
• (a) At total manufacturing level.
• (b) Share-based allocation of manufacturing totals.
Todorov (UNIDO) UNIDO databases 24 November 2015 49 / 66

Imputation of key indicators
B. Imputation INDSTAT: Example 1: Egypt
Imputation of all missing values using IIP and CPI
Output Value added
Employment Wages and Salaries0k
100b
200b
300b
0k
40b
80b
120b
600k
800k
1m
1.2m
0k
10b
20b
1970 1980 1990 2000 2010 1970 1980 1990 2000 2010
year
valu
e
Egypt (818)
Todorov (UNIDO) UNIDO databases 24 November 2015 50 / 66

Imputation of key indicators
B. Imputation INDSTAT: Example 2: imputation by industry
Todorov (UNIDO) UNIDO databases 24 November 2015 51 / 66

Industrial statistics for business structure
Outline
1 Introduction: Manufacturing and industrial statistics
2 Structural Statistics for Industry
UNIDO databases
UNIDO Statistical Process
Recommended use and limitations of the INDSTAT databases
3 Imputation of key indicators
4 Industrial statistics for business structure
5 Summary and conclusions
Todorov (UNIDO) UNIDO databases 24 November 2015 52 / 66
Industrial statistics for business structure
Industrial statistics for business structure
• National accounts to show the overall economic growth; business
structure data to reveal the growth potentials
• Industrial statistics allow to identify and rank the key production
sectors, major economic zones in the country, major size classes
• Employment and wage rate; share of compensation of employees
in VA
• Productivity, capacity utilization and other indicators of
economic performance
• Environment; use of cleaner energy; waste disposal system and
water treatment
Todorov (UNIDO) UNIDO databases 24 November 2015 53 / 66

Industrial statistics for business structure
Measuring the industrial performance
• Industrial performance is an outcome of various social, economicand technological factors. The three most important dimensionsof industrial performance are:
I Productivity,I Structural change andI Competitiveness
• Performance indicators
I Performance indicators make it possible to evaluate performance
(like, profitability, productivity and efficiency) of producers units.I In principle, a performance indicator is a policy relevant
statistics that provides an indication about the conditions and
functioning of any segment of the economy.
Todorov (UNIDO) UNIDO databases 24 November 2015 54 / 66

Industrial statistics for business structure
Types of performance indicators
• The performance indicators can broadly be distinguished underthree types, namely:
1. growth rates,
2. ratio indicators, and
3. share indicators.
• These indicators may be calculated at the 3-digit (group) level
for annual and at 2-digit (division) level of ISIC, Rev.4 for
quarterly periodicity.
Todorov (UNIDO) UNIDO databases 24 November 2015 55 / 66

Industrial statistics for business structure
Industrial productivity
• Measures of productivity growth constitute core indicators forthe analysis of economic growth. The indicators of productivityare highly demanded by policy makers. Construction of theseindicators is based on the relation of different output and inputcomponents at the national, industrial sector, and enterpriselevels:
1. MVA per capita
2. Value added per employee
3. Value added per hour worked
4. Value added per unit of capital
5. Capital per employee
6. Multifactor productivity index
7. Value added output ratio
Todorov (UNIDO) UNIDO databases 24 November 2015 56 / 66

Industrial statistics for business structure
MVA per capita in the UN ESCWA member countries
Iraq
Syrian Arab Republic
Yemen
Sudan
State of Palestine
Egypt
Morocco
Jordan
Libya
Lebanon
Tunisia
Oman
Saudi Arabia
Kuwait
United Arab Emirates
Qatar
100 1000MVA per capita (log scale)
• Values in USD (log
scale)
• Data refer to year
2012 except Palestine
(2011) and Syria
(2010)
• Data source: UNIDO
Statistics
Todorov (UNIDO) UNIDO databases 24 November 2015 57 / 66

Industrial statistics for business structure
MVA per capita in the UN ESCWA member countries
Iraq
Syrian Arab Republic
Yemen
Sudan
State of Palestine
Egypt
Morocco
Jordan
Libya
Lebanon
Tunisia
Oman
Saudi Arabia
Kuwait
United Arab Emirates
Qatar
100 1000MVA per capita (log scale)
20122001
• Values in USD (log
scale)
• Data refer to years
2001 and 2012 except
Palestine (2011) and
Syria (2010)
• Data source: UNIDO
Statistics
Todorov (UNIDO) UNIDO databases 24 November 2015 58 / 66

Industrial statistics for business structure
MVA per capita on the map (UN ESCWA member countries)
Todorov (UNIDO) UNIDO databases 24 November 2015 59 / 66

Industrial statistics for business structure
Structural change
• Structural change
I Structures of MVA as well as international trade reflect the
country’s comparative advantages which depends mainly on the
country’s endowments of production capitals, low-wage labor
and natural resources as industrial materials.I The principal indicators are measured as the shift of sector
shares over a considerable interval of time.
• Shares and growth
I Structural change is closely connected with industrial growth.
On the one hand, structural change may accelerate growth
while, on the other hand, any growth may result in significant
structural change.I Both shares and growth indicators have to be considered
Todorov (UNIDO) UNIDO databases 24 November 2015 60 / 66

Industrial statistics for business structure
Measures of Industrial structure
1. Change in sector share
2. Coefficient of absolute structural change
3. Coefficient of relative structural change
4. Integral coefficient of structural change
5. Rank correlation
6. Coefficient of diversification
7. Regional disparity index
8. Position of manufacturing in economy (share of MVA in GDP)
• Indicators 1-5 consider shift in the shares in a certain period.
• Indicators 1-7 provide statistics for analysis of structural change
within the manufacturing industry.
• Details about the computation of the indicators can be found in
Industrial Statistics—Guidelines and MethodologyTodorov (UNIDO) UNIDO databases 24 November 2015 61 / 66

Industrial statistics for business structure
Measures of Industrial structure:Coefficient of diversification
The coefficient of diversification shows the extent to which the
production is spread across different manufacturing branches and is
based on the share of manufacturing branches in total output.
1990 1995 2000 2005
0.4
0.5
0.6
0.7
0.8
Diversification index
Year
Div
ersi
ficat
ion
inde
x
●
●
KuwaitOmanQatar
Todorov (UNIDO) UNIDO databases 24 November 2015 62 / 66
Industrial statistics for business structure
Structural change
• UNIDO Database is mainly the collection of business structure
statistics and provides detail information for structural change
analysis
• A number of classifications derived from ISIC are used toindicate the structural composition and its change over time
I Agro-based sectorsI Resource based-sectorsI Sectors by technological intensityI Sectors by energy intensity
Todorov (UNIDO) UNIDO databases 24 November 2015 63 / 66

Summary and conclusions
Outline
1 Introduction: Manufacturing and industrial statistics
2 Structural Statistics for Industry
UNIDO databases
UNIDO Statistical Process
Recommended use and limitations of the INDSTAT databases
3 Imputation of key indicators
4 Industrial statistics for business structure
5 Summary and conclusions
Todorov (UNIDO) UNIDO databases 24 November 2015 64 / 66

Summary and conclusions
Summary and conclusions
• UNIDO Statistics mandate: maintain global industrial statisticsdatabases
I INDSTAT 2 at 2-digit level of ISIC Revision 3I INDSTAT 4 at 3- and 4-digit level of ISIC Revision 3 and 4I MINSTAT at 2- and 3-digit level of ISIC Revision 3 and 4I IDSB at 4-digit level of ISIC Revision 3 and 4I MVA
• Data quality framework
• Dissemination: online data portal, CD Roms, printed publications
• UNIDO Statistics business process: aligned to GSBPM
• Improve quality and coverage:I Technical cooperation projects
• A number of derived databasesTodorov (UNIDO) UNIDO databases 24 November 2015 65 / 66