INDOT Document Design Presentation
35
Document Design and Presentation Dr. David Blakesley, Professor of English, Purdue University Brought to you in cooperation with the Purdue Online Writing Lab
Transcript of INDOT Document Design Presentation

Document Design and Presentation
Dr. David Blakesley, Professor of English, Purdue University Brought to you in cooperation with the Purdue Online Writing Lab

Effective technical communication integrates textual and visual
elements:Topics:•Document format and layout: Communicates document genre – a report, a letter, etc.•Document headings: Helps aid document navigation and introduce and describe ideas in document sections•Information graphics: Communicates technical information visually, ex. line graphs, bar graphs, pie charts, tables, flowcharts, diagrams, maps, etc.
Using Visuals to Inform and Persuade

Effective technical communication integrates textual and visual
elements:Topics, cont.:•Typography: Fonts, typefaces, and point size help enhance readability•Research posters: Good posters catch reader’s attention and make key information understandable
Using Visuals to Inform and Persuade

Format and layout choices communicateinformation about the document’s genre•Different genres have different purposes and different reader expectations•Your format and layout choices begin communicating this message
Compare the following documents and think about how the format and layout affects the message being sent.
Using Visuals to Inform & Persuade: Format & Layout

Sample 1What kind of document is this?
Why do you think the authorwrote this document?
What kind of information iscommunicated in a documentlike this?
How do you think format andlayout affects a reader’sExpectations and needs?
Using Visuals to Inform & Persuade: Format & Layout

Using Visuals to Inform & Persuade: Format & Layout
Sample 2What kind of document is this?
Why do you think the authorwrote this document?
What kind of information iscommunicated in a documentlike this?
How do you think format andlayout affects a reader’sExpectations and needs?

Headings help document navigation andintroduce and describe the ideas contained in each section.
• Headings should work with the table of contents to help readers find information quickly and easily
• Headings should be descriptive
Using Visuals to Inform & Persuade: Headings

From The Thomson Handbook by David Blakesley and Jeffrey Hoogeveen.Boston: Cengage/Wadsworth, 2008.
Using Visuals to Inform & Persuade: Headings

Information graphics work with text to communicate technical information
Visual content correlates to the text but serves different functions
Using Visuals to Inform & Persuade: Information Graphics

From The Thomson Handbook
Using Visuals to Inform & Persuade: Information Graphics

From The Thomson Handbook
Using Visuals to Inform & Persuade: Information Graphics

Line graphs show relationships between and among types of data
• Data in line graphs are divided into logical units plotted along the vertical and horizontal axes
Using Visuals to Inform & Persuade: Information Graphics
0
20
40
60
80
100
J ul. 07 Dec. 07 Feb. 08 Apr. 08
AsphaltConcrete
Example: The change in quantity (e.g. revenue) over time

Bar graphs show comparative relationships across a data set, correlated with a common reference point
0 50 100
J ul. 07
Dec. 07
Feb. 08
Apr. 08
ConcreteAsphalt
Using Visuals to Inform & Persuade: Information Graphics

Pie charts show the relative quantities of the components of something
• Slices in any pie chart must add up to 100%
70%
20%
10%
FederalIndianaPurdue
Using Visuals to Inform & Persuade: Information Graphics

Flowcharts include visual illustrations and arrows to show how a process unfolds over time or how one idea or action leads to another.
Process Data
DecisionManual
Operation
Document Terminator
Using Visuals to Inform & Persuade: Information Graphics
Tables are visual displays of data and enable readers to compare information and quickly view findings.
Using Visuals to Inform & Persuade: Information Graphics

Diagrams are illustrations of something that consists of parts (such as an engine)
• These illustrations provide viewers with an idea of orientation and perspective.
Using Visuals to Inform & Persuade: Information Graphics

Venn diagrams use circles or arcs to show how one thing intersects or overlaps with something else
From Learn NC: http://www.learnnc.org/reference/Venn+diagram
Using Visuals to Inform & Persuade: Information Graphics

Maps are visual illustrations of a physical space (such as a state, city, or mall) and/or are used to associate a region or idea with an event, action, or other phenomenon.
Using Visuals to Inform & Persuade: Information Graphics
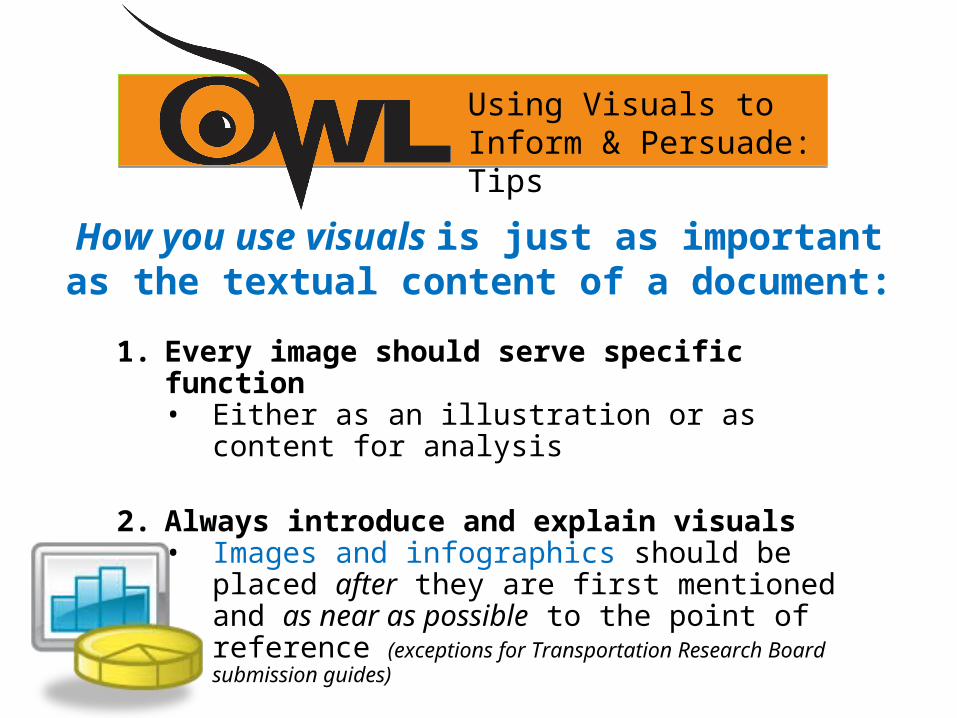
1. Every image should serve specific function• Either as an illustration or as content for
analysis
2. Always introduce and explain visuals• Images and infographics should be placed
after they are first mentioned and as near as possible to the point of reference (exceptions for Transportation Research Board submission guides)
Using Visuals to Inform & Persuade: Tips
How you use visuals is just as important as the textual content of a document:

Using Visuals, Tips (cont.):1.Caption every photograph and illustration (exceptions for specific style guides and citation methods, ex. APA, MLA, etc.)
• Captions for charts, graphs, and tables should summarize the content of the visual (follow Transportation Research Board submission guides)
2.Copyright and Permission information should accompany all images and be properly cited in the caption3.Proofread all infographics to make sure the information they convey is correct and makes sense4.Leave enough padding (white space) around the image so that the text doesn’t run up against it
Using Visuals to Inform & Persuade: Tips

Basic Principles of Graphic Design•Proximity - a way to convey meaningful relationships between elements.
• Try to put closely related images and text close to each other on the page
•Alignment - the spatial layout of elements on a page; a discernible, visual pattern.
• Try to align every object on a page with the edges of other elements to establish a pattern and relationship (unless your goal is to show discord).
Using Visuals to Inform & Persuade: Tips

Basics of Graphic Design (cont).:• Repetition - a way to show meaningful
connections among types of content, pages, or regions of a page.• Try to keep design elements (page numbers,
colors) consistent to help readers navigate documents
• Contrast - the sharp differences in color, typography, or other design elements used to highlight or prioritize information.• Try to use contrast (black font against white
paper) to help convey a clear message and/or to establish close relationships between important elements
Using Visuals to Inform & Persuade: Tips

Fonts, typefaces, and point size enhance readability
Typeface: fonts are classified as serif and sans serif
• Serif fonts have small strokes at the ends of some lines: ex. Times New Roman• Works well as a body font
• Sans serif fonts do not have these additional strokes: ex. Arial• Works well as a heading font
• Normal typeface is best for body text while special typefaces (ex. bold, italics, etc.) should be reserved for headings, titles, and other special elements
Using Visuals to Inform & Persuade: Typography

Point size:•For the body text in paper documents use 10-, 11-, or 12-point fonts•For headings vary the point size modestly•For posters and other display documents choose point sizes that will make information stand out
Using Visuals to Inform & Persuade: Typography

Research posters should catch a reader’s attention & make key information understandable.Good posters:
• Display important information at conferences
• Summarize key findings of a research or lab project (etc.)
• Tell the story of the project and provide a snapshot of its key points or features
Using Visuals to Inform & Persuade: Research Posters

From The Thomson Handbook
Using Visuals to Inform & Persuade: Research Posters

Poster Tips:1.Do your research - make sure all information is accurate2.Storyboard - create a mock-up of your poster3.Grab attention - be assertive with design by using striking (but relevant) visual elements4.Hold attention - provide useful, precise information that is legible from a short distance5.Use graphical design principles:
• Contrast• Repetition• Alignment• Proximity• Establish a color scheme that complements
content
Using Visuals to Inform & Persuade: Poster Tips

Poster Tips (cont.):6. Revise and edit – ask at least one other person to read your poster7. Using durable materials – materials should be able to survive ordinary “bumps and bruises”
a. You may want to consider printing at home and assembling on site
b. If you can, scout out print shops near the location of your presentation – just in case!
Using Visuals to Inform & Persuade: Poster Tips

Cut out and use these textual and graphical elements tocreate your own mock up on the “trifold” slide
Title: Lorem Ipsum Dolor Sit Amet Praesent Imperdiet Egestas Purus
Introduction
Method
Results
Conclusions
Lorem ipsum dolor sit amet, consectetuer adipiscing elit.
Lorem ipsum dolor sit amet, consectetuer adipiscing elit. Nam turpis nunc, rutrum eget, mattis ac, aliquet vitae, est. Quisque et neque.
- Vestibulum tincidunt eros. - Donec ut orci. - Vivamus ut erat non tellus.
Lorem ipsum dolor sit amet, consectetuer adipiscing elit.
- Vestibulum tincidunt eros. - Donec ut orci. - Vivamus ut erat non tellus.
Lorem ipsum dolor sit amet, consectetuer adipiscing elit.
Lorem ipsum dolor sit amet, consectetuer adipiscing elit. Nam turpis nunc, rutrum eget, mattis ac, aliquet vitae, est. Quisque et neque.
Using Visuals to Inform & Persuade: Poster Practice

Lorem ipsum dolor sit amet, consectetuer adipiscing elit.
Lorem ipsum dolor sit amet, consectetuer adipiscing elit. Nam turpis nunc, rutrum eget, mattis ac, aliquet vitae, est. Quisque et neque.
- Vestibulum tincidunt eros. - Donec ut orci. - Vivamus ut erat non tellus.
Lorem ipsum dolor sit amet, consectetuer adipiscing elit.
Lorem ipsum dolor sit amet, consectetuer adipiscing elit. Nam turpis nunc, rutrum eget, mattis ac, aliquet vitae, est. Quisque et neque.
- Vestibulum tincidunt eros. - Donec ut orci. - Vivamus ut erat non tellus. 0 50 100
J ul. 07
Dec. 07
Feb. 08
Apr. 08
ConcreteAsphalt
INDOT Budget
70%
20%
10%
FederalIndianaPurdue
0
20
40
60
80
100
J ul. 07 Dec. 07 Feb. 08 Apr. 08
AsphaltConcrete
Poster Practice (cont.)

Use this blank page as your trifold

Here’s what I did. How did you do?

Purdue University Writing LabHeavilon 226
Web: http://owl.english.purdue.edu/Phone: (765) 494-3723Email: [email protected]
Where to Go to Get More Help

The End
DOCUMENT DESIGN AND PRESENTATIONAdapted by Allen Brizee & Dr. David Blakesley from The Thomson Handbook by Dr. David Blakesley & Dr. Jeffrey L. HoogeveenBrought to you in cooperation with the Purdue Online Writing Lab