Indonesia Healthcare Sector 26Nov2015 - DBS Group consideration may improve the underfunded status....
34
www.dbsvickers.com ed-JS / sa- MA The pulse is on for hospitals Grand entrance of COB scheme? Further upside from strong healthcare spending Universal healthcare coverage – a game changer for the industry Prefer hospitals over pharmaceutical players Coordination of Benefits (COB) scheme – a grand entrance? BPJS Health finally issued the long awaited circular to roll-out the COB scheme pilot project in Aug 2015, which allows private insurance companies to supplement JKN using a top-up scheme. This (if implemented successfully) will be the catalyst for both non-BPJS-affiliated hospitals (boost in patient volumes) and BPJS-affiliated hospitals (margin improvement given the higher segment target). Healthcare spending to continue to grow. According to the recent 2016 state budget plan, healthcare budget is expected to increase by 43% y-o-y to Rp106.1tn (or 5% of total budget). This allocation is the highest ever and includes coverage of 92m “poor & near-poor” population under the JKN programme. Overall, Indonesia’s healthcare expenditure is expected to grow at a 12% CAGR for the next five years due to current low-base spending (lowest in the region), universal coverage and rising middle class. Universal healthcare coverage - the game changer. As of Nov 2015, there were c.155m BPJS Health members, equivalent to 65% of the total population, from 142m at the end of 2014. In terms of membership, the progress has been good so far, but this programme remains underfunded (with Rp6tn deficit expected in 2015) as we had predicted. Therefore, we can expect some tweaking to the programmes which will have an impact to the hospital and pharmaceutical industries. Switching preference to hospitals. Considering the progress of the JKN programme, we now prefer the hospital players over pharmaceuticals' due to more stable earnings outlook despite their rich valuations. The volatility in USD/IDR and regulatory issues are the current major risks for the pharmaceutical sector. Our preferred pick in this sector is Mitra Keluarga Karyasehat (MIKA IJ). We also upgraded Kalbe Farma (KLBF IJ) to BUY mainly on valuation and potential recovery in its stock price. JCI : 4,585.55 Analyst Edward Ariadi Tanuwijaya +6221 3003 4932 [email protected] Maynard P. Arif +6221 3003 4930 [email protected] STOCKS Source: DBS Vickers Mitra Keluarga Karyasehat : MIKA is Indonesia's largest private hospital operator by market cap with 12 hospitals in both Greater Jakarta and Surabaya under its portfolio Siloam International Hospitals : SILO is Indonesia's largest private hospital operator with 20 hospitals nationwide and many new hospitals in the pipeline for the next five years. Kalbe Farma : Kalbe Farma manufactures and distributes pharmaceutical, consumer health, and nutritional products. It commands the highest market share within Indonesian pharmaceutical and OTC drugs market. Universal Healthcare Coverage (JKN) roadmap Source: Roadmap to National Health Insurance 2012-2019, DBS Vickers (2012) 76.4m 30% coverage (2014) 142m 56% coverage (Aug2015) 150m 63% coverage (2019) 270m 100% coverage DBS Group Research . Equity 26 Nov 2015 Indonesia Industry Focus Indonesia Healthcare Sector Refer to important disclosures at the end of this report Price Mkt Cap Target Price Performance (%) Rp US$m Rp 3 mth 12 mth Rating Mitra Keluarga 2,505 2,666 2,900 (8.4) N.A BUY Siloam International 9,775 827 10,000 (29.1) (31.3) HOLD Kalbe Farma 1,350 4,628 1,600 (15.7) (24.6) BUY
Transcript of Indonesia Healthcare Sector 26Nov2015 - DBS Group consideration may improve the underfunded status....

www.dbsvickers.com
ed-JS / sa- MA
The pulse is on for hospitals Grand entrance of COB scheme?
Further upside from strong healthcare spending
Universal healthcare coverage – a game changer for the industry
Prefer hospitals over pharmaceutical players Coordination of Benefits (COB) scheme – a grand entrance? BPJS Health finally issued the long awaited circular to roll-out the COB scheme pilot project in Aug 2015, which allows private insurance companies to supplement JKN using a top-up scheme. This (if implemented successfully) will be the catalyst for both non-BPJS-affiliated hospitals (boost in patient volumes) and BPJS-affiliated hospitals (margin improvement given the higher segment target).
Healthcare spending to continue to grow. According to the recent 2016 state budget plan, healthcare budget is expected to increase by 43% y-o-y to Rp106.1tn (or 5% of total budget). This allocation is the highest ever and includes coverage of 92m “poor & near-poor” population under the JKN programme. Overall, Indonesia’s healthcare expenditure is expected to grow at a 12% CAGR for the next five years due to current low-base spending (lowest in the region), universal coverage and rising middle class.
Universal healthcare coverage - the game changer. As of Nov 2015, there were c.155m BPJS Health members, equivalent to 65% of the total population, from 142m at the end of 2014. In terms of membership, the progress has been good so far, but this programme remains underfunded (with Rp6tn deficit expected in 2015) as we had predicted. Therefore, we can expect some tweaking to the programmes which will have an impact to the hospital and pharmaceutical industries.
Switching preference to hospitals. Considering the progress of the JKN programme, we now prefer the hospital players over pharmaceuticals' due to more stable earnings outlook despite their rich valuations. The volatility in USD/IDR and regulatory issues are the current major risks for the pharmaceutical sector. Our preferred pick in this sector is Mitra Keluarga Karyasehat (MIKA IJ). We also upgraded Kalbe Farma (KLBF IJ) to BUY mainly on valuation and potential recovery in its stock price.
JCI : 4,585.55
Analyst Edward Ariadi Tanuwijaya +6221 3003 4932 [email protected] Maynard P. Arif +6221 3003 4930 [email protected]
STOCKS
Source: DBS Vickers Mitra Keluarga Karyasehat : MIKA is Indonesia's largest private hospital operator by market cap with 12 hospitals in both Greater Jakarta and Surabaya under its portfolio
Siloam International Hospitals : SILO is Indonesia's largest private hospital operator with 20 hospitals nationwide and many new hospitals in the pipeline for the next five years.
Kalbe Farma : Kalbe Farma manufactures and distributes pharmaceutical, consumer health, and nutritional products. It commands the highest market share within Indonesian pharmaceutical and OTC drugs market.
Universal Healthcare Coverage (JKN) roadmap
Source: Roadmap to National Health Insurance 2012-2019, DBS Vickers
(2012)
76.4m
30% coverage
(2014)
142m
56% coverage
(Aug2015)
150m
63% coverage
(2019)
270m
100% coverage
DBS Group Research . Equity 26 Nov 2015
Indonesia Industry Focus
Indonesia Healthcare Sector
Refer to important disclosures at the end of this report
Price Mkt Cap Target Price Performance (%)
Rp US$m Rp 3 mth 12 mth Rating
Mitra Keluarga 2,505 2,666 2,900 (8.4) N.A BUY Siloam International 9,775 827 10,000 (29.1) (31.3) HOLD Kalbe Farma 1,350 4,628 1,600 (15.7) (24.6) BUY

Industry Focus
Indonesia Healthcare Sector
Page 2
The healthcare reform - fair progress with more
challenges ahead
BPJS Health (or BPJS Kesehatan) is the social security agency acting as facilitator with main functions of pooling members’ premiums and making payments to healthcare providers for services provided to members under the universal healthcare scheme (JKN). The progress towards full coverage by 2019 is encouraging (refer to the chart on page 1). According to some sources, as of Nov 2015, there were c.155m BPJS Health members, equivalent to 65% of the total population vs. 142m in 2014. Monitoring the membership growth
Despite the encouraging growth in BPJS Health memberships, we will continue to monitor the progress of membership growth next year. We believe that the current surge in memberships was mostly due to “low hanging fruit” memberships : 1) conversion from previous scheme (i.e. ASKES – public sector workers); and 2) participation from formal/regular employees. Going forward, it would be a challenge to secure more membership from “difficult-to-track” informal employees (including casual employees), which form 62% of the total working employment in Indonesia. On the funding side, as we had predicted in our previous report on 24 Jun 2014 titled Long road to good health, JKN is underfunded. BPJS Health experienced a Rp3.3tn deficit in 2014 and according to estimates by BPJS officials, the deficit in 2016 may widen to about three times the amount in 2014. Indonesia’s working population and unemployment
rate
Source: Statistics Indonesia (BPS), DBS Vickers
Regular vs informal employees in working population
Source: Statistics Indonesia (BPS), DBS Vickers Note: Informal employees include casual employees.
Indonesia’s labour force - latest breakdown
Source: Statistics Indonesia (BPS), DBS Vickers In order to prevent the deficit from ballooning in the future, the government issued regulation no. 48/2015, and will inject Rp3.46tn into BPJS Health, to be taken from the state budget 2015. In addition, the premium for BPJS is reviewed once every two years, according to Presidential decree no. 111/2013. The premium payable is up for evaluation in 2016 and careful consideration may improve the underfunded status. Is the long-awaited Coordination of Benefits (COB)
scheme here and running?
BPJS Health has issued a circular for rolling-out the Coordination of Benefits (COB) scheme pilot project in Aug 2015. This is a co-payment scheme that allows private insurance companies to supplement JKN.
5.5%
6.0%
6.5%
7.0%
7.5%
104
106
108
110
112
114
116
2010 2011 2012 2013 2014
Working population (LHS)Unemployment rate (RHS)
m population
37.8 40.9 41.1 43.4
62.4 60.4 60.4 59.7
0
20
40
60
80
100
120
2011 2012 2013 2014
Regular employees Informal employeesm population
Regular employees
35.6%
Casual employees
9.4%
Informal employees
49.0%
Unemployed5.9%

Industry Focus
Indonesia Healthcare Sector
Page 3
The implications from the effective roll-out of the pilot COB scheme are:
Improvement in patient volumes for hospitals that are not BPJS-affiliated like Mitra Keluarga (MIKA IJ). Without the COB scheme, patients (who want to tap on the JKN programme) are restricted to public hospitals and BPJS-affiliated private hospitals.
Margin improvement for BPJS-affiliated private hospitals such as Siloam Hospitals (SILO IJ), mainly from upgrades from standard JKN fees and services.
More subscribers for private insurance companies. The industry is still very much underpenetrated, with only an estimated 8m subscribers or just around 3% of total population.
However, despite the issue of the circular and the expanded list of private insurers and non-BPJS hospitals participating in this COB scheme, we have not seen the finer details on the implementation of COB, which has been the main issue between BPJS and private insurers for the past few years. Growing healthcare spending – starting from low base...
Indonesia’s healthcare expenditure at 2.9% of GDP is one of the lowest in the region and below ASEAN countries’ average of 4%, despite growing at 14% CAGR for the last five years. According to Business Monitor International, Indonesia’s healthcare expenditure is expected to continue to grow at 12% CAGR for the next five years (slightly higher-than-expected nominal GDP growth), primarily driven by private expenditure (which currently contributes c.62% of total healthcare expenditure) rather than government spending; despite the progress on much heralded JKN implementation. Indonesia’s healthcare spending
Source: WHO, Business Monitor International (BMI)
Indonesia is among the lowest healthcare spender
Source: CIA World Factbook Private remains the driver of healthcare expenditure
Source: WHO, DBS Vickers. ... with increasing commitment from government
Recent 2016 state budget draft has allocated Rp106.1tn healthcare budget (or 5% of total budget), a staggering 43% y-o-y increase. This allocation on healthcare matters is the highest ever and includes coverage of 92m “poor & near-poor” population under the JKN programme. Healthcare budget trend
Source: Ministry of Finance, State-budget (APBN), DBS Vickers
160 183
212
250
279
311
-
50
100
150
200
250
300
350
2009 2010 2011 2012 2013 2014
Rp tr
14.2% CAGR
2.9%
0%
1%
2%
3%
4%
5%
6%
7%
8%
9%
10%
Jap
an
So
uth
Ko
rea
Vie
tna
m
Ca
mb
od
ia
Ch
ina
Sin
ga
po
re
Ph
ilip
pin
es
Th
aila
nd
Ind
ia
ASE
AN
Ma
laysi
a
Ind
on
esi
a
La
os
Bru
ne
i
Mya
nm
ar
% of GDP
64 66 81 99 109
119 131
96 117
132
151
170 192 216
-
50
100
150
200
250
300
350
400
2009 2010 2011 2012 2013 2014 2015F
Government PrivateRptr
13.3% CAGR
14.8% CAGR
106.1
5.0%
2.0%
2.5%
3.0%
3.5%
4.0%
4.5%
5.0%
5.5%
0
20
40
60
80
100
120
2010 2011 2012 2013 2014 2015 2016
Healthcare budget (LHS)
As % of total budget (RHS)
Rp tr

Industry Focus
Indonesia Healthcare Sector
Page 4
HOSPITAL SECTORS Stronger growth in private hospitals to serve healthcare
needs
According to data from the Ministry of Health, there are a total of 2,457 hospitals in Indonesia currently. The increase in private hospitals; both profit and non-profit; (19.1% CAGR in the past three years) has grown faster and now outnumber the number of public hospitals with 61% market share. Number of hospitals (private vs public)
Source: Ministry of Health, DBS Vickers Breakdown of public and private hospitals
Source: Ministry of Health, DBS Vickers Indonesia hospitals - breakdown by ownership
Source: Ministry of Health, DBS Vickers
There has been a staggering increase in the number of hospital beds (20.6% CAGR in the past four years) into the healthcare sector in Indonesia. Investment into this sector is seen as attractive, given that the number of beds of 12.2 per 10,000 population is still below ASEAN’s average of 15.8 per 10,000 population. Hospitals beds grew at 20.6% CAGR (in four years)
Source: Ministry of Health, DBS Vickers Beds per 10,000 population – regional comparison
Source: Ministry of Health, DBS Vickers Out-of-pocket expenditure is the highest portion
Source: Worldbank data, DBS Vickers
828 888 907 947
893
1,1951,337
1,510
0
500
1,000
1,500
2,000
2,500
3,000
2012 2013 2014 2015-YTD
Public Private
4.6% CAGR
19.1% CAGR
1,721
2,0832,244
2,457
48% 43% 40% 39%
52% 57% 60% 61%
0%
10%
20%
30%
40%
50%
60%
70%
80%
90%
100%
2012 2013 2014 2015-YTD
Public Private
Ministry of Health & other
ministries1.7%
Gov't (provincial,
district, municipal)
28.7%
Military & Police6.8%
State-owned2.6%
Private61.4%
144,410170,656
238,373273,762
305,744
6.0
7.0
9.7
10.9
12.2
4.0
5.0
6.0
7.0
8.0
9.0
10.0
11.0
12.0
13.0
100,000
150,000
200,000
250,000
300,000
350,000
2010 2011 2012 2013 2014
Beds (LHS) Beds / 10,000 population (RHS)
2827
2221
1815.8
12.210
7 76
0
5
10
15
20
25
30
38% 40% 40%32% 35% 40% 40% 40% 36% 34% 40% 39% 38%
45% 44% 45% 54% 52% 49% 48% 48%48% 50% 45% 46% 46%
17% 16% 16% 14% 13% 12% 11% 12% 15% 16% 15% 15% 15%
0%
10%
20%
30%
40%
50%
60%
70%
80%
90%
100%
2002 2003 2004 2005 2006 2007 2008 2009 2010 2011 2012 2013 2014
Government Private - out of pocket Private - other source

Industry Focus
Indonesia Healthcare Sector
Page 5
PHARMACEUTICAL SECTOR Prescription drugs remain the driver for pharmaceuticals
Pharmaceutical sales rose by respectable 9% CAGR in the past five years to Rp70.4tn and contributed 23% of total healthcare expenditure. The strong growth is mainly driven by prescription drugs, including patented and generic drugs with 11.8% and 11.2% CAGR, respectively for the same period; offset by slower growth in OTC market (only 5.8% CAGR in past five years). OTC products are regarded as “preventive” medicines. Therefore, these are popular in Indonesia given the low purchasing power and limited availability of prescription drugs. However, the roll-out of JKN programme could further increase the contribution of prescription drugs especially generic ones when all Indonesians are covered in 2019. Declining contribution from OTC drug sales
Source: Roadmap to National Health Insurance 2012-2019 JKN to drive growth especially generic drugs The progressive roll-out of JKN is expected to further boost the sales volume of generic drugs (albeit lower sales value) from 2015 onwards as the coverage is expected to expand from c.155m now (65% of total population) to full coverage of over 250m population in 2019. Growth in generic drug market
Source: IMS Health, Kimia Farma presentation, DBS Vickers
According IMS Health, generic drug sales in Indonesia grew by 11.2% CAGR from 2011 to 2015 and reached Rp60.5tn in 2015. The growth is pretty much driven by volume given that there have been no price adjustments on generic drugs since 2012. Pharmaceutical companies must adapt to changing
landscape. While the roll-out of JKN provides volume growth opportunities, pharmaceutical companies must cope with the changing landscape on the industry, i.e. the shift toward more generic drugs (especially unbranded generic ones). Major impact on pharmaceutical sector from the roll-out of JKN programme:
Compulsory use of generic drugs, whenever possible. Patients under the JKN scheme (including COB) do not have much choice, otherwise they will not be reimbursed by the scheme.
The cap on ceiling prices of generic medicines have been set under Ministry of Health Decree no. 092/MENKES/SK/11/2012, which means that pharmaceutical companies’ margins are dependent on government’s pricing policies.
Shift in distribution channel, as registered hospitals and clinics slowly take over as the main distribution channels from physicians and pharmacies. In addition, the introduction of e-procurement for generic drugs by the government will aid this apparent shift too.
As such, pharmaceutical companies with large production capacities and networks hold advantages as benefits from economies of scale would enable them to have better control over costs, and hence be in a better position to win procurement tenders conducted by the government for the supply of generic medicines. Furthermore, pharmaceutical companies have to look for opportunities in niche markets, where there are no generic substitutes. For example, branded drugs used in oncology. This niche market opportunity should offer a platform for pharmaceutical companies to maintain their high profitability going forward.
17.5% 17.5% 17.9% 18.4% 19.3% 19.9% 20.4%
37.7% 39.4% 40.0% 40.5% 41.1% 41.6% 42.1%
44.8% 43.1% 42.1% 41.1% 39.7% 38.5% 37.5%
0%
10%
20%
30%
40%
50%
60%
70%
80%
90%
100%
2009 2010 2011 2012 2013 2014 2015F
Patented drug Generic drug OTC
2.7 3.4 4.1 4.8 5.6
21.1 23.6
26.0 27.9 30.6
15.7 18.3
21.0 22.8
24.3
0
10
20
30
40
50
60
70
2011 2012 2013 2014 2015
Unbranded Ethical Free salesRptr
11.2% CAGR

Industry Focus
Indonesia Healthcare Sector
Page 6
What to look out for in the pharmaceutical sector in 2016:
Price adjustments on generic drugs. The cap on ceiling prices has not been revised since 2012 despite the increase in raw material costs (due to US$ appreciation). The International Pharmaceutical Manufacturing Group (IPMG) has been pressuring the government to revise the Ministry of Health Decree and there is a possibility that this issue will be discussed and revised next year.
Impact on USD/IDR rate volatility. Note that the basic chemical industry is still inadequate and very underdeveloped in Indonesia. Hence, 90% of raw materials for medicines in Indonesia are imported. Between the end of 2012 and now, the IDR has depreciated by a staggering 40%.
IDR has been weakening against the USD
Source: Bloomberg Finance L.P Government policies. Changes in regulations such as
negative investment lists, patents, price ceilings and anti-trusts should impact the pharmaceutical industry as a whole.
Another risk to highlight for pharmaceutical players is the impact from Law no. 33/2014 (effective since 17 Oct 2014) on Halal Product assurance. This law requires all pharmaceutical products to be halal certified by 2019. Given the nature of the pharmaceutical industry, in which 90% of raw materials are imported, it is virtually impossible for pharmaceutical companies to obtain the certification. IPMG (International Pharmaceutical Manufacturers Group) has since tried to negotiate with the government to exempt pharmaceutical products.
8,000
9,000
10,000
11,000
12,000
13,000
14,000
15,000
Jan-12 Jul-12 Jan-13 Jul-13 Jan-14 Jul-14 Jan-15 Jul-15

Industry Focus
Indonesia Healthcare Sector
Page 7
Valuations are not cheap due to scarcity and liquidity
There are only a limited number of listed companies in Indonesia in these two sectors. Hence, the stocks are trading at premium valuations due to scarcity of options (please refer to valuation table on APPENDIX).
Pharmaceuticals: Kalbe Farma (KLBF IJ), Kimia Farma (KAEF IJ), Indofarma (INAF IJ), Tempo Scan Pacific (TSPC IJ) and Sido Muncul (SIDO IJ).
Hospitals: Mitra Keluarga Karyasehat (MIKA IJ), Siloam Hospitals (SILO IJ), Sarana Meditama Metropolitan – Omni Hospital (SAME IJ) and Sejahteraraya Anugrahjaya - Mayapada Hospitals (SRAJ IJ).
Pharmaceutical companies are trading at 15-27x FY16 PE with KLBF at the high end of the range due to its market leadership and great execution history. Hospital stocks are also trading at sky-high valuations and by far, Indonesia's hospitals are the most expensive in the region due to growth prospects as well as scarcity and liquidity issues. Switch preference to hospitals despite rich valuations Both health services and pharmaceuticals are direct beneficiaries of the successful implementation of the JKN programme. With the roll-out of the JKN programme and the volatility in USD/IDR movements, we believe hospital players with conservative growth strategy and sustainable earnings have better risk/reward potential than pharmaceuticals despite their lofty valuations. Hospital developers and operators (both BPJS-affiliated and non-BPJS-affiliated) have positioned themselves well to rake in extra revenue from the JKN programme and the COB scheme pilot project. Hospital players face risks such as the capital intensive nature of their business and shortage of relevant human resources that can limit their future growth. On the other hand, pharmaceutical players should see a boost in volume sales from the generic drugs segment. However, margin pressure is inevitable as generic drugs generate low margins and have price ceiling caps (regulated by Ministry Health Decree). In addition, the current weakness in IDR has made it tougher for these companies to maintain margins as raw material costs have increased. Our pick is MIKA over SILO for its more conservative growth, solid margin and strong balance sheet. Together with this report, we initiate coverage on MIKA with a BUY recommendation and Rp2,900 TP, based on DCF valuations on
its existing hospitals and new hospital in the pipeline, implying 45x EV/EBITDA on 2016 forecast. Potential upside to our valuation will be from better-than-expected growth in the number of patients and exceptional operational performance from its existing and new hospitals. MIKA is an established private hospital franchise with a track record exceeding 25 years. MIKA is focusing on building hospitals in good population catchment areas to serve the surrounding communities. MIKA prefers to grow organically and at a conservative pace and thus maintain its profitability despite being in a great position to tap into Indonesia’s underpenetrated healthcare sector and the country’s rising healthcare needs. We also upgraded KLBF to BUY from HOLD with Rp1,600 TP (implying 18% upside from current price). Our upgrade is mainly due to valuation as KLBF's stocks are now trading close to its 5-year mean PE (at 26x FY16 EPS) with potential stock recovery. Volatility in USD/IDR will still be a concern in 2016. However, we believe it is largely priced-in, given that the stock has underperformed the consumer space and the operational suspension on some parts of its manufacturing line should be over by 2016.

Industry Focus
Indonesia Healthcare Sector
Page 8
A lesson from Thailand’s Universal Coverage Scheme
(UCS)
There is no blueprint available on how to achieve successful implementation of the universal healthcare coverage, however, Thailand’s universal coverage experience should provide valuable lessons for Indonesia. Thailand launched the UCS programme in 2001 (funded with general tax revenues) and achieved universal coverage in such short period of time in 2002. The scheme was expanded rapidly, by succesfully registering 47m people (75% of population) in the new scheme and finding public resources to cover the 18m who were previously uninsured and members of two existing publicly subsidised schemes (i.e. Social Security Scheme and Civil Servant Medical Benefit Scheme). Government spending made up more than 80% of
healthcare spending
Source: data.worldbank.org, DBS Vickers According to Health Insurance System Research Office report for independent assessment of the first 10 years (2001-2010), the three features that defined Thailand’s UCS are: 1) A tax-financed scheme free at the point of service (initial co-payment of just THB 30 per visit or admission; terminated in November 2006 due to budget constraint); 2) A comprehensive benefits package with a focus on primary care; and 3) A fixed annual budget with a cap on provider payments. The government’s commitment to support the UCS is critical with steady increase in budget allocation. Thailand’s general government expenditure on health increased from THB 84.5bn in 2001 (when UCS was launched) to THB 116.3bn in 2002 (the 1st full year of UCS implementation) and THB 247.7bn in 2008. The commitment is further evidenced in 2009 when GDP fell 2%, but the Thai government found a way to obtain resources to continue funding the scheme by cutting spending at all ministries. Total health expenditure as a percentage of GDP has
been improving but was relatively stable because of steady growth in Thailand’s GDP as well (at 9% CAGR).
Healthcare expenditure as % of GDP
Source: data.worldbank.org, DBS Vickers The number of UCS members has remained stable at 47m over 10 years since 2002, but UCS’s capitation per capita budget has more than doubled from THB 1,201.4 in 2002 to THB 2,693.5 in 2011. The increase was mainly due to rising labour and material costs of providing medical and health services. Thailand’s UCS capitation budget per capita
Source: NHSO, Health Insurance System Research Online (an independent assessment of the first 10 years) According to the same report by Health Insurance System Research Office, there are a few challenges that need to be sorted out for the betterment of UCS programme such as segregation duties between NHSO and Ministry of Publich Health (MOPH), harmonisation between UCS & two existing public health insurances schemes and inequitable redistribution of healthcare professionals (which are highly concentrated in central region and large urban centres).
63.5 63.8 64.9 64.472.7 76.3 75.9 74.2 74.6 77.7 79.5 80.1
27.2 26.9 26.1 27.217.4 14.5 14.7 15.4 14.2 12.4 11.6 11.3
9.3 9.3 9.0 8.4 9.9 9.2 9.4 10.4 11.2 9.9 8.9 8.6
0%
10%
20%
30%
40%
50%
60%
70%
80%
90%
100%
2002 2003 2004 2005 2006 2007 2008 2009 2010 2011 2012 2013
Gov't Private - out of pocket Private - others
3
4
5
0
50
100
150
200
250
300
2002 2003 2004 2005 2006 2007 2008 2009 2010 2011 2012 2013
Healthcare expenditure per capita - LHS
Healthcare expenditure (as % of GDP) - RHS
THB %
0
500
1,000
1,500
2,000
2,500
3,000
2002 2003 2004 2005 2006 2007 2008 2009 2010 2011
THB per capita

Industry Focus
Indonesia Healthcare Sector
Page 9
APPENDIX Pharmaceutical valuations - comparison among domestic peers
BB Ticker
Company name
Market cap PE(x) PB(x) Div. Yield ROE
US$m 14A 15F 16F 14A 15F 16F % %
KLBF IJ Kalbe Farma 4,509.2 30.0 29.5 26.5 7.6 6.6 5.8 1.3 25.3
KAEF IJ Kimia Farma 402.7 22.9 21.2 17.8 3.3 NA NA NA 14.6
TSPC IJ Tempo Scan Pacific 550.9 13.7 13.6 12.4 1.7 1.7 1.6 3.6 13.2
SIDO IJ Sido Muncul 612.2 19.7 17.1 14.9 3.2 2.9 2.7 3.1 16.6
Weighted average
27.0 26.3 23.5 6.4 5.3 4.7 1.6
Source: DBS Vickers, Bloomberg Finance L.P. Note: Price as of 23 Nov 2015 close
Hospital valuations - comparison among regional peers
BB Ticker Company name Market cap EV/EBITDA(x) PE(x) PB(x) Div. Yield ROE
US$m FY15F FY16F FY15F FY16F FY15F FY16F % %
MIKA IJ Equity Mitra Keluarga Karyasehat
2,746.4 48.4 40.2 64.8 52.4 11.7 10.5 0.8 30.1
SILO IJ Equity Siloam International Hospitals
798.3 16.8 12.1 99.4 77.6 6.2 5.8 n/a 3.8
SAME IJ Equity Sarana Meditama Metropolitan
213.3 20.8 17.0 51.8 56.6 12.1 10.6 0.3 26.5
SRAJ IJ Equity Sejahteraraya Anugrahjaya
137.5 n/a n/a n/a n/a n/a n/a n/a n/a
BH TB Equity Bumrungrad Hospital 4,406.7 28.1 25.1 44.8 38.9 12.4 10.5 1.1 26.2
BCH TB Equity Bangkok Chain 566.4 18.5 16.3 42.4 36.1 4.5 4.2 1.4 11.4
RFMD SP Equity Raffles Medical 1,696.6 24.6 23.1 33.8 31.3 4.1 3.8 1.4 13.4
IHH SP Equity IHH Healthcare 11,821.2 24.8 21.4 56.0 46.0 2.5 2.4 0.6 4.0
KPJ MK Equity KPJ Healthcare 1,026.0 15.3 13.6 30.1 27.4 3.2 3.0 1.7 11.2
APHS IN Equity Apollo Hospitals Enterprise
2,823.7 23.3 19.3 47.2 37.6 5.4 4.8 0.5 11.1
FORH IN Equity Fortis Healthcare 1,122.0 28.2 18.0 66.6 32.5 1.7 1.6 n/a -3.5
RHC AU Equity Ramsay Healthcare 19,116.4 13.2 12.1 29.5 25.8 6.9 6.2 1.8 24.3
SHL AU Equity Sonic Healthcare 11,632.2 11.9 11.0 17.9 16.6 2.4 2.3 4.0 10.9
PRY AU Equity Primary Healthcare 2,366.8 7.3 7.0 13.9 12.7 0.7 0.7 5.2 5.7
Market weighted average
Indonesia 38.7 31.8 68.9 55.9 10.2 9.2 0.6 23.5
Thailand 27.0 24.1 44.5 38.6 11.5 9.8 1.1 24.5
Singapore 24.7 21.6 53.2 44.2 2.7 2.6 0.7 5.2
Malaysia 15.3 13.6 30.1 27.4 3.2 3.0 1.7 11.2
India 24.7 18.9 52.7 36.2 4.3 3.9 0.3 6.9
Australia 12.3 11.3 24.3 21.6 4.9 4.4 2.8 18.3
Source: DBS Vickers, Bloomberg Finance L.P. Note: * Bloomberg consensus estimate. Price as of 23 Nov 2015 close

Industry Focus
Indonesia Healthcare Sector
Page 10
List of non-BPJS-affiliated private hospitals participating in COB scheme
No. Hospital Name Region
1 Mitra Keluarga Bekasi Hospital Bekasi - East Jakarta suburb
2 Puri Cinere Public Hospital Depok - South Jakarta suburb
3 Siloam Kebon Jeruk Hospital West Jakarta
4 Mitra Kemayoran Hospital Central Jakarta
5 Pondok Indah Hospital South Jakarta
6 MMC Hospital South Jakarta
7 Mitra International Hospital East Jakarta
8 Pantai Indah Kapuk Hospital North Jakarta
9 JIH Hospital Sleman - Central Java
10 Premier Surabaya Hospital Surabaya - East Java
11 Premier Bintaro Hospital South Tangerang - West Jakarta suburb
Addition as of 1 July 2015
12 Meilia Hospital East Jakarta
13 Awal Bros Bekasi Hospital Bekasi - East Jakarta suburb
14 Mitra Kelaurga Depok Hospital Depok - South Jakarta suburb
15 St. Antonius Hospital Pontianak - West Kalimantan
16 Santa Maria Hospital Pekanbaru - Riau
17 Catherine Booth Hospital Makassar - Southeast Sulawesi
18 Columbia Asia Medan Hospital Medan - North Sumatra
19 Ciputra Hospital Tangerang - West Jakarta suburb
20 Eka Hospital Tangerang - West Jakarta suburb
21 JEC Menteng Hospital Central Jakarta
22 Mata AINI Hospital South Jakarta
23 Mayapada Hospital South Jakarta
24 Pusat Pertamina Hospital South Jakarta
Source: BPJS, Ministry of Health

Industry Focus
Indonesia Healthcare Sector
Page 11
List of insurance companies cooperating with BPJS Health as of May 2015
No Name of Insurance Companies No Name of Insurance Companies
1 PT Asuransi Sinar Mas 27 PT Asuransi Jiwa Inhealth Indonesia 2 PT Asuransi Mitra Maparya Tbk 28 PT Asuransi Jiwa Tugu Mandiri 3 PT Lippo General Insurance 29 PT AXA Financial Indonesia 4 PT Arthagraha General Insurance 30 PT AXA Mandiri Financial Service 5 PT Asuransi Astra Buana 31 PT Avrist Assurance 6 PT Asuransi Umum Mega 32 PT Asuransi Jiwa Central Asia Raya 7 PT Asuransi Bina Dana Arta Tbk 33 PT Asuransi Takaful Keluarga 8 PT Tugu Pratama Indonesia 34 PT Asuransi Jiwasraya (Persero) 9 PT Asuransi Multi Artha Guna Tbk 35 PT Asuransi Jiwa Sinarmas MSIG
10 PT Asuransi Central Asia 36 PT Asuransi Jiwa Generali Indonesia 11 PT Bosowa Asuransi 37 PT AIA Financial 12 PT Asuransi Indraputra 38 PT Asuransi Jiwa Recapital 13 PT Asuransi Bintang Tbk 39 PT Asuransi Allianz Life Indonesia 14 PT Asuransi Jasa Indonesia (Persero) 40 PT Astra Aviva Life 15 PT Asuransi Bangun Askrida 41 Pt Asuransi Jiwa Bringin Jiwa Sejahtera 16 PT Asuransi Axa Indonesia 42 PT Equity Life Indonesia 17 PT Citra International Underwriters 43 PT Great Eastern Life Indonesia 18 PT Asuransi Reliance Indonesia 44 PT MNC Life Assurance 19 PT Asuransi Dayin Mitra Tbk 45 PT Asuransi Jiwa Adisarana Wanaartha 20 PT Asuransi Adira Dinamika 46 PT Tokio Marine Life Insurance Indonesia 21 PT Pan Pacific Insurance 47 PT Asuransi Jiwa Manulife Indonesia 22 PT Asuransi Samsung Tugu 48 PT ACE Life Insurance 23 PT Asuransi Umum Bumi Putera Muda 1967 49 PT Hanwa Life Insurance Indonesia 24 PT Victoria Insurance 50 PT Kresna Life 25 PT Asuransi Ramayana 51 PT BNI Life Insurance 26 PT AJB Bumi Putera 1912 52 PT Asuransi Jiwa Sequis Financial
Source: BPJS, Ministry of Health

Industry Focus
Indonesia Healthcare Sector
Page 12
Regulations for pharmaceutical sector
Regulation Regarding Important points Remarks
1 Health Ministry regulation no. 1799/MENKES/PER/XII/2010
Pharmacy Industry
1. Pharmaceutical company has to obtain license from Health Minister to produce drugs and/or drug ingredients. 2. Pharmaceutical company has the following functions: manufacturing; educating and training; research and development. 3. A licensed pharmaceutical company has to be a limited company and have at least 3 pharmacists (Indonesia citizens) for quality assurance, production and quality control. 4. A licensed pharmaceutical company must produce report activities (including production volume and value) every 6 months.
2 Health Ministry regulation no. 1120/MENKES/PER/XI/2008 Drug registration
1. Every drug circulated in Indonesia must be registered and licensed for marketing (valid and renewable every 5 years). 2. Locally produced drug can only be registered by a licensed pharmaceutical company. (Pharmaceutical company is licensed by Health Minister) 3. Imported drug registration can be registered by local pharmaceutical company which has written approval from foreign pharmaceutical. 4. Pharmaceutical company has to market the registered drugs within 1 year of approval date. 5. Penalties & suspensions for violating regulations.
Revision of Health Ministry regulation no. 1010/MENKES/PER/XI/2008
3 Health Ministry decree no. 312/MENKES/SK/IX/2013
National essential drugs list
Contains a list of national essential drugs with guidance on usage and management
Revision of Health Ministry decree no. 2500/MENKES/SK/XII/2011
4 Health Ministry decree no. 436/MENKES/SK/XI/2013 Generic drug price
Contains a list of generic drug in Indonesia together with retail price ceiling
Revision of Health Ministry decree no. 092/MENKES/SK/II/2012
5 Presidential decree no. 39/2014 Negative investment list (DNI)
Maximum foreign ownership increased to 85% from 75% previously
Revision of Presidential decree no. 36/2010
6 Law no 33/2014 Halal Product Assurance
Pharmaceutical products must be Halal certified by 2019
Source: Ministry of Health, DBS Vickers

Industry Focus
Indonesia Healthcare Sector
Page 13
Regulations for hospital sector
Regulation Regarding Important points
1 Law no. 44 / 2009 Hospital operation
1. Defining hospitals duties and functions. 2. Infrastructure and facility requirements of operational hospitals. 3. Classification of hospitals based on type of services and management. (Refer to previous table of hospital classification). 4. Each hospital has to have construction permit (for a period of 2 years and extendable for another 1 year) and operational license (valid & renewable every 5 years). Both can be revoked during period of validity. 5. National tariff scheme is set by Health Ministry. 6. Penalties for violating regulations
2 Health Ministry regulation no. 147/MENKES/PER/I/2010
Hospital license
3 Law no. 29 / 2004 Medical practitioner 1. Valid registration for medical practice is issued by Indonesia medical council. 2. Doctor and dentist registration letter and license to practice is valid, renewable every 5 years and can be revoked during period of validity. 3. Each doctor and dentist is granted licenses to practice maximum in three places (including gov't, private and individual practice). 4. Defining medical practitioner obligations, patient rights and obligations 5. Foreign graduates who intend to have medical practice in Indonesia should possess work permit, proficient in Bahasa Indonesia and passed Indonesia medical council evaluation. 6. Foreign medical practitioner can only practice as a means of knowledge and technology transfer and is prohibited to practice independently. 7. Foreign medical practitioner license to practice is valid, renewable every 1 year and can be revoked during period of validity. 8. Foreign medical practitioner can only practice on either class A or B hospitals. 9. Penalties for violating regulations
4 Health Ministry regulation no. 2052/MENKES/PER/X/2011 Medical practitioner license
5 Health Ministry regulation no. 317/MENKES/PER/III/2010
Foreign nationals health personnels
6 Health Ministry regulation no. 69/2013
Standard tariff rates for healthcare services (first-level and advanced) in national health insurance program
List of standard tariff for each category of healthcare service
7 Presidential decree no. 39/2014 Negative investment list (DNI) 1. Maximum foreign ownership is 67% for all over Indonesia. 2. Maximum foreign (only ASEAN countries) ownership is 70% for investment in East Indonesia capital cities, except for Makassar and Manado.
Source: Ministry of Health, DBS Vickers

Industry Focus
Indonesia Healthcare Sector
Page 14
Stock Profiles

ASIAN INSIGHTS VICKERS SECURITIES www.dbsvickers.com ed: TH / sa: MA
BUY Last Traded Price: Rp2,505 (JCI : 4,585.55) Price Target : Rp2,900 (16% upside) Potential Catalyst: Potential higher patient volume from Coordination of Benefits (COB) scheme implementation Where we differ: Premium valuation and better earnings growth than company guidance Analyst Edward Ariadi Tanuwijaya +6221 3003 4932 [email protected]
Price Relative
Forecasts and Valuation FY Dec (Rp bn) 2014A 2015F 2016F 2017F Revenue 1,946 2,280 2,667 3,155 EBITDA 615 731 881 1,046 Pre-tax Profit 667 844 1,031 1,172 Net Profit 517 582 719 812 Net Pft (Pre Ex.) 517 582 719 812 Net Pft (ex. BA gains) N/A N/A N/A N/A EPS (Rp) 37 40 49 56 EPS Pre Ex. (Rp) 37 40 49 56 EPS Gth (%) (87) 7 24 13 EPS Gth Pre Ex (%) (87) 7 24 13 Diluted EPS (Rp) 37 40 49 56 Net DPS (Rp) 34 21 24 30 BV Per Share (Rp) 126 222 247 273 PE (X) 67.0 62.7 50.7 44.9 PE Pre Ex. (X) 67.0 62.7 50.7 44.9 P/Cash Flow (X) 52.9 49.5 53.5 39.3 EV/EBITDA (X) 54.9 46.7 38.8 32.7 Net Div Yield (%) 1.4 0.9 1.0 1.2 P/Book Value (X) 19.9 11.3 10.1 9.2 Net Debt/Equity (X) CASH CASH CASH CASH
ROAE (%) 30.1 23.4 21.1 21.5
Earnings Rev (%): - - - Consensus EPS (Rp): N/A N/A N/A Other Broker Recs: B: 6 S: 0 H: 2
Source of all data: Company, DBS Vickers, Bloomberg Finance L.P
Steady And Reliable In the Long Run
Initiate coverage with BUY call and Rp2,900 TP. Our TP is based on DCF valuation of existing and new hospitals in the pipeline and implies 45x EV/EBITDA (expensive as compared to regional peers), mostly due to commanding scarcity premium. Potential upside to our valuation will be from the better-than-expected patient volume growth and exceptional operational performance from its existing and new hospitals.
Largest private hospital operator by market cap with sustainable growth. MIKA currently operates 12 hospitals (with 1,726 operational beds out of c.2,100 bed capacity) under its portfolio and plans to grow organically and steadily with six new hospitals in the pipeline until 2020. MIKA has a market cap of Rp36tn, more than triple the 2nd largest listed private hospital chain in Indonesia.
Solid business model with focus on profitability . MIKA will continue to concentrate on Greater Jakarta and Surabaya cities for further expansion. In addition, its emphasis on cost efficiency rather than aggressive expansion going forward should see MIKA maintain and even improve on its operational margins, already one of the highest among peers. Valuation:
MIKA is currently trading at 40x 2016 EV/EBITDA (expensive vs regional peers’ average). We value the company using DCF valuation for each of its existing and new hospitals and WACC assumption of 10.5% to arrive at our Rp2,900 TP. Key Risks to Our View:
Slower expansion than expected. The availability of land in good locations is getting limited (especially in big cities like Greater Jakarta and Surabaya). In addition, dearth of medical human resources in this industry (at just 0.2% of the total population) may impact MIKA’s ability to recruit and retain medical professionals and execute its expansion plan. At A Glance Issued Capital (m shrs) 14,551 Mkt. Cap (Rpbn/US$m) 36,450 / 2,666 Major Shareholders Lion Investments (%) 49.7 Griyainsani Cakrasad (%) 32.3 Free Float (%) 18.0 3m Avg. Daily Val (US$m) 5.5 ICB Industry : Health Care / Health Care Equipment & Services
DBS Group Research . Equity 26 Nov 2015
Indonesia Company Guide
Mitra Keluarga Karyasehat Edition 1 Version 1 | Bloomberg: MIKA | Reuters: MIKA.JK Refer to important disclosures at the end of this report
89
109
129
149
169
189
209
229
249
1,530.0
1,730.0
1,930.0
2,130.0
2,330.0
2,530.0
2,730.0
2,930.0
3,130.0
Mar-15 Jun-15 Sep-15
Relative IndexRp
Mitra Keluarga Karyasehat (LHS) Relative JCI INDEX (RHS)

ASIAN INSIGHTS VICKERS SECURITIES Page 16
Company Guide
Mitra Keluarga Karyasehat
CRITICAL DATA POINTS TO WATCH
Earnings Drivers:
Steady and sustainable growth in Net Operating Revenue MIKA now operates 12 hospitals concentrated in both Greater Jakarta and Surabaya with a bed capacity of c.2,100. MIKA is set to add six hospitals in the next five years and has so far secured four sites for its new hospitals. We project existing hospitals' in-patient and out-patient admissions to grow at 6.6% and 4.8% CAGR respectively between 2014 and 2019, and average revenue to grow at 8.1% and 9.4% CAGR within the same period. Considering that and new hospital rollouts, we project Net Operating Revenue (NOR) to increase by a 17.1% CAGR between 2014 and 2019. Revenue contribution from existing hospitals is still high at more than 90%. Stable and improving EBITDA margins MIKA’s EBITDA margins of 27-31% between 2011 and 2014 were among the highest in the region. As MIKA still focuses on cost efficiency, we believe that EBITDA margin is sustainable and has room for further improvement going forward. MIKA’s new typical greenfield hospital has a 200-bed capacity, in which the number of operational beds will be increased gradually and require an initial capex of US$15m. It is expected to generate positive EBITDA after six months of operation and generate an estimated 21.3% IRR. Strong free cash flow enables internally funded capex expansion Given the mature hospitals in its portfolio and efficient operational management, MIKA has consistently and will continue to generate high free cash flows despite its expansion plan (i.e. one additional new hospital annually).
COMPANY BACKGROUND
Largest private hospital chain by market cap in Indonesia. Mitra Keluarga Karyasehat (MIKA) currently operates 12 private hospitals in Indonesia with a total bed capacity of 2,100 as of Oct 2015. MIKA focuses its operations on Greater Jakarta and Surabaya. The company began operating its first hospital in 1989 and has expanded organically with consistent and sustainable growth. MIKA was listed on the Indonesia Stock Exchange (IDX) on 24 Mar 2015 and is currently the largest listed private hospital company in Indonesia by market cap.
Hospital expansion projection
Operational beds and bed capacity
Net Operating Revenue Trend
Profitability Trend
Margins Trend
Source: Company, DBS Vickers
12
45
34
56
89
1011
1213
1415
1718
0
2
4
6
8
10
12
14
16
18
20 no. of hospitals
Sold equity interest in 2 hospitals
-
500
1,000
1,500
2,000
2,500
3,000
2011 2012 2013 2014 2015F 2016F 2017F 2018F
Operational beds Bed capacity
10.0%
15.0%
20.0%
25.0%
30.0%
0
500,000
1,000,000
1,500,000
2,000,000
2,500,000
3,000,000
2013A 2014A 2015F 2016F 2017F
Rp m
Total Revenue Revenue Growth (%) (YoY)
398,596
498,596
598,596
698,596
798,596
898,596
998,596
1,098,596
2013A 2014A 2015F 2016F 2017F
Rp m
Operating EBIT Pre tax Profit Net Profit
21.0%
23.0%
25.0%
27.0%
29.0%
31.0%
2013A 2014A 2015F 2016F 2017F
Operating Margin % Net Income Margin %

ASIAN INSIGHTS VICKERS SECURITIES Page 17
Company Guide
Mitra Keluarga Karyasehat
Balance Sheet:
Healthy balance sheet MIKA is expected to have zero interest-bearing debt and a significant cash position. The company's strong free cash flow generation should allow it to internally fund its expansion capex. Expansion capex to ramp up in the next few years We forecast an average annual capex of Rp368bn between 2015 and 2018 for four new hospitals. Share Price Drivers:
Execution of expansion plan for both existing and new hospitals MIKA generates stable and sustainable earnings from the mature hospitals in its portfolio, while leaning on new hospitals for additional growth going forward. Better performance from both maturing and new hospitals should accelerate earnings growth and subsequently its share price. Successful implementation of Coordination of Benefits (COB) scheme. This will allow private insurance and corporates to top up the price difference from standardised INA-CBG prices and could potentially improve overall patient volumes. Key Risks:
Shortage of medical professionals. Dearth of medical human resources in this industry (at just 0.2% of the total population) may impact MIKA’s ability to recruit and retain medical professionals and execute its expansion plan. Extensively regulated industry. The healthcare sector is subjected to extensive and dynamic government laws and regulations. Material changes in current laws and regulations may have adverse impacts on MIKA’s business. Litigation risk from medical and legal claims. By nature, the hospital business is exposed to medical and legal claims. Ability to secure sites for future growth. The availability of land in good locations is becoming limited (especially in big cities like Greater Jakarta and Surabaya). This may restrict MIKA’s ability to expand further in the future. Potential decline in patient volume. The lower-cost alternatives for healthcare services as laid out by the much-heralded universal healthcare programme (JKN) may result in lower-than-expected patient volumes in MIKA’s hospitals.
Leverage & Asset Turnover (x)
Capital Expenditure
ROE (%)
Forward PE Band (x)
PB Band (x)
Source: Company, DBS Vickers
0.6
0.7
0.7
0.8
0.8
0.9
0.9
1.0
1.0
0.00
0.02
0.04
0.06
0.08
0.10
0.12
0.14
2013A 2014A 2015F 2016F 2017F
Gross Debt to Equity (LHS) Asset Turnover (RHS)
0.0
100,000.0
200,000.0
300,000.0
400,000.0
500,000.0
600,000.0
2013A 2014A 2015F 2016F 2017F
Capital Expenditure (-)
Rp
0.0%
5.0%
10.0%
15.0%
20.0%
25.0%
30.0%
2013A 2014A 2015F 2016F 2017F
Avg: 56.7x
+1sd: 60x
+2sd: 63.2x
‐1sd: 53.5x
‐2sd: 50.3x
36.3
41.3
46.3
51.3
56.3
61.3
66.3
Mar-15 Jun-15 Sep-15
(x)
Avg: 14.39x
+1sd: 15.42x
+2sd: 16.44x
‐1sd: 13.37x
‐2sd: 12.35x
10.3
11.3
12.3
13.3
14.3
15.3
16.3
17.3
18.3
Mar-15 Jun-15 Sep-15
(x)

ASIAN INSIGHTS VICKERS SECURITIES Page 18
Company Guide
Mitra Keluarga Karyasehat
Segmental Breakdown
FY Dec 2013A 2014A 2015F 2016F 2017F Revenues (Rp bn) IP-Medical services 417 474 547 640 757 IP-Medical supplies 558 585 684 800 947 IP-Room 198 222 251 293 347 OP-Medical services 319 375 456 533 631 OP-Medical supplies 250 290 342 400 473 Total 1,742 1,946 2,280 2,667 3,155 Gross profit (Rp bn) IP-Medical services 182 211 243 284 336 IP-Medical supplies 160 163 205 240 284 IP-Room 82 106 94 131 145 OP-Medical services 215 247 294 344 407 OP-Medical supplies 99 138 182 213 252 Total 737 865 1,018 1,212 1,425 Gross profit Margins (%) IP-Medical services 43.6 44.4 44.4 44.4 44.4 IP-Medical supplies 28.6 27.9 30.0 30.0 30.0 IP-Room 41.4 47.8 37.4 44.5 41.7 OP-Medical services 67.4 65.7 64.5 64.5 64.5 OP-Medical supplies 39.4 47.7 53.3 53.3 53.3 Total 42.3 44.4 44.7 45.5 45.2 Income Statement (Rp bn)
FY Dec 2013A 2014A 2015F 2016F 2017F Revenue 1,742 1,946 2,280 2,667 3,155 Cost of Goods Sold (1,005) (1,081) (1,261) (1,455) (1,731) Gross Profit 737 865 1,018 1,212 1,425 Other Opng (Exp)/Inc (267) (319) (360) (419) (488) Operating Profit 470 545 658 793 937 Other Non Opg (Exp)/Inc 12 41 59 67 78 Associates & JV Inc 0 0 0 0 0 Net Interest (Exp)/Inc 48 80 127 170 158 Exceptional Gain/(Loss) 0 0 0 0 0 Pre-tax Profit 530 667 844 1,031 1,172 Tax (118) (133) (235) (278) (323) Minority Interest (13) (17) (27) (33) (38) Preference Dividend 0 0 0 0 0 Net Profit 399 517 582 719 812 Net Profit before Except. 399 517 582 719 812 EBITDA 543 615 731 881 1,046 Growth Revenue Gth (%) 18.1 11.7 17.2 17.0 18.3 EBITDA Gth (%) 26.5 13.3 18.9 20.5 18.8 Opg Profit Gth (%) 29.3 15.9 20.7 20.5 18.1 Net Profit Gth (%) 38.1 29.7 12.5 23.6 12.9 Margins & Ratio Gross Margins (%) 42.3 44.4 44.7 45.5 45.2 Opg Profit Margin (%) 27.0 28.0 28.9 29.7 29.7 Net Profit Margin (%) 22.9 26.6 25.5 27.0 25.7 ROAE (%) 26.7 30.1 23.4 21.1 21.5 ROA (%) 20.9 24.1 19.6 18.0 18.1 ROCE (%) 21.6 22.7 17.5 15.6 16.3 Div Payout Ratio (%) 3.8 90.9 53.3 48.5 53.1
Source: Company, DBS Vickers
Sustainable and high margins
Decent and sustainable revenue growth

ASIAN INSIGHTS VICKERS SECURITIES Page 19
Company Guide
Mitra Keluarga Karyasehat
Quarterly / Interim Income Statement (Rpbn)
FY Dec 3Q2014 4Q2014 1Q2015 2Q2015 3Q2015 Revenue 467 478 541 561 500 Cost of Goods Sold (275) (253) (294) (302) (277) Gross Profit 192 225 248 258 223 Other Oper. (Exp)/Inc (74) (82) (82) (90) (93) Operating Profit 117 143 166 168 130 Other Non Opg (Exp)/Inc 2 3 5 4 4 Associates & JV Inc 0 0 0 0 0 Net Interest (Exp)/Inc 29 15 23 36 36 Exceptional Gain/(Loss) 0 0 0 0 0 Pre-tax Profit 148 161 193 209 171 Tax (20) (33) (42) (38) (37) Minority Interest (3) (5) (6) (6) (5) Net Profit 125 124 145 165 130 Net profit bef Except. 125 124 145 165 130 EBITDA 117 143 166 168 130 Growth Revenue Gth (%) (7.9) 2.4 13.2 3.6 (10.8) EBITDA Gth (%) (11.8) 21.8 15.8 1.7 (22.6) Opg Profit Gth (%) (11.8) 21.8 15.8 1.7 (22.6) Net Profit Gth (%) (12.0) (1.3) 17.4 13.5 (21.2) Margins Gross Margins (%) 41.0 47.1 45.7 46.0 44.6 Opg Margins (%) 25.1 29.9 30.6 30.0 26.1 Net Profit Margins (%) 26.8 25.8 26.8 29.4 26.0 Balance Sheet (Rp bn)
FY Dec 2013A 2014A 2015F 2016F 2017F Net Fixed Assets 598 771 914 1,202 1,596 Invts in Associates & JVs 0 0 0 0 0 Other LT Assets 125 196 190 288 370 Cash & ST Invts 1,108 970 2,419 2,407 2,439 Inventory 40 39 53 53 73 Debtors 114 131 157 180 218 Other Current Assets 149 50 57 71 83 Total Assets 2,134 2,157 3,790 4,200 4,780 ST Debt 50 0 0 0 0 Creditor 56 47 73 66 99 Other Current Liab 175 158 228 208 293 LT Debt 0 0 0 0 0 Other LT Liabilities 118 145 174 209 251 Shareholder’s Equity 1,689 1,743 3,224 3,595 3,975 Minority Interests 45 63 91 124 162 Total Cap. & Liab. 2,134 2,157 3,790 4,200 4,780 Non-Cash Wkg. Capital 72 14 (34) 31 (18) Net Cash/(Debt) 1,058 970 2,419 2,407 2,439 Debtors Turn (avg days) 24.3 23.1 23.1 23.1 23.1 Creditors Turn (avg days) 21.1 18.5 18.4 18.4 18.5 Inventory Turn (avg days) 16.1 14.2 14.1 14.1 14.2 Asset Turnover (x) 0.9 0.9 0.8 0.7 0.7 Current Ratio (x) 5.0 5.8 8.9 9.9 7.2 Quick Ratio (x) 4.4 5.4 8.6 9.5 6.8 Net Debt/Equity (X) CASH CASH CASH CASH CASH Net Debt/Equity ex MI (X) CASH CASH CASH CASH CASH Capex to Debt (%) 320.4 N/A N/A N/A N/A
Source: Company, DBS Vickers
Zero interest-bearing debt
Significant net cash position

ASIAN INSIGHTS VICKERS SECURITIES Page 20
Company Guide
Mitra Keluarga Karyasehat
Cash Flow Statement (Rp bn)
FY Dec 2013A 2014A 2015F 2016F 2017F Pre-Tax Profit 530 667 844 1,031 1,172 Dep. & Amort. 73 70 73 87 109 Tax Paid (118) (133) (235) (278) (323) Assoc. & JV Inc/(loss) 0 0 0 0 0 Chg in Wkg.Cap. (32) 58 81 (125) 7 Other Operating CF (5) (7) (27) (33) (38) Net Operating CF 447 655 736 682 929 Capital Exp.(net) (160) (243) (216) (376) (504) Other Invts.(net) 0 0 0 0 0 Invts in Assoc. & JV 0 0 0 0 0 Div from Assoc & JV 0 0 0 0 0 Other Investing CF 30 (26) 29 31 39 Net Investing CF (130) (269) (187) (345) (465) Div Paid (15) (470) (310) (349) (432) Chg in Gross Debt (5) (50) 0 0 0 Capital Issues (1) 0 1,210 0 0 Other Financing CF (3) (3) 0 0 0 Net Financing CF (24) (523) 900 (349) (432) Currency Adjustments 0 0 0 0 0 Chg in Cash 293 (138) 1,449 (12) 32 Opg CFPS (Rp) 347 43 45 55 63 Free CFPS (Rp) 208 30 36 21 29
Source: Company, DBS Vickers
High operating cash flow to fund expansion

ASIAN INSIGHTS VICKERS SECURITIES www.dbsvickers.com ed: TH / sa: MA
HOLD Last Traded Price: Rp9,775 (JCI : 4,585.55) Price Target : Rp10,000 (2% upside) (Prev Rp17,000) Potential Catalyst: Better expansion and performance from new hospitals Where we differ: Predict slower expansion than company’s aggressive guidance Analyst Edward Ariadi Tanuwijaya +6221 3003 4932 [email protected]
Price Relative
Forecasts and Valuation FY Dec (Rpbn) 2014A 2015F 2016F 2017F
Revenue 3,341 4,013 4,991 6,176 EBITDA 487 627 880 1,199 Pre-tax Profit 93.5 148 190 263 Net Profit 62.6 110 141 196 Net Pft (Pre Ex.) 62.6 110 141 196 EPS (Rp) 54.1 95.4 122 169 EPS Pre Ex. (Rp) 54.1 95.4 122 169 EPS Gth (%) 25 76 28 39 EPS Gth Pre Ex (%) 25 76 28 39 Diluted EPS (Rp) 54.1 95.4 122 169 Net DPS (Rp) 0.0 0.0 0.0 12.2 BV Per Share (Rp) 1,426 1,521 1,643 1,800 PE (X) 180.6 102.5 80.0 57.8 PE Pre Ex. (X) 180.6 102.5 80.0 57.8 P/Cash Flow (X) 30.8 21.8 15.3 10.9 EV/EBITDA (X) 22.7 17.4 12.5 9.1 Net Div Yield (%) 0.0 0.0 0.0 0.1 P/Book Value (X) 6.9 6.4 5.9 5.4 Net Debt/Equity (X) CASH CASH CASH CASH ROAE (%) 3.8 6.5 7.7 9.8 Earnings Rev (%): (7) (20) (31) Consensus EPS (Rp): 82.4 112 172
Other Broker Recs: B: 8 S: 1 H: 5
Source of all data: Company, DBS Vickers, Bloomberg Finance L.P
Warming Up For Next Year Maintain HOLD call with much lower TP. To reflect SILO’s stalled expansion this year, we slashed down our FY15/16F revenue by 5.1%/14.2% and consequently our FY15/16F net profit by 6.6%/20%. Considering the difficulties for expansion (mainly in securing licences) going forward, we also tweak our DCF assumption and all those changes resulted in a lower TP of Rp10,000. Likely to come up short of expansion plan this year. SILO targeted to open 10 new hospitals (full-fledged and Siloam Medika) this year. However, to date, not a single new hospital has been opened and SILO has cited difficulties in finalising licences and administration as the main reason behind this delay. Realistically, as reflected in our forecast, there will be no additional hospitals or Siloam Medikas in SILO’s portfolio this year. One of the largest private hospital operators in Indonesia, with aggressive growth ahead. SILO currently has 20 hospitals in its portfolio and plans to expand aggressively in the next three years. SILO has first-mover advantage in smaller cities, strong branding, and good knowledge of the real estate market through parent Lippo Group. SILO is changing its expansion model by mixing greenfield full-service hospitals (300-bed capacity) and the compact Siloam Medika (40-bed capacity) in retail malls. This way, SILO can leverage more on its parent Lippo Group’s expertise in retail malls. Valuation:
SILO is currently trading at 13x 2016 EV/EBITDA (cheap vs regional peers’ average) after sharp 43% correction in 3 months from early Sep2015. We value the company using DCF valuation for each of its existing and new hospitals to arrive at our Rp10,000 TP. Key Risks to Our View:
Slower expansion than expected. The extensive licensing requirements for new hospitals could impede future growth. In addition, given the asset-light model, the ability to recycle cash and raise external funds for expansion is heavily dependent on Singapore-listed First REIT’s ability to acquire SILO’s hospital assets and lease them back to the company. At A Glance Issued Capital (m shrs) 1,156 Mkt. Cap (Rpbn/US$m) 11,301 / 827 Major Shareholders Lippo Karawaci TBK (%) 70.8 Free Float (%) 29.2 3m Avg. Daily Val (US$m) 3.5 ICB Industry : Health Care / Health Care Equipment & Services
DBS Group Research . Equity 26 Nov 2015
Indonesia Company Guide
Siloam International Hospitals Edition 1 Version 2 | Bloomberg: SILO IJ | Reuters: SILO.JK Refer to important disclosures at the end of this report
87
107
127
147
167
187
207
8,055.0
10,055.0
12,055.0
14,055.0
16,055.0
18,055.0
Sep-13 Mar-14 Sep-14 Mar-15 Sep-15
Relative IndexRp
Siloam International Hospitals (LHS) Relative JCI INDEX (RHS)

ASIAN INSIGHTS VICKERS SECURITIES Page 22
Company Guide
Siloam International Hospitals
CRITICAL DATA POINTS TO WATCH
Earnings Drivers:
Aggressive expansion to support high Gross Operating Revenue (GOR) growth SILO now operates 20 hospitals in 14 cities across Indonesia with a total of over 4,800 beds. Our assumption that SILO would operate 28 full-service hospitals plus 22 Siloam Medikas by end-2019 is far more conservative than guidance. We project Gross Operating Revenue (GOR) to increase by a 24% CAGR between 2014 and 2019 (i.e. aggressive expansion period). By end-2019, revenue contribution from new hospitals (full-service and Siloam Medika) opened after 2014 will increase significantly to 25%. Improving EBITDA margins as new hospitals mature We forecast GP margins to hover at about 29% over the next few years. But EBITDA margins will improve as the hospitals in SILO’s portfolio mature. We expect EBITDA margins to improve by an average of 0.8ppt annually from 14.6% in 2014. We also project EBITDA to more than quadruple between 2014 and 2019 Turning free-cash-flow positive in 2017 Premised on successful expansion, SILO will generate its first positive free cash flow at the end of 2017 (excluding 2015 positive cash flow, which is more due to stalled expansion capex). This suggests that SILO should be in a better financial position to execute its next growth phase. First-mover advantage in smaller cities to accelerate payback period With a presence in 14 cities nationwide, SILO has strong branding, network and infrastructure. In addition, synergies with property developer Lippo Karawaci (LPKR) gives SILO an advantage in securing new locations to meet its expansion plans. SILO has signed a master agreement with LPKR and another strategic partner MPU for 30 new locations nationwide. Given extremely low penetration of hospital services and rising healthcare needs in Indonesia, the new hospitals in smaller cities can potentially generate positive EBITDA within two years of operations.
COMPANY BACKGROUND
SILO is Indonesia's largest private hospital operator with 20 operational hospitals in its portfolio, and plenty of new hospitals in the pipeline for the next few years.
Hospital expansion projection
Free cash flow forecast
Gross Operating Revenue Trend
Profitability Trend
Margins Trend
Source: Company, DBS Vickers
0
10
20
30
40
50
60
2014 2015F 2016F 2017F 2018F 2019F
Siloam Hospitals Siloam Medika
283
-111
15
242 232
-150
-100
-50
0
50
100
150
200
250
300
350
2015F 2016F 2017F 2018F 2019F
Rpbn
10.0%
15.0%
20.0%
25.0%
30.0%
35.0%
40.0%
45.0%
50.0%
0
1,000
2,000
3,000
4,000
5,000
6,000
2013A 2014A 2015F 2016F 2017F
Rp bn
Total Revenue Revenue Growth (%) (YoY)
49
99
149
199
249
299
2013A 2014A 2015F 2016F 2017F
Rp bn
Operating EBIT Pre tax Profit Net Profit
1.0%
1.5%
2.0%
2.5%
3.0%
3.5%
4.0%
4.5%
5.0%
5.5%
6.0%
2013A 2014A 2015F 2016F 2017F
Operating Margin % Net Income Margin %

ASIAN INSIGHTS VICKERS SECURITIES Page 23
Company Guide
Siloam International Hospitals
Balance Sheet:
Gearing up for aggressive expansion plan Given its current low cash balance, high debt (both interest- and non-interest-bearing debt), and aggressive expansion plan, SILO’s net gearing is expected to increase significantly from 11% in 2014. Recently, SILO secured an option to exercise a rights issue (of up to 10% of its current share base) within the next two years, in the event it needs to beef up the balance sheet. Capex to ramp up in the next four years We forecast annual capex to remain at Rp800–900bn in the next three years as SILO ramps up the number of hospitals (full-fledged service and Siloam Medika). Share Price Drivers:
Execution of expansion plan SILO is a growth story that leverages on the expanding healthcare services industry in Indonesia. SILO’s growth will depend on its ability to secure locations and the necessary licences to open new hospitals, and to raise financing. Successful implementation of Indonesia’s universal healthcare programme The successful implementation will be a game changer that will shape the future of Indonesia’s healthcare industry, and create positive sentiment in the sector. Healthcare service providers are among those that will benefit from structural changes. Key Risks:
Capital-intensive projects. Given the company’s aggressive plans (i.e. 10 new hospitals p.a.) for the next three years, it will require large and constant funding. Related-party transactions. The asset-light model requires asset transfers between SILO and companies within the Lippo Group (through property leases, shareholder loans, etc.) Subject to extensive laws and regulations. The company may face an adverse impact if there are material changes to the regulations. Litigation risks from medical and legal claims. This is the nature of the healthcare service business. Shortage of medical human resource, with low healthcare worker-to-population ratio, could impede growth going forward.
Leverage & Asset Turnover (x)
Capital Expenditure
ROE (%)
Forward PE Band (x)
PB Band (x)
Source: Company, DBS Vickers
1.1
1.2
1.3
1.4
1.5
1.6
1.7
1.8
0.00
0.02
0.04
0.06
0.08
0.10
0.12
0.14
2013A 2014A 2015F 2016F 2017F
Gross Debt to Equity (LHS) Asset Turnover (RHS)
0.0
100.0
200.0
300.0
400.0
500.0
600.0
700.0
800.0
900.0
1,000.0
2013A 2014A 2015F 2016F 2017F
Capital Expenditure (-)
Rp
0.0%
1.0%
2.0%
3.0%
4.0%
5.0%
6.0%
7.0%
8.0%
9.0%
2013A 2014A 2015F 2016F 2017F
Avg: 156.1x
+1sd: 186.1x
+2sd: 216.1x
‐1sd: 126.2x
‐2sd: 96.2x
67.6
87.6
107.6
127.6
147.6
167.6
187.6
207.6
227.6
Sep-13 Mar-14 Sep-14 Mar-15 Sep-15
(x)
Avg: 9.03x
+1sd: 10.3x
+2sd: 11.57x
‐1sd: 7.75x
‐2sd: 6.48x
5.3
6.3
7.3
8.3
9.3
10.3
11.3
12.3
Sep-13 Mar-14 Sep-14 Mar-15 Sep-15
(x)
ASIAN INSIGHTS VICKERS SECURITIES Page 24
Company Guide
Siloam International Hospitals
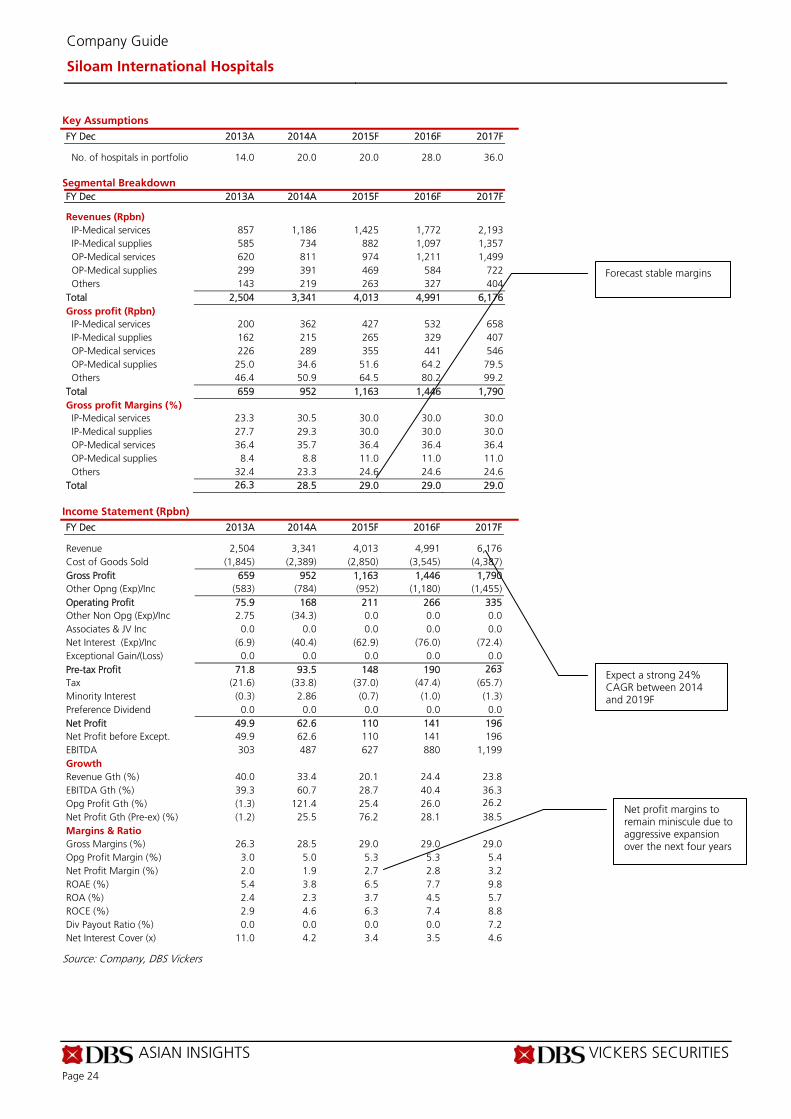
Key Assumptions
FY Dec 2013A 2014A 2015F 2016F 2017F No. of hospitals in portfolio 14.0 20.0 20.0 28.0 36.0
Segmental Breakdown
FY Dec 2013A 2014A 2015F 2016F 2017F Revenues (Rpbn) IP-Medical services 857 1,186 1,425 1,772 2,193 IP-Medical supplies 585 734 882 1,097 1,357 OP-Medical services 620 811 974 1,211 1,499 OP-Medical supplies 299 391 469 584 722 Others 143 219 263 327 404 Total 2,504 3,341 4,013 4,991 6,176 Gross profit (Rpbn)
IP-Medical services 200 362 427 532 658 IP-Medical supplies 162 215 265 329 407 OP-Medical services 226 289 355 441 546 OP-Medical supplies 25.0 34.6 51.6 64.2 79.5 Others 46.4 50.9 64.5 80.2 99.2 Total 659 952 1,163 1,446 1,790 Gross profit Margins (%)
IP-Medical services 23.3 30.5 30.0 30.0 30.0 IP-Medical supplies 27.7 29.3 30.0 30.0 30.0 OP-Medical services 36.4 35.7 36.4 36.4 36.4 OP-Medical supplies 8.4 8.8 11.0 11.0 11.0 Others 32.4 23.3 24.6 24.6 24.6 Total 26.3 28.5 29.0 29.0 29.0
Income Statement (Rpbn)
FY Dec 2013A 2014A 2015F 2016F 2017F Revenue 2,504 3,341 4,013 4,991 6,176 Cost of Goods Sold (1,845) (2,389) (2,850) (3,545) (4,387) Gross Profit 659 952 1,163 1,446 1,790 Other Opng (Exp)/Inc (583) (784) (952) (1,180) (1,455) Operating Profit 75.9 168 211 266 335 Other Non Opg (Exp)/Inc 2.75 (34.3) 0.0 0.0 0.0 Associates & JV Inc 0.0 0.0 0.0 0.0 0.0 Net Interest (Exp)/Inc (6.9) (40.4) (62.9) (76.0) (72.4) Exceptional Gain/(Loss) 0.0 0.0 0.0 0.0 0.0 Pre-tax Profit 71.8 93.5 148 190 263 Tax (21.6) (33.8) (37.0) (47.4) (65.7) Minority Interest (0.3) 2.86 (0.7) (1.0) (1.3) Preference Dividend 0.0 0.0 0.0 0.0 0.0 Net Profit 49.9 62.6 110 141 196 Net Profit before Except. 49.9 62.6 110 141 196 EBITDA 303 487 627 880 1,199 Growth Revenue Gth (%) 40.0 33.4 20.1 24.4 23.8 EBITDA Gth (%) 39.3 60.7 28.7 40.4 36.3 Opg Profit Gth (%) (1.3) 121.4 25.4 26.0 26.2 Net Profit Gth (Pre-ex) (%) (1.2) 25.5 76.2 28.1 38.5 Margins & Ratio Gross Margins (%) 26.3 28.5 29.0 29.0 29.0 Opg Profit Margin (%) 3.0 5.0 5.3 5.3 5.4 Net Profit Margin (%) 2.0 1.9 2.7 2.8 3.2 ROAE (%) 5.4 3.8 6.5 7.7 9.8 ROA (%) 2.4 2.3 3.7 4.5 5.7 ROCE (%) 2.9 4.6 6.3 7.4 8.8 Div Payout Ratio (%) 0.0 0.0 0.0 0.0 7.2 Net Interest Cover (x) 11.0 4.2 3.4 3.5 4.6
Source: Company, DBS Vickers
Forecast stable margins
Expect a strong 24% CAGR between 2014 and 2019F
Net profit margins to remain miniscule due to aggressive expansion over the next four years

ASIAN INSIGHTS VICKERS SECURITIES Page 25
Company Guide
Siloam International Hospitals
Quarterly / Interim Income Statement (Rpbn)
FY Dec 3Q2014 4Q2014 1Q2015 2Q2015 3Q2015 Revenue 847 926 976 1,011 1,026 Cost of Goods Sold (612) (641) (669) (751) (736) Gross Profit 236 285 307 260 290 Other Oper. (Exp)/Inc (202) (230) (232) (197) (265) Operating Profit 33.6 54.6 74.9 62.2 25.3 Other Non Opg (Exp)/Inc (8.0) (21.3) (10.8) (5.4) (4.7) Associates & JV Inc 0.0 0.0 0.0 0.0 0.0 Net Interest (Exp)/Inc (13.9) (4.0) (12.0) (12.9) (13.0) Exceptional Gain/(Loss) 0.0 0.0 0.0 0.0 0.0 Pre-tax Profit 11.7 29.2 52.0 43.9 7.55 Tax (4.9) (20.8) (18.4) (15.3) (1.8) Minority Interest 1.43 (0.1) 0.88 (0.6) 2.55 Net Profit 8.17 8.26 34.5 28.0 8.35 Net profit bef Except. 8.17 8.26 34.5 28.0 8.35 EBITDA 33.6 54.6 74.9 62.2 25.3 Growth Revenue Gth (%) 3.8 9.2 5.5 3.6 1.5 EBITDA Gth (%) 2.6 62.5 37.2 (17.0) (59.4) Opg Profit Gth (%) 2.6 62.5 37.2 (17.0) (59.4) Net Profit Gth (Pre-ex) (%) (57.6) 1.0 318.1 (18.9) (70.2) Margins Gross Margins (%) 27.8 30.8 31.4 25.7 28.3 Opg Profit Margins (%) 4.0 5.9 7.7 6.1 2.5 Net Profit Margins (%) 1.0 0.9 3.5 2.8 0.8
Balance Sheet (Rpbn)
FY Dec 2013A 2014A 2015F 2016F 2017F Net Fixed Assets 1,402 1,589 1,401 1,600 1,633 Invts in Associates & JVs 0.0 0.0 0.0 0.0 0.0 Other LT Assets 291 414 494 534 583 Cash & ST Invts 515 280 581 440 507 Inventory 94.8 106 131 163 202 Debtors 271 393 367 456 565 Other Current Assets 26.4 62.3 74.8 89.8 108 Total Assets 2,601 2,844 3,049 3,284 3,598 ST Debt
16.7 16.0 13.3 10.7 10.7 Creditor 164 193 247 307 380 Other Current Liab 115 269 196 226 261 LT Debt 43.0 30.5 134 124 124 Other LT Liabilities 623 682 694 710 733 Shareholder’s Equity 1,611 1,648 1,758 1,900 2,081 Minority Interests 27.6 5.47 6.20 7.15 8.47 Total Cap. & Liab. 2,601 2,844 3,049 3,284 3,598 Non-Cash Wkg. Capital 113 98.7 130 177 234 Net Cash/(Debt) 456 233 433 305 372 Debtors Turn (avg days) 33.4 36.2 34.5 30.1 30.2 Creditors Turn (avg days) 36.0 31.5 33.0 34.5 35.6 Inventory Turn (avg days) 19.2 17.7 17.8 18.4 18.9 Asset Turnover (x) 1.2 1.2 1.4 1.6 1.8 Current Ratio (x) 3.1 1.8 2.5 2.1 2.1 Quick Ratio (x) 2.7 1.4 2.1 1.7 1.6 Net Debt/Equity (X) CASH CASH CASH CASH CASH Net Debt/Equity ex MI (X) CASH CASH CASH CASH CASH Capex to Debt (%) 1,280.0 1,087.7 153.9 603.9 665.4 Z-Score (X) 9.3 8.0 7.7 7.5 7.4
Source: Company, DBS Vickers
Mostly related-party loan from parent company
Tight cash position due to expansion

ASIAN INSIGHTS VICKERS SECURITIES Page 26
Company Guide
Siloam International Hospitals
Cash Flow Statement (Rpbn)
FY Dec 2013A 2014A 2015F 2016F 2017F Pre-Tax Profit 71.8 93.5 148 190 263 Dep. & Amort. 227 319 416 614 864 Tax Paid (21.6) (33.8) (37.0) (47.4) (65.7) Assoc. & JV Inc/(loss) 0.0 0.0 0.0 0.0 0.0 Chg in Wkg.Cap. (580) (14.0) (7.6) (18.5) (22.6) Other Operating CF (0.3) 2.86 (0.7) (1.0) (1.3) Net Operating CF (303) 367 519 737 1,037 Capital Exp.(net) (764) (506) (227) (814) (896) Other Invts.(net) 0.0 0.0 0.0 0.0 0.0 Invts in Assoc. & JV 0.0 0.0 0.0 0.0 0.0 Div from Assoc & JV 0.0 0.0 0.0 0.0 0.0 Other Investing CF 80.2 (35.9) (92.1) (52.1) (60.6) Net Investing CF (684) (542) (319) (866) (957) Div Paid 0.0 0.0 0.0 0.0 (14.1) Chg in Gross Debt (11.1) (13.2) 101 (13.0) 0.0 Capital Issues 1,328 0.0 0.0 0.0 0.0 Other Financing CF 16.2 (47.9) 0.74 0.95 1.31 Net Financing CF 1,333 (61.1) 102 (12.0) (12.8) Currency Adjustments 0.0 0.0 0.0 0.0 0.0 Chg in Cash 347 (235) 301 (141) 66.7 Opg CFPS (Rp) 239 330 455 653 916 Free CFPS (Rp) (923) (120) 252 (66.5) 121
Source: Company, DBS Vickers
Target Price & Ratings History
Source: DBS Vickers
S.No. DateClosing
PriceTarget Price
Rat ing
1: 02 Feb 15 13500 12750 HOLD
2: 30 Mar 15 13425 12750 HOLD
3: 23 Apr 15 13525 12750 HOLD
4: 10 Aug 15 16850 17000 HOLD
5: 02 Nov 15 10300 17000 HOLD
Note : Share price and Target price are adjusted for corporate actions.
1
2
3
4
5
8502
9502
10502
11502
12502
13502
14502
15502
16502
17502
Nov-14 Mar-15 Jul-15 Nov-15
Rp
Heavy capex requirement for the next four years

ASIAN INSIGHTS VICKERS SECURITIES www.dbsvickers.com sa: YM
BUY (Upgrade from HOLD)
Last Traded Price: Rp1,350 (JCI : 4,585.55) Price Target : Rp1,600 (19% upside) (Prev Rp1,900) Potential Catalyst: Valuation and stable USD/IDR Where we differ: We expect more positive outlook for 2016 and potential upside from pharma business Analyst Maynard P. Arif +6221 3003 4930 [email protected]
Price Relative
Forecasts and Valuation FY Dec (Rpbn) 2014A 2015F 2016F 2017F Revenue 17,369 17,937 19,468 22,317 EBITDA 3,093 3,052 3,478 4,213 Pre-tax Profit 2,764 2,695 3,043 3,717 Net Profit 2,065 1,976 2,234 2,733 Net Pft (Pre Ex.) 2,065 1,976 2,234 2,733 EPS (Rp) 44.0 42.2 47.7 58.3 EPS Pre Ex. (Rp) 44.0 42.2 47.7 58.3 EPS Gth (%) 8 (4) 13 22 EPS Gth Pre Ex (%) 8 (4) 13 22 Diluted EPS (Rp) 44.0 42.2 47.7 58.3 Net DPS (Rp) 17.0 16.3 18.4 22.5 BV Per Share (Rp) 200 226 255 291 PE (X) 30.7 32.0 28.3 23.2 PE Pre Ex. (X) 30.7 32.0 28.3 23.2 P/Cash Flow (X) 27.2 26.1 26.0 23.2 EV/EBITDA (X) 20.1 20.2 17.5 14.3 Net Div Yield (%) 1.3 1.2 1.4 1.7 P/Book Value (X) 6.7 6.0 5.3 4.6 Net Debt/Equity (X) CASH CASH CASH CASH ROAE (%) 23.6 19.8 19.8 21.3 Earnings Rev (%): (6) (4) N/A Consensus EPS (Rp): 46.3 53.2 60.7 Other Broker Recs: B: 12 S: 4 H: 11
Source of all data: Company, DBS Vickers, Bloomberg Finance L.P
On the Path to Recovery Upgrade to Buy. We upgraded Kalbe to Buy from Hold (19% upside to our TP) as the stock has underperformed JCI and the valuation is more attractive, trading at 5-year mean PE of 26x. Moreover, we believe Kalbe is on the path to recovery after a difficult year in 2015. Multiple headwinds in 2015. Kalbe was hit with a few glitches in 2015 including product recall, suspension in production line and slower demand overall. Hence, we revised down our FY15/16 EPS by 6%/4% respectively after lowering our FY15/16 revenue estimates by c.2%. The weak performance in 2015 is also reflected in the share price to-date. Recovery in 2016. We believe most of the issues in 2015 should be resolved in 2016. The suspension of manufacturing line 6 should be lifted by 2016 and the distribution business is expected to stabilize. Moreover, healthcare spending is expected to grow at 12% CAGR in the next five years with the introduction of universal healthcare (BPJS Health). This will be the driver for long term growth in the healthcare industry including Kalbe Farma. Valuation:
Kalbe's shares have corrected by c.20% since 2H15 vs. 8% for JCI while the valuation is now at 5-year mean PE (26x FY16 EPS). Our new TP is Rp1,600 (previously Rp1,900) or 33x FY16 EPS, pegged at 25% discount to UNVR's multiple. Key Risks to Our View:
Weak consumer spending and regulatory risk. Further slowdown in the economy could dampen consumer spending, which will lead to slower than expected growth for Kalbe. In addition, regulatory risks such as price control, relaxation on foreign investment and license may have negative impact on Kalbe's performance. At A Glance Issued Capital (m shrs) 46,875 Mkt. Cap (Rpbn/US$m) 63,281 / 4,628 Major Shareholders Gira Sole Prima (%) 9.8 Santa Seha Sanadi (%) 9.3 Diptanala Bahana (%) 9.5 Free Float (%) 47.2 3m Avg. Daily Val (US$m) 4.7 ICB Industry : Health Care / Pharmaceuticals & Biotechnolog
DBS Group Research . Equity 26 Nov 2015
Indonesia Company Guide
Kalbe Farma Edition 1 Version 1 | Bloomberg: KLBF IJ | Reuters: KLBF.JK Refer to important disclosures at the end of this report
81
101
121
141
161
181
201
221
598.5
798.5
998.5
1,198.5
1,398.5
1,598.5
1,798.5
1,998.5
Nov-11 Nov-12 Nov-13 Nov-14 Nov-15
Relative IndexRp
Kalbe Farma (LHS) Relative JCI INDEX (RHS)

ASIAN INSIGHTS VICKERS SECURITIES Page 28
Company Guide
Kalbe Farma
Earnings Drivers:
Recovery in pharma business. Pharma accounted for c.25% of Kalbe's business and it faced some headwinds in 2015: i) the Buvanest case, ii) suspension of manufacturing line 6 and iii) forex volatility. As such, the growth in pharma business is expected to be below average this year (we expect 5-6% vs. 12-18% between 2012-14). We expect some improvement in 2016 as the suspension on line 6 should be lifted before the growth resumes to be in line with the industry at c.12% in 2017, driven by healthcare spending and BPJS Health. Growth in nutritionals. Nutritional has been one of the strongest growth contributors in the last three years for Kalbe and accounted for c.28% of sales in 9M15. While demand has slowed this year, nutritionals still recorded double digit growth this year and is expected to grow at 15% CAGR between 2014-2017. In addition, Kalbe is ranked #4 in the powdered milk market with a market share of 11%, and is expanding into new segment, liquid milk. The company is not going to compete in the general liquid market but rather in a niche segment such as diabetic to leverage on the existing brand name. USD/IDR fluctuation. Most of Kalbe's raw materials are imported (c.70-75%) and hence, the fluctuation in USD/IDR will have an impact on margin. Based on our analysis, a 10% change in USD/IDR could change profit by up to 3% but the company will normally offset it with price adjustment. Kalbe typically adjusts its prices by 3-5%, depending on the products and competition. We projected gross margin in 2015 and 2016 to decline to 47.5% and 48% respectively vs. 48.8% in 2014 and 48.0% in 2013 on weaker Rupiah. Rupiah has depreciated by 9% YTD against USD, and our FX strategist expects pressures on IDR to continue with the expected Fed rate hike. New products and M&A. In terms of new products, Kalbe plans to add between 3 to 5 products each year. So far, Kalbe has added liquid milk, Extra Joss + Milk and Lo Han Kuo Komix in the consumer and nutritional segment. New products will be important to support the long term growth in consumer health segment. Furthermore, Kalbe has a strong balance sheet with c.Rp1.7tr in net cash position. The company is continuously looking for M&A as part of its growth strategy. Any sizable acquisition will have an impact on the earnings growth of Kalbe.
Pharma revenue and GM
Nutritional revenue and GM
Revenue mix
Revenue and earnings trend
Gross margin vs. USD/IDR
Source: Company, DBS Vickers
46.5%
47.0%
47.5%
48.0%
48.5%
49.0%
10,000
12,500
15,000
17,500
20,000
13 14 15F 16F
Revenue (LHS) Gross Margin (RHS)
Rpbn
55.0%
56.0%
57.0%
58.0%
59.0%
60.0%
61.0%
500
1,500
2,500
3,500
4,500
5,500
13 14 15F 16F
Revenue (LHS) Gross Margin (RHS)
Rpbn
0
5,000
10,000
15,000
20,000
25,000
13 14 15F 16F
Pharmaceuticals Consumer Health Nutritionals Distribution
Rpbn
0
5000
10000
15000
20000
13 14 15F 16F
Revenue Earnings
Rpbn
46.5%
47.0%
47.5%
48.0%
48.5%
49.0%
10000
11000
12000
13000
14000
15000
13 14 15F 16F
USD/IDR Gross Margin

ASIAN INSIGHTS VICKERS SECURITIES Page 29
Company Guide
Kalbe Farma
Balance Sheet:
Healthy balance sheet. Kalbe's balance sheet is healthy with over Rp1.7tr in cash and almost zero in LT debt.. Moreover, we expect positive operating cash flow generation in excess of Rp1.7tr annually between 2015-2017. Capex to support new products. As part of the expansion strategy, Kalbe expects to spend c.5% of revenue for capex annually. This translates to c.Rp1-1.2tr of capex to support plant expansion, joint ventures for new products and distribution. We believe Kalbe has sufficient cash flow from operation to fund its regular capex plan. Share Price Drivers:
Kalbe's revenue and earnings outlook. 2015 is a challenging year on multiple fronts and Kalbe is expected to record negative earnings growth, the first time since GFC crisis. Demand recovery and improvement in distribution business will lead to better earnings growth. Successful implementation of BPJS Health and increase in healthcare spending. The government intends to increase BPJS participation from c.150mn this year to all Indonesians (250mn) by 2019. Successful implementation will boost healthcare spending in Indonesia, from a low 2.9% of GDP currently to a target 3.5 % of GDP in the next four years.
Key Risks:
Exposure to USD. Most of the materials for pharmaceutical products are imported, and hence, Kalbe is affected by the weak rupiah. Further weakness in the rupiah will hurt Kalbe's margins and earnings because there is a time-lag in adjusting prices. Litigation risk and product recall. Kalbe is subjected to medical claim and product recall, which could have an impact on the company's performance. Regulatory risks. The pharmaceutical industry is regulated and subjected to government's laws such as price cap and manufacturing process. In addition, there is a restriction on foreign investment. Material changes in the regulation could have an adverse impact on Kalbe's business. Company Background
KLBF is a leading pharmaceutical company in Indonesia. The company offers prescription and non-prescription drugs, as well as nutritional and consumer health products. In addition, the company has distribution and logistics operations under PT Enseval Putera Megatrading.
Leverage & Asset Turnover (x)
Capital Expenditure
ROE (%)
Forward PE Band (x)
PB Band (x)
Source: Company, DBS Vickers
1.3
1.4
1.4
1.5
1.5
1.6
1.6
0.00
0.02
0.04
0.06
0.08
0.10
0.12
0.14
2013A 2014A 2015F 2016F 2017F
Gross Debt to Equity (LHS) Asset Turnover (RHS)
0.0
200.0
400.0
600.0
800.0
1,000.0
1,200.0
2013A 2014A 2015F 2016F 2017F
Capital Expenditure (-)
Rp
0.0%
5.0%
10.0%
15.0%
20.0%
25.0%
2013A 2014A 2015F 2016F 2017F
Average
+1 stdev
+2 stdev
-1 stdev
-2 stdev5.0
12.0
19.0
26.0
33.0
40.0
Jan-10 Jan-11 Jan-12 Jan-13 Jan-14 Jan-15
(x)
Avg: 7.5x
+1sd: 8.84x
+2sd: 10.18x
‐1sd: 6.16x
‐2sd: 4.82x4.3
5.3
6.3
7.3
8.3
9.3
10.3
Nov-11 Nov-12 Nov-13 Nov-14 Nov-15
(x)

ASIAN INSIGHTS VICKERS SECURITIES Page 30
Company Guide
Kalbe Farma
Segmental Breakdown
FY Dec 2013A 2014A 2015F 2016F 2017F Revenues (Rpbn) Prescription 3,869 4,329 4,566 4,885 5,457 Consumer Health 2,505 2,924 3,212 3,665 4,266 Nutritionals 3,792 4,581 5,039 5,761 6,956 Distribution & Logistics 5,836 5,534 5,120 5,156 5,637 Total 16,002 17,369 17,937 19,468 22,317 Gross Profit (Rpbn) Prescription 2,353 2,609 2,639 2,785 3,080 Consumer Health 1,335 1,550 1,638 1,869 2,219 Nutritionals 2,287 2,748 2,872 3,284 4,000 Distribution & Logistics 1,704 1,569 1,357 1,366 1,522 Total 7,679 8,476 8,506 9,304 10,821 Gross Profit Margins (%) Prescription 60.8 60.3 57.8 57.0 56.4 Consumer Health 53.3 53.0 51.0 51.0 52.0 Nutritionals 60.3 60.0 57.0 57.0 57.5 Distribution & Logistics 29.2 28.3 26.5 26.5 27.0 Total 48.0 48.8 47.4 47.8 48.5
Income Statement (Rpbn)
FY Dec 2013A 2014A 2015F 2016F 2017F Revenue 16,002 17,369 17,937 19,468 22,317 Cost of Goods Sold (8,323) (8,893) (9,431) (10,164) (11,496) Gross Profit 7,679 8,476 8,506 9,304 10,821 Other Opng (Exp)/Inc (5,130) (5,715) (5,847) (6,288) (7,141) Operating Profit 2,549 2,761 2,659 3,016 3,679 Other Non Opg (Exp)/Inc 1.82 (8.7) 6.06 5.63 5.50 Associates & JV Inc 0.0 0.0 0.0 0.0 0.0 Net Interest (Exp)/Inc 21.8 11.4 29.9 21.3 31.2 Exceptional Gain/(Loss) 0.0 0.0 0.0 0.0 0.0 Pre-tax Profit 2,573 2,764 2,695 3,043 3,717 Tax (602) (643) (660) (745) (910) Minority Interest (50.9) (56.4) (58.3) (63.2) (72.5) Preference Dividend 0.0 0.0 0.0 0.0 0.0 Net Profit 1,920 2,065 1,976 2,234 2,733 Net Profit before Except. 1,920 2,065 1,976 2,234 2,733 EBITDA 2,828 3,093 3,052 3,478 4,213 Growth Revenue Gth (%) 17.3 8.5 3.3 8.5 14.6 EBITDA Gth (%) 13.9 9.4 (1.3) 14.0 21.1 Opg Profit Gth (%) 14.9 8.3 (3.7) 13.4 22.0 Net Profit Gth (Pre-ex) (%) 10.7 7.6 (4.3) 13.0 22.3 Margins & Ratio Gross Margins (%) 48.0 48.8 47.4 47.8 48.5 Opg Profit Margin (%) 15.9 15.9 14.8 15.5 16.5 Net Profit Margin (%) 12.0 11.9 11.0 11.5 12.2 ROAE (%) 25.3 23.6 19.8 19.8 21.3 ROA (%) 18.5 17.4 15.0 15.3 16.7 ROCE (%) 23.0 21.7 18.4 18.5 20.0 Div Payout Ratio (%) 46.4 38.6 38.6 38.6 38.6 Net Interest Cover (x) NM NM NM NM NM
Source: Company, DBS Vickers
Distribution declined due to 3rd party customers
Lower margin due to USD/IDR fluctuation

ASIAN INSIGHTS VICKERS SECURITIES Page 31
Company Guide
Kalbe Farma
Quarterly / Interim Income Statement (Rpbn)
FY Dec 3Q2014 4Q2014 1Q2015 2Q2015 3Q2015 Revenue 4,379 4,610 4,247 4,473 4,408 Cost of Goods Sold (2,260) (2,265) (2,145) (2,277) (2,295) Gross Profit 2,119 2,345 2,102 2,196 2,113 Other Oper. (Exp)/Inc (1,450) (1,581) (1,418) (1,503) (1,513) Operating Profit 669 764 684 692 600 Other Non Opg (Exp)/Inc (1.2) 1.99 (0.8) 11.2 (6.5) Associates & JV Inc 0.0 0.0 (1.0) (0.1) 0.16 Net Interest (Exp)/Inc (4.7) 9.82 18.7 13.2 4.83 Exceptional Gain/(Loss) 0.0 0.0 0.0 0.0 0.0 Pre-tax Profit 663 776 701 717 598 Tax (156) (181) (163) (170) (148) Minority Interest (13.1) (17.1) (9.0) (12.3) (13.7) Net Profit 494 578 528 535 436 Net profit bef Except. 494 578 528 535 436 EBITDA 753 766 773 776 675 Growth Revenue Gth (%) 1.5 5.3 (7.9) 5.3 (1.5) EBITDA Gth (%) (2.2) 1.7 0.9 0.4 (13.0) Opg Profit Gth (%) (2.4) 14.3 (10.5) 1.3 (13.4) Net Profit Gth (Pre-ex) (%) (1.2) 17.0 (8.6) 1.2 (18.4) Margins Gross Margins (%) 48.4 50.9 49.5 49.1 47.9 Opg Profit Margins (%) 15.3 16.6 16.1 15.5 13.6 Net Profit Margins (%) 11.3 12.5 12.4 12.0 9.9
Balance Sheet (Rpbn)
FY Dec 2013A 2014A 2015F 2016F 2017F Net Fixed Assets 2,926 3,404 4,035 4,595 5,086 Invts in Associates & JVs 42.4 24.3 24.3 24.3 24.3 Other LT Assets 850 875 858 841 824 Cash & ST Invts 1,614 1,895 2,552 3,113 3,775 Inventory 3,053 3,091 3,272 3,540 4,008 Debtors 2,145 2,347 2,392 2,562 2,898 Other Current Assets 684 789 739 739 739 Total Assets 11,315 12,425 13,873 15,415 17,352 ST Debt 584 252 252 252 252 Creditor 1,152 1,133 1,309 1,416 1,603 Other Current Liab 905 1,001 1,001 1,001 1,001 LT Debt 0.0 44.2 44.2 44.2 44.2 Other LT Liabilities 175 177 177 177 177 Shareholder’s Equity 8,108 9,382 10,596 11,967 13,646 Minority Interests 392 435 494 557 629 Total Cap. & Liab. 11,315 12,425 13,873 15,415 17,352 Non-Cash Wkg. Capital 3,826 4,092 4,093 4,423 5,041 Net Cash/(Debt) 1,030 1,598 2,256 2,817 3,479 Debtors Turn (avg days) 45.1 47.2 48.2 46.4 44.6 Creditors Turn (avg days) 44.5 48.8 49.3 51.2 50.2 Inventory Turn (avg days) 117.3 131.1 128.4 128.1 125.6 Asset Turnover (x) 1.5 1.5 1.4 1.3 1.4 Current Ratio (x) 2.8 3.4 3.5 3.7 4.0 Quick Ratio (x) 1.4 1.8 1.9 2.1 2.3 Net Debt/Equity (X) CASH CASH CASH CASH CASH Net Debt/Equity ex MI (X) CASH CASH CASH CASH CASH Capex to Debt (%) 165.4 239.9 337.7 337.7 337.7 Z-Score (X) 17.9 19.1 17.9 17.4 17.4
Source: Company, DBS Vickers
Margin decline due to currency and revenue mix
Healthy balance sheet to support M&A

ASIAN INSIGHTS VICKERS SECURITIES Page 32
Company Guide
Kalbe Farma
Cash Flow Statement (Rpbn)
FY Dec 2013A 2014A 2015F 2016F 2017F Pre-Tax Profit 2,573 2,764 2,695 3,043 3,716 Dep. & Amort. 284 348 395 465 536 Tax Paid (646) (643) (660) (745) (910) Assoc. & JV Inc/(loss) 0.0 0.0 0.0 0.0 0.0 Chg in Wkg.Cap. 0.0 (263) (0.7) (331) (617) Other Operating CF (1,277) 118 0.0 0.0 0.0 Net Operating CF 933 2,323 2,429 2,431 2,724 Capital Exp.(net) (966) (710) (1,000) (1,000) (1,000) Other Invts.(net) 81.6 (28.1) 0.0 0.0 0.0 Invts in Assoc. & JV 0.0 0.0 0.0 0.0 0.0 Div from Assoc & JV 2.12 0.53 0.0 0.0 0.0 Other Investing CF 0.0 61.5 0.0 0.0 0.0 Net Investing CF (882) (677) (1,000) (1,000) (1,000) Div Paid (901) (797) (763) (862) (1,055) Chg in Gross Debt 287 (380) 0.0 0.0 0.0 Capital Issues 0.0 0.0 0.0 0.0 0.0 Other Financing CF 0.0 0.0 0.0 0.0 0.0 Net Financing CF (613) (1,177) (763) (862) (1,055) Currency Adjustments 95.5 0.0 0.0 0.0 0.0 Chg in Cash (467) 469 666 569 669 Opg CFPS (Rp) 19.9 55.2 51.8 58.9 71.3
Source: Company, DBS Vickers
Target Price & Ratings History
Source: DBS Vickers
S.No. Date Closing PriceTarget Price
Rating
1: 02 Jan 15 1810 1900 BUY
2: 04 Feb 15 1835 1900 BUY
3: 23 Feb 15 1795 1900 BUY
4: 26 Mar 15 1835 1900 BUY
5: 31 Mar 15 1865 1900 BUY
6: 05 May 15 1825 1900 HOLD
7: 16 Sep 15 1510 1900 HOLD
Note : Share price and Target price are adjusted for corporate actions.
1
2
3
4
5
6
7
1249
1349
1449
1549
1649
1749
1849
1949
Nov-14 Mar-15 Jul-15 Nov-15
Rp

Industry Focus
Indonesia Healthcare Sector
Page 33
DBSV recommendations are based an Absolute Total Return* Rating system, defined as follows:
STRONG BUY (>20% total return over the next 3 months, with identifiable share price catalysts within this time frame)
BUY (>15% total return over the next 12 months for small caps, >10% for large caps)
HOLD (-10% to +15% total return over the next 12 months for small caps, -10% to +10% for large caps)
FULLY VALUED (negative total return i.e. > -10% over the next 12 months)
SELL (negative total return of > -20% over the next 3 months, with identifiable catalysts within this time frame)
* Share price appreciation + dividends
GENERAL DISCLOSURE/DISCLAIMER This report is prepared by PT. DBS Vickers Securities Indonesia ("DBSVI"). This report is solely intended for the clients of DBS Bank Ltd and DBS Vickers Securities (Singapore) Pte Ltd, its respective connected and associated corporations and affiliates (collectively, the “DBS Vickers Group”) only and no part of this document may be (i) copied, photocopied or duplicated in any form or by any means or (ii) redistributed without the prior written consent of DBS Bank Ltd. The research set out in this report is based on information obtained from sources believed to be reliable, but we (which collectively refers to DBS Bank Ltd., its respective connected and associated corporations, affiliates and their respective directors, officers, employees and agents (collectively, the “DBS Group”)) do not make any representation or warranty as to its accuracy, completeness or correctness. Opinions expressed are subject to change without notice. This document is prepared for general circulation. Any recommendation contained in this document does not have regard to the specific investment objectives, financial situation and the particular needs of any specific addressee. This document is for the information of addressees only and is not to be taken in substitution for the exercise of judgement by addressees, who should obtain separate independent legal or financial advice. The DBS Group accepts no liability whatsoever for any direct, indirect and/or consequential loss (including any claims for loss of profit) arising from any use of and/or reliance upon this document and/or further communication given in relation to this document. This document is not to be construed as an offer or a solicitation of an offer to buy or sell any securities. The DBS Group, along with its affiliates and/or persons associated with any of them may from time to time have interests in the securities mentioned in this document. The DBS Group may have positions in, and may effect transactions in securities mentioned herein and may also perform or seek to perform broking, investment banking and other banking services for these companies. Any valuations, opinions, estimates, forecasts, ratings or risk assessments herein constitutes a judgment as of the date of this report, and there can be no assurance that future results or events will be consistent with any such valuations, opinions, estimates, forecasts, ratings or risk assessments. The information in this document is subject to change without notice, its accuracy is not guaranteed, it may be incomplete or condensed and it may not contain all material information concerning the company (or companies) referred to in this report. The valuations, opinions, estimates, forecasts, ratings or risk assessments described in this report were based upon a number of estimates and assumptions and are inherently subject to significant uncertainties and contingencies. It can be expected that one or more of the estimates on which the valuations, opinions, estimates, forecasts, ratings or risk assessments were based will not materialize or will vary significantly from actual results. Therefore, the inclusion of the valuations, opinions, estimates, forecasts, ratings or risk assessments described herein IS NOT TO BE RELIED UPON as a representation and/or warranty by the DBS Group (and/or any persons associated with the aforesaid entities), that: (a) such valuations, opinions, estimates, forecasts, ratings or risk assessments or their underlying assumptions will be achieved, and (b) there is any assurance that future results or events will be consistent with any such valuations, opinions, estimates, forecasts, ratings or risk
assessments stated therein. Any assumptions made in this report that refers to commodities, are for the purposes of making forecasts for the company (or companies) mentioned herein. They are not to be construed as recommendations to trade in the physical commodity or in the futures contract relating to the commodity referred to in this report. DBS Vickers Securities (USA) Inc ("DBSVUSA")"), a U.S.-registered broker-dealer, does not have its own investment banking or research department, has not participated in any public offering of securities as a manager or co-manager or in any other investment banking transaction in the past twelve months and does not engage in market-making. ANALYST CERTIFICATION The research analyst(s) primarily responsible for the content of this research report, in part or in whole, certifies that the views about the companies and their securities expressed in this report accurately reflect his/her personal views. The analyst(s) also certifies that no part of his/her compensation was, is, or will be, directly, or indirectly, related to specific recommendations or views expressed in this report. As of 26 November 2015, the analyst(s) and his/her spouse and/or relatives who are financially dependent on the analyst(s), do not hold interests in the securities recommended in this report (“interest” includes direct or indirect ownership of securities).
COMPANY-SPECIFIC / REGULATORY DISCLOSURES 1. PT. DBS Vickers Securities Indonesia ("DBSVI") has a proprietary position in Kalbe Farma and Mitra Keluarga Karyasehat
recommended in this report as of 25 November 2015.
2.
Compensation for investment banking services: DBSVUSA does not have its own investment banking or research department, nor has it participated in any public offering of

Industry Focus
Indonesia Healthcare Sector
Page 34
securities as a manager or co-manager or in any other investment banking transaction in the past twelve months. Any US persons wishing to obtain further information, including any clarification on disclosures in this disclaimer, or to effect a transaction in any security discussed in this document should contact DBSVUSA exclusively.
RESTRICTIONS ON DISTRIBUTION
General This report is not directed to, or intended for distribution to or use by, any person or entity who is a citizen or resident of or located in any locality, state, country or other jurisdiction where such distribution, publication, availability or use would be contrary to law or regulation.
Australia This report is being distributed in Australia by DBS Bank Ltd. (“DBS”) or DBS Vickers Securities (Singapore) Pte Ltd (“DBSVS”), both of which are exempted from the requirement to hold an Australian Financial Services Licence under the Corporation Act 2001 (“CA”) in respect of financial services provided to the recipients. Both DBS and DBSVS are regulated by the Monetary Authority of Singapore under the laws of Singapore, which differ from Australian laws. Distribution of this report is intended only for “wholesale investors” within the meaning of the CA.
Hong Kong This report is being distributed in Hong Kong by DBS Vickers (Hong Kong) Limited which is licensed and regulated by the Hong Kong Securities and Futures Commission.
Indonesia This report is being distributed in Indonesia by PT DBS Vickers Securities Indonesia.
Malaysia This report is distributed in Malaysia by AllianceDBS Research Sdn Bhd ("ADBSR"). Recipients of this report, received from ADBSR are to contact the undersigned at 603-2604 3333 in respect of any matters arising from or in connection with this report. In addition to the General Disclosure/Disclaimer found at the preceding page, recipients of this report are advised that ADBSR (the preparer of this report), its holding company Alliance Investment Bank Berhad, their respective connected and associated corporations, affiliates, their directors, officers, employees, agents and parties related or associated with any of them may have positions in, and may effect transactions in the securities mentioned herein and may also perform or seek to perform broking, investment banking/corporate advisory and other services for the subject companies. They may also have received compensation and/or seek to obtain compensation for broking, investment banking/corporate advisory and other services from the subject companies.
Wong Ming Tek, Executive Director, ADBSR
Singapore This report is distributed in Singapore by DBS Bank Ltd (Company Regn. No. 196800306E) or DBSVS (Company Regn No. 198600294G), both of which are Exempt Financial Advisers as defined in the Financial Advisers Act and regulated by the Monetary Authority of Singapore. DBS Bank Ltd and/or DBSVS, may distribute reports produced by its respective foreign entities, affiliates or other foreign research houses pursuant to an arrangement under Regulation 32C of the Financial Advisers Regulations. Where the report is distributed in Singapore to a person who is not an Accredited Investor, Expert Investor or an Institutional Investor, DBS Bank Ltd accepts legal responsibility for the contents of the report to such persons only to the extent required by law. Singapore recipients should contact DBS Bank Ltd at 6327 2288 for matters arising from, or in connection with the report.
Thailand This report is being distributed in Thailand by DBS Vickers Securities (Thailand) Co Ltd. Research reports distributed are only intended for institutional clients only and no other person may act upon it.
United Kingdom
This report is being distributed in the UK by DBS Vickers Securities (UK) Ltd, who is an authorised person in the meaning of the Financial Services and Markets Act and is regulated by The Financial Conduct Authority. Research distributed in the UK is intended only for institutional clients.
Dubai
This research report is being distributed in The Dubai International Financial Centre (“DIFC”) by DBS Bank Ltd., (DIFC Branch) having its office at PO Box 506538, 3rd Floor, Building 3, East Wing, Gate Precinct, Dubai International Financial Centre (DIFC), Dubai, United Arab Emirates. DBS Bank Ltd., (DIFC Branch) is regulated by The Dubai Financial Services Authority. This research report is intended only for professional clients (as defined in the DFSA rulebook) and no other person may act upon it.
United States This report was prepared by DBS Vickers Securities Indonesia (“DBSVI”). DBSVUSA did not participate in its preparation. The research analyst(s) named on this report are not registered as research analysts with FINRA and are not associated persons of DBSVUSA. The research analyst(s) are not subject to FINRA Rule 2241 restrictions on analyst compensation, communications with a subject company, public appearances and trading securities held by a research analyst. This report is being distributed in the United States by DBSVUSA, which accepts responsibility for its contents. This report may only be distributed to Major U.S. Institutional Investors (as defined in SEC Rule 15a-6) and to such other institutional investors and qualified persons as DBSVUSA may authorize. Any U.S. person receiving this report who wishes to effect transactions in any securities referred to herein should contact DBSVUSA directly and not its affiliate.
Other jurisdictions
In any other jurisdictions, except if otherwise restricted by laws or regulations, this report is intended only for qualified, professional, institutional or sophisticated investors as defined in the laws and regulations of such jurisdictions.
PT. DBS Vickers Securities Indonesia
DBS Bank Tower, Ciputra World 1, 32/F Jl. Prof. Dr. Satrio Kav. 3-5, Jakarta 12940, Indonesia
Tel. 6221-3003 4900, Fax: 6221-3003 4943