Indonesia Consumer Survey 2016 - Credit Suisse
126
DISCLOSURE APPENDIX AT THE BACK OF THIS REPORT CONTAINS IMPORTANT DISCLOSURES, ANALYST CERTIFICATIONS, AND THE STATUS OF NON-US ANALYSTS. US Disclosure: Credit Suisse does and seeks to do business with companies covered in its research reports. As a result, investors should be aware that the Firm may have a conflict of interest that could affect the objectivity of this report. Investors should consider this report as only a single factor in making their investment decision. CREDIT SUISSE SECURITIES RESEARCH & ANALYTICS BEYOND INFORMATION ® Client-Driven Solutions, Insights, and Access 05 April 2016 Asia Pacific/Indonesia Equity Research Food Producers / Tobacco / Personal Products / Soft Drinks (Consumer Staples ID (Asia)/Healthcare ID (Asia)) Indonesia Consumer Survey 2016 CONNECTIONS SERIES Rise and shine Credit Suisse Indonesia Consumer Survey: Key themes……………………….. 4 The sixth Credit Suisse Indonesia Consumer Survey……………………………12 Key sectors………………………..………………………..……………………….. 29 Top picks………………………..………………………..……………………….….81 Research Analysts Ella Nusantoro 62 21 255 37917 [email protected] Priscilla Tjitra 62 21 2553 7906 [email protected] Christy Halim Michael Pranata
Transcript of Indonesia Consumer Survey 2016 - Credit Suisse

DISCLOSURE APPENDIX AT THE BACK OF THIS REPORT CONTAINS IMPORTANT DISCLOSURES, ANALYST CERTIFICATIONS, AND THE STATUS OF NON-US ANALYSTS. US Disclosure: Credit Suisse does and seeks to do business with companies covered in its research reports. As a result, investors should be aware that the Firm may have a conflict of interest that could affect the objectivity of this report. Investors should consider this report as only a single factor in making their investment decision.
CREDIT SUISSE SECURITIES RESEARCH & ANALYTICS BEYOND INFORMATION®
Client-Driven Solutions, Insights, and Access
05 April 2016
Asia Pacific/Indonesia
Equity Research
Food Producers / Tobacco / Personal Products /
Soft Drinks (Consumer Staples ID (Asia)/Healthcare ID (Asia))
Indonesia Consumer Survey 2016
CONNECTIONS SERIES
Rise and shine
Credit Suisse Indonesia Consumer Survey: Key themes……………………….. 4
The sixth Credit Suisse Indonesia Consumer Survey……………………………12
Key sectors………………………..………………………..……………………….. 29
Top picks………………………..………………………..……………………….….81
Research Analysts
Ella Nusantoro
62 21 255 37917
Priscilla Tjitra
62 21 2553 7906
Christy Halim
Michael Pranata

05 April 2016
Indonesia Consumer Survey 2016 2
Introduction We are delighted to publish the sixth edition of Credit Suisse Research Institute’s
Emerging Consumer Survey—a project reflecting the results of nearly 16,000 detailed
face-to-face interviews with consumers across nine major emerging economies of Brazil,
China, India, Indonesia, Mexico, Russia, Saudi Arabia, South Africa and Turkey. In
conjunction with this publication, our investment bank research analysts publish the EM
Consumer Playbook, which focuses on related investment recommendations.
With investor sentiment now showing signs of improvement in emerging markets, our
study provides investors timely insights with regard to the powerful theme of a fast-
developing consumer culture shaped by technological innovation. Should there be doubt
as to the significance of the story, our analysis suggests that nearly 100 mn new
households in our survey countries have found their way into the middle-class territory in
the last two years.
These signs of improvement do of course come after a torrid 2015 for investors in the
region, and our barometers of consumer confidence reflect this. The percentage of our
respondents who now consider it a good time to make a major purchase has fallen by 10%
against a year ago. Similar indicators for Brazil and Russia have dropped sharply. The
countries that top our Emerging Consumer Scorecard are India, China and Saudi Arabia.
Supportive momentum to personal incomes is the common factor.
The weakest countries (Brazil, Russia and South Africa) shared a difficult economic
cocktail of weak currencies, commodity exposure and political risk in 2015. We show how
a weak currency is negative for consumer confidence. Hence, a revival in fortunes of the
countries above and on-going support for emerging consumers rest more widely on the
stability of their currencies in 2016. The good news is that the improving relative growth
projections for emerging markets coupled with currencies that seem intrinsically
undervalued suggests that this could be the case.
We also find that the rise of the emerging consumer is defined as much by age as
nationality. In nearly every surveyed country, the income prospects of the youngest age
brackets are the most optimistic. When we drill down into how this youthful dollar is spent,
a 'lifestyle' theme emerges and specifically is one of a growing healthy lifestyle.
'Premiumisation' is the other watchword to come through in our interviews. The on-going
sharp growth in e-commerce activity and the developing 'sharing economy' provide a
broader backdrop. In e-commerce specifically, we illustrate how online retail markets
across the key countries surveyed can more than triple annual revenue to reach US$2.5 tn
by 2025.
Finally, a legitimate question to pose is whether the structural themes that we seek to draw
out here actually matter for an investor amid economic stress. Clearly, the tailwind of a
cycle on the upswing and a healthy degree of risk appetite are optimal. However, if
investors had simply exited emerging markets as relative growth momentum began to flag
in 2010, a five-fold increase in the online penetration of retail sales in China would have
passed them by, as would the opportunities from the rural transformation in India and
successive years of growth in healthcare provision.
Even when the cycle is a challenge, structural themes can and do still deliver. We believe
that this year’s Survey and Playbook should continue to provide an instructive guide for
investors.
Giles Keating, Vice
Chairman of Investment
Solutions & Products
Stefano Natella, Head of
Global Markets Research

05 April 2016
Indonesia Consumer Survey 2016 3
Credit Suisse's Indonesia Research Team
Research analysts Telephone Email
Jahanzeb Naseer +62 21 2553 7977 [email protected]
Ella Nusantoro +62 21 2553 7917 ella.nusantoro@credit suisse.com
Priscilla Tjitra +62 21 2553 7906 [email protected]
Ari Jahja +62 21 2553 7976 [email protected]
Sanjay Jain +852 2101 6088 [email protected]
Laurensius Teiseran +62 21 2553 7931 [email protected]
Colin McCallum +852 2101 6514 [email protected]
Anand Swaminathan +65 6212 3012 [email protected]
Santitarn Sathirathai +65 6212 5675 [email protected]

05 April 2016
Indonesia Consumer Survey 2016 4
Credit Suisse Indonesia Consumer Survey 2016: Key themes Figure 1: Emerging consumer survey scorecard 2014 vs 2015
Rankings Personal
finances
Inflation
expectations
Household income
expectation
Time for a major
purchase
Income history Rank based on
five factors
(6-12m horizon) 2014 2015 2014 2015 2014 2015 2014 2015 2014 2015 2014 2015
India 2 3 3 4 3 2 2 2 1 1 1 1
China 4 1 4 3 5 4 3 3 4 4 5 2
Saudi Arabia 5 4 5 2 5 5 1 1 3 3 4 2
Indonesia 3 2 6 7 2 1 4 4 2 2 3 4
Turkey 9 6 1 1 9 7 7 8 7 5 6 5
Mexico 6 5 7 6 4 8 9 5 8 8 7 6
Brazil 1 6 2 8 1 3 4 9 5 9 2 7
South Africa 7 8 8 9 8 6 8 6 9 6 9 7
Russia 8 9 9 5 7 9 6 7 6 7 8 9
Note: Ranking is on a score of 1-9 for the nine countries surveyed. Source: Credit Suisse Emerging Consumer Survey 2016.
Figure 2: Indonesia's GDP peaked in 4Q10 and reached its
lowest in 2Q15...
Figure 3: Food spending increased to 50% in 2015 from
28% in 2010
6.0
6.3
5.8
6.8
6.5
6.3
6.0 5.9
6.1 6.2
5.9 5.9
5.5 5.6 5.5
5.6
5.1
5.0 5.0 5.0
4.7 4.7
4.7
5.0
4.5
5.0
5.5
6.0
6.5
7.0
1Q10
2Q10
3Q10
4Q10
1Q11
2Q11
3Q11
4Q11
1Q12
2Q12
3Q12
4Q12
1Q13
2Q13
3Q13
4Q13
1Q14
2Q14
3Q14
4Q14
1Q15
2Q15
3Q15
4Q15
GD
P g
row
th (%
)
Housing
8% Auto2% Education
4%
Food50%
Home and Personal Care
8%
Health Care6%
Savings18%
Entertainment4%
Source: Bloomberg Source: Credit Suisse Emerging Consumer Survey 2016
Figure 4: Indonesia's spending momentum 2015 vs 2010—what has changed in behaviour from six years ago
Carbonated drinksBottled water
Dairy products Instant noodles
Cigarettes
Tissues
Feminine hygiene
Cosmetics
Basic mobile phone
Smartphone
Cars
Internet access
Computers
Property
Holiday
Motorcycle
Fashion apparel
Sport shoes and wear
Watches
Jewellery
Perfumes
(30)
(20)
(10)
-
10
20
30
40
- 10 20 30 40 50 60 70 80 90 100
Reco
rded
spen
ding
in 2
015
vs. 2
010
2015 respondents that own/have bought each item (%)
Source: Credit Suisse Emerging Consumer Survey 2016

05 April 2016
Indonesia Consumer Survey 2016 5
Key themes from the emerging consumer survey in 2016
(1) The emerging consumer in 2016
Weak markets and currencies, and downgraded growth expectations have provided
the backdrop of this year's Emerging Consumer Survey. The Indian and Chinese
consumers are still the most robust, while the picture in weak-currency countries such
as Brazil and Russia is poor.
(2) It's all about the currency
While there is a debate of cause and effect, the currency effectively serves as a
transmission of hardship to the consumer via imported inflation on the one
consumption item that typically consumes more of the household budget than any
other—food. EM currencies have rarely been so far from estimates of purchasing
power parity (PPP). Clearly these currencies do not operate in a vacuum. As much as
the local factors such as politics, commodities and risk appetite are at work, they
reflect the broad deterioration in the economic momentum in the emerging versus the
developed word that we have seen in recent years.
(3) The EM consumer through a global lens
Confidence of many of the EM countries, particularly our top countries of India, Saudi
Arabia, China, and Indonesia, rank head and shoulders above many of the DM
consumers in the current environment.
(4) What does an optimistic consumer look like?
The broad themes that emerge have a resonance with previous surveys in that the
urban, young and higher-income earners offer the greatest degree of optimism.
(5) And who's buying what?
In terms of spending intention, we find the low ticket categories are the ones showing
the strongest momentum in every country compared to our previous survey. The
categories with highest spending intention and strongest momentum include fashion
items, sports shoes, perfumes and cosmetics. Categories with low spending intention
and weak momentum include foreign holidays, cars and electronics. Smartphones
show the weakest momentum of all; however, its penetration rates have risen rapidly
which naturally reduce spending intention. Fashion items and especially sports shoes
appear to be underpenetrated and still offer longer term potential as discretionary
spending increases.
(6) Structural growth in e-commerce
Data from this year's EMC survey clearly supports an on-going positive view on the
outlook for e-commerce, despite softer macro conditions in emerging economies. We
believe the softening economic conditions might actually improve the relative
competitive position of online operators, versus the more traditional "brick and mortar"
companies. The further expansion of the middle class, along with rising smartphone
ownership and related internet access also support a positive view on the e-
commerce growth story.
05 April 2016
Indonesia Consumer Survey 2016 6
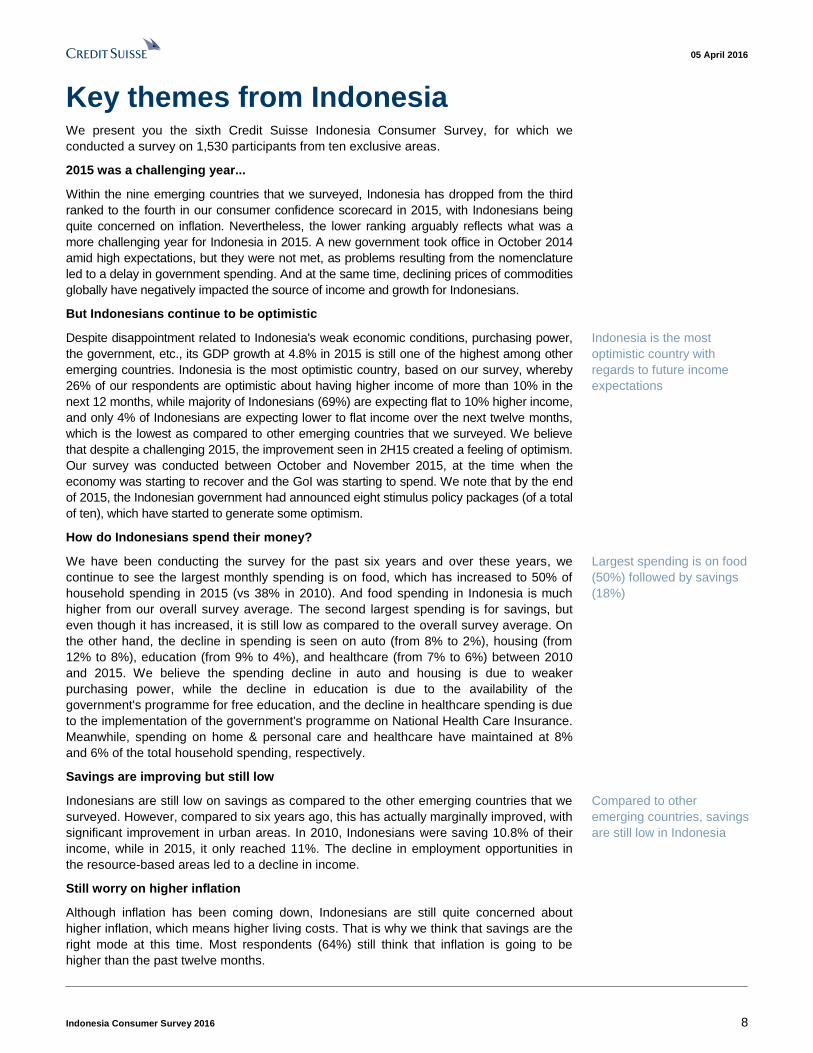
Table of contents Introduction 2
Credit Suisse's Indonesia Research Team 3 Credit Suisse Indonesia Consumer Survey 2016: Key themes 4 Key themes from the emerging consumer survey in 2016 5 Key themes from Indonesia 8 Key stocks preference 9 The sixth Credit Suisse Indonesia Consumer Survey 12
2015 was a challenging year... 13 ...with economic growth slowing down 13 But Indonesians continue to be optimistic 18 How do Indonesians spend their money? 22 Savings are improving, but still low 26 Still worries over higher inflation 27 Key sector selections 29
Automotive sector 30 Key stocks 30 Four-wheelers 30 Two-wheelers 31
Food and beverages 34 Key stocks 34 Looking for convenience 34 Preference towards local brands 36 Modest price increase seen 37 The rising popularity of beverages 39 Instant noodles 42 Dairy products 43 Cigarettes 45
Personal care products 53 Key stocks 53 Defensive goods 53
Branded goods 55 Key stocks 55 Aspiring for premium brands 55 Fashion 57 Sports shoes and wear 59
Internet and e-commerce 61 Mobile phones 65
Key stocks 65 The era of smartphones and LCD TVs 67
Healthcare 69 Key stocks 69 Availability of Jamkesnas reduces healthcare spending 69
Property 72 Key stocks 72 Potential demand continues to be high 73 Price expectations 74 Young population is key 75 High disposable income growth 76 Rising middle class and affluent consumers (MAC) 77
Banks 78 Key stocks 78 Auto interest on lower interest 78 Key stock selections 81

05 April 2016
Indonesia Consumer Survey 2016 7
Telkom (Telekomunikasi Indo.) (TLKM.JK / TLKM IJ) 82 Astra International (ASII.JK / ASII IJ) 84 Indofood CBP (ICBP.JK / ICBP IJ) 86 Indofood Sukses Makmur (INDF.JK / INDF IJ) 88 Matahari Department Store (LPPF.JK / LPPF IJ) 90 Summarecon Agung Tbk (SMRA.JK / SMRA IJ) 92 Bank Tabungan Pensiunan Nasional Tbk (BTPN.JK / BTPN IJ) 94 Link Net Tbk (LINK.JK / LINK IJ) 96 Siloam International Hospitals (SILO.JK / SILO IJ) 98 Tiphone Mobile Indonesia (TELE.JK / TELE IJ) 100 Appendix 1: Respondents' summary 102
Demographics 102 Income and others 103 Auto 106 Food and beverages 107 Personal care 108 Luxury goods 109 Technology and Internet 111 Telecommunications 112 Travel 114 Education 115 Healthcare 116
Appendix 2: Indonesia macro 117
05 April 2016
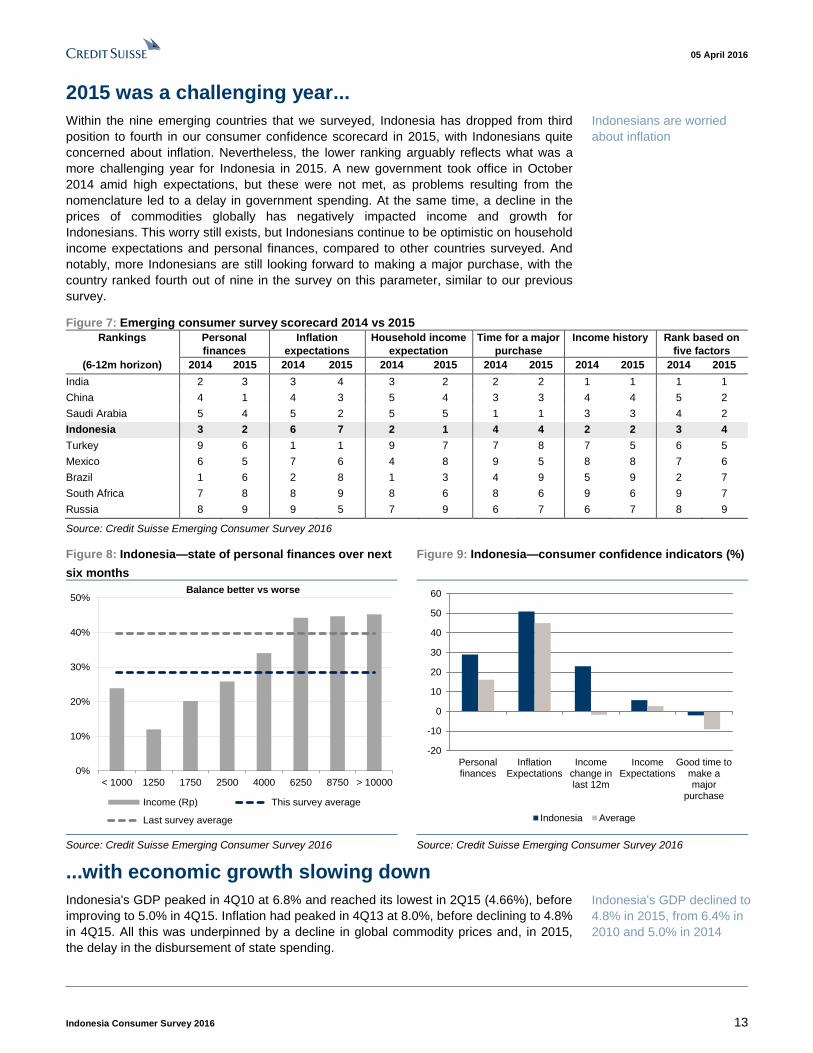
Indonesia Consumer Survey 2016 8
Key themes from Indonesia We present you the sixth Credit Suisse Indonesia Consumer Survey, for which we
conducted a survey on 1,530 participants from ten exclusive areas.
2015 was a challenging year...
Within the nine emerging countries that we surveyed, Indonesia has dropped from the third
ranked to the fourth in our consumer confidence scorecard in 2015, with Indonesians being
quite concerned on inflation. Nevertheless, the lower ranking arguably reflects what was a
more challenging year for Indonesia in 2015. A new government took office in October 2014
amid high expectations, but they were not met, as problems resulting from the nomenclature
led to a delay in government spending. And at the same time, declining prices of commodities
globally have negatively impacted the source of income and growth for Indonesians.
But Indonesians continue to be optimistic
Despite disappointment related to Indonesia's weak economic conditions, purchasing power,
the government, etc., its GDP growth at 4.8% in 2015 is still one of the highest among other
emerging countries. Indonesia is the most optimistic country, based on our survey, whereby
26% of our respondents are optimistic about having higher income of more than 10% in the
next 12 months, while majority of Indonesians (69%) are expecting flat to 10% higher income,
and only 4% of Indonesians are expecting lower to flat income over the next twelve months,
which is the lowest as compared to other emerging countries that we surveyed. We believe
that despite a challenging 2015, the improvement seen in 2H15 created a feeling of optimism.
Our survey was conducted between October and November 2015, at the time when the
economy was starting to recover and the GoI was starting to spend. We note that by the end
of 2015, the Indonesian government had announced eight stimulus policy packages (of a total
of ten), which have started to generate some optimism.
How do Indonesians spend their money?
We have been conducting the survey for the past six years and over these years, we
continue to see the largest monthly spending is on food, which has increased to 50% of
household spending in 2015 (vs 38% in 2010). And food spending in Indonesia is much
higher from our overall survey average. The second largest spending is for savings, but
even though it has increased, it is still low as compared to the overall survey average. On
the other hand, the decline in spending is seen on auto (from 8% to 2%), housing (from
12% to 8%), education (from 9% to 4%), and healthcare (from 7% to 6%) between 2010
and 2015. We believe the spending decline in auto and housing is due to weaker
purchasing power, while the decline in education is due to the availability of the
government's programme for free education, and the decline in healthcare spending is due
to the implementation of the government's programme on National Health Care Insurance.
Meanwhile, spending on home & personal care and healthcare have maintained at 8%
and 6% of the total household spending, respectively.
Savings are improving but still low
Indonesians are still low on savings as compared to the other emerging countries that we
surveyed. However, compared to six years ago, this has actually marginally improved, with
significant improvement in urban areas. In 2010, Indonesians were saving 10.8% of their
income, while in 2015, it only reached 11%. The decline in employment opportunities in
the resource-based areas led to a decline in income.
Still worry on higher inflation
Although inflation has been coming down, Indonesians are still quite concerned about
higher inflation, which means higher living costs. That is why we think that savings are the
right mode at this time. Most respondents (64%) still think that inflation is going to be
higher than the past twelve months.
Indonesia is the most
optimistic country with
regards to future income
expectations
Largest spending is on food
(50%) followed by savings
(18%)
Compared to other
emerging countries, savings
are still low in Indonesia

05 April 2016
Indonesia Consumer Survey 2016 9
Key stocks preference Telkom (TLKM.JK, Rp3,350.00, OUTPERFORM, TP Rp3,800.00)
Indonesia’s cellular market continues to look attractive, with good monetisation of very high demand for cellular data services (driven by social networking). This has been made possible by an improving competitive environment, as the industry consolidates towards a three-player market. There is still a long way to go in growing data volumes; smartphone penetration on Telkomsel's network reached just 40.4% as at December 2015. In addition, 4G launch can add further impetus to this improving monetisation, with an additional 40% uplift in ARPU from 3G to 4G currently being experienced.
Astra International (ASII.JK, Rp7,325.00, OUTPERFORM, TP Rp7,600.00)
Improvement in macroeconomic conditions and launch of new models should support 4W
sales volume growth. Monetary easing (75 bp BI cut) should come into full effect in one to
two quarters, resulting in cheaper financing for cars and motorcycles.
Indofood CBP (ICBP.JK, Rp15,325.00, OUTPERFORM, TP Rp18,300.00)
Noodles division will continue to be the company's backbone although it is already highly
penetrated. The driver going forward will be product innovation and new product launches.
Indofood Sukses Makmur (INDF.JK, Rp7,225.00, OUTPERFORM, TP Rp8,700.00)
Fully integrated food company in Indonesia, with most of its earnings derived from the
listed Indofood CBP (ICBP). With slight recovery seen on CPO prices, its agribusiness
should see improvement.
Matahari Department Store (LPPF.JK, Rp18,175.00, OUTPERFORM, TP Rp19,400.00)
We believe Matahari will be the main beneficiary on the back of a rising middle class
segment. Its main exclusive label, Nevada, continues to be the top fashion brand favoured
by our respondents. We believe this is due to its nice design and quality supported by its
affordable price points.
Summarecon Agung (SMRA.JK, Rp1,620.00, OUTPERFORM, TP Rp1,960.00)
It has a good track record in township development in Indonesia and has been successful
in strengthening recurring income through rental income from retail spaces. Around 70%
of SMRA’s operating income is still being generated from the property development
segment. Additionally, we like the name given its exposure to medium segment as well as
its diversified land bank.
Bank Tabungan Pensiunan Nasional (BTPN.JK, Rp2,795.00, OUTPERFORM, TP
Rp3,500.00)
As the central bank now embarks on a lower rate environment with policy rate standing at
6.75% currently, BTPN having 85% deposits as time deposit should benefit most
compared to other banks under our coverage. For this year, we expect another 25 bp of
rate cut bringing policy rate down to 6.5%. As a reminder, when BI hiked its policy rate by
175 bp between June and November 2013, the net interest margins of the top-four banks
expanded, while that of second-tier banks compressed sharply over the next quarters.
Link Net (LINK.JK, Rp4,035.00, OUTPERFORM, TP Rp8,300.00)
Fixed internet access is also undergoing something of a renaissance in Indonesia, as demand for access to high-speed content and gaming increases. Thus, it is still our view that there is plenty of room for growth in the Indonesian broadband market. We expect that as the market develops, competitors will learn to target their rollouts in greenfield areas which are not yet covered by an existing player (such as Link Net), since it will result in a much higher return on their investment. Link Net offers high growth and high return on invested capital, and therefore offers an attractive way to invest in rising fixed internet penetration in Indonesia.

05 April 2016
Indonesia Consumer Survey 2016 10
Siloam International Hospitals (SILO.JK, Rp7,450.00, OUTPERFORM, TP
Rp13,000.00)
We expect Siloam's top-line growth to continue with its pipeline expansion plans and the
increase in healthcare spend as a percentage of total spend. By 2017, Siloam targets to
achieve 10,000 beds from the current 4,800 and have over 50 hospitals in more than 25
cities.
We believe that in the medium term. Siloam could be the best play to leverage on the
healthcare under-penetration story in Indonesia as it builds a hospital network unrivalled in
scope and scale across Indonesia. Margin issues are likely to be shortlived.
Tiphone Mobile Indonesia (TELE.JK, Rp775.00, OUTPERFORM, TP Rp900.00)
As the largest prepaid mobile phone voucher distributor in Indonesia, Tiphone Mobile
Indonesia is a beneficiary of higher data service consumption from rising internet access
needs.
Telkomsel owns a 25% stake (effective from Sep-2014); thus it is now an exclusive
distributor for Telkomsel, a market leader in Indonesia’s telecom industry (30% market
share in Telkomsel distribution). It is the only dealer that distributes through three
diversified channels (traditional, modern retail, and banks).

05 April 2016
Indonesia Consumer Survey 2016 11
Figure 5: Indonesia's consumer related names valuation
Company Ticker Price Rtg Mkt cap TP 16E
PE (x)
EPS growth P/E (x) EV-EBITDA
(x)
PB (x) ROE ADTV
3mos
(Rp) (US$mn) (Rp) at TP 16E 17E 16E 17E 16E 17E 16E 17E 16E 17E (US$
mn)
AUTOMOBILES & COMPONENTS 15.3 16.3% 17.9% 14.8 12.5 13.3 11.4 2.7 2.5 18.6% 19.7% 21.8
Astra International ASII.JK 7,325 O 22,477 7,600 15.3 16.3% 17.9% 14.8 12.5 13.3 11.4 2.7 2.5 18.6% 19.7% 21.8
BANKS 12.8 2.8% 16.5% 13.8 12.1 9.7 8.6 2.2 1.9 15.6% 15.8% 18.3
BTPN BTPN.JK 2,795 O 1,225 3,500 9.5 18.8% 15.2% 7.6 6.6 5.2 4.5 1.0 0.9 13.6% 13.5% 0.3
Bank Central Asia BBCA.JK 13,300 U 24,855 10,900 16.0 5.4% 8.0% 19.6 18.1 14.5 13.4 3.1 2.7 15.9% 15.2% 19.4
Bank Danamon BDMN.JK 3,795 U 2,729 3,500 10.3 36.7% 30.4% 11.1 8.5 2.5 1.9 1.0 0.9 8.9% 10.7% 0.6
Bank Jabar Banten BJBR.JK 900 O 655 1,200 7.9 6.0% 16.2% 5.9 5.1 3.4 2.9 0.9 0.8 14.9% 15.9% 1.1
Bank Mandiri BMRI.JK 10,100 N 17,684 9,800 11.8 -4.4% 21.0% 12.1 10.0 8.3 6.8 1.9 1.7 15.4% 16.8% 18.9
Bank Negara Indonesia BBNI.JK 5,100 O 7,137 5,650 10.2 14.5% 25.9% 9.2 7.3 6.4 5.0 1.2 1.0 12.7% 14.3% 12.5
Bank Rakyat BBRI.JK 11,100 N 20,756 11,400 11.7 -5.2% 16.9% 11.4 9.7 8.6 7.3 2.0 1.7 17.5% 17.0% 23.5
Bank Tabungan Negara BBTN.JK 1,730 N 1,388 1,850 8.4 26.4% 30.8% 7.8 6.0 (0.4) (0.3) 1.1 1.0 14.6% 16.1% 3.2
CONSUMER 38.0 13.9% 11.2% 37.0 33.2 26.0 23.3 24.8 21.8 56.4% 55.9% 6.1
HM Sampoerna HMSP.JK 99,000 O 34,914 108,500 42.2 14.8% 9.4% 38.5 35.2 28.6 26.0 14.4 13.3 37.4% 37.8% 5.9
Unilever Indonesia UNVR.JK 43,175 U 24,970 41,400 45.8 14.0% 12.4% 49.0 43.2 34.7 30.8 57.8 49.9 117.6% 115.4% 7.4
Gudang Garam GGRM.JK 65,200 O 9,509 61,500 19.6 9.2% 16.6% 20.8 17.8 12.6 11.2 3.1 2.8 14.9% 15.6% 5.8
Indofood CBP ICBP.JK 15,325 O 6,773 18,300 27.8 18.1% 12.0% 23.3 20.8 14.1 12.4 4.9 4.3 21.0% 20.8% 3.4
Indofood Sukses Makmur INDF.JK 7,225 O 4,809 8,700 18.7 9.0% 6.2% 17.4 16.3 7.3 6.6 2.1 2.0 12.3% 12.1% 5.5
Kino Indonesia KINO.JK 3,780 O 539 5,900 23.5 26.5% 18.5% 15.1 12.7 9.1 7.7 3.5 3.1 17.3% 17.9% 0.2
HEALTHCARE 38.9 19.8% 23.1% 36.7 29.5 23.8 19.8 6.6 5.7 18.9% 19.7% 4.9
Kalbe Farma KLBF.JK 1,450 U 5,152 1,350 24.5 16.2% 16.3% 26.3 22.6 17.7 15.4 5.5 4.7 20.8% 21.0% 6.6
Mitra Keluarga MIKA.JK 2,475 N 2,730 2,500 52.8 16.5% 23.6% 52.3 42.3 38.4 30.9 9.3 8.0 17.8% 19.0% 2.2
Siloam Hospitals SILO.JK 7,450 O 653 13,000 94.3 61.9% 74.9% 54.0 30.9 11.1 8.0 4.6 4.1 8.5% 13.1% 2.7
MEDIA 24.4 17.4% 22.7% 23.6 19.3 15.8 13.4 8.6 7.1 34.0% 34.0% 2.5
Media Nusantara MNCN.JK 2,150 O 2,327 2,165 18.6 20.1% 27.1% 18.4 14.5 10.2 8.6 2.8 2.4 15.0% 16.9% 3.6
Surya Citra Media SCMA.JK 3,245 N 3,596 3,400 28.1 15.7% 19.9% 26.9 22.4 19.5 16.5 12.5 10.1 46.4% 45.1% 1.9
REAL ESTATE 14.5 13.6% 16.6% 12.3 10.5 9.0 7.8 2.1 1.8 17.2% 17.2% 2.8
Alam Sutera ASRI.JK 376 N 560 450 7.3 8.0% 9.7% 6.1 5.6 6.4 6.0 0.9 0.8 14.7% 14.1% 1.3
Bumi Serpong Damai BSDE.JK 1,815 O 2,648 2,260 15.1 5.0% 11.2% 12.1 10.9 9.8 8.6 1.5 1.3 12.4% 12.2% 3.7
Ciputra Development CTRA.JK 1,285 O 1,493 1,310 12.9 14.9% 17.5% 12.7 10.8 7.7 6.5 2.1 1.8 16.2% 16.7% 1.8
Pakuwon Jati PWON.JK 492 O 1,796 580 13.0 22.4% 22.1% 11.0 9.0 8.0 6.6 2.6 2.1 23.2% 22.8% 2.7
Summarecon SMRA.JK 1,620 O 1,771 1,960 18.7 18.3% 20.5% 15.4 12.8 10.8 9.5 3.1 2.6 20.0% 20.3% 3.0
RETAILING 24.5 60.8% 17.8% 23.9 20.1 14.7 13.3 6.6 5.6 27.5% 27.3% 3.6
Ace Hardware ACES.JK 885 N 1,150 870 23.1 10.0% 5.4% 23.4 22.2 16.9 16.5 4.9 4.2 20.9% 19.0% 0.5
Erajaya Swasembada ERAA.JK 695 O 153 825 9.2 10.3% 15.5% 7.7 6.7 5.8 5.3 0.6 0.6 7.9% 8.6% 0.4
Matahari Department Store LPPF.JK 18,175 O 4,020 19,400 26.1 22.0% 15.8% 24.4 21.1 17.6 15.6 9.5 8.0 38.8% 38.1% 6.2
Matahari Putra Prima MPPA.JK 1,700 N 693 1,550 22.5 102.3% 29.6% 24.7 19.1 11.6 10.1 3.0 2.6 12.0% 13.9% 1.1
Mitra Adiperkasa MAPI.JK 4,925 O 620 4,500 35.4 424.8% 47.8% 38.8 26.2 9.0 8.0 3.0 2.7 7.7% 10.4% 0.2
Ramayana Lestari RALS.JK 715 O 385 900 16.6 14.7% 8.5% 13.2 12.1 4.7 4.4 1.4 1.3 10.8% 11.0% 0.2
Tiphone TELE.JK 775 O 418 900 13.9 25.7% 17.0% 12.0 10.3 7.7 6.9 1.8 1.5 14.6% 15.1% 0.2
TELECOMMUNICATION SERVICES 19.9 7.4% 15.0% 17.9 15.7 7.1 6.5 4.6 4.0 26.0% 26.6% 17.8
Indosat ISAT.JK 6,125 N 2,523 5,800 22.3 -207.9% 14.1% 23.6 20.6 4.7 4.5 2.5 2.4 10.6% 11.4% 0.2
Link Net LINK.JK 4,035 O 931 8,300 29.9 32.0% 40.6% 14.5 10.3 6.8 5.4 2.8 2.4 19.5% 23.0% 0.3
Protelindo TOWR.JK 4,295 N 3,322 4,200 17.7 39.4% 17.3% 18.1 15.4 12.2 10.8 6.1 5.1 33.8% 33.1% 0.1
Telkom TLKM.JK 3,350 O 25,595 3,800 19.9 22.7% 10.7% 17.5 15.8 6.1 5.7 4.1 3.8 23.1% 23.8% 23.9
Tower Bersama TBIG.JK 5,850 N 2,127 5,650 15.9 16.9% 53.4% 16.4 10.7 14.0 12.0 11.4 7.5 69.6% 69.6% 0.7
* Share price as of 01 April 2016
Source: Thomson Reuters, company data, Credit Suisse estimates

05 April 2016
Indonesia Consumer Survey 2016 12
The sixth Credit Suisse Indonesia Consumer Survey This is our sixth Credit Suisse Indonesia Consumer Survey, one part of a survey that the
Credit Suisse Research Institute conducts in nine emerging countries (Brazil, China, India,
Indonesia, Russia, Saudi Arabia, South Africa, Turkey, and Mexico). The Credit Suisse
Research Institute engaged The Nielsen Company, a leader in data measurement and
information across a wide range of industries and regions, to conduct face-to-face
interviews with nearly 16,000 participants. This survey is a comprehensive and exclusive
study of the consumption patterns in each country as well as individuals' outlook about the
future.
For Indonesia, we conducted the survey on 1,530 participants from ten exclusive areas,
similar to previous surveys. This includes six in Java (Jakarta, Jabotabek, Surabaya,
Gresik/Lamongan/Sidoarjo, Bandung, and Kabupaten Bandung) and four outside Java
(Medan, Deli Serdang, Makassar, and Gowa). We believe that these areas sit well with
Indonesia's economy and population given that around 65% of GDP is derived from Java
and the remaining 35% from outside Java, according to BPS (the Indonesia Bureau of
Statistics).
Similar to our previous five surveys, 66% of our participants live in urban areas with the
remaining 34% in rural areas, while 51% are female and 49% male. Most of the
respondents (72%) are below 45 years old, in keeping with Indonesia's young
demographic profile.
Each respondent was asked 180 questions, divided into 12 categories: (1) screening; (2)
autos; (3) food and beverage; (4) personal care; (5) branded goods; (6) computers and
TV; (7) mobile phones; (8) internet; (9) travel; (10) property; (11) education; and (12)
healthcare.
Figure 6: Indonesia's survey summary and key economic indicators
Source: IMF, EIU, UN, Credit Suisse Indonesia Consumer Survey 2016
We have undertaken our
sixth year of survey to
identify Indonesian
consumer behaviour
1,530 respondents in ten
areas (six in Java, four
outside Java)
Some 66% live in urban
areas and 34% in rural
areas, while 72% are young,
aged less than 45 years old
05 April 2016
Indonesia Consumer Survey 2016 13
2015 was a challenging year...
Within the nine emerging countries that we surveyed, Indonesia has dropped from third
position to fourth in our consumer confidence scorecard in 2015, with Indonesians quite
concerned about inflation. Nevertheless, the lower ranking arguably reflects what was a
more challenging year for Indonesia in 2015. A new government took office in October
2014 amid high expectations, but these were not met, as problems resulting from the
nomenclature led to a delay in government spending. At the same time, a decline in the
prices of commodities globally has negatively impacted income and growth for
Indonesians. This worry still exists, but Indonesians continue to be optimistic on household
income expectations and personal finances, compared to other countries surveyed. And
notably, more Indonesians are still looking forward to making a major purchase, with the
country ranked fourth out of nine in the survey on this parameter, similar to our previous
survey.
Figure 7: Emerging consumer survey scorecard 2014 vs 2015
Rankings Personal
finances
Inflation
expectations
Household income
expectation
Time for a major
purchase
Income history Rank based on
five factors
(6-12m horizon) 2014 2015 2014 2015 2014 2015 2014 2015 2014 2015 2014 2015
India 2 3 3 4 3 2 2 2 1 1 1 1
China 4 1 4 3 5 4 3 3 4 4 5 2
Saudi Arabia 5 4 5 2 5 5 1 1 3 3 4 2
Indonesia 3 2 6 7 2 1 4 4 2 2 3 4
Turkey 9 6 1 1 9 7 7 8 7 5 6 5
Mexico 6 5 7 6 4 8 9 5 8 8 7 6
Brazil 1 6 2 8 1 3 4 9 5 9 2 7
South Africa 7 8 8 9 8 6 8 6 9 6 9 7
Russia 8 9 9 5 7 9 6 7 6 7 8 9
Source: Credit Suisse Emerging Consumer Survey 2016
Figure 8: Indonesia—state of personal finances over next
six months
Figure 9: Indonesia—consumer confidence indicators (%)
0%
10%
20%
30%
40%
50%
< 1000 1250 1750 2500 4000 6250 8750 > 10000
Income (Rp) This survey average
Last survey average
Balance better vs worse
-20
-10
0
10
20
30
40
50
60
Personalfinances
InflationExpectations
Incomechange inlast 12m
IncomeExpectations
Good time tomake amajor
purchase
Indonesia Average
Source: Credit Suisse Emerging Consumer Survey 2016 Source: Credit Suisse Emerging Consumer Survey 2016
...with economic growth slowing down
Indonesia's GDP peaked in 4Q10 at 6.8% and reached its lowest in 2Q15 (4.66%), before
improving to 5.0% in 4Q15. Inflation had peaked in 4Q13 at 8.0%, before declining to 4.8%
in 4Q15. All this was underpinned by a decline in global commodity prices and, in 2015,
the delay in the disbursement of state spending.
Indonesians are worried
about inflation
Indonesia's GDP declined to
4.8% in 2015, from 6.4% in
2010 and 5.0% in 2014

05 April 2016
Indonesia Consumer Survey 2016 14
Figure 10: Indonesia's GDP peaked in 4Q10 and reached
its lowest in 2Q15 ...
Figure 11: ... with inflation is starting to decline in 4Q15
6.0
6.3
5.8
6.8
6.5
6.3
6.0 5.9
6.1 6.2
5.9 5.9
5.5 5.6 5.5
5.6
5.1
5.0 5.0 5.0
4.7 4.7
4.7
5.0
4.5
5.0
5.5
6.0
6.5
7.01Q
102Q
103Q
104Q
101Q
112Q
113Q
114Q
111Q
122Q
123Q
124Q
121Q
132Q
133Q
134Q
131Q
142Q
143Q
144Q
141Q
152Q
153Q
154Q
15
GD
P g
row
th (%
)
3.6
4.4
6.2 6.3
6.8
5.9
4.6
4.1
3.7
4.4 4.0
3.9
4.5
5.1
8.0 8.0 7.8
7.1
4.4
6.5 6.5
7.1 7.1
4.8
3
4
5
6
7
8
9
1Q10
2Q10
3Q10
4Q10
1Q11
2Q11
3Q11
4Q11
1Q12
2Q12
3Q12
4Q12
1Q13
2Q13
3Q13
4Q13
1Q14
2Q14
3Q14
4Q14
1Q15
2Q15
3Q15
4Q15
Infla
tion
(%)
Source: Bank Indonesia (BI) Source: Bank Indonesia (BI)
Figure 12: Palm oil (MYR/ton) Figure 13: Coal (USD/tonne)
1700
2200
2700
3200
3700
4200
Mar
-10
Sep
-10
Mar
-11
Sep
-11
Mar
-12
Sep
-12
Mar
-13
Sep
-13
Mar
-14
Sep
-14
Mar
-15
Sep
-15
Mar
-16
MY
R /
tonn
e
Palm Oil (MYR/ton)
Avg 2011: 3,273Avg 2012: 2,853Avg 2013: 2,383Avg 2014: 2,419Avg 2015: 2,160YTD 2016: 2,341
45
55
65
75
85
95
105
115
125
135
145
Mar
-10
Sep
-10
Mar
-11
Sep
-11
Mar
-12
Sep
-12
Mar
-13
Sep
-13
Mar
-14
Sep
-14
Mar
-15
Sep
-15
Mar
-16
US
D/m
etric
tonn
e
Coal (USD / metric ton)
Avg 2010: 99Avg 2011: 121Avg 2012: 94Avg 2013: 84Avg 2014: 70Avg 2015: 59YTD 2016: 50
Source: Bloomberg Source: Bloomberg
Indonesia's mining and quarrying sector witnessed 5% lower growth YoY in 2015,
whereas the sector's contribution to GDP declined to 8% in 2015, from 10% in 2010. This
is nevertheless evident in the weaker growth of mineral resources areas, such as
Kalimantan. Its GDP growth declined from 3.3% in 2014 to 1.3% in 2015, and Kalimantan
accounts for 8.8% of national GDP. The Sumatra area, known for its agriculture and
forestry, also saw its GDP lowered from 4.6% in 2014 to 3.5% in 2015. Sumatra is the
second-largest GDP contributor accounting for 21.7% of the nation's GDP. On the other
hand, Java, which is the largest GDP contributor (58.1%) and depends mostly on
manufacturing, reported only a slight decline in GDP, from 5.6% in 2014 to 5.5% in 2015.
Weak commodity prices
slowed economic growth,
particularly in the commodity
resources regions like
Kalimantan and Sumatra

05 April 2016
Indonesia Consumer Survey 2016 15
Figure 14: GDP growth, by region—weakness seen in Kalimantan
Source: Bank Indonesia (BI)
Figure 15: GDP breakdown by segment Figure 16: GDP breakdown by sector
54% 54% 55% 54% 55% 54%
12% 12% 12% 12% 12% 12%
31% 32% 33% 32% 33% 33%
2% 1% 2% 1%
0%
10%
20%
30%
40%
50%
60%
70%
80%
90%
100%
2010 2011 2012 2013 2014 2015
Private consumption Government consumption Investment Net exports
14% 14% 13% 13% 13% 13%
10% 10% 10% 10% 9% 8%
22% 22% 22% 22% 22% 22%
13% 14% 14% 14% 14% 13%
9% 9% 9% 9% 10% 10%
4% 4% 4% 4% 4% 4%4% 4% 4% 4% 4% 5%4% 4% 4% 4% 3% 3%
20% 19% 20% 21% 21% 22%
0%
20%
40%
60%
80%
100%
2010 2011 2012 2013 2014 2015
Agriculture, forestry, and fishery Mining & quarrying
Manufacturing Wholesale and retail trades
Construction Transport & storage
Information & communication Public administration & defence
Others
Source: Bank Indonesia (BI) Source: Bank Indonesia (BI)

05 April 2016
Indonesia Consumer Survey 2016 16
Figure 17: GDP growth, by segment
-2%
0%
2%
4%
6%
8%
GDP Private consumption Government consumption Investment Net exports
2010 2011 2012 2013 2014 2015
Source: Bank Indonesia (BI)
Figure 18: GDP growth, breakdown by sector
-6%
-4%
-2%
0%
2%
4%
6%
8%
10%
12%
14%
Ag
ricul
ture
, fo
rest
ry,
and
fish
ery
Min
ing
& q
uar
ryin
g
Man
ufa
ctur
ing
Ele
ctric
ity &
ga
s su
pply
Wat
er
supp
ly,
sew
era
ge, w
ast
em
ana
gem
ent
& r
em
edi
atio
nac
tiviti
es Co
nstr
uctio
n
Who
lesa
le a
nd r
eta
il tr
ades
, re
pair
of m
oto
r ve
hicl
es &
mot
orc
ycle
s
Tra
nspo
rt &
sto
rage
Acc
om
oda
tion
& f
ood
se
rvic
eac
tiviti
es
Info
rmat
ion
& c
omm
uni
catio
n
Fin
anci
al &
insu
ranc
e s
erv
ices
Re
al e
stat
e a
ctiv
ities
Bu
sin
ess
serv
ices
Pu
blic
adm
inis
trat
ion
& d
efe
nce;
com
pul
sory
so
cial
sec
urity
Ed
ucat
ion
Hu
ma
n h
ealth
& s
ocia
l wor
kac
tiviti
es
Oth
er
serv
ices
act
iviti
es
2011 2012 2013 2014 2015
Source: Bank Indonesia (BI)
The continuous economic slowdown has stemmed from the delay in Government of
Indonesia (GoI) spending in 1H15, where the GoI was faced with the nomenclature issue.
This resulted in both the consumer confidence and retail salex indexes, as measured by
the Bank of Indonesia, plummeting to below 100 in August 2015. The rupiah also
weakened by around 20% to as low as Rp14,700/US$, with inflation peaking at 7.2% in
3Q15. All this was in reverse by the end of 3Q15, when the GoI started to spend—mostly
on infrastructure—the IDR/USD exchange rate started to stabilise. Sentiment thus turned
more positive, continuing into early 2016, when the GoI lowered retail fuel prices and
reduced electricity tariffs as global oil prices declined.
Things started to look better
from the end of 3Q15
onwards

05 April 2016
Indonesia Consumer Survey 2016 17
Figure 19: Brent crude oil price (USD/barrel) Figure 20: Indonesia's retail fuel price (Rp/lt)
30
40
50
60
70
80
90
100
110
120
130M
ar-1
0
Sep
-10
Mar
-11
Sep
-11
Mar
-12
Sep
-12
Mar
-13
Sep
-13
Mar
-14
Sep
-14
Mar
-15
Sep
-15
Mar
-16
US
D/b
arre
l
Brent crude oil (USD/barrel)
Avg 2010: 81Avg 2011: 112Avg 2012: 112Avg 2013: 108Avg 2014: 98Avg 2015: 54YTD 2016: 34
4000
4500
5000
5500
6000
6500
7000
7500
8000
8500
9000
Mar
-10
Sep
-10
Mar
-11
Sep
-11
Mar
-12
Sep
-12
Mar
-13
Sep
-13
Mar
-14
Sep
-14
Mar
-15
Sep
-15
Mar
-16
Rp7,050/litre
Source: Bloomberg Source: Bloomberg
Figure 21: Indonesia's GDP per capita (USD) Figure 22: Average exchange rate IDR/USD
3268
37563780
3682
3573
3401
3200
3300
3400
3500
3600
3700
3800
2010 2011 2012 2013 2014 2015
11200
11700
12200
12700
13200
13700
14200
14700
Mar-14 Sep-14 Mar-15 Sep-15 Mar-16
Rp/
US
D
Avg 2014: Rp11,870
Avg 2015: Rp13,457
YTD 2016: Rp13,644
Source: Bank Indonesia Source: Bloomberg
Figure 23: Consumer confidence index Figure 24: Retail sales index
95
98
101
104
107
110
113
116
119
122
Feb-14 May-14 Aug-14 Nov-14 Feb-15 May-15 Aug-15 Nov-15 Feb-16
110
140
150
160
170
180
190
200
210
Feb-14 May-14 Aug-14 Nov-14 Feb-15 May-15 Aug-15 Nov-15 Feb-16
192
Source: Bank Indonesia Source: Bank Indonesia

05 April 2016
Indonesia Consumer Survey 2016 18
But Indonesians continue to be optimistic
Nevertheless, despite disappointments in relation to Indonesia's lower purchasing power,
weak economic conditions, etc., its GDP growth at 4.8% in 2015 was still one of the
highest among the other emerging countries, but behind China (6.9%) and India (7.3%) in
2015. And with regards to GDP growth, only three countries that we surveyed reported
higher growth (India, Turkey and Mexico).
Figure 25: Real GDP growth among the emerging countries in 2014 and 2015E
7.3%
6.9%
5.0%
3.5%
2.9%
2.1% 1.6%
0.1%
0.7%
6.9%
7.3%
4.8%
3.4%3.1%
2.5%
1.3%
-3.8%
0.0%
6.5%
7.8%
5.2%
2.5%
3.5%
3.0%
1.6%
-3.5%
1.0%
-4%
-2%
0%
2%
4%
6%
8%
China India Indonesia Saudi Arabia Turkey* Mexico South Africa Brazil Russia
2014 2015 2016E
* Turkey is estimated data.
Source: Company data, Credit Suisse estimates
Indonesia is the most optimistic country, based on our survey, whereby 26% of our
respondents are optimistic about having higher income or incomes growing more than
10% in the next 12 months, while most Indonesians (69%) are expecting flat to 10% higher
incomes, compared to only 64% of those in India. In addition, only 4% of Indonesians are
expecting lower to flat incomes over the next 12 months, which is the lowest compared to
the other emerging countries that we surveyed. We believe that despite a challenging
2015, the improvement seen in 2H15 created a feeling of optimism. Our survey was
conducted between October and November 2015, when the economy was starting to
recover and the GoI had just started to spend. We note that by the end of 2015, the
Indonesian government had announced eight stimulus policy packages (out of a total of
ten), which have started to generate some optimism.
Optimism remains

05 April 2016
Indonesia Consumer Survey 2016 19
Figure 26: Indonesians are the most confident country in terms of income expectations in the next 12 months followed
by India and Brazil
6.5
5.0
9.8
4.6 4.9
2.7
5.7
3.6
9.1
4.3
8.6
1.0
2.5
8.8
4.3
9.3
5.9
7.4
2.5
0.5
2.1
8.1
1.6
7.4
4.1
3.2 2.7
0.2
3.9
2.7
6.8
4.1
8.0
3.7 3.7
1.4
0.5
4.0
2.0
5.8
5.0
4.5
3.6
2.6
1.5 1.2
0.5
0
1
2
3
4
5
6
7
8
9
10
Indonesia India Brazil China Saudi South Africa Turkey Mexico Russia
%
2010 2011 2012 2013 2014 2015
Question: In what way do you expect your household income to change in the next 12 months?
Source: Credit Suisse Indonesia Consumer Survey 2016
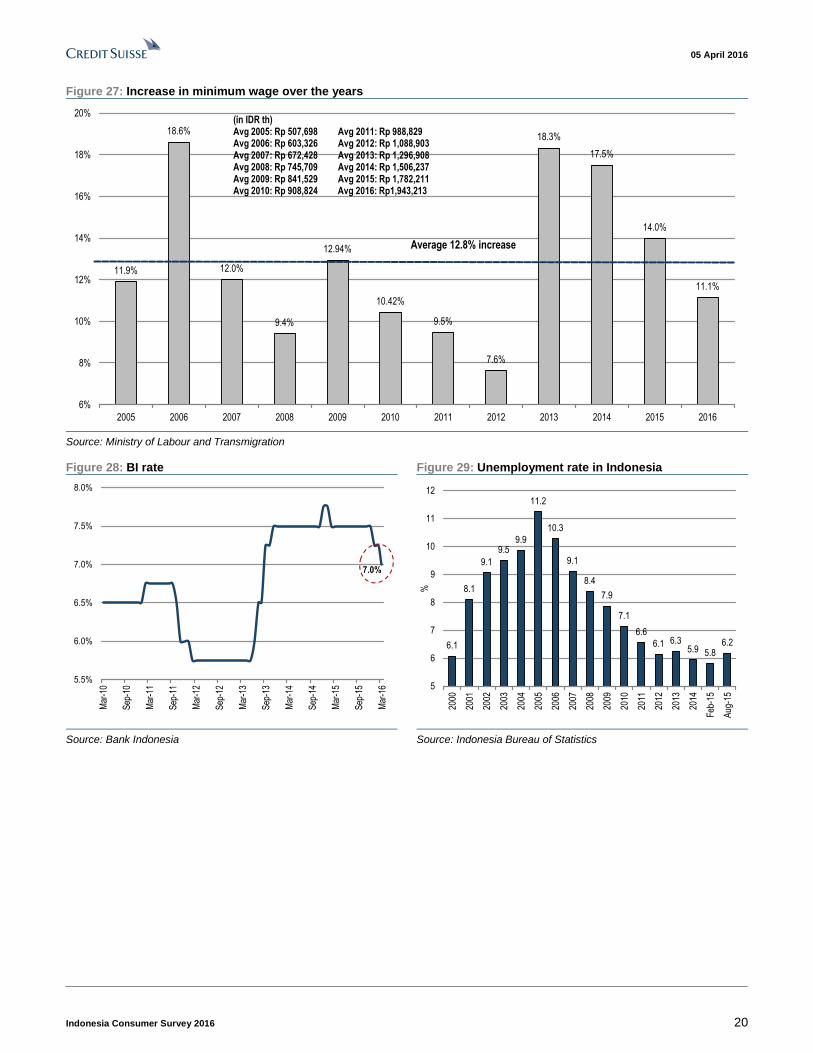
Minimum wages continued to be increased in 2015 by an average of 14%. This is lower
than the previous year's 17.5%, but is off a higher nominal base. Minimum wages vary by
region, with an average of Rp1.78 mn in 2015 compared to Rp1.5 mn in 2014. In 2016, the
GoI regulated the increase in minimum wage to give more certainty on the annual rise. It
applies a formula based on the sum of nominal GDP growth and the inflation rate. As
such, in 2016, we see an average minimum wage rise of 11.1% nationwide to Rp1.94 mn.
In our survey, we saw a significant hike in wages in 2014, then a drop in 2015, which we
view as a normalisation after the significant increases in 2013 and 2014, consecutively.
Respondents continue to be optimistic about future incomes, as the majority (69%) are still
expecting between flat to a 10% rise in incomes in the next 12 months, while those
expecting down to flat incomes were only 4% of respondents.
Unemployment has been declining to its lowest at 5.94% in 2014. However, with the
slowdown in economic growth, the unemployment rate picked up to 6.18% in August 2015,
based on data from BPS. We believe that the rate could already have peaked, as the
economy started to recover from 2H15 with government spending and GDP growth in
4Q15 reaching 5%.
GoI starts to regulate the
increase in minimum wage
in 2016
Normalisation of wage
increases
A rising unemployment rate
05 April 2016
Indonesia Consumer Survey 2016 20
Figure 27: Increase in minimum wage over the years
11.9%
18.6%
12.0%
9.4%
12.94%
10.42%
9.5%
7.6%
18.3%
17.5%
14.0%
11.1%
6%
8%
10%
12%
14%
16%
18%
20%
2005 2006 2007 2008 2009 2010 2011 2012 2013 2014 2015 2016
(in IDR th)Avg 2005: Rp 507,698 Avg 2011: Rp 988,829Avg 2006: Rp 603,326 Avg 2012: Rp 1,088,903Avg 2007: Rp 672,428 Avg 2013: Rp 1,296,908Avg 2008: Rp 745,709 Avg 2014: Rp 1,506,237Avg 2009: Rp 841,529 Avg 2015: Rp 1,782,211Avg 2010: Rp 908,824 Avg 2016: Rp1,943,213
Average 12.8% increase
Source: Ministry of Labour and Transmigration
Figure 28: BI rate Figure 29: Unemployment rate in Indonesia
5.5%
6.0%
6.5%
7.0%
7.5%
8.0%
Mar
-10
Sep
-10
Mar
-11
Sep
-11
Mar
-12
Sep
-12
Mar
-13
Sep
-13
Mar
-14
Sep
-14
Mar
-15
Sep
-15
Mar
-16
7.0%
6.1
8.1
9.1
9.59.9
11.2
10.3
9.1
8.4
7.9
7.1
6.6
6.1 6.35.9 5.8
6.2
5
6
7
8
9
10
11
12
2000
2001
2002
2003
2004
2005
2006
2007
2008
2009
2010
2011
2012
2013
2014
Feb
-15
Aug
-15
%
Source: Bank Indonesia Source: Indonesia Bureau of Statistics

05 April 2016
Indonesia Consumer Survey 2016 21
Figure 30: Indonesians have seen certainty over income rises in the past 12 months
% of Area Region Age Income*
respondent Total Urban Rural Java Ex Java 18-29 30-45 46-55 56-65 Low Mid High
2015
Down to flat 12% 13% 10% 12% 15% 12% 11% 15% 14% 20% 12% 5%
Flat to +10% 75% 72% 80% 73% 74% 76% 74% 74% 69% 74% 75% 60%
> +10% 13% 15% 9% 14% 11% 13% 15% 10% 17% 6% 13% 35%
2014
Down to flat 11% 9% 15% 11% 12% 10% 12% 10% 21% 18% 10% 12%
Flat to +10% 76% 75% 76% 74% 81% 74% 77% 78% 71% 87% 77% 72%
> +10% 13% 16% 9% 15% 7% 16% 12% 12% 7% 6% 13% 16%
2010
Down to flat 14% 15% 12% 12% 16% 11% 15% 15% 11% 14% 13% 0%
Flat to +10% 77% 76% 80% 79% 72% 78% 76% 76% 84% 83% 75% 81%
> +10% 9% 9% 9% 9% 12% 11% 9% 9% 5% 4% 11% 19%
Question: In what way do you expect your household income to change in the past 12 months
* Income is on monthly basis—low < Rp1.5 mn, mid Rp1.5-7.5 mn, high > Rp7.5 mn
Source: Credit Suisse Indonesia Consumer Survey 2016
Figure 31: …and continue to be optimistic for the next 12 months
% of Area Region Age Income*
respondents Total Urban Rural Java Ex Java 18-29 30-45 46-55 56-65 Low Mid High
2015
Down to flat 4% 5% 3% 5% 4% 5% 5% 6% 6% 8% 8% 5%
Flat to 10+% 69% 65% 76% 65% 77% 68% 67% 70% 68% 80% 77% 76%
>+10% 26% 30% 21% 30% 19% 26% 28% 23% 25% 12% 15% 19%
2014
Down to flat 3% 3% 3% 3% 4% 2% 2% 4% 8% 6% 3% 2%
Flat to +10% 69% 69% 71% 65% 81% 68% 70% 72% 71% 76% 70% 68%
> +10% 28% 28% 26% 33% 15% 30% 28% 24% 21% 18% 28% 29%
2010
Down to flat 4% 4% 2% 3% 4% 2% 4% 4% 4% 6% 4% 0%
Flat to +10% 70% 69% 77% 73% 67% 72% 70% 71% 81% 80% 68% 57%
> +10% 26% 27% 21% 23% 28% 26% 26% 25% 14% 14% 28% 43%
Question: In what way do you expect your household income to change in the next 12 months
* Income is on monthly basis—low < Rp1.5 mn, mid Rp1.5-7.5 mn, high > Rp7.5 mn
Source: Credit Suisse Indonesia Consumer Survey 2016
We also found that most Indonesians do not migrate to other places. Compared to China
and India, we see that fewer Indonesians tend to migrate from their hometown. As such, if
Indonesians do migrate, the urge for better income is much higher compared to those in
China and India.
Migration is not popular
among Indonesians

05 April 2016
Indonesia Consumer Survey 2016 22
Figure 32: Have you migrated from your hometown to
where you are currently living?
Figure 33: Did you migrate to earn a better income?
24 26
19
76 74
81
0
10
20
30
40
50
60
70
80
90
China India Indonesia
Yes No
66
79
93
34
21
7
0
10
20
30
40
50
60
70
80
90
100
China India Indonesia
Yes No
Source: Credit Suisse Indonesia Consumer Survey 2016 Source: Credit Suisse Indonesia Consumer Survey 2016
How do Indonesians spend their money?
Over the past six surveys, we continue to see the largest monthly spending is on food,
with food spending in Indonesia much higher than our overall survey average. In fact,
spending on food has increased to 50% of household spending in 2015 compared to 38%
in 2010. The second-largest spending is for savings. Even though we saw that savings
increased from 16% in 2010 to 18% in 2015, this is still low compared to the overall survey
average.
On the other hand, declines in spending were seen for auto (from 8% to 2%), housing
(from 10% to 8%), education (from 9% to 4%) and healthcare (from 7% to 6%) between
2010 and 2015. We believe the spending declines for auto and housing are due to weaker
purchasing power, while for education it is due to the availability of government
programmes for free education. For healthcare, the fall is due to the implementation of the
government's programme on National Health Care Insurance .
Meanwhile, spending on home, and personal care and entertainment is maintained at 8%
and 4% of total household spending, respectively.
Figure 34: Indonesian monthly spending by category vs overall survey average
0%
5%
10%
15%
20%
25%
30%
35%
Housin
g +
Pu
blic
Utilit
ies
Food
Tra
vel &
En
tert
ain
me
nt
Au
tos
Healthca
re
Ed
uca
tion
HP
C
Sa
vings
Pro
pert
y +
Local T
axe
s
Clo
thin
g
Oth
er
Indonesian monthly spend Overall survey average
Source: Credit Suisse Emerging Consumer Survey 2016
Largest spending is on food
(50%) followed by savings
(18%)

05 April 2016
Indonesia Consumer Survey 2016 23
Figure 35: Food spending increased to 50% in 2015 ... Figure 36: ...from 38% in 2010
Housing8% Auto
2% Education4%
Food50%
Home and Personal Care
8%
Health Care6%
Savings18%
Entertainment4%
Housing10%
Auto8%
Education9%
Food38%
Home and Personal Care
8%
Health Care7%
Savings16%
Entertainment4%
* As a % of total spending
Source: Credit Suisse Indonesia Consumer Survey 2016
* As a % of total spending
Source: Credit Suisse Indonesia Consumer Survey 2016
Figure 37: Indonesia's rising middle class and affluent (MAC) population, 2012-20
Note: Monthly household expenditure numbers are stained in real 2011 terms (adjusted for inflation) and include regular household
expenditures such as food, utilities, transportation, communication, and regular household supplies and exclude discretionary spending such as
entertainment, restaurant dining and similar categories. Note that the expenditure level is based on data from BPS, which uses regression
analysis to remove irregular expenditures. The spending levels used to define wealth classes in this model may differ from those used by market
research agencies to define socioeconomic status levels because of different data collection methodologies and models.
Source: BCG Population and Household Expenditure Database 2012; BCG analysis; Indonesian Government Statistics Office (BPS).
Indonesians continue to be conservative about wanting to make major purchases
compared to other emerging countries. Indonesia ranked fourth in the category with only
35% of respondents thinking this is an excellent/good time to make major purchases.
Obviously, compared to 2010, the time where Indonesia's GDP grew at 6.4%, a majority of
Indonesians (56%) thought it was an excellent time to make a major purchase. As such,
we believe that the decline in economic growth has led to a preference for larger savings,
instead of spending.
It is not the time to make
major purchases

05 April 2016
Indonesia Consumer Survey 2016 24
Figure 38: In your opinion, is now a good time to make a major purchase? (Area)
2015 2014 2010
% of respondents Total Urban Rural Java Ex Java Total Urban Rural Java Ex Java Total Urban Rural Java Ex Java
Excellent time 5 6 4 5 5 1 1 1 0 3 6 7 5 5 7
Good time 30 31 28 30 29 35 33 38 35 38 50 48 54 54 40
Not such a good time 59 57 61 58 59 59 62 52 59 50 40 40 39 37 48
A bad time 7 6 7 7 6 6 5 8 6 9 4 5 3 5 4
Source: Credit Suisse Indonesia Consumer Survey 2016
Figure 39: In your opinion, is now a good time to make a major purchase? (Age)
2015 2014 2010
% of respondents Total 18-29 30-45 46-55 56-65 Total 18-29 30-45 46-55 56-65 Total 18-29 30-45 46-55 56-65
Excellent time 5 5 5 6 4 1 1 1 0 0 6 6 6 6 6
Good time 30 28 33 27 25 35 37 34 34 28 50 53 49 50 45
Not such a good time 59 59 56 62 64 59 58 59 58 63 40 38 40 39 45
A bad time 7 7 6 6 8 6 4 6 8 9 4 3 5 4 4
Source: Credit Suisse Indonesia Consumer Survey 2016
Figure 40: In your opinion, is now a good time to make a major purchase? (Income)
2015 2014 2010
% of respondents Total Low Mid High Total Low Mid High Total Low Mid High
Excellent time 5 1 6 6 1 1 1 0 6 3 7 4
Good time 30 27 30 27 35 24 36 33 50 45 51 68
Not such a good time 59 64 57 66 59 68 58 63 40 46 38 21
A bad time 7 8 7 2 6 7 6 3 4 5 4 7
* Income is on monthly basis—low < Rp1.5mn, mid Rp1.5mn-Rp7.5mn, high > Rp7.5mn
Source: Credit Suisse Indonesia Consumer Survey 2016
With Indonesia's GDP per capita at around US$3,000, Indonesians tend to spend most on
lifestyle items, such as smartphones and internet access. Interestingly, this has been a
similar trend over the past six years since our first survey. This is in addition to basic
mobile phones and motorcycles. Instant noodles continue to be the most popular product,
despite already being highly penetrated, because of their affordability. This is followed by
bottled water, feminine hygiene, carbonated drinks and dairy products.
Rising need for
smartphones and internet
access

05 April 2016
Indonesia Consumer Survey 2016 25
Figure 41: Indonesia’s spending momentum 2015 vs 2014 (a year ago)
Carbonated drinks
Bottled water
Dairy Instant noodlesCigarettes
Tissues
Feminine hygiene
Cosmetics
Basic mobile phone
Smartphone
Cars
Internet access
Computers
PropertyHoliday
Motorcycle
Fashion apparel
Sport shoes and wear
WatchesJewellery
Perfumes
Leather goods, bags, and shoes
(10)
(5)
-
5
10
15
- 10 20 30 40 50 60 70 80 90 100
Re
cord
ed
sp
en
din
g in
20
15
vs.
20
14
2015 respondents that own/have bought each item (%)
Source: Credit Suisse Indonesia Consumer Survey 2016
Figure 42: Indonesia's spending momentum 2015 vs 2010—what has changed in behaviour from six years ago
Carbonated drinksBottled water
Dairy products Instant noodles
Cigarettes
Tissues
Feminine hygiene
Cosmetics
Basic mobile phone
Smartphone
Cars
Internet access
Computers
Property
Holiday
Motorcycle
Fashion apparel
Sport shoes and wear
Watches
Jewellery
Perfumes
(30)
(20)
(10)
-
10
20
30
40
- 10 20 30 40 50 60 70 80 90 100
Re
cord
ed
sp
en
din
g in
20
15
vs.
20
10
2015 respondents that own/have bought each item (%)
Source: Credit Suisse Indonesia Consumer Survey 2016

05 April 2016
Indonesia Consumer Survey 2016 26
Figure 43: Indonesian’s future item preference
Source: Credit Suisse Indonesia Consumer Survey 2016
Savings are improving, but still low
Indonesians still have low savings versus other emerging countries that we surveyed.
However, compared to six years ago, this has marginally improved, with significant
improvements in the urban areas. In 2010, Indonesians saved 10.8% of their income,
while in 2015, it only reached 11%. However, those in urban areas actually save more
than those living rurally. In urban areas, savings improved from 10.8% in 2010 to 12.4% in
2015, while in rural areas, savings declined from 10.5% to 6.2% over the same period.
Interestingly, those outside Java used to save more in 2010—16.1% of their income—but
this figure plummeted to 9.8% in 2015, due to, we believe, the significant decline in
employment opportunities in the resource-based area that led to income declines.
Figure 44: China has the highest savings % of total income
33%
20%
13% 13%
11% 11%
9% 9%
7%
0%
5%
10%
15%
20%
25%
30%
35%
China Saudi India Turkey Indonesia Russia Brazil Mexico South Africa
Sav
ings
as
% o
f inc
ome
Source: Credit Suisse Indonesia Consumer Survey 2016
Compared to other
emerging countries, savings
are still low in Indonesia

05 April 2016
Indonesia Consumer Survey 2016 27
Figure 45: Indonesia—savings as a percentage of income Figure 46: Indonesia—income versus savings (Rp mn)
10.8%10.8% 10.5%
8.8%
16.1%
11.0%
12.4%
6.2%
11.0%
9.8%
5%
7%
9%
11%
13%
15%
17%
Tot
al
Urb
an
Rur
al
Java
Ex
Java
Tot
al
Urb
an
Rur
al
Java
Ex
Java
Sav
ing
as %
of i
ncom
e
2010 2015
2.8
3.2
3.8
3.4
0.2
0.5 0.4 0.3
0.0
0.5
1.0
1.5
2.0
2.5
3.0
3.5
4.0
Java Ex Java Java Ex Java
Income Savings
2010 2015
Source: Credit Suisse Indonesia Consumer Survey 2016 Source: Credit Suisse Indonesia Consumer Survey 2016
Still worries over higher inflation
Despite inflation coming down, Indonesians still worry about it being higher, as it means
higher living costs and so we think that saving is the right mode at this time. Most of the
respondents (64%) still think that inflation is going to be higher than in the past 12 months.
Figure 47: Inflation is expected to decline or at least remain stable
83
14
2
76
21
4
64
31
5
73
24
4
64
31
5
0
10
20
30
40
50
60
70
80
90
It will be higher than the last 12 months It will be the same as the last 12 months It will be lower than the last 12 months
2011 2012 2013 2014 2015
Source: Credit Suisse Indonesia Consumer Survey 2016

05 April 2016
Indonesia Consumer Survey 2016 28
Figure 48: Inflation component breakdown (2015) Figure 49: Inflation component breakdown (2010)
8.1%
7.2%
6.4% 6.3%5.8%
4.2%
3.6%
0%
1%
2%
3%
4%
5%
6%
7%
8%
9%
ProcessedFood,
Beverages,Tobacco
Food Transport,Comm.
andFinance
Housingand
Utilities
Health Education,Recreation
andSports
Clothing
9.4%
7.9%
4.6%
3.5%3.0%
2.7%
1.8%
0%
2%
4%
6%
8%
10%
Food ProcessedFood, Beverages,
Tobacco (BF)
Clothing Education,Recreation
and Sports (ER)
Housingand
Utilities
Health Transport,Comm. and
Finance
Source: Indonesia Bureau of Statistics Source: Indonesia Bureau of Statistics

05 April 2016
Indonesia Consumer Survey 2016 29
Key sector selections

05 April 2016
Indonesia Consumer Survey 2016 30
Automotive sector Key stocks
Astra International
■ Improvement in macroeconomic conditions and the launch of new models should
support 4W sales volume growth.
■ Monetary easing (a 75 bp BI cut) should come into full effect in one to two quarters,
resulting in cheaper financing for cars and motorcycles.
Four-wheelers
Four-wheeler (4W) penetration in Indonesia remained low at 7%, although the trend shows
an improvement from 6% in 2010. This improvement is on the back of several factors: (1)
affordable LCGC (low cost green car) models (US$8-9k); (2) attractive financing rates; and
(3) the need to be more mobile given there is no improvement in public transportation.
Compared to our previous surveys, people with low “incomes” are better off now, with 4%
of the respondents surveyed in the lower bracket having cars versus 3% in 2014 and 1%
in 2010. Further, last year's survey also booked an improvement compared to the 2010
survey when only 7% of the respondents were willing to purchase a car in the next 12
months. However, this year's weaker result compared to last year's is likely due to weaker
economic growth from 2Q-3Q15, coupled with high inflation and the rupiah’s weakening.
Figure 50: Four-wheeler penetration remains low, while people with higher incomes need to be more mobile
Area Region Age Income*
% of respondents Total Urban Rural Java Ex Java 18-29 30-45 46-55 56-65 Low Mid High
2015
Four-wheeler ownership 7 7 6 7 6 6 7 5 9 4 6 25
Prob. of purchase in 12M
Potentially Yes 8 9 7 9 8 9 8 11 4 6 8 17
Unsure 25 25 25 27 23 23 27 27 27 21 26 27
Potentially No 67 65 68 64 70 68 65 62 69 73 66 56
2014
Four-wheeler ownership 7 7 6 7 8 7 7 7 9 3 7 18
Prob. of purchase in 12M
Potentially Yes 14 14 14 13 16 14 14 14 6 13 14 18
Unsure 32 31 34 35 26 32 33 30 30 37 32 27
Potentially No 54 55 52 52 58 53 52 56 63 50 54 55
2010
Four-wheeler ownership 6 6 5 6 5 3 7 6 10 1 6 50
Prob. of purchase in 12M
Potentially Yes 7 8 5 6 9 5 8 10 6 3 8 39
Unsure 25 26 22 26 22 29 22 24 23 20 26 39
Potentially No 68 66 72 67 69 66 70 66 71 77 66 21
* Income is on a monthly basis—low < Rp1.5 mn, mid Rp1.5-7.5 mn, high > Rp7.5 mn
Source: Credit Suisse Indonesia Consumer Survey 2016
Toyota maintains its market leader position, while Honda is catching up
Toyota remained the preferred brand for car purchases, although there was a noticeable
decline in market share from 52% in 2010 to 23% in 2015. Honda is catching up with 22%
in 2015 versus 16% in 2010. We believe the decline in Toyota is attributed to it not
launching good new models, while Honda launched several hits (Mobilio, BRV, HR-V, and
Freed, among others). A deeper dive into the result also showed mixed results. The
younger population (18-29 years old) preferred Honda (25%) versus Toyota (13%), while
We like Astra on the back of
improvements in
macroeconomic conditions
and the launches of new
models
Honda is catching up with
22% of our respondents
preferring the brand in 2015
versus 16% in 2010. Toyota
is still the market leader with
a 23% market share

05 April 2016
Indonesia Consumer Survey 2016 31
Toyota's dominance remained resilient among the middle aged (30-45 years old). People
with higher monthly incomes also prefer Honda more now versus Toyota.
Figure 51: Toyota remains the market leader, with Honda catching up
% of respondents Area Region Age Income*
Total Urban Rural Java Non-Java 18-29 30-45 46-55 56-65 Low Mid High
2015
Toyota 23 18 36 19 36 13 36 20 17 27 23 20
Honda 22 24 18 21 24 25 18 24 33 18 21 38
Daihatsu 10 12 6 11 6 9 12 8 17 0 11 8
Nissan 6 6 3 6 3 4 2 13 17 0 7 0
BMW 8 11 3 9 6 11 8 8 0 8 9 0
Suzuki 3 5 0 3 3 0 4 8 0 0 3 8
Mitsubishi 1 0 3 1 0 2 0 0 0 0 1 0
Others 26 23 31 29 22 38 20 20 17 47 24 26
2014
Toyota 30 29 28 24 39 24 29 45 17 19 30 37
Honda 23 27 17 18 34 19 24 31 33 13 24 31
Daihatsu 9 5 15 10 6 5 12 10 0 7 10 5
Nissan 5 4 3 3 6 5 5 0 0 7 4 0
BMW 2 3 2 2 3 4 1 0 0 7 2 0
Suzuki 2 2 3 3 1 0 4 3 0 0 2 5
Mitsubishi 1 1 2 1 2 2 1 0 0 0 1 0
Others 29 29 30 40 9 40 25 11 50 49 26 21
2010
Toyota 52 49 58 47 64 43 50 63 62 58 50 64
Honda 16 14 19 13 15 17 15 15 13 16 16 8
Daihatsu 10 13 3 15 2 11 13 4 0 9 11 0
Nissan 3 3 3 3 2 3 5 0 0 0 3 11
BMW 1 1 3 1 2 0 2 0 13 9 1 0
Suzuki 3 4 0 4 0 3 3 4 0 0 4 0
Mitsubishi 2 3 0 4 0 0 3 4 0 0 2 8
Others 13 13 13 13 15 23 9 11 12 9 14 9
* Income is on monthly basis—low < Rp1.5mn, mid Rp1.5-7.5 mn, high > Rp7.5 mn
Source: Credit Suisse Indonesia Consumer Survey 2016
Two-wheelers
Motorcycles remain the wheels that move Indonesia's economy. Penetration remains high
at 84%, slightly lower than last year’s 86% but higher than 2010’s 73%. Among those
surveyed, 37% of respondents owning a motorcycle claimed that they have more than
one. The average age of a motorcycle is 3.7 years while the average ownership turnover
for them is 5.7 years.
It is noteworthy that the confidence of customers is eroding, in line with the trend seen for
four-wheelers. Only 28% of respondents are willing to purchase motorcycles in the next 12
months, down from 39% last year. This is likely due to high inflation in 2Q and 3Q last year
which resulted in people deferring their motorcycle purchases to buy staples. However, we
are more positive heading into 2016, as inflation has fallen and GDP rebounded in 4Q15.
Further, the BI cut its reference rate by 75 bp which should translate into cheaper
financing. Motorcycles continue to be popular and affordable in Indonesia as a result of a
poor public transportation system.
Motorcycle penetration
remains high at 84%,
although lower than last
year's 86%

05 April 2016
Indonesia Consumer Survey 2016 32
Figure 52: Two-wheeler ownership remains high in Indonesia
Area Region Age Income*
Total Urban Rural Java Non-Java 18-29 30-45 46-55 56-65 Low Mid High
2015
2-wheeler ownerships % respondents 84 85 82 72 65 86 86 77 81 63 87 91
No of 2Ws per household
1 motorcycle % owners 63 63 64 63 63 62 71 51 57 79 62 63
>1 motorcycles % owners 37 37 36 37 37 38 29 49 43 21 38 37
When was it purchased? Years ago 3.7 3.7 3.7 3.8 3.7 3.4 3.8 3.9 4.7 4.4 3.7 3.3
Motorcycle ownership turnover Years 5.7 5.8 5.5 5.8 5.5 4.9 5.9 6.5 7.2 5.3 5.7 5.4
Probability of purchase in 12M
Potentially Yes % respondents 28 29 26 27 32 29 31 27 14 26 29 25
Unsure % respondents 26 25 27 26 25 24 26 26 29 22 25 31
Potentially No % respondents 46 46 46 47 43 46 43 47 57 52 46 44
2014
2-wheeler ownerships % respondents 86 87 85 70 69 89 87 86 73 73 88 92
No of 2Ws per household
1 motorcycle % owners 64 65 63 65 62 65 65 60 68 78 64 47
>1 motorcycles % owners 36 35 37 35 38 35 35 40 32 22 36 53
When was it purchased? Years ago 3.7 3.7 3.8 3.7 3.7 3.3 3.9 3.7 5.0 4.3 3.7 3.7
Motorcycle ownership turnover Years 5.9 5.8 6.1 5.9 5.9 5.3 6.2 6.5 6.2 5.5 6.1 5.1
Probability of purchase in 12M
Potentially Yes % respondents 39 39 39 39 40 42 40 34 24 37 40 43
Unsure % respondents 30 29 33 32 26 29 31 29 36 35 29 31
Potentially No % respondents 31 32 28 29 34 28 29 37 40 28 31 26
2010
2-wheeler ownerships % respondents 73 74 70 68 70 73 72 80 63 54 79 92
No of 2Ws per household
1 motorcycle % owners 71 69 76 73 69 69 77 61 67 86 68 72
>1 motorcycles % owners 29 31 24 27 31 31 23 39 33 14 32 28
When was it purchased? Years ago 3.3 3.3 3.2 3.2 3.3 3.2 3.3 3.2 3.5 3.3 3.2 2.8
Motorcycle ownership turnover Years 5.6 5.4 6.0 5.5 5.9 4.9 5.8 6.6 5.9 5.5 5.7 6.5
Probability of purchase in 12M
Potentially Yes % respondents 26 29 22 27 24 23 31 22 27 16 28 55
Unsure % respondents 28 27 28 32 18 27 27 32 21 25 27 28
Potentially No % respondents 46 44 50 41 58 51 42 46 53 59 45 18
* Income is on monthly basis—low < Rp1.5mn, mid Rp1.5-7.5 mn, high > Rp7.5 mn
Source: Credit Suisse Indonesia Consumer Survey 2016
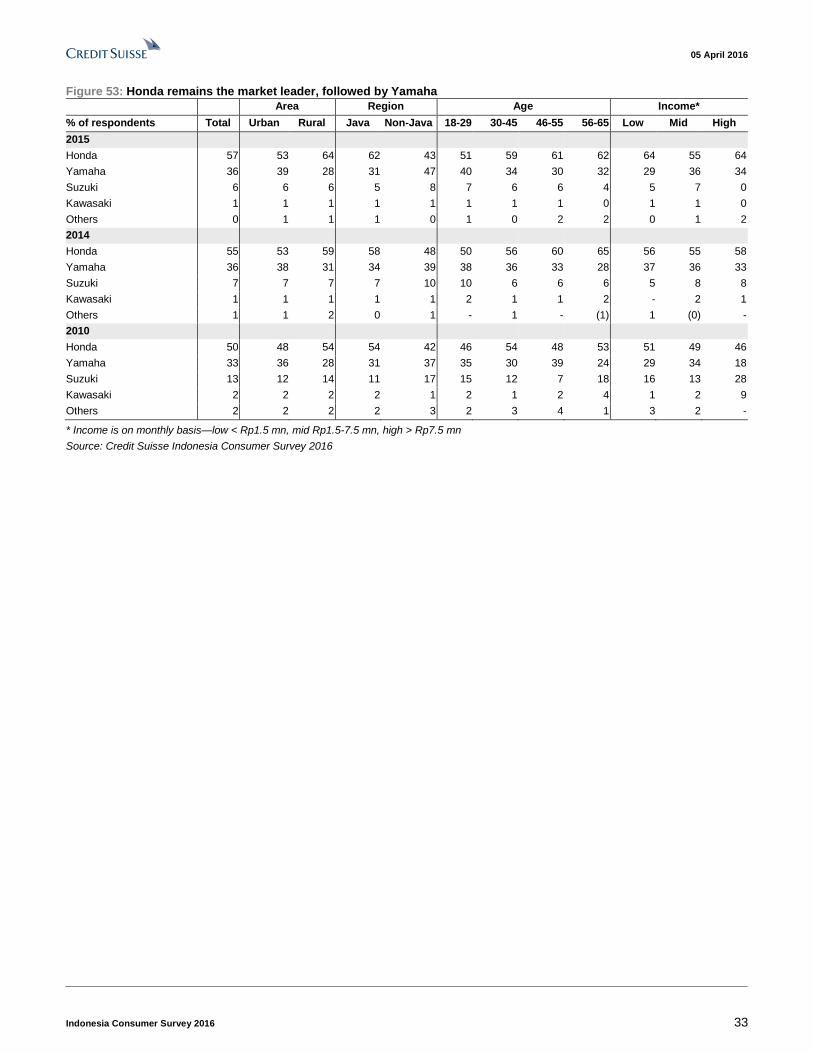
Honda consolidating its position as the market leader in 2W industry
Honda and Yamaha remain the two favourite brands for motorcycles, accounting for 93%
of the total market, based on our survey. There is a noticeable drop in Honda's non-Java
market share, although aggregately Honda and Yamaha are gaining more market share.
Honda is slowly eliminating competition through its strong network and after-sales service,
in addition to the introduction of attractive new models.
Honda and Yamaha remain
the two favourite brands for
motorcycles, accounting for
93% of the total market as
per our survey
05 April 2016
Indonesia Consumer Survey 2016 33
Figure 53: Honda remains the market leader, followed by Yamaha
Area Region Age Income*
% of respondents Total Urban Rural Java Non-Java 18-29 30-45 46-55 56-65 Low Mid High
2015
Honda 57 53 64 62 43 51 59 61 62 64 55 64
Yamaha 36 39 28 31 47 40 34 30 32 29 36 34
Suzuki 6 6 6 5 8 7 6 6 4 5 7 0
Kawasaki 1 1 1 1 1 1 1 1 0 1 1 0
Others 0 1 1 1 0 1 0 2 2 0 1 2
2014
Honda 55 53 59 58 48 50 56 60 65 56 55 58
Yamaha 36 38 31 34 39 38 36 33 28 37 36 33
Suzuki 7 7 7 7 10 10 6 6 6 5 8 8
Kawasaki 1 1 1 1 1 2 1 1 2 - 2 1
Others 1 1 2 0 1 - 1 - (1) 1 (0) -
2010
Honda 50 48 54 54 42 46 54 48 53 51 49 46
Yamaha 33 36 28 31 37 35 30 39 24 29 34 18
Suzuki 13 12 14 11 17 15 12 7 18 16 13 28
Kawasaki 2 2 2 2 1 2 1 2 4 1 2 9
Others 2 2 2 2 3 2 3 4 1 3 2 -
* Income is on monthly basis—low < Rp1.5 mn, mid Rp1.5-7.5 mn, high > Rp7.5 mn
Source: Credit Suisse Indonesia Consumer Survey 2016

05 April 2016
Indonesia Consumer Survey 2016 34
Food and beverages Key stocks
Indofood CBP:
■ The noodles division will continue to be the company's backbone and generate strong
free cash flow, despite it being already highly penetrated, as it has absolute pricing
power. The driver going forward will be product innovation and new product launches.
■ The luxury of having a strong cash flow has allowed the company to expand into other
products in its portfolio, such as dairy and beverages, as well as diapers.
Indofood Sukses Makmur:
■ A fully integrated food company in Indonesia, with most of its earnings derived from
the listed Indofood CBP (ICBP). It is also a parent company of the listed agribusiness
(IFAR), the flour milling company (Bogasari), and distribution company (Indomarco).
HM Sampoerna:
■ The largest cigarette company in Indonesia, and with main product on the SKM LTLN
(machine-made, kretek cigarettes, low-tar low-nicotine) that is well targeted to the
rising middle and upper market segment, and younger generation.
Gudang Garam.
■ It is the second largest cigarette company in Indonesia with main product on the SKM
FF (machine-made, kretek cigarettes, full-flavoured) that is well targetted to the middle
market segment.
Looking for convenience
With Indonesians becoming more affluent, they are seeking for more convenience, and of
course affordability. Spending for food has increased from 38% of total household
spending in 2010 to 50% in 2015, according to our survey. And Indonesians spending on
food is much above the overall average survey.
We looked into the trend in the food and beverages segment in the past six years, where
the trend to consume is higher, across all segments. Consumptions of carbonated drinks
(66% in 2015 vs 60% in 2010) and bottled water (89% in 2015 vs 82% in 2010) continue to
rise, particularly among the younger generation, while consumption of instant noodles and
dairy products is pretty much similar, indicating these two products are more defensive.
Interestingly, only cigarettes that continue to see a downward consumption trend (57% in
2015 vs 64% in 2010). Consistent with our findings in the last six years of our survey, local
brands continue to dominate most of the F&B products.
Rising consumption on
bottled water and
carbonated drinks;
defensive on instant noodles
and dairy; while cigarette
consumption declines

05 April 2016
Indonesia Consumer Survey 2016 35
Figure 54: Consumption of food and beverages
2015 2014 2010
% of respondents Total Urban Rural Java Ex Java Total Urban Rural Java Ex Java Total Urban Rural Java Ex Java
Carbonated drinks
Consumed in the past 3M 66 69 61 67 64 74 76 70 72 77 60 64 52 62 55
Consumed more in the next 3M 36 39 32 40 28 37 39 35 32 53 36 41 25 34 41
Bottled water
Consumed in the past 3M 89 93 83 95 77 94 97 89 95 91 82 86 74 85 76
Consumed more in the next 3M 58 62 51 67 36 64 65 64 62 69 51 57 39 50 55
Dairy products
Consumed in the past 3M 76 81 67 81 63 76 82 65 74 81 78 82 59 78 76
Consumed more in the next 3M 49 52 44 57 31 52 55 47 47 66 53 58 41 50 58
Instant noodles
Consumed in the past 3M 95 94 97 97 91 93 93 93 94 91 96 97 95 98 92
Consumed more in the next 3M 58 58 57 64 43 59 55 65 57 63 63 65 59 62 63
Cigarettes
Consumed in the past 3M 57 56 58 58 53 56 55 59 55 60 64 65 62 67 56
Consumed more in the next 3M 34 34 34 37 25 34 31 39 30 42 40 43 35 41 39
Source: Credit Suisse Indonesia Consumer Survey 2016
Figure 55: Consumption of food and beverages
2015 2014 2010
Age Income* Age Income* Age Income*
% of respondents 18-29 30-45 46-55 56-65 Low Mid High 18-29 30-45 46-55 56-65 Low Mid High 18-29 30-45 46-55 56-65 Low Mid High
Carbonated drinks
in the past 3M 75 68 55 37 16 18 16 81 75 65 46 18 19 18 69 61 44 36 14 16 18
more in the next 3M 41 39 29 16 14 16 12 44 37 30 22 17 14 16 38 39 28 19 12 15 22
Bottled water
in the past 3M 94 89 86 80 22 23 25 98 94 94 89 24 24 24 86 82 78 70 21 22 23
more in the next 3M 58 58 58 54 22 25 28 67 64 65 52 25 26 26 52 52 50 45 21 21 24
Dairy products
in the past 3M 79 79 68 63 18 20 19 81 76 71 62 17 20 21 81 80 70 58 19 21 23
more in the next 3M 51 50 44 45 19 21 19 56 53 50 35 18 22 25 55 55 46 36 20 22 24
Instant noodles
in the past 3M 96 97 91 89 27 24 25 95 93 94 83 26 24 23 96 97 95 92 28 24 25
more in the next 3M 58 58 57 57 30 24 26 61 60 58 44 25 24 22 62 63 61 62 29 25 19
Cigarettes
in the past 3M 56 61 52 48 17 14 15 56 60 52 45 14 14 14 67 65 59 51 18 17 10
more in the next 3M 33 35 35 28 15 14 14 34 36 31 26 15 14 12 43 40 38 30 18 16 11
* Income is on monthly basis—low < Rp1.5mn, mid Rp1.5mn-Rp7.5mn, high > Rp7.5mn.
Source: Credit Suisse Indonesia Consumer Survey 2016
Carbonated drinks are gaining popularity with a higher number of respondents
consuming compared to six years ago (66% in 2015 vs 60% in 2010), even though
compared to the previous year, it declined from 74% in 2014, which we believe is due to
weaker purchasing power. They are more popular in urban areas (69%) and in Java
(67%); however, compared to six years ago, the popularity is rising in the rural areas (61%
in 2015 vs 52% in 2010) as well as outside Java (64% in 2015 vs 55%). The want-to-
consume-more-of-carbonated drinks is pretty much stable at around 36% of our
respondents. Carbonated drinks are popular amongst the younger generation due to the
taste and flavour.
The rising consumption of bottled water (89% in 2015 vs 82% in 2010) is due to the
change in lifestyle as most consumers are looking for convenience and healthier living,
even though it declined from 94% in 2014 due to weaker purchasing power. This is true
across all age groups and incomes. Consumption in the urban areas has risen from 86%
in 2010 to 93% in 2015, and, interestingly, rural areas have also seen an increase in
Surging popularity on
carbonated drinks as
product become more
affordable
Bottled water has become a
staple item

05 April 2016
Indonesia Consumer Survey 2016 36
consumption from 74% in 2010 to 83% in 2015. Those in Java have been consuming
more bottled water—from 85% in 2010 to 95% in 2015, and this is stable from the previous
year despite weaker purchasing power. The decline is seen in outside Java, despite which
the trend was stable at 77% in the last six years. However, compared to the previous year,
it plummetted from 91%. Nevertheless, a majority of the respondents are still looking to
consume more, as bottled water has become a staple item.
Meanwhile, the consumption of instant noodles in Indonesia continues to remain high,
undoubtedly as instant noodles are popular in Indonesia, since a majority of the
respondents consume them. Instant noodles are the most affordable food item, priced as
low as Rp2,000/pack, and it offers convenience and enough carbohydrates. Interestingly
when one gets wealthier, instant noodles become a luxury or a rewarding item to have.
This can be seen as a majority of the respondents are still looking to consume more,
across all age groups and across all income levels.
As a majority of dairy products are being consumed by our respondents, we view that
this product also serves as a defensive staple. Dairy products' growing popularity is seen
in the rural area (67% in 2015 vs 59% in 2010). While the urge to consume more of these
products remains high, the urge is not as high as bottled water and instant noodles.
Interestingly, while dairy products are popular amongst the younger generation, we are
seeing a pick-up from the older generation (63% in 2015 vs 58% in 2010).
On the other hand, our respondents are shying away from cigarettes, which saw a decline
in consumption in the past six year (57% in 2015 vs 64% in 2010). This might be due to
higher cigarette prices as the GoI continues to raise taxes, but might also be due to the
increase of health awareness as the GoI is implementing stricter measures on packaging
as well as advertising and promotion on cigarettes. The urge to consume more has also
declined from 40% in 2010 to 34% in 2015. Interestingly, the younger generation is not as
interested in smoking (56% in 2015 vs 67% in 2010).
Preference towards local brands
Consistent with our findings, local brands still dominate most of the F&B sector except for
carbonated drinks. Multinationals might own brands through acquisitions (such as bottled
water Aqua by Danone, or A Mild by Philip Morris International), nonetheless, the popular
products are still local names.
Figure 56: Respondents' preference in buying local brands especially for F&B (2015) 100 100 100 100 100 100 100 100 100 100 100 100 99 99 99 100 100 100 99 100 100 100 100 99
97 100 100
93 89
93 93 91
88 85
90 89
8
1
7 7 6 8
6
-
13
-
10
20
30
40
50
60
70
80
90
100
<Rp1mn Rp1mn - Rp1.5mn Rp1.5mn - Rp2mn Rp2mn - Rp3mn Rp3mn- Rp5mn Rp5mn - Rp7.5mn Rp10mn-Rp15mn Rp10mn - Rp15mn >Rp15mn
Cigarettes Instant Noodle Mineral water Dairy Carbonated drinks
Source: Credit Suisse Indonesia Consumer Survey 2016
Instant noodle is a defensive
staple
Dairy products are starting
to be defensive as well
Respondents are shying
away from cigarettes
F&B is still ruled by the local
brands

05 April 2016
Indonesia Consumer Survey 2016 37
Figure 57: Respondents' preference in buying local brands especially for F&B (2010)
100 95 96 98
93
86
100
86
75
99 99 100 99 99 98 100 100 100 98 100 99 100 100 100 100
100 100
93 94 91
84
76
81
88
69 65
4 7
4
10 10 7
- - - -
10
20
30
40
50
60
70
80
90
100
<Rp1mn Rp1mn - Rp1.5mn Rp1.5mn - Rp2mn Rp2mn - Rp3mn Rp3mn- Rp5mn Rp5mn - Rp7.5mn Rp10mn-Rp15mn Rp10mn - Rp15mn >Rp15mn
Cigarettes Instant Noodle Mineral water Dairy Carbonated drinks
Source: Credit Suisse Indonesia Consumer Survey 2016
Modest price increase seen
A majority of our respondents have seen modest price increases on basic food and drink,
whereas this is higher as compared to a year ago. The producers are adjusting price on
the back of the weak Rupiah to USD, which declined 10% YoY in 2015, despite soft
commodity prices (the likes of wheat, skim milk, sugar, corn and CPO) are still on a
declining trend. However, despite the price increases, we saw that margins recovery is
somewhat limited. We believe that because of the weak purchasing power, the increase in
prices is not followed with volume growth.
Figure 58: Margins across consumer staples companies remained stable
31% 32%30%
30% 29% 29%30%
31% 32% 31% 31%
14%
13% 13%
11%
13%12% 12%
13%14%
12%13%
4%
6%
8%
10%
12%
14%
16%
18%
20%
22%
0%
5%
10%
15%
20%
25%
30%
35%
1Q13 2Q13 3Q13 4Q13 1Q14 2Q14 3Q14 4Q14 1Q15 2Q15 3Q15
Gross margin Operating margin Net margin Revenue growth (RHS)
* Data based on 12 listed Indonesia consumer companies (ICBP, GGRM, KLBF, UNVR, MYOR, RMBA, TSPC, ROTI, ULTJ, STTP, TCID,
SIDO). Source: Company data, Credit Suisse estimates

05 April 2016
Indonesia Consumer Survey 2016 38
Figure 59: What level of inflation have you seen over the past 12 months on basic food and drink?
Area Region Age Income*
% of respondents Total Urban Rural Java Ex Java 18-29 30-45 46-55 56-65 Low Mid High
2015
Below 1% 5 6 4 5 6 6 4 7 3 6 5 2
1%-3% 28 30 26 30 26 28 29 25 28 29 29 19
3.1%-5% 24 26 20 27 17 23 27 25 16 24 23 33
5.1%-7% 8 9 7 8 9 7 9 7 12 9 9 9
7.1%-10% 7 7 5 7 4 8 7 5 3 4 6 13
Above 10% 3 3 3 4 2 4 3 3 3 2 3 5
I have not noticed any 12 9 18 11 17 12 11 15 10 16 12 4
I don’t know 12 9 18 9 19 11 10 13 27 10 13 15
2014
Below 1% 6 6 7 7 4 6 6 7 4 5 7 2
1%-3% 28 26 31 26 32 28 27 28 27 26 26 30
3.1%-5% 19 20 17 18 17 22 19 14 13 13 20 26
5.1%-7% 6 8 3 6 6 5 7 8 7 3 8 5
7.1%-10% 6 8 2 5 3 5 6 7 4 3 6 6
Above 10% 5 5 6 7 1 4 6 5 5 9 5 3
I have not noticed any 13 13 12 11 16 14 12 10 17 21 12 17
I don’t know 17 15 22 21 19 16 17 20 23 21 15 10
2010
Below 1% 7 8 4 3 16 5 7 8 8 5 7 13
1%-3% 23 24 22 16 42 23 25 20 21 24 23 5
3.1%-5% 23 21 25 26 11 24 21 22 23 27 21 35
5.1%-7% 13 13 15 16 6 11 15 15 12 13 14 17
7.1%-10% 8 8 10 11 2 6 9 9 16 5 10 13
Above 10% 7 8 5 8 3 7 7 7 5 4 8 17
I have not noticed any 6 7 3 4 10 8 3 5 6 5 6 0
I don’t know 13 12 17 15 10 16 12 13 9 18 11 0
* Income is on monthly basis—low < Rp1.5mn, mid Rp1.5mn-Rp7.5mn, high > Rp7.5mn.
Source: Credit Suisse Indonesia Consumer Survey 2016
Figure 60: Wheat (USD/bushel) Figure 61: Skim milk (USD/metric tonne)
4
5
6
7
8
Mar-13 Sep-13 Mar-14 Sep-14 Mar-15 Sep-15 Mar-16
USD
/bus
hel
Wheat (USD/bushel)
Avg 2010: 5.4Avg 2011: 6.8Avg 2012: 7.4Avg 2013: 6.8Avg 2014: 5.9Avg 2015: 5.1YTD 2016: 4.7
1400
1700
2000
2300
2600
2900
3200
3500
3800
4100
4400
4700
5000
5300
5600
Mar-13 Sep-13 Mar-14 Sep-14 Mar-15 Sep-15 Mar-16
US
$ / m
etric
tonn
e
Skim milk (USD/metric tonne)
Avg 2010: 3,393Avg 2011: 3,660Avg 2012: 3,163Avg 2013: 4,399Avg 2014: 3,753Avg 2015: 2,165YTD 2016: 1,820
Source: Bloomberg Source: Bloomberg

05 April 2016
Indonesia Consumer Survey 2016 39
Figure 62: Sugar (USD/50kg) Figure 63: Corn (USD/bushel)
11
13
15
17
19
21
23
25
Feb-13 Aug-13 Feb-14 Aug-14 Feb-15 Aug-15 Feb-16
USD
/50k
g
Sugar (USD/50kg)
Avg 2010: 34.6Avg 2011: 39.4Avg 2012: 28.2Avg 2013: 21.7Avg 2014: 21.1Avg 2015: 16.8YTD 2016: 20.7
2
3
4
5
6
7
8
Mar-13 Sep-13 Mar-14 Sep-14 Mar-15 Sep-15 Mar-16
USD
/bus
hel
Corn (USD/bushel)
Avg 2010: 4.0Avg 2011: 6.7Avg 2012: 6.9Avg 2013: 5.9Avg 2014: 4.0Avg 2015: 3.6YTD 2016: 3.5
Source: Bloomberg Source: Bloomberg
The rising popularity of beverages
Carbonated drinks vs bottled water
Carbonated drinks are gaining popularity with a higher number of respondents
consuming these drinks as compared to six years ago (66% in 2015 vs 60% in 2010),
even though the popularity declined from 74% in 2014, which we believe was due to
weaker purchasing power. They are more popular in urban areas (69%) and in Java
(67%); however, as compared to six years ago, the popularity is rising in the rural areas
(61% in 2015 vs 52% in 2010) as well as outside Java (64% in 2015 vs 55%). The want-
to-consume-more-of-carbonated drinks is pretty much stable at around 36% of our
respondents. Carbonated drinks are popular amongst the younger generation due to the
taste and flavour.
Figure 64: Consumption of carbonated drinks (area)
2015 2014 2010
% of respondents Total Urban Rural Java Ex Java Total Urban Rural Java Ex Java Total Urban Rural Java Ex Java
Consumed in the past 3M 66 69 61 67 64 74 76 70 72 77 60 64 52 62 55
Consumed more in the next 3M 36 39 32 40 28 37 39 35 32 53 36 41 25 34 41
Source: Credit Suisse Indonesia Consumer Survey 2016
Figure 65: Consumption of carbonated drinks (age and income)
2015 2014 2010
Age Income* Age Income* Age Income*
% of respondents 18-29 30-45 46-55 56-65 Low Mid High 18-29 30-45 46-55 56-65 Low Mid High 18-29 30-45 46-55 56-65 Low Mid High
in the past 3M 75 68 55 37 16 18 16 81 75 65 46 18 19 18 69 61 44 36 14 16 18
more in the next 3M 41 39 29 16 14 16 12 44 37 30 22 17 14 16 38 39 28 19 12 15 22
* Income is on monthly basis—low < Rp1.5mn, mid Rp1.5mn-Rp7.5mn, high > Rp7.5mn.
Source: Credit Suisse Indonesia Consumer Survey 2016
Coca-Cola, manufactured by Coca-Cola Amatil, showed a slight improvement (27% in
2015 vs 25% in 2014); however, when compared to six years ago, its popularity has
declined from 30% in 2010 to 27% in 2015, due to stiffening competition. However, Coca-
Cola continues to lead as the most favoured carbonated drink in Indonesia.
Its closest competitor, Big Cola, which is manufactured by Spain-based AjeGroup, saw its
share decline to 16% in 2015 from 20% in 2014. Big Cola started gaining popularity since
2013. Its popularity was mainly due to its 'value for money' product, which is around 30%
cheaper as compared to Coca-Cola, and its larger volume. Nevertheless, Big Cola is more
popular among respondents who live in rural areas and outside Java. It is also popular
amongst the lower income group due to its affordability and across generations.
Surging popularity on
carbonated drinks as the
product is becoming more
affordable

05 April 2016
Indonesia Consumer Survey 2016 40
Both Sprite and Fanta, which are also manufactured by Coca-Cola Amatil, maintained
their position as the second and third most favoured carbonated drinks in Indonesia. Their
shares are relatively stable at 22% and 21%, respectively. Despite competition from Big
Cola, interestingly, Sprite's popularity is stable as compared to six years ago—at 22%. On
the other hand, the decline in Fanta's popularity (21% in 2015 vs 31% in 2010), we
believe, is due to competition as Big Cola is also producing a product with a similar
flavour.
Pepsi Cola continues to be challenging, being the fifth most favoured carbonated drink in
Indonesia, with its popularity remaining flat at 4%. Pepsi Cola is manufactured by PT
Pepsi-Cola Indobeverages, a JV between Indofood CBP and Asahi Group Holdings.
Figure 66: Carbonated drinks, by brands
Area Region Age Income*
% of respondents Total Urban Rural Java Ex Java 18-29 30-45 46-55 56-65 Low Mid High
2015
Coca-Cola 27 28 26 32 25 27 27 26 29 29 31 26
Sprite 22 21 26 25 27 22 22 23 22 27 25 24
Fanta 21 21 21 22 24 21 21 21 20 16 24 26
Big Cola 16 15 18 18 21 16 15 16 17 27 16 17
Pepsi Cola 4 4 3 3 3 4 4 4 3 1 5 7
2014
Coca-Cola 25 26 23 26 25 25 24 27 26 21 26 31
Sprite 21 20 24 23 26 20 22 21 23 26 23 24
Fanta 22 22 22 24 23 22 22 25 20 28 23 26
Big Cola 20 19 23 22 22 19 21 18 23 22 23 15
Pepsi Cola 5 5 3 5 4 5 4 4 1 3 5 4
2010
Coca-Cola 30 31 27 32 32 29 31 33 35 31 37 42
Sprite 22 21 25 28 30 20 23 24 22 29 23 21
Fanta 31 30 34 36 35 31 30 30 33 38 34 37
Big Cola 0 0 0 0 0 0 0 0 0 0 0 0
Pepsi Cola 4 5 2 4 3 5 3 2 2 3 6 0
* Income is on monthly basis—low < Rp1.5mn, mid Rp1.5mn-Rp7.5mn, high > Rp7.5mn.
Source: Credit Suisse Indonesia Consumer Survey 2016
Bottled water consumption continues to be high
The rising consumption of bottled water (89% in 2015 vs 82% in 2010) is due to a change
in lifestyle as most consumers are looking for convenience and healthier living, even
though it declined from 94% in 2014 due to weaker purchasing power. Consumption in the
urban areas rose from 86% in 2010 to 93% in 2015, and interestingly rural areas also saw
consumption increasing from 74% in 2010 to 83% in 2015.
Consumers in Java have been consuming more bottled water from 85% in 2010 to 95% in
2015—stable from the previous year despite weaker purchasing power. The decline is
seen in outside Java, where the trend was stable at 77% in the last six years. However, as
compared to the previous year, it plummetted from 91%. Nevertheless, a majority of the
respondents are still looking to consume more as bottled water has become a staple item.
Figure 67: Consumption of bottled water
2015 2014 2010
% of respondents Total Urban Rural Java Ex Java Total Urban Rural Java Ex Java Total Urban Rural Java Ex Java
Consumed in the past 3M 89 93 83 95 77 94 97 89 95 91 82 86 74 85 76
Consumed more in the next 3M 58 62 51 67 36 64 65 64 62 69 51 57 39 50 55
Source: Credit Suisse Indonesia Consumer Survey 2016
Bottled water has become a
staple item

05 April 2016
Indonesia Consumer Survey 2016 41
Figure 68: Consumption of food and beverages
2015 2014 2010
Age Income* Age Income* Age Income*
% of respondents 18-29 30-45 46-55 56-65 Low Mid High 18-29 30-45 46-55 56-65 Low Mid High 18-29 30-45 46-55 56-65 Low Mid High
in the past 3M 94 89 86 80 22 23 25 98 94 94 89 24 24 24 86 82 78 70 21 22 23
more in the next 3M 58 58 58 54 22 25 28 67 64 65 52 25 26 26 52 52 50 45 21 21 24
* Income is on monthly basis—low < Rp1.5mn, mid Rp1.5mn-Rp7.5mn, high > Rp7.5mn.
Source: Credit Suisse Indonesia Consumer Survey 2016
The bottled water business is competitive, as it depends on brand equity, product visibility
and pricing. The gap between the first player and the second one is huge, at 37% in 2015,
even though it has narrowed from 46% in 2010.
Aqua, manufactured by Danone, continues to be the most preferred bottled water brand by
our respondents, despite its market share declining to 50% in 2015 from 62% in 2014 (56% in
2010) due to competition. Aqua is more popular among respondents who live in the urban
areas and outside Java, which we believe is because of the location of its plants as well as a
stronger distribution network. The brand is popular amongst all generations, and because of
its pricing and market positioning, it become the preferred brand for the higher income earner.
Aqua was a local brand that was acquired by Groupe Danone in 1998.
According to our survey, the second most favoured bottled water brand is Club. Club was
acquired by a JV of Indofood CBP and Asahi Group. Its popularity rose to 13% in 2015,
from 10% in 2010. We view that after the acquisition, the distribution of the brand has
improved. The transition of the distribution to its sister company, Indomarco, is expected to
be completed by 2Q16. The brand is preferred by those in urban areas and in Java mostly,
for the middle income segment.
Figure 69: Bottled water consumption, by brands
Area Region Age Income*
% of respondents Total Urban Rural Java Ex Java 18-29 30-45 46-55 56-65 Low Mid High
2015
Aqua 50 51 48 44 73 50 52 46 51 50 51 63
Club 13 14 12 14 11 14 12 14 14 10 13 8
Vit 12 12 12 12 7 13 11 13 13 14 12 10
2 Tang 5 4 5 5 1 4 5 5 5 7 4 4
Viro 4 3 5 5 1 4 4 4 1 4 4 3
Sangua 1 1 2 1 0 1 1 1 1 0 1 3
Others 15 14 16 19 7 14 15 16 14 16 15 8
2014
Aqua 62 60 67 58 83 59 63 67 65 70 60 63
Club 12 11 13 14 9 14 11 8 7 11 13 11
Vit 11 13 7 11 3 11 10 11 12 11 11 10
2 Tang 4 6 1 3 0 5 3 3 4 0 4 8
Viro 5 5 7 7 1 5 7 5 4 1 6 3
Sangua 0 0 0 0 0 0 0 0 0 0 0 0
Others 6 6 6 6 4 5 5 6 8 7 6 5
2010
Aqua 56 56 55 53 75 56 56 58 53 63 57 58
Club 10 10 11 11 10 10 10 12 13 12 11 19
Vit 10 10 10 9 4 9 11 10 11 8 10 3
2 Tang 7 7 9 7 2 7 8 5 7 5 7 7
Viro 2 3 1 2 0 3 2 2 1 1 2 0
Sangua 1 2 0 1 0 2 1 1 0 0 2 0
Others 12 12 14 17 9 13 12 12 14 12 11 13
* Income is on monthly basis—low < Rp1.5mn, mid Rp1.5mn-Rp7.5mn, high > Rp7.5mn.
Source: Credit Suisse Indonesia Consumer Survey 2016
Aqua is still most popular,
but is declining
Club is starting to gain
better popularity

05 April 2016
Indonesia Consumer Survey 2016 42
Instant noodles
Meanwhile, the consumption of instant noodles in Indonesia continues to remain high.
Undoubtedly, instant noodles are is popular in Indonesia, as a majority of the respondents
consume it. Instant noodles is the most affordable food item, priced as low as
Rp2,000/pack, and it offers convenience and one complete meal in a package
(carbohydrate and fat). Interestingly when one gets wealthier, instant noodles become a
luxury or a rewarding item to have. This can be seen as a majority of the respondents,
across all age groups and across all income levels, are still looking to consume more.
Figure 70: Consumption of instant noodles
2015 2014 2010
% of respondents Total Urban Rural Java Ex Java Total Urban Rural Java Ex Java Total Urban Rural Java Ex Java
Consumed in the past 3M 95 94 97 97 91 93 93 93 94 91 96 97 95 98 92
Consumed more in the next 3M 58 58 57 64 43 59 55 65 57 63 63 65 59 62 63
Source: Credit Suisse Indonesia Consumer Survey 2016
Figure 71: Consumption of food and beverages
2015 2014 2010
Age Income* Age Income* Age Income*
% of respondents 18-29 30-45 46-55 56-65 Low Mid High 18-29 30-45 46-55 56-65 Low Mid High 18-29 30-45 46-55 56-65 Low Mid High
in the past 3M 96 97 91 89 27 24 25 95 93 94 83 26 24 23 96 97 95 92 28 24 25
more in the next 3M 58 58 57 57 30 24 26 61 60 58 44 25 24 22 62 63 61 62 29 25 19
* Income is on monthly basis—low < Rp1.5mn, mid Rp1.5mn-Rp7.5mn, high > Rp7.5mn.
Source: Credit Suisse Indonesia Consumer Survey 2016
The instant noodle business in Indonesia is pretty much a two-player business, with Indofood
CBP (ICBP) as the leading player and unlisted Wings Group as the second-largest player. The
two of them had a combined market share of 89% in 2015.
ICBP is the leading player in the instant noodle business, with a total of 63% share in
2015, gaining from 59% in 2014 and 2010. ICBP has three major brands, namely Indomie,
Sarimi, and Supermie. Indomie continues to be the leading brand (37%), followed by Mie
Sedap (26%), manufactured by the unlisted Wings Group. Both Indomie and Mie Sedap's
shares declined in 2015, from 40% and 33% in 2014 and 38% and 29% in 2010,
respectively. We believe the trend might be due to consumers downtrading on the back of
weaker purchasing power. The lower end brands, such as Sarimi and Supermie are taking
some share at 10% each in 2015, from 7% in the previous years.
On the other hand, the premium product, that is noodle in a cup, PopMie, has retained a
relatively stable share at 5%, even though its share improved from 3% in 2010 as
consumers are looking for convenience. PopMie is consumed mostly by the high earners
and younger generations.
Indomie continues to be popular among all age groups and income levels, particularly the
higher income earners. Due to its intensive distribution network, its popularity is
widespread in both urban and rural areas, particularly Java. Interestingly, its competitor
Mie Sedap's popularity among the higher income earners declined and it is now most
popular amongst the lower income earners, in rural areas and outside Java.
Instant noodle is a defensive
staple
Lower end brands are
gaining shares
Stable share on the
premium product
Indomie vs Mie Sedap

05 April 2016
Indonesia Consumer Survey 2016 43
Figure 72: Noodle consumption, by brand—Indomie is still leading
Area Region Age Income*
% of respondents Total Urban Rural Java Ex-Java 18-29 30-45 46-55 56-65 Low Mid High
2015
Indomie 37 39 33 41 30 38 37 36 38 35 37 41
Mie Sedap 26 24 31 25 30 26 26 27 26 31 26 19
Sarimi 10 10 11 10 11 9 11 9 11 11 10 13
Supermi 10 10 10 9 10 9 10 10 10 13 9 7
Gaga Mie 1 0 1 1 0 0 1 1 2 1 1 1
ABC 2 2 2 2 2 0 0 0 0 1 2 2
Popmie 5 6 3 5 4 5 5 5 2 0 5 6
Salam Mie 0 0 1 0 0 0 0 1 0 1 0 0
Alhami 0 0 0 0 1 0 0 0 0 0 1 0
Mie 100 0 1 0 0 2 0 1 0 1 1 1 0
Others 7 8 7 7 11 0 0 0 0 7 8 11
2014
Indomie 40 42 36 44 32 40 40 41 44 41 41 41
Mie Sedap 33 31 39 32 38 33 33 34 35 37 33 32
Sarimi 7 6 9 8 4 6 7 6 8 6 7 6
Supermi 7 8 5 6 9 7 7 8 5 5 6 12
Gaga Mie 0 0 0 0 0 0 0 0 0 0 0 0
ABC 0 0 0 0 0 0 0 0 0 0 0 0
Popmie 5 6 3 6 4 7 5 3 3 4 6 5
Salam Mie 0 0 0 0 0 0 0 0 0 0 0 0
Alhami 0 0 0 0 0 0 0 0 0 0 0 0
Mie 100 1 1 0 0 3 1 1 1 0 1 1 1
Others 6 6 6 4 10 0 0 0 0 6 6 3
2010
Indomie 38 40 31 41 30 39 36 39 37 35 38 39
Mie Sedap 29 26 35 29 31 30 28 29 36 32 28 25
Sarimi 7 5 10 8 5 6 8 7 7 9 6 4
Supermi 11 11 12 11 13 11 12 12 11 13 11 6
Gaga Mie 1 1 1 0 2 1 1 1 0 1 1 0
ABC 1 1 1 1 2 1 1 1 3 1 2 2
Popmie 3 4 1 4 2 4 3 2 1 1 4 6
Salam Mie 0 0 0 1 0 0 0 0 0 0 1 0
Alhami 1 1 1 0 3 0 1 1 0 1 1 0
Mie 100 2 3 1 0 6 3 2 1 1 2 2 0
Others 6 7 5 5 6 0 0 0 0 4 6 18
* Income is on monthly basis—low < Rp1.5mn, mid Rp1.5mn-Rp7.5mn, high > Rp7.5mn.
Source: Credit Suisse Indonesia Consumer Survey 2016
Dairy products
As a majority of dairy products are being consumed by our respondents, we view that
this product also serves as a defensive staple. Growing popularity is seen in the rural area
(67% in 2015 vs 59% in 2010). While the urge to consume more remains high, the urge is
not as high as bottled water and instant noodles. Do note that the dairy products surveyed
included sweet condensed milk (SCM), liquid milk, which is mostly UHT (ultra high
temperature) products, and powdered milk, as well as margarine and cheese.
Dairy products are starting
to be defensive as well

05 April 2016
Indonesia Consumer Survey 2016 44
Figure 73: Consumption of dairy products
2015 2014 2010
% of respondents Total Urban Rural Java Ex Java Total Urban Rural Java Ex Java Total Urban Rural Java Ex Java
Consumed in the past 3M 76 81 67 81 63 76 82 65 74 81 78 82 59 78 76
Consumed more in the next 3M 49 52 44 57 31 52 55 47 47 66 53 58 41 50 58
Source: Credit Suisse Indonesia Consumer Survey 2016
Figure 74: Consumption of dairy products
2015 2014 2010
Age Income* Age Income* Age Income*
% of respondents 18-29 30-45 46-55 56-65 Low Mid High 18-29 30-45 46-55 56-65 Low Mid High 18-29 30-45 46-55 56-65 Low Mid High
in the past 3M 79 79 68 63 18 20 19 81 76 71 62 17 20 21 81 80 70 58 19 21 23
more in the next 3M 51 50 44 45 19 21 19 56 53 50 35 18 22 25 55 55 46 36 20 22 24
* Income is on monthly basis—low < Rp1.5mn, mid Rp1.5mn-Rp7.5mn, high > Rp7.5mn.
Source: Credit Suisse Indonesia Consumer Survey 2016
Our survey indicated that Frisian Flag continues to be the most popular in dairy products.
However, its share declined from 34% in 2010 to 23% in 2015, mostly losing to other
smaller brands. Again, we believe that this is due to downtrading as consumer purchasing
power was weaker during the period. Frisian Flag, whose product is better known under
the brand "Susu Bendera", is manufactured by the unlisted company PT Frisian Flag
Indonesia, which started producing SCM products since 1971. In addition, it also produces
liquid milk and milk powder. The brand is popular across all age groups and income
segments, particularly in rural areas and outside Java.
Indomilk is manufactured by PT Indolakto, a subsidiary of Indofood CBP. It is the second
most popular dairy product, according to our survey. Its popularity rose to 21% in 2015
from 19% in 2010. Indomilk is popular across all age groups, and the lower and middle
income segment, particularly in the rural areas and Java.
The third most popular dairy product is Milk Ultra, which is manufactured by PT Ultrajaya.
Its popularity improved to 15% in 2015 from 12% in 2010. Its main products belong to the
liquid category with the UHT process and aseptic packaging technology. It also
manufactures the SCM product under the "Cap Sapi" brand. Ultra is popular amongst the
younger generation, across all income segments, particularly in urban areas and Java.
Nestlé is ranked fourth in terms of its popularity based on our survey. PT Nestlé Indonesia
is the subsidiary of Switzerland based, Nestlé SA, and has been operating in Indonesia
since 1971. The company's biggest brand is its milk powder brand—Dancow—which saw
its shares declining to 8% in 2015 from 10% in 2010.
The survey also indicated Blue Band as one of the popular products, with 7%
respondents. Blue Band is owned by Unilever Indonesia and is a manufacturer of
margarine.
Frisian Flag losing share
Indomilk gaining share
Susu Ultra losing share
Dancow is also losing
shares

05 April 2016
Indonesia Consumer Survey 2016 45
Figure 75: Dairy products consumption, by brand—Frisian Flag still dominates
Area Region Age Income*
% of respondents Total Urban Rural Java Ex-Java 18-29 30-45 46-55 56-65 Low Mid High
2015
Frisian Flag 23 21 29 21 36 22 24 24 21 24 23 27
Indomilk 21 19 28 27 11 22 20 23 25 21 22 15
Milk Ultra 15 16 13 16 8 17 16 13 7 16 15 14
Nestlé 8 9 7 7 9 9 8 7 5 7 8 9
Blue Band 7 9 3 7 7 6 7 8 10 5 7 8
Others 26 27 20 23 30 24 25 24 31 28 24 27
2014
Frisian Flag 26 24 30 22 39 25 27 26 36 25 26 29
Indomilk 22 19 28 25 14 23 21 21 24 22 22 16
Milk Ultra 18 20 13 19 14 21 18 17 6 18 19 14
Nestlé 10 11 6 9 9 9 10 10 7 9 10 7
Blue Band 9 10 5 9 7 8 9 11 11 9 9 12
Others 16 16 16 16 17 16 17 16 16 17 15 21
2010
Frisian Flag 34 31 44 31 43 33 34 40 38 44 34 19
Indomilk 19 17 23 22 12 19 18 20 21 23 18 14
Milk Ultra 12 13 9 11 11 13 12 9 8 10 12 19
Nestlé 10 11 7 11 8 11 10 9 9 5 11 14
Blue Band 0 0 0 0 0 0 0 0 0 0 0 0
Others 25 28 17 25 25 24 26 22 25 18 24 35
* Income is on monthly basis—low < Rp1.5mn, mid Rp1.5mn-Rp7.5mn, high > Rp7.5mn.
Source: Credit Suisse Indonesia Consumer Survey 2016
Cigarettes
On the other hand, our respondents are shying away from cigarettes, which have seen a
decline in consumption in the past six years (57% in 2015 vs 64% in 2010). This might be
due to higher cigarette prices as the GoI continues to raise taxes, but it could also be due
to the increase of health awareness as the GoI is implementing stricter measures on
packaging as well as advertising and promotion on cigarettes. The urge to consume more
has also declined from 40% in 2010 to 34% in 2015. Interestingly, the younger generation
is less interested in smoking (56% in 2015 vs 67% in 2010).
Figure 76: Consumption of cigarettes
2015 2014 2010
% of respondents Total Urban Rural Java Ex Java Total Urban Rural Java Ex Java Total Urban Rural Java Ex Java
Consumed in the past 3M 57 56 58 58 53 56 55 59 55 60 64 65 62 67 56
Consumed more in the next 3M 34 34 34 37 25 34 31 39 30 42 40 43 35 41 39
Source: Credit Suisse Indonesia Consumer Survey 2016
Figure 77: Consumption of cigarettes
2015 2014 2010
Age Income* Age Income* Age Income*
% of respondents 18-29 30-45 46-55 56-65 Low Mid High 18-29 30-45 46-55 56-65 Low Mid High 18-29 30-45 46-55 56-65 Low Mid High
in the past 3M 56 61 52 48 17 14 15 56 60 52 45 14 14 14 67 65 59 51 18 17 10
more in the next 3M 33 35 35 28 15 14 14 34 36 31 26 15 14 12 43 40 38 30 18 16 11
* Income is on monthly basis—low < Rp1.5mn, mid Rp1.5mn-Rp7.5mn, high > Rp7.5mn.
Source: Credit Suisse Indonesia Consumer Survey 2016
Indonesia is the second largest cigarette market in the world, after China, followed by
Russia (310 bn sticks) and Japan (186 bn sticks), according to Philip Morris International's
(PMI) estimates. Indonesia is the only country in the three largest markets in the world to
Respondents are shying
away from cigarettes
Indonesia is a large
cigarette market
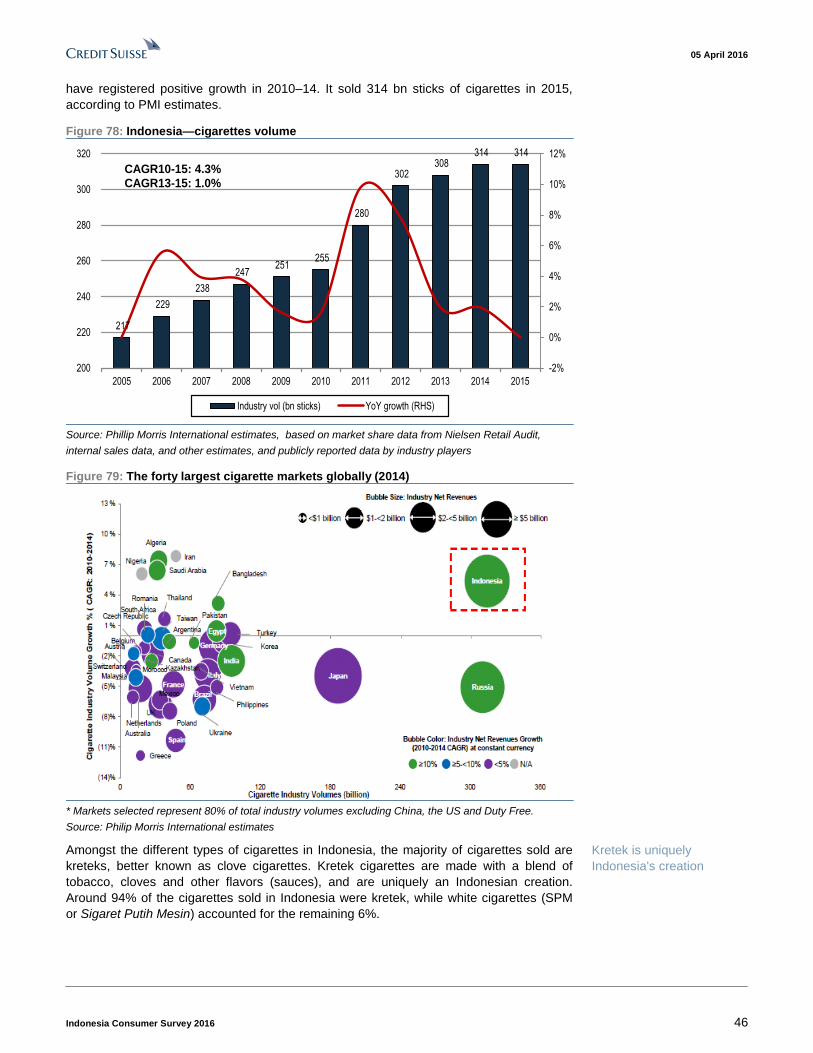
05 April 2016
Indonesia Consumer Survey 2016 46
have registered positive growth in 2010–14. It sold 314 bn sticks of cigarettes in 2015,
according to PMI estimates.
Figure 78: Indonesia—cigarettes volume
217
229
238
247 251
255
280
302 308
314 314
-2%
0%
2%
4%
6%
8%
10%
12%
200
220
240
260
280
300
320
2005 2006 2007 2008 2009 2010 2011 2012 2013 2014 2015
Industry vol (bn sticks) YoY growth (RHS)
CAGR10-15: 4.3%CAGR13-15: 1.0%
Source: Phillip Morris International estimates, based on market share data from Nielsen Retail Audit,
internal sales data, and other estimates, and publicly reported data by industry players
Figure 79: The forty largest cigarette markets globally (2014)
* Markets selected represent 80% of total industry volumes excluding China, the US and Duty Free.
Source: Philip Morris International estimates
Amongst the different types of cigarettes in Indonesia, the majority of cigarettes sold are
kreteks, better known as clove cigarettes. Kretek cigarettes are made with a blend of
tobacco, cloves and other flavors (sauces), and are uniquely an Indonesian creation.
Around 94% of the cigarettes sold in Indonesia were kretek, while white cigarettes (SPM
or Sigaret Putih Mesin) accounted for the remaining 6%.
Kretek is uniquely
Indonesia's creation

05 April 2016
Indonesia Consumer Survey 2016 47
There are two types of kretek cigarettes, namely SKT (Sigaret Kretek Tangan, or hand-
rolled) and SKM (Sigaret Kretek Mesin, or machine-made). The difference between the
two is in terms of tar and nicotine content, with SKT being stronger in tar and nicotine and,
therefore, having a stronger flavour, whereas SKM contains a filter. There are two types of
SKM cigarettes—the full-flavoured (FF), and the low-tar and low-nicotine (LTLN), which
differ in terms of tar and nicotine content; SKM LTLN has a milder taste.
GoI excise tax tariff and target
Other than the taste and content, cigarettes differ in prices as well, mostly due to the
difference in the excise tax that is regulated by the GoI. The GoI commonly revises its
excise tariff regulation once a year, even though it can also be revised at any time during
the year. This is to meet the GoI target on total customs and excise tax of Rp186.5 tn in
2016. For the excise tax revenue alone, it is targeting Rp146 tn in 2016, whereby up to
Feb-2016 excise tax revenue accounted only for 2% of the FY16 target.
Figure 80: Excise tax revenue Figure 81: % excise tax to total tax revenue
332563777244680
5125256718
6616677010
95028
108452118086
144600146430
126100
0%
5%
10%
15%
20%
25%
0
20000
40000
60000
80000
100000
120000
140000
160000
2005
2006
2007
2008
2009
2010
2011
2012
2013
2014
2015
2016
E
2015
exc
l. on
e-of
f
Excise tax revenue (Rp bn) YoY growth (%)
10%
9%
11%11%
10%
10%
9% 9%
8%
9% 9%9%
10%
10%10%
10%9%
8%
7%
8%
9%
10%
11%
12%
2000
2001
2002
2003
2004
2005
2006
2007
2008
2009
2010
2011
2012
2013
2014
2015
2016
E
2015
exc
l. on
e-o
ff
Source: Ministry of Finance Source: Ministry of Finance, Credit Suisse estimates
Based on the latest regulation on excise tariff, the Ministry of Finance's Decree No.
198/PMK.010/2015—signed on 6 Nov 15 and effective 1 Jan 16 onwards—states that the
highest excise duty tax increase on SPM is of 16.5%, followed by SKM of 15.7%, while
SKT had the lowest increase of 10.3%. This is based on tier-one cigarette producers,
those that are producing more than 2 bn sticks per year. This said SPM is now taxed at
Rp495/stick, SKM at Rp480/stick and SKT at Rp320/stick in 2016, as compared to
Rp425/stick, Rp415/stick and Rp290/stick in 2015, respectively.
At the same time, the minimum retail price (MRP) for SPM also increased by 13%, SKM
by 25% and SKT by 35%. That said, the MRP for SPM is now at Rp930/stick, SKM at
Rp1,000/stick and SKT Rp1,115/stick, as compared to Rp820/stick, Rp800/stick and
Rp825/stick in 2015, respectively.
Additionally, the government increased its value added tax (VAT) to 8.7% from 8.4%,
which is calculated based on the banderole prices, and continues to apply a 10% regional
tax, based on the excise tax tariff per stick.
Two types of kretek: hand-
rolled (SKT) and machine-
made (SKM). SKM types:
full flavoured (FF), low-tar,
low-nicotine (LTLN)
Higher tax on SPM on per
stick basis
MRP for SKT is most
expensive
VAT increase to 8.7% this
year

05 April 2016
Indonesia Consumer Survey 2016 48
Figure 82: 2016 excise tax regulation—Ministry of Finance Decree No. 198/PMK.010/2015, signed on 6 Nov 15 and
effective 1 Jan 16
Type* Tier Annual output MRP (Rp/stick) Tax (Rp/stick)
(sticks) Old New Chg Old New Chg
SKM I > 2 bn Above Rp1,000 800 1000 25.0% 415 480 15.7%
II < 2 bn Above Rp744 588 740 25.9% 305 340 11.5%
Below Rp740 min at Rp590 511-588 590-740 15.5%-25.9% 265 300 13.2%
SPM I > 2 bn Below at Rp930 820 930 13.4% 425 495 16.5%
II < 2 bn Above Rp800 520 800 53.8% 270 305 13.0%
Below Rp800, min at Rp505 425-520 505-800 18.8%-53.8% 220 255 15.9%
SKT I > 2 bn Above Rp1,115 825 1115 35.2% 290 320 10.3%
Below Rp1,115, min at Rp775 606-825 775-1115 27.9%-35.2% 220 245 11.4%
II 350 mn - 2 bn Above Rp605 417 605 45.1% 140 155 10.7%
Rp430-Rp605 385-417 430-605 11.7%-45.1% 125 140 12.0%
IIIA 50 mn - 350 mn Min price at Rp400 286 400 39.9% 85 90 5.9%
IIIB < 50 mn Min price at Rp370 286 370 29.4% 80 80 0.0%
* SKT: Hand-rolled kretek cigarette, SKM: Machine-made kretek cigarette, SPM: White cigarette.
Source: Ministry of Finance
Figure 83: Historical excise tax duty
Type* Tier Annual output Tax (Rp/stick)
(sticks) 1-Feb-09 2010 1-Jul-10 2011 2012 2013 2015 2016
SKM I > 2 bn 290 310 310 325 355 375 415 480
II < 2 bn 210 230 230 245 270 285 305 340
175 195 195 210 235 245 265 300
SPM I > 2 bn 290 310 310 325 365 380 425 495
II < 2 bn 170 200 200 215 235 245 270 305
135 165 165 175 190 195 220 255
SKT I > 2 bn 200 215 215 235 255 275 290 320
130-150 145-165 145-165 155-180 195 205 220 245
II 350 mn - 2 bn 90 105 105 110 125 130 140 155
80 95 95 100 115 120 125 140
IIIA 50 mn - 350 mn 40 65 50 65 75 80 85 90
IIIB < 50 mn 80 80
YoY growth:
SKM I > 2 bn 6.9% 0.0% 4.8% 9.2% 5.6% 10.7% 15.7%
II < 2 bn 9.5% 0.0% 6.5% 10.2% 5.6% 7.0% 11.5%
11.4% 0.0% 7.7% 11.9% 4.3% 8.2% 13.2%
SPM I > 2 bn 6.9% 0.0% 4.8% 12.3% 4.1% 11.8% 16.5%
II < 2 bn 17.6% 0.0% 7.5% 9.3% 4.3% 10.2% 13.0%
22.2% 0.0% 6.1% 8.6% 2.6% 12.8% 15.9%
SKT I > 2 bn 7.5% 0.0% 9.3% 8.5% 7.8% 5.5% 10.3%
( 10-11.5% 0.0% 6.9-9.1% 8.3-25.8% 5.1% 7.3% 11.4%
II 350 mn - 2 bn 16.7% 0.0% 4.8% 13.6% 4.0% 7.7% 10.7%
18.8% 0.0% 5.3% 15.0% 4.3% 4.2% 12.0%
IIIA 50 mn - 350 mn 62.5% -23.1% 30.0% 15.4% 6.7% 6.3% 5.9%
* SKT: Hand-rolled kretek cigarette, SKM: Machine-made kretek cigarette, SPM: White cigarette.
Source: Ministry of Finance

05 April 2016
Indonesia Consumer Survey 2016 49
Figure 84: Historical Minimum Retail Price (MRP)
Type Tier Annual output Minimum Retail Price (MRP)
(sticks) 1-Feb-09 2010 1-Jul-10 2011 2012 2013 2015 2016
SKM I > 2 bn 660 660 660 660 660 669 800 1000
II < 2 bn 430 430 430 430 430 549 588 740
374-380 374-380 374-380 374-380 374-430 440-549 511-588 590-740
SPM I > 2 bn 600 600 600 600 375 680 820 930
II < 2 bn 300 300 300 300 300 444 520 800
254-300 254-300 254-300 254-300 254-300 345-444 425-520 505-800
SKT I > 2 bn 590 590 590 590 590 749 825 1115
520-550 520-550 520-550 520-550 520-590 550-749 606-825 775-1115
II 350 mn - 2 bn 379 379 379 379 379 379 417 605
349-379 349-379 349-379 349-379 349-379 349-379 385-417 430-605
IIIA 50 mn - 350 mn 234 234 234 234 234 250 286 400
IIIB < 50 mn 286 370
YoY growth
SKM I > 2 bn 0.0% 0.0% 0.0% 0.0% 1.4% 19.6% 25.0%
II < 2 bn 0.0% 0.0% 0.0% 0.0% 27.7% 7.1% 25.9%
0.0% 0.0% 0.0% 0-13.2% 17.6-27.7% 7.1-16.1% 15.5-25.9%
SPM I > 2 bn 0.0% 0.0% 0.0% -37.5% 81.3% 20.6% 13.4%
II < 2 bn 0.0% 0.0% 0.0% 0.0% 48.0% 17.1% 53.8%
0.0% 0.0% 0.0% 0.0% 35.8-48% 17.1-23.2% 18.8-53.8%
SKT I > 2 bn 0.0% 0.0% 0.0% 0.0% 26.9% 10.1% 35.2%
0.0% 0.0% 0.0% 0-7.3% 5.8-26.9% 10.1-10.2% 27.9-35.2%
II 350 mn - 2 bn 0.0% 0.0% 0.0% 0.0% 0.0% 10.0% 45.1%
0.0% 0.0% 0.0% 0.0% 0.0% 10.0-10.3% 11.7-45.1%
IIIA 50 mn - 350 mn 0.0% 0.0% 0.0% 0.0% 6.8% 14.4% 39.9%
IIIB < 50 mn 29.4%
* SKT: Hand-rolled kretek cigarette, SKM: Machine-made kretek cigarette, SPM: White cigarette.
Source: Ministry of Finance
SKM LTLN continues to gain popularity
Our survey indicates that the popularity of SKT continues to decline, from 27% in 2010 to
19% in 2015, while white cigarettes disappear in the popularity stance, which we believe
could be due to pricing. SKM FF's popularity also declined to 35% in 2015 from 39% in
2010, whereas SKM LTLN's popularity surged to 31% in 2015 from 23% in 2010.
SKM LTLN is popular amongst the younger generation and the higher income earners in
outside Java and urban areas. Nevertheless, its popularity surged amongst the low income
earner as well, which can be seen from its popularity increasing from 16% respondents in
2010 to 26% in 2015. Its popularity also shifted from being in Java in 2010 to outside Java in
2015. In 2010, only 14% of the respondents outside Java preferred SKM LTLN, and this
increased to 40% in 2015, and only 13% rural areas in 2010 to 25% in 2015.
Nevertheless, SKM FF is still a go-to cigarette, with it being the most popular with 35%
respondents in 2015. It is preferred amongst all age groups and income level, particularly
the older generation (43%) and the lower and middle income segment (only 29% on the
higher income earners vs 32% on the lower income and 36% on the middle income). SKM
FF is popular in both urban and rural areas (at 35% and 36% respectively) and mostly in
Java (37% vs outside Java at 27%).
SKT cigarettes, on the other hand, have seen their popularity declining to 19% in 2015,
from 27% in 2010. This is due to a couple of reasons (1) the taste is too strong for the new
smokers, (2) SKT's prices have become more expensive (from the tax perspective, though
still cheaper compared to that of SKM) and (3) the cost of manufacturing SKT is also
getting more expensive due to the higher usage of clove and the continuous increase in
labour costs. Our survey indicates that SKT continues to be popular in rural areas (21%)
SKT continues to lose its
popularity
Surging popularity of SKM
LTLN
SKM FF is still the most
popular

05 April 2016
Indonesia Consumer Survey 2016 50
as compared to urban areas (17%), in Java (26%) as compared to outside Java (5%), and
amongst the older generation on the lower income level.
Figure 85: Cigarette consumption by cigarette types
Area Region Age Income*
% of respondents** Total Urban Rural Java Ex Java 18-29 30-45 46-55 56-65 Low Mid High
2015
SKM FF 35 35 36 37 27 33 36 33 43 32 36 29
SKM LTLN 31 35 25 27 40 43 30 19 6 26 33 40
SKT 19 17 21 26 5 10 19 33 36 23 19 18
White 0 0 0 0 0 0 0 0 0 0 0 0
Others 14 13 18 11 27 14 14 15 16 19 12 14
2014
SKM FF 33 34 32 36 27 32 36 32 29 37 35 25
SKM LTLN 28 31 22 24 38 36 25 15 17 27 26 36
SKT 22 20 24 25 8 14 21 33 33 17 21 15
White 6 7 5 7 7 9 4 5 4 10 6 9
Others 12 8 17 7 20 9 13 15 17 8 11 15
2010
SKM FF 39 38 41 41 34 37 40 41 29 44 36 18
SKM LTLN 23 26 13 33 14 33 18 6 10 16 27 26
SKT 27 28 30 17 37 20 32 33 45 27 28 10
White 4 5 2 4 3 4 5 6 0 2 7 13
Others 7 4 14 5 11 6 5 14 15 11 2 33
* Income is on monthly basis—low < Rp1.5mn, mid Rp1.5mn-Rp7.5mn, high > Rp7.5mn.
** SKT: Hand-rolled kretek cigarette, SKM FF: Machine-made full-flavour cigarette, SKM LTLN: Machine-made low-tar low-nicotine cigarette,
SPM: White cigarette.
Source: Credit Suisse Indonesia Consumer Survey 2016
The three largest producers
On the producers' level, HM Sampoerna (HMSP), which is owned by Philip Morris
International, continues to be the leader with 36% popularity, despite coming off from 40%
in 2010 and 43% in 2014, due to the losing popularity of its SKT products (Dji Sam Soe).
However, its SKM LTLN (A-Mild) continues to gain popularity. Sampoerna is liked amongst
the high-income earners (47% of respondents) as its products are premium priced, the
younger generation, in urban areas (38%) and in Java (36%).
The second largest cigarette producer is Gudang Garam (GG), which has been gaining
popularity from 23% in 2010 and 19% in 2014 to 25% in 2015. This is underpinned by the
continuous popularity of its major brand in SKM FF (Surya) and its new penetration in
SKM LTLN (Pro Mild). GG is well liked across all age and generations, particularly the
older generations (39%) and the lower and middle income segment. It is more popular in
urban areas (26%) as compared to rural areas (23%) and outside Java (27%) as
compared to in Java (23%).
The unlisted Djarum maintained its position as the third largest cigarette producer, with
16% respondents in 2015, as compared to 21% respondents in 2010. Djarum is well liked
in rural areas (21% vs urban 12%), with popularity in Java (24%), across all age and
income groups.
Bentoel, which is owned by BAT, maintained its fourth position, while Wismilak was in the
fifth position. The gap between Bentoel and Wismilak as compared to the largest three
continues to be wide and does not seem to be narrowing, due to the tax scheme on the
product.
HMSP is Indonesia's largest
cigarette producer
...followed by Gudang
Garam
And Djarum
With a huge gap with
Bentoel and Wismilak

05 April 2016
Indonesia Consumer Survey 2016 51
Figure 86: Cigarette consumption—by cigarette manufacturer
By cigarette Area Region Age Income*
manufacturer Total Urban Rural Java Ex Java 18-29 30-45 46-55 56-65 Low Mid High
2015
HM Sampoerna 36 38 32 36 29 38 35 37 26 32 36 47
Gudang Garam 25 26 23 23 27 22 25 27 39 22 25 15
Djarum 16 12 21 24 1 14 17 14 16 19 16 18
Bentoel 2 2 1 2 1 3 2 2 0 2 3 0
Wismilak 0 0 1 0 0 0 0 0 2 0 0 0
Others 21 22 22 15 43 24 22 20 17 25 19 20
2014
HM Sampoerna 43 48 36 43 37 47 41 39 38 45 42 53
Gudang Garam 19 21 17 20 27 18 20 23 21 22 20 13
Djarum 19 17 23 24 1 16 21 20 18 19 20 13
Bentoel 2 2 3 3 4 4 1 2 0 2 2 3
Wismilak 0 0 0 0 0 0 0 0 0 0 0 0
Others 16 13 20 10 31 15 16 17 23 12 15 18
2010
HM Sampoerna 40 46 28 36 32 43 40 32 35 25 50 44
Gudang Garam 23 23 25 23 33 19 27 30 17 28 23 18
Djarum 21 19 26 30 1 22 19 19 27 26 16 0
Bentoel 3 3 2 2 5 4 4 2 0 4 3 0
Wismilak 0 0 1 1 1 0 1 0 0 2 0 0
Others 12 9 18 9 27 12 9 17 22 16 8 38
* Income is on monthly basis—low < Rp1.5mn, mid Rp1.5mn-Rp7.5mn, high > Rp7.5mn.
Source: Credit Suisse Indonesia Consumer Survey 2016
Most popular product is A-Mild
A-Mild (SKM LTLN), owned by HMSP, continues to be the most popular product, with its
popularity surging from 14% of respondents in 2010 to 18% in 2015. The product is most
popular amongst the younger generation (42%) and high income earners (30%), outside
Java (23% vs Java 15%) and in urban areas (19% vs rural 16%).
Gudang Garam Surya (SKM FF) is the second most popular product, with its share
increasing from 12% in 2010 to 15% in 2015. It is popular amongst those in urban areas
(16% vs rural areas 13%), outside Java (26% vs in Java 12%), the older generation (43%)
and low and mid-income earners (28%).
Djarum Super (SKM FF) is now the third most popular product, together with Dji Sam Soe
(SKT) by HMSP, with 10% respondents each. The popularity of Djarum Super declined
from 15% respondents and Dji Sam Soe from 17% in 2010. Djarum Super continues to be
popular in the rural area (13% vs urban 8%), in Java (14%), amongst the younger
generations and higher income earners (15% vs low and mid income at 11% each). There
is a shift compared to 2010 where it was most popular with the low and mid income
earners. Dji Sam Soe, on the other hand, is popular in the urban areas (11% vs rural at
9%) and in Java (12%), amongst the older generation (38%) and middle income earners
(11% vs low and high income at 8% each).
GG FIM (SKM FF) is the fifth most popular product, with 9% respondents in 2015, a
decline from 12% in 2010. This is followed by Clas Mild (SKM LTLN) by unlisted Nojorono
with 6% respondents in 2015, up from 4% of respondents in 2010. U-Mild (SKM LTLN),
Sampoerna Hijau (SKT), both by HMSP, and Djarum Coklat (SKT), each have 4%
respondents. The popularity of U-Mild surged from 1% in 2010.
A-Mild is for urban and
younger generation
GG Surya is for the urban
and older generation
Djarum Super and
Sampoerna's Dji Sam Soe
is the third most popular
products
GG FIM is the fifth most
popular product

05 April 2016
Indonesia Consumer Survey 2016 52
Figure 87: Cigarette consumption, by brand
% of respondents Area Region Age Income*
that smoke Total Urban Rural Java Ex Java 18-29 30-45 46-55 56-65 Low Mid High
2015
Sampoerna A Mild 18 19 16 15 23 26 16 8 4 15 18 30
Gudang Garam Surya 15 16 13 12 26 10 17 17 26 13 15 7
Other brands 13 12 17 10 20 12 14 14 17 19 12 12
Djarum Super 10 8 13 14 1 12 11 8 4 11 11 15
Dji Sam Soe 10 11 9 12 5 6 10 18 20 8 11 8
Gudang Garam Filter 9 9 8 10 1 11 7 9 14 9 9 7
Clas Mild 6 6 3 2 19 8 6 4 0 6 5 4
U Mild 4 5 2 4 1 3 5 4 0 2 4 2
Sampoerna Hijau 4 3 5 5 1 2 4 8 2 6 3 7
Djarum Coklat 4 3 6 8 0 2 4 7 10 7 4 3
Star Mild 2 2 1 2 1 2 2 2 0 2 3 0
LA Lights 2 2 1 2 1 2 2 1 2 0 2 2
Pro Mild 1 0 2 2 0 1 1 1 0 1 1 0
Djarum 76 1 0 1 1 0 0 1 0 2 2 0 0
Djarum Black 1 1 1 1 0 1 1 0 0 0 1 0
2014
Sampoerna A Mild 19 21 14 15 24 25 17 8 11 17 18 25
Gudang Garam Surya 12 13 11 11 30 11 12 16 13 16 13 4
Other brands 11 8 15 9 14 8 12 13 17 9 10 15
Djarum Super 14 13 14 16 1 14 16 8 8 16 15 11
Dji Sam Soe 14 15 11 15 6 11 14 18 17 10 14 15
Gudang Garam Filter 7 8 6 9 1 7 8 8 8 6 7 8
Clas Mild 4 4 4 1 13 6 3 2 4 3 4 3
U Mild 5 6 4 0 0 5 5 5 2 7 4 8
Sampoerna Hijau 2 1 4 3 1 1 2 4 6 4 3 0
Djarum Coklat 5 3 8 7 0 3 4 10 10 4 5 0
Star Mild 0 0 0 0 0 0 0 0 0 0 0 0
LA Lights 0 0 0 0 0 0 0 0 0 0 0 0
Pro Mild 0 0 0 0 0 0 0 0 0 0 0 0
Djarum 76 1 1 1 1 0 0 1 2 0 0 0 0
Djarum Black 0 0 0 0 0 0 0 0 0 0 0 2
2010
Sampoerna A Mild 14 16 7 10 17 22 10 2 6 7 18 22
Gudang Garam Surya 12 11 15 11 27 9 14 14 8 17 12 18
Other brands 1 1 2 1 3 1 1 2 0 3 1 0
Djarum Super 15 14 16 19 0 17 14 10 12 15 12 0
Dji Sam Soe 17 20 11 17 12 12 19 22 25 8 20 10
Gudang Garam Filter 12 12 10 13 7 9 13 16 8 10 11 0
Clas Mild 4 5 3 1 19 6 4 2 4 4 5 5
U Mild 1 1 0 1 2 1 1 1 0 0 1 0
Sampoerna Hijau 4 4 8 6 2 4 6 2 4 7 4 0
Djarum Coklat 5 4 9 11 1 4 5 8 11 8 3 0
Star Mild 2 2 2 2 3 3 2 0 0 2 2 0
LA Lights 1 1 1 1 1 1 1 0 0 1 1 0
Pro Mild 0 0 0 0 0 0 0 0 0 0 0 0
Djarum 76 1 1 1 1 0 0 1 1 4 2 1 0
Djarum Black 1 1 0 0 1 1 0 0 0 0 1 0
* Income is on monthly basis—low < Rp1.5mn, mid Rp1.5mn-Rp7.5mn, high > Rp7.5mn.
Source: Credit Suisse Indonesia Consumer Survey 2016

05 April 2016
Indonesia Consumer Survey 2016 53
Personal care products Key stocks
Unilever Indonesia
■ A well known name for household and personal care, with dominance in most of the
categories.
Kino Indonesia
■ Its continuous product innovation, new product launches as well as the expansion of
its distribution network should drive Kino’s growth.
■ In addition, several acquisition and JV plans on Koni's pipeline are expected to
strengthen its position in Indonesia’s personal care and F&B market.
Defensive goods
Spending on personal care is stable at 8% of household spending over the last six years
that we surveyed. The consumption of feminine hygiene continues to be high at 82%
respondents, and the rise of tissue consumption is seen, from 50% respondents in 2010 to
57% in 2015. The consumption of cosmetic and skin care, on the other hand, declined
from 62% respondents in 2010 to 55% in 2015 due to weaker purchasing power, in our
view.
Figure 88: Consumption of personal care products
2015 2014 2010
% of respondents Total Urban Rural Java Ex Java Total Urban Rural Java ExJava Total Urban Rural Java Ex Java
Tissue
in the past 3M 57 64 45 62 46 61 70 45 65 53 50 57 36 53 41
more in the next 3M 35 40 27 42 20 38 44 28 36 43 27 33 16 29 22
Feminine hygiene
in the past 3M 82 82 81 84 77 79 81 73 80 76 81 85 73 83 76
more in the next 3M 48 48 49 53 38 50 50 49 46 58 48 53 37 49 46
Cosmetic and skin care
in the past 3M 55 57 50 58 48 61 63 59 62 60 62 65 57 63 61
in the next 3M 34 35 31 38 22 38 37 39 33 48 37 40 32 38 36
Source: Credit Suisse Indonesia Consumer Survey 2016
Needless to say, the brands that are popular continue to be the Unilever-owned brands.
With an existence in Indonesia for more than eight decades, the brands are unrivalled,
coupled with a strong distribution network. However, despite the popularity of the brands,
due to weaker purchasing power, our survey indicated downtrading to smaller and unkown
brands.
Unilever's Ponds continues to be the most popular with 18% respondents. However, this is
a decline from 24% in 2010. Citra, also owned by Unilever, also saw its popularity
declining to 17% from 19% in 2010. Ponds is the most popular amongst the younger
generation in Java, in urban areas and within the middle and low income earners, while
Citra is popular amongst all age groups and income levels, in rural areas, and outside
Java.

05 April 2016
Indonesia Consumer Survey 2016 54
Figure 89: Cosmetics and skin care consumption, by brand—Unilever products are still dominant
Area Region Age Income*
Total Urban Rural Java Non Java 18-29 30-45 46-55 56-65 Low Mid High
2015
Ponds 18 19 16 25 18 20 17 14 10 24 24 18
Citra 17 16 19 22 28 18 16 15 16 24 23 23
Viva 9 7 12 15 9 5 9 18 19 10 11 7
Lux 8 7 9 11 7 6 7 9 14 8 10 6
Sariayu 6 6 7 10 7 6 6 8 6 7 9 6
Other brands 43 46 37 17 31 44 45 36 34 27 22 40
2014
Ponds 21 22 19 26 20 24 19 15 14 33 39 61
Citra 20 18 23 23 33 20 21 20 14 0 0 0
Viva 10 10 8 9 17 9 10 10 15 9 14 12
Lux 8 6 13 15 3 4 8 13 29 25 17 7
Sariayu 7 6 8 11 4 6 7 9 8 1 1 0
Other brands 35 38 28 16 22 37 34 34 20 33 30 20
2010
Ponds 24 24 22 33 24 30 20 17 13 42 52 69
Citra 19 18 23 23 38 21 17 19 17 0 0 0
Viva 12 11 14 14 18 11 13 12 8 10 12 15
Lux 11 10 14 18 8 6 12 20 18 32 22 8
Sariayu 5 6 4 7 5 3 8 4 5 5 1 0
Other brands 29 32 24 6 8 28 31 28 38 11 13 8
* Income is on monthly basis—low < Rp1.5mn, mid Rp1.5mn-Rp7.5mn, high > Rp7.5mn.
Source: Credit Suisse Indonesia Consumer Survey 2016

05 April 2016
Indonesia Consumer Survey 2016 55
Branded goods Key stocks
Matahari Department Store
■ We believe Matahari will be the main beneficiary on the back of the rising middle class
segment.
■ Its main exclusive label, Nevada, continues to be the top fashion brand favoured by
our respondents. We believe this is due to its nice design and quality supported by its
affordable price points.
Mitra Adiperkasa
■ Post CVC private equity's involvement in MAPI's sports division since May-15, we
have seen positive progress in inventory days and margins pick-up.
■ The impact from higher import duty on fashion products, which clouded MAPI's 2015
margins performance has now been fully passed on. We should see a margin
turnaround coming this year.
Ramayana Lestari Sentosa
■ Being the second largest nationwide department store player in Indonesia, we believe
its SSG has bottomed in 2015 (-3%).
■ This year can be the earnings turnaround after a few years of declining profits, as
Ramayana's price-sensitive low-end customers see better purchasing power from
increased employment, lower inflation and increased government social spending.
Aspiring for premium brands
By and large, we see that the expectation of branded goods consumption will improve in
the next 12 months vs in the past 3 and 12 months. This is especially true for the fashion
segment. Although people did not buy much fashion in the past three months, their
optimism level has improved since last year. People living in Java are especially optimistic
about purchasing new clothes, as the economic recovery in the region became more
visible in 4Q15 while inflation is falling. However, this is not true for people living outside
Java, which is affected by the commodity price decline.
For those who can afford premium brand purchases, the aspiration to purchase Western
brand discretionary consumer goods remains strong in the emerging countries that were
surveyed. In particular, Indonesians are inclined towards wanting to purchase branded
western fashion goods such as leather goods, bags, shoes, sportswear and perfumes.
However, given the affordability, only the higher income earners can afford to buy foreign
branded goods, and most consumers ended up buying domestic products.
Matahari Department Store
is our pick on the rising
middle income class play
Indonesians are always
inclined towards premium
brands

05 April 2016
Indonesia Consumer Survey 2016 56
Figure 90: Consumption of branded goods
2015 2014 2010
% of respondents Total Urban Rural Java Ex Java Total Urban Rural Java Ex Java Total Urban Rural Java Ex Java
Fashion
Purchased in the past 3M 43 49 32 45 39 44 52 29 36 62 63 63 62 66 61
Planning to purchase in 12M 56 61 46 60 45 50 53 43 49 52 77 76 79 80 72
Leather
Purchased in the past 3M 17 20 12 19 12 17 20 11 14 23 n/a n/a n/a n/a n/a
Planning to purchase in 12M 22 24 19 26 13 21 25 14 18 29 n/a n/a n/a n/a n/a
Sport Shoes
Purchased in the past 3M 23 27 15 25 18 16 19 10 14 21 31 34 25 36 21
Planning to purchase in 12M 29 31 23 31 22 24 26 19 21 29 31 35 24 36 20
Jewellery
Purchased in the past 12M 15 18 11 17 12 13 14 11 11 17 16 17 14 18 11
Planning to purchase in 12M 19 21 15 19 17 21 22 20 16 32 18 21 12 20 13
Perfumes
Purchased in the past 12M 47 51 39 50 40 37 43 26 28 59 36 41 27 41 26
Planning to purchase in 12M 50 54 43 55 41 39 45 27 29 61 37 42 28 42 27
Watches
Purchased in the past 12M 19 22 13 18 21 16 20 9 11 28 12 13 9 10 14
Planning to purchase in 12M 21 23 15 20 21 18 21 12 12 32 11 13 8 11 12
Source: Credit Suisse Indonesia Consumer Survey 2016
Figure 91: Except for jewellery, Indonesians always aspired to buy foreign brands when it comes to discretionary
goods…
6-year avg 2015 2014 2013 2012 2011 2010
Fashion Apparel
% planning to buy western brands 44 48 45 50 43 39 36
% planning to buy domestic brands 56 52 55 50 57 61 64
Leather Goods, Bags and Shoes
% planning to buy western brands 50 59 48 63 51 30 n.a.
% planning to buy domestic brands 50 41 52 37 49 70 n.a.
Sports shoes & wear
% planning to buy western brands 69 71 93 78 73 52 49
% planning to buy domestic brands 31 29 7 22 27 48 51
Jewellery
% planning to buy western brands 28 32 47 42 23 10 17
% planning to buy domestic brands 72 68 53 58 77 90 83
Perfumes
% planning to buy western brands 65 55 78 81 73 61 42
% planning to buy domestic brands 35 45 22 19 27 39 58
Source: Credit Suisse Emerging Consumer Survey 2016

05 April 2016
Indonesia Consumer Survey 2016 57
Figure 92: …especially for high income earners
2015 2010
Overall Low Mid High Overall Low Mid High
Fashion Apparel
% planning to buy western brands 47 40 49 52 35 21 33 52
% planning to buy domestic brands 53 60 51 48 65 79 67 48
Leather Goods, Bags and Shoes
% planning to buy western brands 58 52 59 64 n/a n/a n/a n/a
% planning to buy domestic brands 42 48 41 36 n/a n/a n/a n/a
Sports shoes & wear
% planning to buy western brands 64 52 72 70 60 48 49 84
% planning to buy domestic brands 36 48 28 30 40 52 51 16
Jewellery
% planning to buy western brands 29 33 31 21 25 4 19 52
% planning to buy domestic brands 71 67 69 79 75 96 81 48
Perfumes
% planning to buy western brands 58 60 53 62 69 91 43 71
% planning to buy domestic brands 42 40 47 38 31 9 57 29
Source: Credit Suisse Emerging Consumer Survey 2016
Fashion
The popularity of Matahari's private label, Nevada, has been growing from only 10%
respondents favouring the brand for their next fashion apparel purchase in 2010 to 27%
over a span of five years. Nevada is favoured across Indonesian consumers regardless of
location, age profile and income segment. Thanks to its domestic sourcing, Matahari's
product price increase is more tolerable than peers who import. During the weak Rupiah
period, we believe this is one of the reasons that respondents favour Nevada compared to
imported brands.
Zara, one of MAPI's most famous brands, launched first in 2005, is the second most
appealing fashion brand for respondents' next purchase. Over the past five years, its
brand loyalty has increased from 1% to 6% respondents wanting to purchase Zara
products over the next 12 months period. We believe this is also in line with Indonesia's
rising middle-upper consumer class over the years.
Nevada remains on the top
of both customers' wish list
and 'worth-it' list in the past
five years, even gaining
more popularity

05 April 2016
Indonesia Consumer Survey 2016 58
Figure 93: Which brand of fashion apparel will you purchase in the next 12 months?
Area Region Age Income*
% of respondents Total Urban Rural Java Ex Java 18-29 30-45 46-55 56-65 Low Mid High
2015
Nevada 27 27 28 28 22 25 28 27 29 27 27 25
Zara 6 6 5 6 4 6 5 6 2 3 6 5
Guess 4 4 4 4 4 5 4 3 1 3 4 3
Gucci 5 5 4 4 6 5 5 2 3 4 4 8
Polo Ralph Lauren 4 5 2 4 3 4 4 3 3 3 4 5
Calvin Klein 4 5 2 3 5 4 5 3 1 4 4 0
Unbranded 20 17 30 23 17 17 21 26 29 24 20 18
Others 32 33 25 28 38 34 29 31 30 32 31 36
2014
Nevada 14 14 13 15 10 14 13 16 6 3 15 6
Zara 8 8 6 6 9 10 5 3 8 6 6 12
Guess 7 7 7 6 8 8 6 4 6 4 7 3
Gucci 6 5 9 6 7 8 6 6 2 7 7 2
Polo Ralph Lauren 5 5 4 6 2 6 4 4 3 3 6 2
Hammer 4 4 4 5 1 5 4 4 2 1 5 1
Calvin Klein 4 5 2 4 5 5 4 3 2 1 4 8
Unbranded 17 16 20 16 22 11 19 26 40 22 18 16
Others 36 36 36 35 37 34 39 33 32 53 32 50
2010
Nevada 10 11 6 8 15 12 9 7 3 6 11 8
Zara 1 2 0 1 1 1 1 1 - 1 1 3
Guess 4 5 1 4 3 4 3 5 5 3 4 6
Gucci 4 5 3 4 3 5 2 3 7 1 5 9
Polo Ralph Lauren 3 4 4 3 5 3 4 3 2 3 4 5
Hammer 2 2 2 2 2 2 2 3 - 1 3 3
Calvin Klein 2 3 2 2 3 3 2 2 3 2 3 0
Unbranded 47 40 63 54 36 40 51 52 65 61 44 25
Others 26 28 20 22 32 30 25 24 16 22 26 41
* Income is on monthly basis—low < Rp1.5mn, mid Rp1.5mn-Rp7.5mn, high > Rp7.5mn.
Source: Credit Suisse Indonesia Consumer Survey 2016

05 April 2016
Indonesia Consumer Survey 2016 59
Figure 94: In your opinion, are any of the following brands worth paying more for?
Area Region Age Income*
% of respondents Total Urban Rural Java Ex Java 18-29 30-45 46-55 56-65 Low Mid High
2015
Nevada 21 21 22 22 18 20 21 25 24 22 21 18
Zara 4 4 5 5 3 6 3 3 3 6 5 3
Guess 5 5 5 6 5 6 5 4 6 7 5 8
Gucci 6 6 7 7 5 6 7 6 4 5 6 9
Polo Ralph Lauren 4 5 3 5 5 4 5 3 6 5 5 4
Calvin Klein 6 6 5 5 6 7 5 4 4 5 6 4
Unbranded 5 3 12 6 6 4 5 9 7 9 5 5
None/Don't know 7 7 10 5 18 6 8 11 11 11 7 8
Others 40 41 26 37 34 38 40 32 32 26 39 42
2014
Nevada 9 7 13 10 8 8 11 8 3 5 10 1
Zara 5 5 6 4 7 9 2 6 2 10 4 9
Guess 8 9 6 7 9 9 8 9 3 7 8 3
Gucci 7 7 10 8 7 9 6 9 6 10 8 4
Polo Ralph Lauren 7 7 7 9 3 6 7 8 7 0 8 2
Calvin Klein 5 6 1 4 4 5 5 3 3 2 4 7
Unbranded 5 4 8 6 5 4 5 9 10 10 5 2
None/Don't know 11 8 19 11 14 9 12 10 30 22 9 28
Others 43 47 30 40 43 41 44 39 36 34 44 42
2010
Nevada 9 10 8 7 12 10 9 8 5 8 9 5
Zara 1 1 1 1 1 1 1 1 - 1 1 1
Guess 4 4 5 4 4 5 4 3 5 4 4 3
Gucci 6 6 6 5 7 6 6 5 2 5 6 5
Polo Ralph Lauren 4 4 4 3 5 4 4 4 2 4 4 5
Calvin Klein 5 6 3 4 6 6 4 2 5 5 5 1
Unbranded 9 7 14 13 3 8 10 10 11 18 8 8
None/Don't know 32 30 36 39 23 28 34 32 47 36 31 53
Others 30 33 23 24 39 33 27 33 25 19 32 18
* Income is on monthly basis—low < Rp1.5mn, mid Rp1.5mn-Rp7.5mn, high > Rp7.5mn.
Source: Credit Suisse Indonesia Consumer Survey 2016
Sports shoes and wear
Indonesian consumers continue to favour buying western brands in the sport shoes and
wear categories. Adidas, Nike and Reebok are among the consistently leading brands
over the past five years, although in 2015 they lost market share to Bata and some other
brands which we suspect were of cheaper price points. MAPI distributes Adidas, Nike,
Reebok and up to 40 other foreign sport brands through its sports concept stores (i.e.
Sports Station, Planet Sports, Golf House and The Athlete's Foot) as well as in
department stores (including Sogo, and also consignment in Matahari, and Ramayana).
Bata eroded some of Nike's
and Adidas' market share
due to a slow economy in
2015

05 April 2016
Indonesia Consumer Survey 2016 60
Figure 95: Which brand of fashion apparel will you purchase in the next 12 months?
Area Region Age Income*
% of respondents Total Urban Rural Java Ex Java 18-29 30-45 46-55 56-65 Low Mid High
2015
Adidas 24 24 24 24 23 26 23 19 23 27 23 33
Nike 17 18 15 17 13 19 16 14 11 16 18 8
Bata 11 11 13 11 14 8 11 16 26 13 12 2
Reebok 6 6 7 7 5 7 6 6 8 2 6 5
Unbranded 9 6 17 13 14 7 11 10 4 14 8 4
Others 32 35 24 29 31 33 32 34 29 27 32 48
2014
Adidas 37 35 44 42 29 36 39 40 13 35 41 29
Nike 23 23 21 21 20 26 20 17 25 25 23 17
Bata 0 0 0 0 0 0 0 0 0 0 0 0
Reebok 8 9 5 7 5 7 11 8 0 4 8 14
Unbranded 6 8 1 2 9 5 8 2 25 4 7 5
Others 26 26 29 28 37 26 23 34 38 32 21 35
2010
Adidas 17 17 14 15 29 16 17 18 15 22 14 65
Nike 9 10 7 7 5 11 7 9 7 8 9 6
Bata 10 11 7 7 12 7 12 15 21 9 12 0
Reebok 4 5 2 3 3 5 2 5 0 3 4 0
Unbranded 30 25 43 35 15 27 35 21 36 28 24 7
Others 29 32 27 33 36 34 27 32 21 30 37 23
* Income is on monthly basis—low < Rp1.5mn, mid Rp1.5mn-Rp7.5mn, high > Rp7.5mn.
Source: Credit Suisse Indonesia Consumer Survey 2016
Figure 96: In your opinion, are any of the following brands worth paying more for?
Area Region Age Income*
% of respondents Total Urban Rural Java Ex Java 18-29 30-45 46-55 56-65 Low Mid High
2015
Adidas 20 20 21 23 18 19 22 19 18 20 21 24
Nike 17 18 14 18 14 17 18 14 21 12 18 19
Bata 6 6 10 7 7 6 6 8 15 10 6 6
Reebok 9 9 7 10 6 7 9 12 15 10 9 11
Unbranded 3 1 7 2 7 1 4 6 0 7 2 2
Others 45 46 40 39 47 50 41 42 30 40 44 38
2014
Adidas 36 33 46 40 32 32 40 36 37 34 37 27
Nike 22 22 23 26 18 26 21 19 0 25 23 18
Bata 0 0 0 0 0 0 0 0 0 0 0 0
Reebok 8 9 4 9 6 8 9 6 13 7 8 6
Unbranded 1 2 0 1 1 1 1 1 0 0 1 1
Others 32 34 26 25 42 34 30 38 50 35 31 47
2010
Adidas 17 18 13 16 18 18 18 16 0 13 18 8
Nike 8 8 8 6 10 10 7 5 0 5 8 3
Bata 5 5 6 4 7 4 5 8 8 5 5 0
Reebok 7 8 5 5 10 8 6 6 0 6 7 7
Unbranded 7 5 12 11 1 6 5 14 17 13 5 13
Others 56 57 57 58 54 55 59 50 75 58 56 69
* Income is on monthly basis—low < Rp1.5mn, mid Rp1.5mn-Rp7.5mn, high > Rp7.5mn.
Source: Credit Suisse Indonesia Consumer Survey 2016

05 April 2016
Indonesia Consumer Survey 2016 61
Internet and e-commerce Indonesia's internet penetration has risen to 48% of our surveyed respondents compared
to only 14% five years ago—thanks to its smartphone devices. When asked about the
services that respondents have used on the internet over the last six months, social
network appeared to be the most used by Indonesians (92%), followed by instant
messaging (57%) and gaming (39%).
Interestingly, the proportion of online shopping behaviour has increased to 26% in 2015
from only 7% five years ago. Notably, we saw internet purchase activities triple among
rural areas and the low-income segment population, and doubled among outside Java
residents in just one year.
Figure 97: Indonesia's internet access has been rising… Figure 98: …although still one of the lowest in the region
14 15
9
28
38
48
-
10
20
30
40
50
60
2010 2011 2012 2013 2014 2015
30%31%
49%49%50%
58%60%
71%84%85%
87%87%88%
91%92%92%93%93%94%94%95%96%96%96%
0% 20% 40% 60% 80% 100%
IndiaIndonesia
South AfricaMexicoChinaBrazil
TurkeyRussiaFrance
BelgiumSwitzerland
USAGermany
JapanUK
South KoreaCanada
AustraliaFinland
New ZealandSweden
NetherlandsDenmark
Norway
Source: Credit Suisse Indonesia Consumer Survey 2016 Source: Credit Suisse Emerging Consumer Survey 2016
Figure 99: Internet accessibility (2015) Figure 100: Internet accessibility (2013)
Yes - via PC/Computer
10%
Yes - via Mobile/Smartph
one84%
Yes - via tablet6%
Yes - via PC/Computer
28%
Yes - via Mobile/Smartph
one69%
Yes - via tablet3%
Source: Credit Suisse Indonesia Consumer Survey 2016 Source: Credit Suisse Indonesia Consumer Survey 2016
Indonesia's internet access
is largely driven by
smartphone penetration

05 April 2016
Indonesia Consumer Survey 2016 62
Figure 101: What services have you used on the internet in the last six months?
Area Region Age Income*
% of respondents Total Urban Rural Java Ex Java 18-29 30-45 46-55 56-65 Low Mid High
2015
Social network 92 91 94 92 92 94 89 79 83 86 91 97
Instant messaging 57 59 50 61 41 57 57 53 67 56 58 54
Gaming 39 42 30 38 33 42 36 24 33 30 40 40
Shopping 26 29 18 24 25 26 27 15 50 21 26 37
Banking 10 11 8 11 6 8 11 18 50 2 10 15
Travel 9 9 8 9 9 8 12 6 17 7 8 10
Nothing of the above 2 2 1 1 3 1 3 3 0 2 2 0
2014
Social network 92 91 94 93 94 95 89 78 50 96 91 96
Instant messaging 46 46 43 48 26 50 40 34 33 38 46 41
Gaming 29 30 22 22 37 30 26 19 67 22 27 38
Shopping 11 13 6 10 7 11 13 9 17 6 12 18
Banking 7 6 7 6 4 5 8 9 0 0 6 9
Travel 5 5 4 5 2 4 6 3 0 2 4 14
Nothing of the above 2 3 1 1 3 2 2 6 17 5 3 1
2010
Social network 88 88 88 89 91 93 75 67 100 90 89 67
Instant messaging 48 47 54 42 57 45 59 33 0 56 47 58
Gaming 36 36 38 43 43 40 31 0 0 32 37 17
Shopping 7 7 4 6 5 7 6 0 0 0 8 8
Banking 5 6 0 4 2 3 10 17 0 0 7 0
Travel 5 6 0 3 2 3 6 33 0 3 5 17
* Income is on monthly basis—low < Rp1.5mn, mid Rp1.5mn-Rp7.5mn, high > Rp7.5mn.
Source: Credit Suisse Indonesia Consumer Survey 2016
Indonesia is behind China, India and Brazil on online shopping activities among other
emerging markets. To put things in perspective, compared to China's 15% online retail
penetration and $490 online spending per capita, Indonesia's penetration is below 2% and
only $13 spending on a per capita basis.
Figure 102: Indonesia is an underpenetrated market…
Online retail as % of total retail
Figure 103: …on online retailing
Online spending per capita ($)
0% 5% 10% 15% 20%
Mexico
Indonesia
India
Italy
Brazil
Spain
France
Australia
Japan
Germany
World
US
South Korea
UK
China
2015 2014
1148
935
813738
657 656646614
557497493
244
155143117 9847
13 11
0
200
400
600
800
1000
1200
UK
US
Aus
Ger
man
y
Sou
th K
orea
Fra
nce
Can
ada
Sw
eden
Japa
n
Net
herla
nds
Chi
na
Spa
in
Pol
and
Italy
russ
ia
Bra
zil
Mex
ico
Indo
nesi
a
Indi
a
Source: eMarketer, Credit Suisse research Source: eMarketer, Statista, retailresearch, Thomson Reuters,
Worldbank, Credit Suisse research

05 April 2016
Indonesia Consumer Survey 2016 63
Figure 104: Indonesians are heavy social media users, but in the middle of the pack in terms of online shopping
-
5
10
15
20
25
30
35
40
45
50
Mexico Indonesia South Africa Turkey Russia Brazil Saudi Brazil India China
Social network Instant messaging Gaming Shopping Banking Travel Other
Source: Credit Suisse Indonesia Consumer Survey 2016
In general, 68% Indonesian respondents believe that their internet purchase behaviour will
continue to be the same. However, the proportion of respondents who think they will do
more online shopping increased from only 12% five years ago to 23% in 2015. We believe
this is on the back of the emergence of more e-commerce players that have been doing
aggressive advertising and promotions to attract customers.
Figure 105: How do you think your purchasing on the internet is likely to change in the next six months?
Area Region Age Income*
% of respondents Total Urban Rural Java Ex Java 18-29 30-45 46-55 56-65 Low Mid High
2015
More 23 24 21 22 28 22 25 24 33 12 24 26
The same 68 67 71 69 65 69 67 70 33 67 67 72
Less 9 9 8 9 7 9 8 6 33 20 9 2
2014
More 20 21 13 21 15 21 19 6 33 5 19 28
The same 68 68 71 67 72 68 66 91 50 87 69 56
Less 12 11 16 12 13 11 15 3 17 8 12 16
2010
More 12 13 4 9 19 14 6 0 0 21 10 10
The same 78 79 73 83 69 79 78 83 100 61 82 80
Less 10 8 23 8 13 7 16 17 0 18 8 10
* Income is on monthly basis—low < Rp1.5mn, mid Rp1.5mn-Rp7.5mn, high > Rp7.5mn.
Source: Credit Suisse Indonesia Consumer Survey 2016
Lazada and OLX are among the most used websites for online shopping, with 23%
respondents having used them in the past 12 months. Lazada is more popular across the
middle to high income segments, while OLX appeals more tow the lower income
consumers. They are followed by Tokopedia (16%) and Zalora (8%). Lippo Group's
MatahariMall was used by 1% of our survey respondents as the website was only
launched officially in Sep-15.
Lazada, high income
earners' favourite, and OLX,
low income earners'
favourite, are the two most
popular websites

05 April 2016
Indonesia Consumer Survey 2016 64
Figure 106: Have you used any of the following e-commerce websites in the past 12 months? (%)
Area Region Age Income*
% of respondents Total Urban Rural Java Ex Java 18-29 30-45 46-55 56-65 Low Mid High
OLX 23 23 28 24 21 27 19 20 17 42 23 18
Lazada 23 22 25 23 26 21 25 20 50 14 22 32
Tokopedia 16 16 15 18 10 16 16 20 17 10 17 11
Bukalapak 10 11 6 10 10 10 12 0 0 11 10 8
Zalora 8 8 5 7 9 9 6 0 17 14 7 13
Traveloka 7 7 10 7 6 5 10 0 0 0 8 2
BliBli 5 4 9 4 7 3 8 0 0 0 5 8
Others 3 3 2 2 5 3 2 20 0 0 3 0
Elevenia 2 3 0 2 3 3 1 20 0 4 2 0
BerryBenka 1 1 0 0 2 1 0 0 0 4 0 2
Mataharimall 1 0 2 1 0 0 2 0 0 0 0 5
Tiket.com 1 1 0 1 1 1 1 0 0 0 1 0
VIP Plaza 0 0 0 0 1 0 0 0 0 0 0 0
* Income is on monthly basis—low < Rp1.5mn, mid Rp1.5mn-Rp7.5mn, high > Rp7.5mn.
Source: Credit Suisse Indonesia Consumer Survey 2016
In general, customers prefer a trustworthy website while conducting their online purchase.
This is especially true for the older generations (above 40 years old). Some also choose a
website based on the comprehensiveness of the product listings. For the lower income
group, cheaper price is also one of the dominant factors to consider.
Figure 107: Reasons to choose the mentioned websites (%)
Area Region Age Income*
% of respondents Total Urban Rural Java Ex Java 18-29 30-45 46-55 56-65 Low Mid High
2015
Trustworthiness 37 37 36 38 36 35 41 40 33 30 37 47
Comprehensiveness 30 30 29 31 27 31 28 40 0 20 31 23
Low cost 14 14 18 15 13 16 13 0 0 20 15 6
Well-known brand 10 10 11 13 4 9 11 0 33 10 11 6
Friends referral 6 7 4 4 12 6 5 20 33 10 5 18
Others 2 2 4 0 8 3 2 0 0 10 2 0
* Income is on monthly basis—low < Rp1.5mn, mid Rp1.5mn-Rp7.5mn, high > Rp7.5mn.
Source: Credit Suisse Indonesia Consumer Survey 2016
Figure 108: With the exception of Russia, emerging consumers remained focused on a
site's trustworthiness
1219
12
3023
159
17 14
44
50
49
37
34
10
34
4443
33 1119
1424
48
26
16 24
312 14 10 9
5 16
21 11
3 6 66 7
1810
26
5 1 2 3 4 5 2
0
10
20
30
40
50
60
70
80
90
100
Brazil China India Indonesia Mexico Russia South Africa Saudi Arabia Turkey
%
Comprehensive products listings Trustworthiness Low cost Well known brand Friends referral Others
Source: Credit Suisse Emerging Consumer Survey 2016

05 April 2016
Indonesia Consumer Survey 2016 65
Mobile phones Key stocks
Link Net (LINK.JK, Rp4,035.00, OUTPERFORM, TP Rp8,300.00)
■ Fixed internet access is also undergoing something of a renaissance in Indonesia, as
demand for access to high-speed content and gaming increases. Thus, it is still our
view that there is plenty of room for growth in the Indonesian broadband market.
■ We believe that as the market develops, competitors will learn to target their rollouts in
greenfield areas which are not yet covered by an existing player (such as Link Net),
since this will result in a much higher return on their investment. Link Net offers high
growth and high return on invested capital, and therefore offers an attractive way to
invest in rising fixed internet penetration in Indonesia.
Telkom (TLKM.JK, Rp3,350.00, OUTPERFORM, TP Rp3,800.00)
■ Indonesia’s cellular market continues to look attractive, with good monetisation of very
high demand for cellular data services (driven by social networking). This has been
made possible by an improving competitive environment, as the industry consolidates
towards a three-player market.
■ There is still a long way to go in growing data volume; smartphone penetration on
Telkomsel's network reached just 40.4% as at December 2015. In addition, 4G launch
can add further impetus to this improving monetisation, with an additional 40% uplift in
ARPU from 3G to 4G currently being experienced.
Tiphone Mobile Indonesia (TELE.JK, Rp775, OUTPERFORM, TP Rp900)
■ As the largest prepaid mobile phone voucher distributor in Indonesia, Tiphone Mobile
Indonesia is a beneficiary of higher data service consumption from rising internet
access needs.
■ Telkomsel owns a 25% stake (effective Sep-14) in the company, and thus it is now an
exclusive distributor for Telkomsel, a market leader in Indonesia’s telecom industry
(30% market share in Telkomsel distribution). It is the only dealer who distributes
through three diversified channels (traditional, modern retail, and banks.
Erajaya Swasembada
■ Different to TELE’s stable mobile phone vouchers business (70% of sales), Erajaya's
business is more concentrated in handset distribution, accounting for ~90% of sales.
■ ERAA saw its 2015 performance clouded by slower handset sales amidst weak
Rupiah and the clearance of its aging handset inventory hurting the company's
margins. We wait to see an improvement in margins as the company claims that
inventory is now in a healthier position.
Rising smartphone penetration
Of 87% mobile phone users in Indonesia, almost half (48%) are on smartphones,
compared to only 9% five years ago. We believe this is due to smartphones getting more
affordable, with the influx of cheap smartphones from China and Taiwan. Smartphones are
one of the items that have continued to be bought by consumers over the years regardless
of Indonesia's economic cycle. Despite the rising penetration, 61% of our survey
respondents are planning to upgrade to a smartphone in the next 12 months. This is up
from only 37% in 2010.
Tiphone Indonesia is one of
our top picks to ride the
improving low-end and
rising data consumption

05 April 2016
Indonesia Consumer Survey 2016 66
Figure 109: Rising internet access through smartphones
Age Income*
% of respondents Total Urban Rural Java Ex Java 18-29 30-45 46-55 56-65 Low Mid High
2015
Mobile phone ownership 87 92 77 86 88 96 87 78 58 73 90 80
Smart phone ownership 48 56 32 51 40 70 45 20 15 32 52 56
Bought handset in last 12M? 43 44 40 42 44 47 38 33 22 40 43 46
Upgrade to smartphone? 61 53 72 65 52 70 61 58 31 50 62 64
Access to internet 48 56 32 49 44 75 42 17 6 32 49 58
2014
Mobile phone ownership 84 90 70 84 83 92 85 70 58 81 83 86
Smart phone ownership 34 41 19 35 30 50 28 19 9 24 34 39
Bought handset in last 12M? 40 43 32 41 38 47 38 33 22 44 41 34
Upgrade to smartphone? 55 57 51 55 54 70 52 33 12 47 53 71
Access to internet 38 47 20 41 31 58 27 13 6 28 37 52
2010
Mobile phone ownership 67 76 50 67 68 80 66 54 35 46 74 91
Smart phone ownership 9 11 5 8 9 11 9 3 5 5 9 35
Bought handset in last 12M? 44 46 40 46 41 47 43 45 33 37 45 76
Upgrade to smartphone? 37 39 31 37 38 48 28 28 13 27 39 38
Access to internet 14 18 5 13 14 14 26 8 3 7 15 37
* Income is on monthly basis—low < Rp1.5mn, mid Rp1.5mn-Rp7.5mn, high > Rp7.5mn.
Source: Credit Suisse Indonesia Consumer Survey 2016
Samsung remains the leading mobile phone brand
Samsung has been leading the handset industry among Indonesian consumers, with 50%
of our respondents wanting to buy the brand as their next handset purchase. This is
different from 2010 where Nokia was pretty much at 70% market share and 2012 where
Blackberry peaked around 30%; an evidence of how dynamic the handset market is.
Samsung continues to be favoured across Indonesia, by different age and income level
consumers owing to its wide product range from low-to-high end, in our view. Samsung
also continues to be the leading international hardware brand in emerging markets,
especially in the smartphones category.
Samsung essentially drove
Nokia out of the market

05 April 2016
Indonesia Consumer Survey 2016 67
Figure 110: Future preference of mobile phone brands
Age Income*
% of respondents Total Urban Rural Java Ex Java 18-29 30-45 46-55 56-65 Low Mid High
2015
Nokia 13 11 18 10 21 4 17 24 42 23 13 8
Cross 3 2 5 4 0 3 4 2 6 2 3 1
Blackberry 3 3 2 3 2 3 2 5 0 2 3 2
Samsung 50 52 47 49 50 52 50 45 33 48 50 62
Mito 1 1 1 1 2 0 1 1 6 3 1 0
Apple 7 8 3 6 9 10 5 1 3 1 7 10
Others 24 23 23 27 16 28 22 23 9 21 24 17
2014
Nokia 18 14 28 15 25 10 22 24 44 15 19 15
Cross 2 2 2 2 2 2 2 1 3 0 2 1
Blackberry 8 8 8 8 7 8 7 8 6 13 8 6
Samsung 46 50 35 47 42 51 44 38 21 36 45 51
Mito 1 2 1 1 2 2 1 2 0 0 1 4
Apple 5 6 2 5 4 7 3 3 0 5 4 10
Others 20 18 24 23 18 20 21 24 26 31 21 13
2010
Nokia 70 69 71 66 79 65 71 79 79 73 68 83
Cross 0 0 0 0 0 0 0 0 0 0 0 0
Blackberry 11 14 6 12 9 14 10 10 0 11 12 17
Samsung 2 3 1 2 2 2 2 4 0 1 2 0
Mito 0 0 0 0 0 0 0 0 0 0 0 0
Apple 1 1 0 0 0 1 1 0 0 0 1 0
Others 16 13 22 18 10 18 16 7 21 15 17 0
* Income is on monthly basis—low < Rp1.5mn, mid Rp1.5mn-Rp7.5mn, high > Rp7.5mn.
Source: Credit Suisse Indonesia Consumer Survey 2016
Figure 111: Samsung is No.1 in terms of brand preference
Brazil China India Indonesia Mexico Russia Saudi Arabia South Africa Turkey
Smartphones
2015 Samsung Apple Samsung Samsung Samsung Samsung Apple Samsung Samsung
2014 Samsung Apple Samsung Samsung Samsung Samsung Samsung Nokia Samsung
PCs
2015 Samsung Apple Samsung Samsung Acer Samsung Apple Samsung Samsung/Apple
2014 Samsung Apple DELL Samsung Samsung Samsung Samsung Nokia Samsung
Source: Credit Suisse Indonesia Consumer Survey 2016
The era of smartphones and LCD TVs
Smartphones were the most sought after electronic items by Indonesian consumers since
last year, and continue to be on the top wish list, replacing basic mobile phones five years
ago. On the customers' wish list for other electronic purchases in the next 12 months, LCD
TV is second most sought item, as opposed to traditional TV in 2010.
Excluding smartphones,
LCD TVs are Indonesians'
favourite electronic
purchase

05 April 2016
Indonesia Consumer Survey 2016 68
Figure 112: Which of the following products/services have
you purchased in the last 12M? (2015)
Figure 113: Which of the following products/services have
you purchased in the last 12M? (2010)
Smartphone26%
Mobile Phone (Basic)14%
DVD Player12%
LCD TV11%
Traditional TV9%
Notebook PC5%
Tablet5%
Flat screen TV4%
Desktop computer
1%Gaming facility1%
Netbook1%
Smartphone5%
Mobile Phone (Basic)39%
DVD Player20%
LCD TV3%
Traditional TV13%
Notebook PC4%
Tablet0%
Flat screen TV5%
Desktop computer
3%
Gaming facility3%
Netbook1%
Source: Credit Suisse Indonesia Consumer Survey 2016 Source: Credit Suisse Indonesia Consumer Survey 2016
Figure 114: Which of the following products/services are
you most likely to purchase in the next 12M? (2015)
Figure 115: Which of the following products/services are
you most likely to purchase in the next 12M? (2010)
Smartphone26%
LCD TV21%
Notebook PC9%
Digital Camera6%
DVD Player6%
Mobile Phone (Basic)
6%
Flat screen TV6%
Tablet6%
Desktop computer
3%
Traditional TV3% Gaming facility
2%
Internet Service (Broadband /
Dial Up)2% MP3
1%
Netbook1%
Smartphone 10%
LCD TV10%
Notebook PC10%
Digital Camera2%
DVD Player10%Mobile Phone
(Basic)26%
Flat screen TV6%
Tablet0%
Desktop computer
6%
Traditional TV12%
Gaming facility2%
Internet Service (Broadband /
Dial Up)2%
MP32%
Netbook2%
Source: Credit Suisse Indonesia Consumer Survey 2016 Source: Credit Suisse Indonesia Consumer Survey 2016

05 April 2016
Indonesia Consumer Survey 2016 69
Healthcare Key stocks
Siloam International Hospital
■ We expect Siloam's top-line growth to continue with its pipeline expansion plans and
the increase in healthcare spend as a percentage of total spend. By 2017, Siloam
targets to achieve 10,000 beds from the current 4,800 and have over 50 hospitals in
more than 25 cities.
■ We believe in the medium term, Siloam could be the best play to leverage on the
healthcare under-penetration story in Indonesia as it builds a hospital network
unrivalled in scope and scale across Indonesia. Margin issues are likely to be short
lived.
Mitra Hospital
■ Mitra stands out as one of the best-run hospital operators in the region on almost all
efficiency and profitability measures. Its management has an almost impeccable track
record of delivering optimal profitability at mature hospitals as well as incubating new
hospitals.
■ Mitra's uncompromising focus on more profitable locations, conservative greenfield
expansion pipeline and reluctance to offer BPJS services, among others, has ensured
a steady and profitable growth profile.
Kalbe Farma
■ The pharma division is facing a challenge on adapting with the GoI's available health
care scheme as consumers downtrade from branded generic.
■ Nutritionals division is now the largest contributor to revenue and will continue to grow.
The lower skim milk prices should help expand margin.
Availability of Jamkesnas reduces healthcare
spending
Indonesians spending on healthcare are below our overaLl average survey. Compared to
2010, spending on healthcare declined from 7% to 6% in 2015. We believe this was due to
the availability of the Universal Health Care program (Jamkesnas—Jaminas Kesehatan
Nasional), administered by BPJS Kesehatan, that started on 1 Jan 2014. The target is that
by 1 Jan 2019, all of Indonesia will participate in the programme and have access to
healthcare. As of 25 Mar 2016, there are 164.1 mn Indonesians registered for the
programme, or around 64% of total population. As of 1 Mar 2016, there are 1,749
hospitals participating in the programme, as well as 9,811 facility health centres
(Puskesmas), 4,760 clinics, 4,441 doctors, 1,150 dentists, and 907 optics with 1,876
drugstores.
Our survey indicates that the access to state healthcare improved from 34% in 2010 to
41% in 2015, both in the urban and rural areas. Those outside Java have better access to
state health care as compared to those in Java, which we believe could be due to lesser
availability of private healthcare in the area.
As such, Indonesians do not expect to pay more on medicines, as 67% respondents are
expecting to pay a similar amount, down from 74% respondents in 2014, and 31%
respondents expecting to pay less, up from 23% in 2014. This is also due to the
expectation that the GoI is going to put a capped price on branded generics, while the
Around 64% of Indonesians
are participating in the
Jamkesnas programME
Improved access to state
healthcare
Expecting to pay less for
medicine

05 April 2016
Indonesia Consumer Survey 2016 70
price of generic drugs has been unchanged since 2011. Therefore, Indonesians are also
unwilling to pay extra for international brands as compared to locally produced brands.
Figure 116: Access to state healthcare has improved
4143
38 37
50
45
48
37 38
61
34 3533
27
51
0
10
20
30
40
50
60
70
Total Urban Rural Java Ex Java Total Urban Rural Java Ex Java Total Urban Rural Java Ex Java
2015 2014 2010
Source: Credit Suisse Indonesia Consumer Survey 2016
Figure 117: Lesser expectation to spend more on medicine over the next 12 months
2 2 1 2 2 2 2 3 15
67 67 6870
61
7471
80
72
79
31 31 3128
37
2327
17
26
17
0
10
20
30
40
50
60
70
80
90
Total Urban Rural Java Ex Java Total Urban Rural Java Ex Java
More Same Less
20142015
Source: Credit Suisse Indonesia Consumer Survey 2016

05 April 2016
Indonesia Consumer Survey 2016 71
Figure 118: International medicine brand vs locally produced product
Paying extra? Total Less than
Rp1,000k
Rp1,000k -
1,500k
Rp1,500k
- 2,000k
Rp2,000k
- 3,000k
Rp3,000k
- 5,000k
Rp5,000k -
7,500k
Rp7,500k -
10,000k
Rp10,000k
- 15,000k
Above
15,000k
Would prefer
not to answer
Not prepared 72 85 79 73 73 66 66 71 65 80 80
1-10% extra 23 12 18 22 21 29 25 24 18 12 0
11-20% extra 5 0 1 5 6 4 7 4 18 0 20
21-30% extra 1 3 1 0 0 0 0 0 0 8 0
> 30% extra 0 0 1 0 0 0 1 0 0 0 0
Source: Credit Suisse Indonesia Consumer Survey 2016

05 April 2016
Indonesia Consumer Survey 2016 72
Property Key stocks
We like those stocks that are less exposed to foreign debt, have a good track record, a
large low-cost land-bank, and those that are conservative and strategically positioned. We
also like companies with a sizeable recurring income when earnings visibility is not too
high.
Summarecon Agung
■ It has a good track record in township development in Indonesia and has been
successful in strengthening recurring income through rental income from retail spaces.
■ Around 70% of SMRA’s operating income is still being generated from the property
development segment. Additionally, we like the name given its exposure to medium
segment as well as its diversified land bank.
Bumi Serpong Damai
■ It has unmatched access to a vast, strategically located landbank which comes with
better pricing control as well as a relatively healthier balance sheet.
Pakuwon Jati
■ It has a sizeable recurring income when earnings visibility is not so high. As of 3Q15,
48% of PWON's income was recurring, >80% of which came from retail malls.
■ We expect recurring income to see 28% CAGR over 2015-17E, thanks to rental
income from malls as more than 50% of net leasable area (NLA) is due for rental
reversion before 2018. On top of that, 134k sq m of new NLA is expected to come by
2017E.
Figure 119: Developers' quarterly pre-sales progression
-
500
1,000
1,500
2,000
2,500
3,000
3,500
4,000
4Q
11
1Q
12
2Q
12
3Q
12
4Q
12
1Q
13
2Q
13
3Q
13
4Q
13
1Q
14
2Q
14
3Q
14
4Q
14
1Q
15
2Q
15
3Q
15
4Q
15
(Rp bn)
SMRA ASRI CTRA BSDE
Source: Company data, Credit Suisse
Good track record on
township development is
key for SMRA
BSDE has unmatched
access to a low-cost land
bank
As of 3Q15, 48% of
PWON's income was
recurring, >80% of which
came from retail malls
We expect overall
aggregate pre-sales to see
12% CAGR over the next
two years

05 April 2016
Indonesia Consumer Survey 2016 73
Potential demand continues to be high
Our 2015 survey found that about 80% of the respondents either have houses or their
family members own houses—higher than the 73% back in 2010. Separately, 20% of the
respondents are planning to buy houses in the next two years, which is much lower than
31% in the previous year. This is not a surprise given the high inflationary environment as
well as high interest rate environment during the year which has led to lesser financing
affordability.
Figure 120: Property ownership and potential purchase
Age Income*
% of respondents Total Urban Rural Java Ex Java 18-29 30-45 46-55 56-65 Low Mid High
2015
Property ownership 80 72 94 81 77 76 79 85 89 75 79 88
Planning to buy in next 2 years? 20 25 12 21 19 24 21 18 7 8 22 23
2014
Property ownership 81 76 90 81 79 77 80 84 93 77 81 76
Planning to buy in next 2 years? 31 35 23 29 34 30 35 27 18 28 31 43
2013
Property ownership 72 64 89 73 71 69 70 81 86 76 71 76
Planning to buy in next 2 years? 30 34 24 30 32 30 34 26 20 28 30 44
2012
Property ownership 74 65 90 74 73 70 72 84 86 77 73 79
Planning to buy in next 2 years? 30 34 22 28 33 30 33 29 15 21 32 43
2011
Property ownership 70 63 83 73 63 65 68 78 81 67 70 85
Planning to buy in next 2 years? 25 28 18 25 23 27 27 20 11 17 27 37
2010
Property ownership 73 66 86 74 71 67 70 86 92 71 74 69
Planning to buy in next 2 years? 24 30 12 24 22 23 27 22 11 15 27 42
* Income is on monthly basis—low < Rp1.5mn, mid Rp1.5mn-Rp7.5mn, high > Rp7.5mn.
Source: Credit Suisse Indonesia Consumer Survey 2016
Figure 121: Policy rate vs property purchasing plan Figure 122: Mortgage and total loan growth
Source: Credit Suisse Indonesia Consumer Survey 2016, BI Source: Bank Indonesia
As a reminder, most respondents are significantly dependent to external financing i.e.,
mortgage from banks, especially those with low to mid income individuals.
Only 20% of respondents
are planning to buy a piece
of property vs 31% last year,
but the improvement in
overall economy should help
demand

05 April 2016
Indonesia Consumer Survey 2016 74
Figure 123: Indonesia fell to third place in 2015 after being the leader last year in terms of
the numbers of respondents planning to buy a property in the next two years
0
5
10
15
20
25
30
35B
razi
l
Mex
ico
Indo
nesi
a
Chi
na
Indi
a
Sau
di
Sou
th A
fric
a
Tur
key
Rus
sia
% o
f res
pond
ents
wan
ting
to b
uy a
hou
se in
2 y
ears
2015 2014 2010
Source: Credit Suisse Indonesia Consumer Survey 2016
Going forward, we believe that the improvement in the overall economy as well as lower
inflationary and interest rate environment ahead should re-attract property demand.
Price expectations
When asked about local property price expectations over the next 12 months, 30% of the
respondents said they thought property prices would increase. Those who are bullish on
property prices generally are rural residents and those who live in Java.
Figure 124: Respondents have turned a bit more
pessimistic on property prices…
Figure 125: …in contrast to last year's survey…
30 26
39
25
40
25 26
25
26
22
45 48 37
48 38
-
10
20
30
40
50
60
70
80
90
100
Total Urban Rural Java Non-Java
Increase Flat Decrease
43 40 48
43 42
24 26 21
26 21
33 34 30 31 38
-
10
20
30
40
50
60
70
80
90
100
Total Urban Rural Java Non-Java
Increase Flat Decrease
Source: Credit Suisse Indonesia Consumer Survey 2016 Source: Credit Suisse Indonesia Consumer Survey 2015
However, this condition is in contrast with our findings of last year's survey in which 33%
respondents thought that local property prices would go down. Urban residents and those
living in the Java area believe that property prices would decrease in the near future. In
the longer term, we believe that Indonesia property prices are more resilient compared to
certain other countries in the region. Historically, Indonesian property developers are more
inclined to absorb lower sales volumes compared to lowering prices given Indonesia's
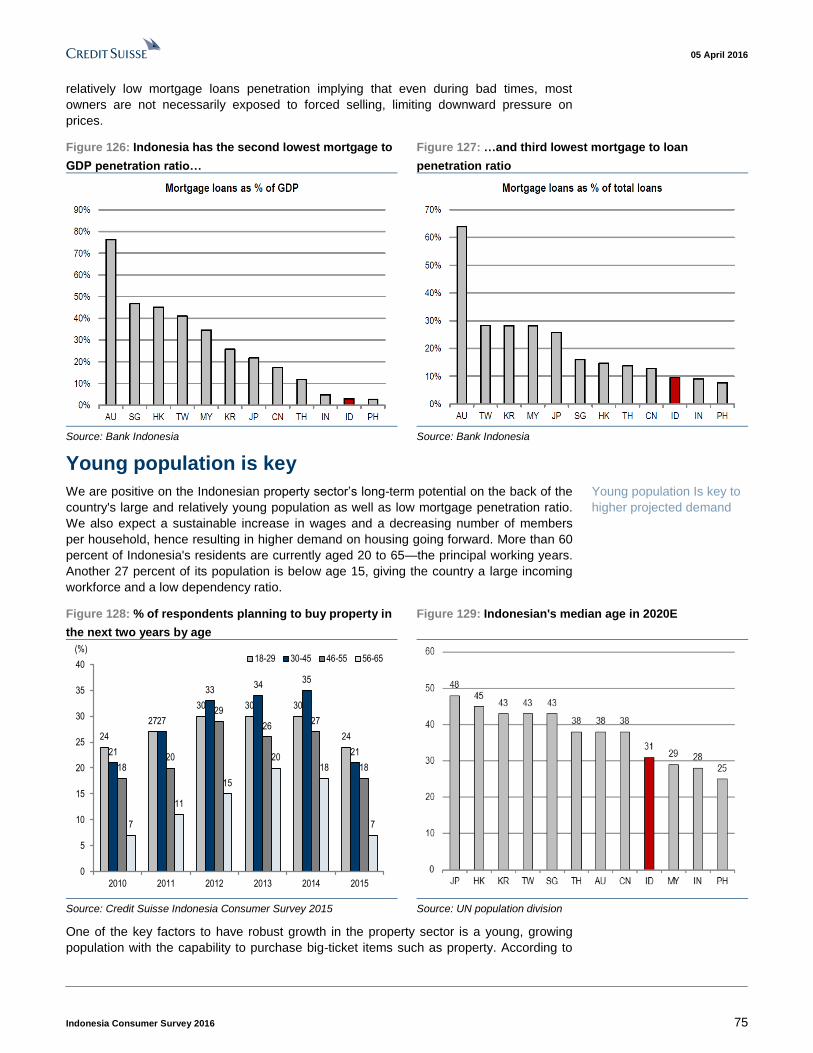
05 April 2016
Indonesia Consumer Survey 2016 75
relatively low mortgage loans penetration implying that even during bad times, most
owners are not necessarily exposed to forced selling, limiting downward pressure on
prices.
Figure 126: Indonesia has the second lowest mortgage to
GDP penetration ratio…
Figure 127: …and third lowest mortgage to loan
penetration ratio
Source: Bank Indonesia Source: Bank Indonesia
Young population is key
We are positive on the Indonesian property sector’s long-term potential on the back of the
country's large and relatively young population as well as low mortgage penetration ratio.
We also expect a sustainable increase in wages and a decreasing number of members
per household, hence resulting in higher demand on housing going forward. More than 60
percent of Indonesia's residents are currently aged 20 to 65—the principal working years.
Another 27 percent of its population is below age 15, giving the country a large incoming
workforce and a low dependency ratio.
Figure 128: % of respondents planning to buy property in
the next two years by age
Figure 129: Indonesian's median age in 2020E
24
27
30 30 30
24
21
27
3334
35
21
1820
29
2627
18
7
11
15
2018
7
0
5
10
15
20
25
30
35
40
2010 2011 2012 2013 2014 2015
(%)18-29 30-45 46-55 56-65
Source: Credit Suisse Indonesia Consumer Survey 2015 Source: UN population division
One of the key factors to have robust growth in the property sector is a young, growing
population with the capability to purchase big-ticket items such as property. According to
Young population Is key to
higher projected demand

05 April 2016
Indonesia Consumer Survey 2016 76
the UN population division, Indonesia has a relatively young demographic profile, with an
estimated median age of 31 by 2020.
High disposable income growth
People with higher monthly income have more interest in buying property in the next two
years. Indonesia's labour population growth is expected to see a 0.9% CAGR over 2010-
20E, ahead of Thailand and China. We believe these should enhance an average
Indonesian's ability to own property ahead.
Figure 130: % of respondents planning to buy property in
the next two years by income level
Figure 131: Labour population CAGR over 2010-20E
1517
21
28 28
8
27 27
3230 31
22
42
37
43 44 43
23
0
5
10
15
20
25
30
35
40
45
50
2010 2011 2012 2013 2014 2015
< Rp 1.5mn Rp 1.5mn-Rp 7.5mn > Rp 7.5mn
Source: Credit Suisse Indonesia Consumer Survey 2015 Source: UN population division
Euromonitor expects the increasing trend in annual disposable income to witness 12.4%
CAGR in 2016. This would then shift the proportion of households from low income
(households with disposable income below US$10,000) towards higher-income brackets
over the years. With a high level of income comes high expenditure. Euromonitor also
projected consumer expenditure to witness CAGR of 12.3% over 2013-16E.
Figure 132: Among highest disposable income growth… Figure 133: …and consumer expenditure growth
Source: Euromonitor Source: Euromonitor
These rates compare favourably with the growth rates of other select countries. With
increased consumer spending, Indonesian consumers are in a position to afford a higher
Increasing middle income
bracket in Indonesia due to
rising disposable income to
further help demand

05 April 2016
Indonesia Consumer Survey 2016 77
quality of life, and we will subsequently see an increasing demand for big-ticket items,
particularly property.
Rising middle class and affluent consumers (MAC)
Based on a research by the Boston Consulting Group, Indonesia's population is becoming
more affluent. The MAC population in Indonesia is expected to reach half of the entire
population by 2020 from currently 37% of total population.
Figure 134: Indonesia's population is growing and
becoming more affluent
Figure 135: MAC population of Java and Sumatera
dominates
Source: BCG Source: BCG
We believe that this will be positive for the Indonesian property sector, both for
development property as well as investment property.

05 April 2016
Indonesia Consumer Survey 2016 78
Banks Key stocks
Bank Tabungan Pensiunan Nasional
■ As the central bank now embarks on a lower rate environment with policy rate
standing at 6.75% currently, BTPN having 85% deposits as time deposits should
benefit most as compared to other banks under our coverage.
■ For this year, we expect another 25 bp rate cut bringing the policy rate down to 6.5%.
As a reminder, when BI hiked the policy rate by 175 bp between June and November
2013, the net interest margins of the top-four banks expanded, while that of second-
tier banks compressed sharply over the next quarters.
Auto interest on lower interest
In this year's survey, we witnessed a slight increase, from 61% to 74%, in the percentage
of respondents who plan to use financing facilities to finance motorbike purchases. Of the
respondents who live in rural areas, 66% plan to use financing facilities for motorbike
purchases. This is higher than the previous year's survey of 57%. Similarly, 75% of Java
residents thought they would use financing facilities, which is higher than 62% from last
year's survey. The percentage of urban residents who thought they would use financing
facilities also increased to 78% vs 64% in the previous year.
Figure 136: How do you plan to finance this motorbike purchase?
74
78
66
75
71
61
64
57
62 60
58 59 57
58 59
45
50
55
60
65
70
75
80
85
90
Total Urban Rural Java Ex Java Total Urban Rural Java Ex Java Total Urban Rural Java Ex Java
% o
f res
pond
ents
pla
n to
use
fina
ncin
g fa
cilit
ies
2015 20102014
Source: Credit Suisse Indonesia Consumer Survey 2016
The chart below shows that only investment loan has started to pick up, while overall
consumption loans as well as working capital loans remain flat.
85% of BTPN's third-party
funds are time deposits
while CASA funds only
account for 15%
We see higher interest for
financing facilities in this
2015's survey

05 April 2016
Indonesia Consumer Survey 2016 79
Figure 137: Loan growth by segment
Consumption loan has not picked up recently
Figure 138: Reported NPL situation improved in 4Q15
ID: Commercial banks' NPL ratio by type of loans (%)
Source: Bank Indonesia Source: Bank Indonesia
The percentage of respondents saving through bank accounts has also decreased from 40%
in 2014 to 39% in 2015, while most other methods of savings witnessed an increase if not
remaining flat. This is expected as overall deposit rate was pointing south during the period.
Figure 139: Methods of savings by areas
% of respondents 2015 2014 2010
Total Urban Rural Java Ex Java Total Urban Rural Java Ex Java Total Urban Rural Java Ex Java
Bank account 39 43 27 39 34 40 48 22 38 42 33 39 19 32 35
Life insurance 4 5 3 5 3 3 5 1 4 3 2 3 1 1 4
Stock market - - - - - 1 1 - 0 1 - - - 0 1
Cash 30 29 32 31 26 29 25 36 28 30 31 30 36 37 19
Property 4 5 2 2 7 3 3 2 2 5 4 4 6 0 7
No extra money for saving 24 18 36 22 30 24 18 39 28 18 29 25 39 28 34
Source: Credit Suisse Indonesia Consumer Survey 2016
As a reminder, the banking sector regulator (OJK) introduced a cap on time deposit rates back
in 2014 where banks could only offer deposit rates of 200-225 bp above the policy rate. Just
recently, OJK imposed a lower cap of 75-100 bp above the policy rate for deposit rates offered
by large banks. There is concern in the markets that the OJK may eventually regulate lending
rates as well. For now, no such caps will be introduced for lending rates, but the OJK has
hinted that the deposit rate cap is meant to encourage banks to trim their lending rates as well.
In its communications with banks, the OJK suggested it aims to see lending rates eventually in
the single-digit territory, down from the current 12-13% levels.

05 April 2016
Indonesia Consumer Survey 2016 80
Figure 140: Deposit rates trending south Figure 141: Lending rate by loan segment
Source: Bank Indonesia Source: Bank Indonesia
In this year's survey, we also found that respondents who live in the Java areas exhibited
a higher level of savings in proportion to their income than non-Java residents. In addition,
we have seen a slightly higher savings rate in Indonesia in 2015.
Figure 142: Methods of savings by income
% of respondents 2015 2014 2010
Low Mid High Low Mid High Low Mid High
Bank account 19 39 46 20 41 46 12 45 39
Life insurance 1 4 11 - 3 8 1 2 12
Stock market - - - - 0 3 - 0 3
Cash 26 31 17 27 29 25 27 32 18
Property - 4 6 4 2 5 2 5 9
No extra money for saving 55 21 20 50 24 14 57 17 17
* Income is on monthly basis—low < Rp1.5mn, mid Rp1.5mn-Rp7.5mn, high > Rp7.5mn.
Source: Credit Suisse Indonesia Consumer Survey 2016
Figure 143: Indonesia—savings as a percentage of
income
Figure 144: Indonesia—income versus savings (Rp mn)
11.0%
12.4%
6.2%
11.0%
9.8%
10.8% 10.8%10.5%
8.8%
16.1%
5%
7%
9%
11%
13%
15%
17%
Tot
al
Urb
an
Rur
al
Java
Non
-Jav
a
Tot
al
Urb
an
Rur
al
Java
Non
-Jav
a
Sav
ing
as %
of i
ncom
e
2015 2010
3.8
3.4
2.8
3.2
0.4 0.3 0.2
0.5
0.0
0.5
1.0
1.5
2.0
2.5
3.0
3.5
4.0
Java Non-Java Java Non-Java
Income Savings
2015 2010
Source: Credit Suisse Indonesia Consumer Survey 2016 Source: Credit Suisse Indonesia Consumer Survey 2016

05 April 2016
Indonesia Consumer Survey 2016 81
Key stock selections

05 April 2016
Indonesia Consumer Survey 2016 82
Asia Pacific / Indonesia
Integrated Telecommunication Services
Telkom (Telekomunikasi Indo.)
(TLKM.JK / TLKM IJ) COMPANY UPDATE
FY15: Strong revenue and EBITDA, but a 'miss'
on bottom line
■ Results snap reaction. A 'beat' on service revenue and EBITDA, but a
'miss' on net profit. Telkomsel delivered 14.8% revenue growth, 14.3%
EBITDA growth and 15.4% earnings growth across FY15, beating our
revenue and EBITDA forecasts by 1.6% and 1.8%, respectively, but missing
our net profit forecast by 1.5%.
■ Telkomsel's management team has clearly executed well on voice tariffs
(with voice revenue still growing by 10.1% YoY), and crucially, with data
price per MB now stabilising, data revenue grew by 43.9% YoY in FY15.
■ Tweaks to our numbers. We recently revised up FY16 EBITDA 2.3% but
trimmed EPS 0.8%. While PT Telkom is (1) a 'consensus buy', (2) slightly
expensive versus regional peers and (3) has outperformed the market
materially over the last 12 months, it remains the only liquid (large cap) way
to invest in the successful monetisation of Indonesia's data boom.
■ Valuation. We reflect this by lowering our WACC from 10.5% to 9.8%; this,
together with higher EBITDA forecasts, resulted in us recently raising our
DCF-based target price by 13.4% to Rp3,800. Maintain OUTPERFORM.
Share price performance
80
100
120
140
160
2000
2500
3000
3500
4000
Apr-14 Aug-14 Dec-14 Apr-15 Aug-15 Dec-15
Price (LHS) Rebased Rel (RHS)
The price relative chart measures performance against the JSX
COMPOSITE INDEX which closed at 4843.19 on 01/04/16
On 01/04/16 the spot exchange rate was Rp13155./US$1
Performance over 1M 3M 12M Absolute (%) 0.3 7.9 18.6 — Relative (%) 0.2 2.4 29.8 —
Financial and valuation metrics
Year 12/15A 12/16E 12/17E 12/18E Revenue (Rp bn) 102,470.0 112,056.7 119,386.2 125,538.6 EBITDA (Rp bn) 51,415.0 56,166.0 59,826.2 63,061.4 EBIT (Rp bn) 32,881.0 36,796.0 39,904.5 42,535.5 Net profit (Rp bn) 15,489.0 19,153.8 21,210.0 22,948.8 EPS (CS adj.) (Rp) 156 191 212 229 Change from previous EPS (%) n.a. 0.0 0.0 0.0 Consensus EPS (Rp) n.a. 182 205 227 EPS growth (%) 4.0 22.7 10.7 8.2 P/E (x) 21.5 17.5 15.8 14.6 Dividend yield (%) 2.8 3.4 4.4 5.5 EV/EBITDA (x) 6.6 6.1 5.6 5.2 P/B (x) 4.5 4.1 3.8 3.6 ROE (%) 21.7 24.3 24.7 25.1 Net debt/equity (%) 3.9 5.0 Net cash Net cash
Source: Company data, Thomson Reuters, Credit Suisse estimates.
Rating OUTPERFORM* Price (01 Apr 16, Rp) 3,350.00 Target price (Rp) 3,800.00¹ Upside/downside (%) 13.4 Mkt cap (Rp bn) 337,680.0 (US$25.7 mn) Enterprise value (Rp bn) 342,753 Number of shares (mn) 100,800.00 Free float (%) 48.8 52-week price range 3,500.0-2,600.0 ADTO - 6M (US$ mn) 20.5
*Stock ratings are relative to the coverage universe in each
analyst's or each team's respective sector.
¹Target price is for 12 months.
Research Analysts
Colin McCallum, CA
852 2101 6514

05 April 2016
Indonesia Consumer Survey 2016 83
Telkom (Telekomunikasi Indo.) TLKM.JK / TLKM IJ
Price (01 Apr 16): Rp3,350.00, Rating: OUTPERFORM, Target Price: Rp3,800.00, Analyst: Colin McCallum
Target price scenario
Scenario TP %Up/Dwn Assumptions
Upside 4,000.00 19.40 Target EV/EBITDA +1 Central Case 3,800.00 13.43 Base case Downside 1,950.00 (41.79) Target EV/EBITDA -1
Key earnings drivers 12/15A 12/16E 12/17E 12/18E
Cellular subscribers (000s)
152,640 156,512 159,012 160,012 Cellular ARPU 43,229 45,535 47,687 49,592 Revenue growth 14.2 9.4 6.5 5.2 EBITDA margin 50.2 50.1 50.1 50.2 Capex to sales ratio 27.3 23.7 18.1 16.0
Income statement (Rp bn) 12/15A 12/16E 12/17E 12/18E
Sales revenue 102,470 112,057 119,386 125,539 Cost of goods sold 51,055 55,891 59,560 62,477 SG&A — — — — Other operating exp./(inc.) — — — — EBITDA 51,415 56,166 59,826 63,061 Depreciation & amortisation 18,534 19,370 19,922 20,526 EBIT 32,881 36,796 39,905 42,536 Net interest expense/(inc.) 1,074 78 (72) (299) Non-operating inc./(exp.) (463.0) — 100.0 100.0 Associates/JV (2.0) 548.3 643.5 728.8 Recurring PBT 31,342 37,267 40,720 43,664 Exceptionals/extraordinaries — — — — Taxes 8,025 9,317 10,180 10,916 Profit after tax 23,317 27,950 30,540 32,748 Other after tax income — — — — Minority interests 7,828 8,796 9,330 9,799 Preferred dividends — — — — Reported net profit 15,489 19,154 21,210 22,949 Analyst adjustments — — — — Net profit (Credit Suisse) 15,489 19,154 21,210 22,949
Cash flow (Rp bn) 12/15A 12/16E 12/17E 12/18E
EBIT 32,881 36,796 39,904 42,536 Net interest (1,074) (78) 72 299 Tax paid (8,025) (9,317) (10,180) (10,916) Working capital 2,320 (4,552) 711 533 Other cash & non-cash items 16,887 19,370 19,922 20,526 Operating cash flow 42,989 42,220 50,429 52,978 Capex (27,938) (26,550) (21,620) (20,117) Free cash flow to the firm 14,378 20,221 28,098 32,328 Disposals of fixed assets — — — — Acquisitions — — — — Divestments 742 1,739 — — Associate investments — — — — Other investment/(outflows) (243.0) — — — Investing cash flow (27,439) (24,811) (21,620) (20,117) Equity raised 73.0 — — — Dividends paid (16,596) (18,805) (22,584) (26,469) Net borrowings 11,439 (1,739) — — Other financing cash flow — — — — Financing cash flow (5,084) (20,544) (22,584) (26,469) Total cash flow 10,466 (3,135) 6,224 6,391 Adjustments — — — — Net change in cash 10,466 (3,135) 6,224 6,391
Balance sheet (Rp bn) 12/15A 12/16E 12/17E 12/18E
Cash & cash equivalents 30,935 27,800 34,025 40,416 Current receivables — — — — Inventories — — — — Other current assets 16,977 18,594 19,853 20,918 Current assets 47,912 46,394 53,878 61,333 Property, plant & equip. 103,700 111,330 113,029 112,620 Investments 1,807 5,936 6,386 6,896 Intangibles 3,056 2,606 2,606 2,606 Other non-current assets 9,698 9,698 9,698 9,698 Total assets 166,173 175,964 185,597 193,154 Accounts payable — — — — Short-term debt 4,444 4,340 4,340 4,340 Current provisions — — — — Other current liabilities 30,969 33,518 35,388 36,886 Current liabilities 35,413 37,858 39,728 41,226 Long-term debt 30,168 28,533 28,533 28,533 Non-current provisions 4,672 4,672 4,672 4,672 Other non-current liab. 2,492 2,492 2,492 2,492 Total liabilities 72,745 73,555 75,425 76,923 Shareholders' equity 75,136 82,798 89,161 93,750 Minority interests 18,292 19,611 21,011 22,481 Total liabilities & equity 166,173 175,964 185,597 193,154
Per share data 12/15A 12/16E 12/17E 12/18E
Shares (wtd avg.) (mn) 99,435 100,177 100,177 100,177 EPS (Credit Suisse) (Rp) 156 191 212 229 DPS (Rp) 95 115 148 183 BVPS (Rp) 750 827 890 936 Operating CFPS (Rp) 432 421 503 529
Key ratios and valuation 12/15A 12/16E 12/17E 12/18E
Growth(%) Sales revenue 14.2 9.4 6.5 5.2 EBIT 14.5 11.9 8.4 6.6 Net profit 5.8 23.7 10.7 8.2 EPS 4.0 22.7 10.7 8.2 Margins (%)
EBITDA 50.2 50.1 50.1 50.2 EBIT 32.1 32.8 33.4 33.9 Pre-tax profit 30.6 33.3 34.1 34.8 Net profit 15.1 17.1 17.8 18.3 Valuation metrics (x) P/E 21.5 17.5 15.8 14.6 P/B 4.47 4.05 3.76 3.58 Dividend yield (%) 2.83 3.42 4.42 5.47 P/CF 7.75 7.95 6.65 6.33 EV/sales 3.33 3.06 2.82 2.63 EV/EBITDA 6.64 6.10 5.63 5.24 EV/EBIT 10.4 9.3 8.4 7.8 ROE analysis (%) ROE 21.7 24.3 24.7 25.1 ROIC 26.3 27.0 27.6 29.3 Asset turnover (x) 0.62 0.64 0.64 0.65 Interest burden (x) 0.95 1.01 1.02 1.03 Tax burden (x) 0.74 0.75 0.75 0.75 Financial leverage (x) 1.78 1.72 1.68 1.66 Credit ratios Net debt/equity (%) 3.94 4.95 (1.05) (6.49) Net debt/EBITDA (x) 0.07 0.09 (0.02) (0.12) Interest cover (x) 31 474 (554) (142)
Source: Company data, Thomson Reuters, Credit Suisse estimates.
0
2
4
6
8
10
12
14
16
18
20
2011 2012 2013 2014 2015 2016
12MF P/E multiple
0.0
0.5
1.0
1.5
2.0
2.5
3.0
3.5
4.0
4.5
2011 2012 2013 2014 2015 2016
12MF P/B multiple
Source: IBES

05 April 2016
Indonesia Consumer Survey 2016 84
Asia Pacific / Indonesia
Automobile Manufacturers
Astra International
(ASII.JK / ASII IJ) COMPANY UPDATE FOCUS LIST STOCK
Improving prospects and direct beneficiary of
economic growth
■ One of the largest and most liquid names in Indonesia. Astra
International is one of the largest listed companies in Indonesia. It is involved
in four main businesses: automotive, financial services, heavy machinery
(and mining contracting) and agribusiness. It also has other businesses
(infrastructure, water distribution, it solution and property) that are less
prominent. The auto and auto related financing business is still the largest
component of ASII, contributing 62%/76% of revenue/net profit in 2015.
■ Market leader in the auto industry. Astra International is the leader in both
4W and 2W industries with 47% and 69% market share as of 2M16. It is
responsible for the distribution of Toyota, Daihatsu and Isuzu for 4W and
Honda for 2W, while they also have a stake in the manufacturing entities in
Indonesia. Astra has an extensive network of marketing and distribution,
which enables it to maintain its dominance within the auto industry.
■ Positive outlook for 2016. We are more positive on the auto division
outlook this year due to improvement in leading indicators such as
consumption growth and GDP growth. Monetary easing has also started as
BI has cut its reference rate by 75 bp YTD and is expected to be fully
reflected in an improved auto sales volume in 2-3 quarters. Model lineups
this year are also looking decent, which we believe should be able to support
4W sales. Further, discounts are normalising after peaking in 3Q15 last year,
which should bode well with Astra’s profitability and inventory levels.
■ Maintain OUTPERFORM. We maintain our OUTPERFORM rating on Astra
International with a target price of Rp7,600 based on an SOTP methodology,
which implies 15x FY16E P/E. We are forecasting 28% two-year earnings
CAGR.
Share price performance
60
80
100
120
4000
6000
8000
10000
Apr-14 Aug-14 Dec-14 Apr-15 Aug-15 Dec-15
Price (LHS) Rebased Rel (RHS)
The price relative chart measures performance against the JSX
COMPOSITE INDEX which closed at 4843.19 on 01/04/16
On 01/04/16 the spot exchange rate was Rp13155./US$1
Performance over 1M 3M 12M Absolute (%) 3.2 22.1 -9.3 — Relative (%) 3.0 16.6 2.0 —
Financial and valuation metrics
Year 12/14A 12/15E 12/16E 12/17E Revenue (Rp bn) 201,701.0 188,538.3 213,926.2 240,898.9 EBITDA (Rp bn) 27,957.0 23,201.0 26,026.8 30,431.9 EBIT (Rp bn) 20,163.0 16,154.6 17,581.5 21,595.7 Net profit (Rp bn) 19,582.0 17,283.7 20,093.3 23,699.9 EPS (CS adj.) (Rp) 484 427 496 585 Change from previous EPS (%) n.a. 0.0 0.0 0.0 Consensus EPS (Rp) n.a. 461 456 514 EPS growth (%) 0.9 -11.7 16.3 17.9 P/E (x) 15.1 17.2 14.8 12.5 Dividend yield (%) 3.4 3.9 3.5 4.1 EV/EBITDA (x) 12.4 15.2 13.5 11.8 P/B (x) 3.1 3.0 2.7 2.5 ROE (%) 21.8 17.8 19.5 20.8 Net debt/equity (%) 40.9 44.6 40.4 43.0
Source: Company data, Thomson Reuters, Credit Suisse estimates.
Rating OUTPERFORM Price (01 Apr 16, Rp) 7,325.00 Target price (Rp) 7,600.00¹ Upside/downside (%) 3.8 Mkt cap (Rp bn) 296,542.0 (US$ 22.5) Enterprise value (Rp bn) 351,893 Number of shares (mn) 40,483.55 Free float (%) 45.2 52-week price range 8,200.0 - 5,125.0 ADTO - 6M (US$ mn) 19.9
*Stock ratings are relative to the coverage universe in each
analyst's or each team's respective sector.
¹Target price is for 12 months.
Research Analysts
Jahanzeb Naseer
62 21 2553 7977

05 April 2016
Indonesia Consumer Survey 2016 85
Astra International ASII.JK / ASII IJ
Price (01 Apr 16): Rp7,325.00, Rating: OUTPERFORM, Target Price: Rp7,600.00, Analyst: Jahanzeb Naseer
Target price scenario
Scenario TP %Up/Dwn Assumptions
Upside 9,000.00 22.87 Based on strong recovery on auto volumes in 16/17
Central Case 7,600.00 3.75 SOTP Downside 5,500.00 (24.91) due to delay in economic recovery
Key earnings drivers 12/14A 12/15E 12/16E 12/17E
4W sales volume 614,171 504,954 557,784 632,533 LCGC sales volume 107,849 93,600 106,470 137,592 4W ASP 164.4 172.7 184.8 188.4 Policy rate 0.08 0.07 0.07 0.07 — — — —
Income statement (Rp bn) 12/14A 12/15E 12/16E 12/17E
Sales revenue 201,701 188,538 213,926 240,899 Cost of goods sold 162,892 152,567 174,375 195,254 SG&A 18,646 19,816 21,970 24,049 Other operating exp./(inc.) (7,794) (7,046) (8,445) (8,836) EBITDA 27,957 23,201 26,027 30,432 Depreciation & amortisation 7,794 7,046 8,445 8,836 EBIT 20,163 16,155 17,582 21,596 Net interest expense/(inc.) (151.0) 88.2 180.8 169.5 Non-operating inc./(exp.) 7,439 9,077 10,730 11,800 Associates/JV — — — — Recurring PBT 27,753 25,144 28,131 33,226 Exceptionals/extraordinaries — — — — Taxes 5,227 4,736 5,298 6,258 Profit after tax 22,526 20,408 22,833 26,969 Other after tax income — — — — Minority interests 2,944 3,124 2,739 3,269 Preferred dividends — — — — Reported net profit 19,582 17,284 20,093 23,700 Analyst adjustments — — — — Net profit (Credit Suisse) 19,582 17,284 20,093 23,700
Cash flow (Rp bn) 12/14A 12/15E 12/16E 12/17E
EBIT 20,163 16,155 17,582 21,596 Net interest — — — — Tax paid — — — — Working capital (7,877) (2,906) (11,306) (13,937) Other cash & non-cash items 2,677 5,741 8,340 8,289 Operating cash flow 14,963 18,990 14,615 15,948 Capex (13,235) (13,162) (14,149) (14,331) Free cash flow to the firm 1,728 5,828 466 1,617 Disposals of fixed assets — — — — Acquisitions — — — — Divestments — — — — Associate investments — — — — Other investment/(outflows) 3,671 4,985 8,509 (1,534) Investing cash flow (9,564) (8,176) (5,639) (15,865) Equity raised — — — — Dividends paid (10,201) (11,509) (10,370) (12,056) Net borrowings 7,996 (8,128) 10,374 10,487 Other financing cash flow (1,840) (3,261) 281 361 Financing cash flow (4,045) (22,897) 284 (1,208) Total cash flow 1,354 (12,084) 9,260 (1,126) Adjustments 1,013 (22) — — Net change in cash 2,367 (12,106) 9,260 (1,126)
Balance sheet (Rp bn) 12/14A 12/15E 12/16E 12/17E
Cash & cash equivalents 20,902 8,818 18,078 16,952 Current receivables 24,462 19,428 21,016 23,330 Inventories 16,986 13,808 14,818 16,286 Other current assets 34,891 42,421 49,394 57,247 Current assets 97,241 84,476 103,306 113,815 Property, plant & equip. 47,257 50,937 54,023 56,867 Investments 27,250 30,184 33,798 37,937 Intangibles — — 1.00 1.00 Other non-current assets 64,281 62,444 61,249 70,380 Total assets 236,029 228,041 252,377 279,000
Accounts payable 18,839 18,050 19,756 21,719 Short-term debt 37,421 31,207 35,896 39,914 Current provisions 430.0 421.1 491.8 571.8 Other current liabilities 16,833 15,257 17,437 19,525 Current liabilities 73,523 64,934 73,581 81,730 Long-term debt 32,651 32,963 36,813 40,904 Non-current provisions 3,402 3,116 3,639 4,232 Other non-current liab. 6,129 2,828 3,209 3,613 Total liabilities 115,705 103,841 117,241 130,479 Shareholders' equity 95,611 98,125 108,130 120,134 Minority interests 24,713 26,075 27,005 28,385 Total liabilities & equity 236,029 228,041 252,376 278,999
Per share data 12/14A 12/15E 12/16E 12/17E
Shares (wtd avg.) (mn) 40,484 40,484 40,484 40,484 EPS (Credit Suisse) (Rp) 484 427 496 585 DPS (Rp) 252 284 256 298 BVPS (Rp) 2,362 2,424 2,671 2,967 Operating CFPS (Rp) 370 469 361 394
Key ratios and valuation 12/14A 12/15E 12/16E 12/17E
Growth(%) Sales revenue 4.0 (6.5) 13.5 12.6 EBIT 8.4 (19.9) 8.8 22.8 Net profit 0.9 (11.7) 16.3 17.9 EPS 0.9 (11.7) 16.3 17.9 Margins (%) EBITDA 13.9 12.3 12.2 12.6 EBIT 10.0 8.6 8.2 9.0 Pre-tax profit 13.8 13.3 13.1 13.8 Net profit 9.7 9.2 9.4 9.8 Valuation metrics (x) P/E 15.1 17.2 14.8 12.5 P/B 3.10 3.02 2.74 2.47 Dividend yield (%) 3.44 3.88 3.50 4.07 P/CF 19.8 15.6 20.3 18.6 EV/sales 1.71 1.87 1.64 1.50 EV/EBITDA 12.4 15.2 13.5 11.8 EV/EBIT 17.1 21.8 20.0 16.7 ROE analysis (%) ROE 21.8 17.8 19.5 20.8 ROIC 10.2 7.5 7.7 8.7 Asset turnover (x) 0.85 0.83 0.85 0.86 Interest burden (x) 1.38 1.56 1.60 1.54 Tax burden (x) 0.81 0.81 0.81 0.81 Financial leverage (x) 1.96 1.84 1.87 1.88 Credit ratios Net debt/equity (%) 40.9 44.6 40.4 43.0 Net debt/EBITDA (x) 1.76 2.39 2.10 2.10 Interest cover (x) (134) 183 97 127
Source: Company data, Thomson Reuters, Credit Suisse estimates.
0
2
4
6
8
10
12
14
16
18
2011 2012 2013 2014 2015 2016
12MF P/E multiple
0.0
0.5
1.0
1.5
2.0
2.5
3.0
3.5
4.0
4.5
5.0
2011 2012 2013 2014 2015 2016
12MF P/B multiple
Source: IBES

05 April 2016
Indonesia Consumer Survey 2016 86
Asia Pacific / Indonesia
Packaged Foods
Indofood CBP
(ICBP.JK / ICBP IJ) COMPANY UPDATE
A play in staples
■ A play in staples. Indofood CBP is an established and leading consumer
branded products company in Indonesia, with a diverse product range. With
a rise in consumer confidence along with the improved macro, we believe it
will help consumption growth. In addition, we have seen that during the
interest rate cut environment, purchasing power showed improvement, and
thus consumer stocks outperformed. Our economist’s expectations of
another 50 bp cut this year will allow ICBP to benefit, as it owns five
business portfolios in consumer staples, with noodle as the major contributor.
■ Noodles is the backbone. ICBP’s instant noodles, Indomie, has a strong
brand equity with market share of 75%. We expect noodles volume to grow
at 3% CAGR 2016-18E, with 5% ASP during the same period. The company
launches several new Indomie flavours every year, and recently, it launched
“My Noodlez” which is targeted for kids. We believe the noodles division will
continue to be the company’s backbone in the coming years.
■ Second largest contributor is dairy. The dairy division reported 29%
higher volume YoY in 3Q15 on the back of additional contribution from the
latest acquired Milkuat in 2014. ASP, however, was 8% lower YoY. The
decline in skim milk and sugar prices benefitted the dairy division; however,
with the still weak Rupiah to USD exchange rate, operating margin is yet to
be back at its normalised basis. We are estimating 9% YoY volume growth
this year on 6% higher ASP YoY.
■ Maintain OUTPERFORM. We continue to like the stock within the
Indonesian consumer space. Our target price of Rp18,300 is derived from
SOTP and market relative performance (in a 50:50) ratio. It implies 27.8x
2016E P/E with 13% earnings growth over the next two years.
Share price performance
80
130
180
8000
13000
18000
Apr-14 Aug-14 Dec-14 Apr-15 Aug-15 Dec-15
Price (LHS) Rebased Rel (RHS)
The price relative chart measures performance against the JSX
COMPOSITE INDEX which closed at 4843.19 on 01/04/16
On 01/04/16 the spot exchange rate was Rp13155./US$1
Performance over 1M 3M 12M Absolute (%) -3.3 13.7 7.0 — Relative (%) -3.5 8.3 18.2 —
Financial and valuation metrics
Year 12/14A 12/15E 12/16E 12/17E Revenue (Rp bn) 30,022.5 32,433.2 36,499.2 40,999.9 EBITDA (Rp bn) 3,748.1 5,013.3 5,968.4 6,618.7 EBIT (Rp bn) 3,128.7 4,154.0 4,839.0 5,339.4 Net profit (Rp bn) 2,604.2 3,248.2 3,835.4 4,296.7 EPS (CS adj.) (Rp) 447 557 658 737 Change from previous EPS (%) n.a. 0.0 0.0 0.0 Consensus EPS (Rp) n.a. 515 596 674 EPS growth (%) 17.0 24.7 18.1 12.0 P/E (x) 34.3 27.5 23.3 20.8 Dividend yield (%) 1.2 1.5 1.8 2.2 EV/EBITDA (x) 22.8 17.0 14.1 12.4 P/B (x) 6.4 5.6 4.9 4.3 ROE (%) 19.5 21.6 22.4 22.1 Net debt/equity (%) Net cash Net cash Net cash Net cash
Source: Company data, Thomson Reuters, Credit Suisse estimates.
Rating OUTPERFORM Price (01 Apr 16, Rp) 15,325 Target price (Rp) 18,300¹ Upside/downside (%) 19.4 Mkt cap (Rp bn) 89,359.4 (US$6.8 bn) Enterprise value (Rp bn) 85,020 Number of shares (mn) 5,830.95 Free float (%) 19.4 52-week price range 16,600.0-11,250.0 ADTO - 6M (US$ mn) 2.7
*Stock ratings are relative to the coverage universe in each
analyst's or each team's respective sector.
¹Target price is for 12 months.
Research Analysts
Ella Nusantoro
62 21 255 37917

05 April 2016
Indonesia Consumer Survey 2016 87
Indofood CBP ICBP.JK / ICBP IJ
Price (01 Apr 16): Rp15,325, Rating: OUTPERFORM, Target Price: Rp18,300, Analyst: Ella Nusantoro
Target price scenario
Scenario TP %Up/Dwn Assumptions Upside 18,950.00 23.65 STDEV+1: 28.8x
Central Case 18,300.00 19.41 SOTP-based on average 2015E & 2016E at P/E of 27.8x
Downside 17,650.00 15.17 STDEV-1: 26.8x
Key earnings drivers 12/14A 12/15E 12/16E 12/17E
GDP growth (%) 5.00 4.60 5.20 5.20 Average inflation (%) 8.40 3.20 5.30 5.30 Avg. exchg rate (IDR/USD) 12,000 13,700 14,450 14,774 — — — — — — — —
Income statement (Rp bn) 12/14A 12/15E 12/16E 12/17E
Sales revenue 30,022 32,433 36,499 41,000 Cost of goods sold 21,963 22,399 25,288 28,100 SG&A 4,931 5,880 6,373 7,561 Other operating exp./(inc.) (619) (859) (1,129) (1,279) EBITDA 3,748 5,013 5,968 6,619 Depreciation & amortisation 619 859 1,129 1,279 EBIT 3,129 4,154 4,839 5,339 Net interest expense/(inc.) (260.7) (114.0) (100.2) (193.9) Non-operating inc./(exp.) — — — — Associates/JV (0.7) (84.9) — — Recurring PBT 3,389 4,183 4,939 5,533 Exceptionals/extraordinaries — — — — Taxes 857 1,058 1,249 1,399 Profit after tax 2,532 3,125 3,690 4,134 Other after tax income — — — — Minority interests (72.6) (123.1) (145.4) (162.9) Preferred dividends — — — — Reported net profit 2,604 3,248 3,835 4,297 Analyst adjustments — — — — Net profit (Credit Suisse) 2,604 3,248 3,835 4,297
Cash flow (Rp bn) 12/14A 12/15E 12/16E 12/17E
EBIT 3,129 4,154 4,839 5,339 Net interest 260.7 114.0 100.2 193.9 Tax paid (857) (1,058) (1,249) (1,399) Working capital 377.4 (365.0) (225.5) (315.3) Other cash & non-cash items 31 1,263 1,500 1,758 Operating cash flow 2,941 4,108 4,965 5,576 Capex (1,331) (2,400) (2,700) (1,500) Free cash flow to the firm 1,610 1,708 2,265 4,076 Disposals of fixed assets — — — — Acquisitions — — — — Divestments — — — — Associate investments — — — — Other investment/(outflows) 10.9 (336.0) (207.9) (285.0) Investing cash flow (1,320) (2,736) (2,908) (1,785) Equity raised — — — — Dividends paid (1,108) (1,302) (1,624) (1,918) Net borrowings 299.3 — — — Other financing cash flow 992.2 572.4 358.0 436.8 Financing cash flow 184 (730) (1,266) (1,481) Total cash flow 1,804 642 791 2,310 Adjustments — — — — Net change in cash 1,804 642 791 2,310
Balance sheet (Rp bn) 12/14A 12/15E 12/16E 12/17E
Cash & cash equivalents 7,343 7,985 8,776 11,086 Current receivables 2,902 3,062 3,378 3,832 Inventories 2,822 2,855 3,250 3,596 Other current assets 536.7 593.3 668.3 742.8 Current assets 13,604 14,495 16,072 19,257 Property, plant & equip. 5,839 7,379 8,950 9,171 Investments 655.4 655.4 655.4 655.4 Intangibles 4,186 4,052 3,919 3,786 Other non-current assets 626.9 731.2 846.8 949.7 Total assets 24,910 27,314 30,443 33,819
Accounts payable 2,813 2,720 3,074 3,414 Short-term debt 1,816 2,093 2,068 2,081 Current provisions — — — — Other current liabilities 1,601 1,579 1,786 2,006 Current liabilities 6,231 6,393 6,928 7,501 Long-term debt 1,590 1,612 1,612 1,612 Non-current provisions — — — — Other non-current liab. 2,050 2,200 2,437 2,699 Total liabilities 9,870 10,204 10,977 11,811 Shareholders' equity 14,078 16,024 18,235 20,614 Minority interests 962 1,085 1,231 1,394 Total liabilities & equity 24,910 27,314 30,443 33,819
Per share data 12/14A 12/15E 12/16E 12/17E
Shares (wtd avg.) (mn) 5,831 5,831 5,831 5,831 EPS (Credit Suisse) (Rp) 447 557 658 737 DPS (Rp) 190 223 279 329 BVPS (Rp) 2,414 2,748 3,127 3,535 Operating CFPS (Rp) 504 704 851 956
Key ratios and valuation 12/14A 12/15E 12/16E 12/17E
Growth(%) Sales revenue 19.6 8.0 12.5 12.3 EBIT 12.9 32.8 16.5 10.3 Net profit 17.0 24.7 18.1 12.0 EPS 17.0 24.7 18.1 12.0 Margins (%) EBITDA 12.5 15.5 16.4 16.1 EBIT 10.4 12.8 13.3 13.0 Pre-tax profit 11.3 12.9 13.5 13.5 Net profit 8.7 10.0 10.5 10.5 Valuation metrics (x) P/E 34.3 27.5 23.3 20.8 P/B 6.35 5.58 4.90 4.33 Dividend yield (%) 1.24 1.46 1.82 2.15 P/CF 30.4 21.8 18.0 16.0 EV/sales 2.84 2.62 2.31 2.00 EV/EBITDA 22.8 17.0 14.1 12.4 EV/EBIT 27.3 20.5 17.4 15.3 ROE analysis (%) ROE 19.5 21.6 22.4 22.1 ROIC 22.0 26.1 26.7 27.6 Asset turnover (x) 1.21 1.19 1.20 1.21 Interest burden (x) 1.08 1.01 1.02 1.04 Tax burden (x) 0.75 0.75 0.75 0.75 Financial leverage (x) 1.66 1.60 1.56 1.54 Credit ratios Net debt/equity (%) (26.6) (25.4) (26.5) (33.9) Net debt/EBITDA (x) (1.07) (0.87) (0.86) (1.13) Interest cover (x) (12.0) (36.4) (48.3) (27.5)
Source: Company data, Thomson Reuters, Credit Suisse estimates.
0
5
10
15
20
25
30
2011 2012 2013 2014 2015 2016
12MF P/E multiple
0
1
2
3
4
5
6
2011 2012 2013 2014 2015 2016
12MF P/B multiple
Source: IBES
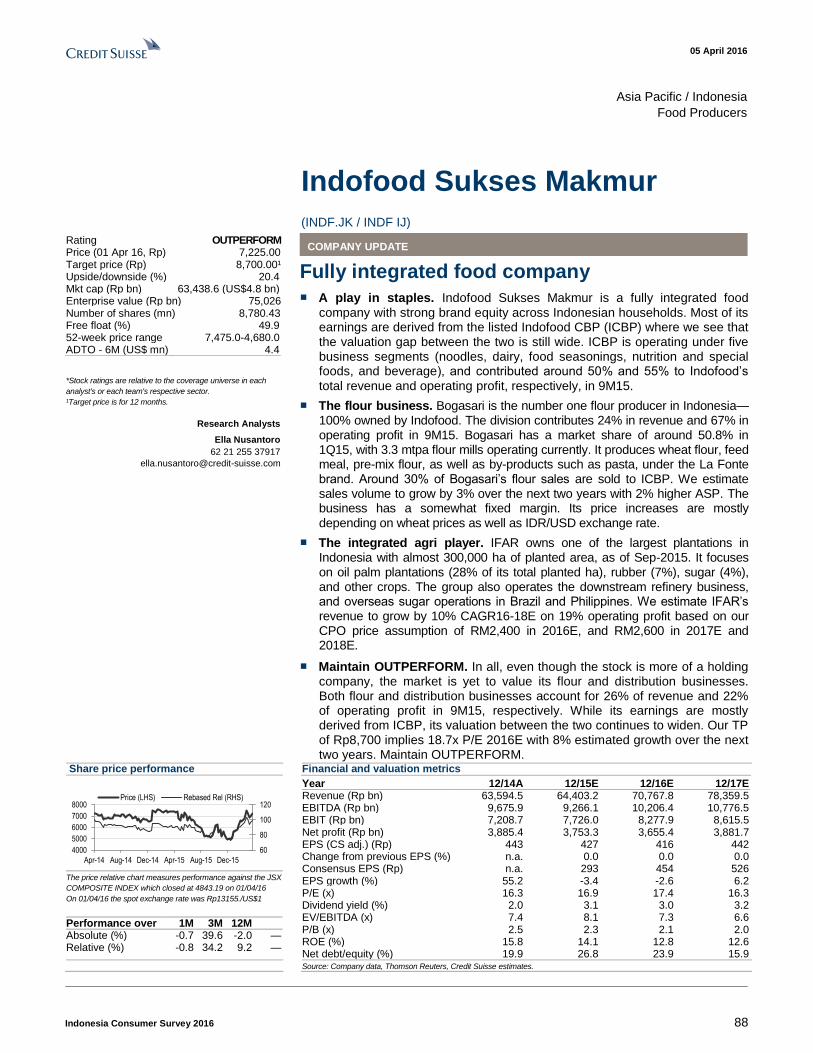
05 April 2016
Indonesia Consumer Survey 2016 88
Asia Pacific / Indonesia
Food Producers
Indofood Sukses Makmur
(INDF.JK / INDF IJ) COMPANY UPDATE
Fully integrated food company
■ A play in staples. Indofood Sukses Makmur is a fully integrated food
company with strong brand equity across Indonesian households. Most of its earnings are derived from the listed Indofood CBP (ICBP) where we see that the valuation gap between the two is still wide. ICBP is operating under five business segments (noodles, dairy, food seasonings, nutrition and special foods, and beverage), and contributed around 50% and 55% to Indofood’s
total revenue and operating profit, respectively, in 9M15.
■ The flour business. Bogasari is the number one flour producer in Indonesia—100% owned by Indofood. The division contributes 24% in revenue and 67% in operating profit in 9M15. Bogasari has a market share of around 50.8% in 1Q15, with 3.3 mtpa flour mills operating currently. It produces wheat flour, feed meal, pre-mix flour, as well as by-products such as pasta, under the La Fonte brand. Around 30% of Bogasari’s flour sales are sold to ICBP. We estimate sales volume to grow by 3% over the next two years with 2% higher ASP. The business has a somewhat fixed margin. Its price increases are mostly
depending on wheat prices as well as IDR/USD exchange rate.
■ The integrated agri player. IFAR owns one of the largest plantations in Indonesia with almost 300,000 ha of planted area, as of Sep-2015. It focuses on oil palm plantations (28% of its total planted ha), rubber (7%), sugar (4%), and other crops. The group also operates the downstream refinery business, and overseas sugar operations in Brazil and Philippines. We estimate IFAR’s revenue to grow by 10% CAGR16-18E on 19% operating profit based on our CPO price assumption of RM2,400 in 2016E, and RM2,600 in 2017E and 2018E.
■ Maintain OUTPERFORM. In all, even though the stock is more of a holding company, the market is yet to value its flour and distribution businesses. Both flour and distribution businesses account for 26% of revenue and 22% of operating profit in 9M15, respectively. While its earnings are mostly derived from ICBP, its valuation between the two continues to widen. Our TP of Rp8,700 implies 18.7x P/E 2016E with 8% estimated growth over the next two years. Maintain OUTPERFORM.
Share price performance
60
80
100
120
4000
5000
6000
7000
8000
Apr-14 Aug-14 Dec-14 Apr-15 Aug-15 Dec-15
Price (LHS) Rebased Rel (RHS)
The price relative chart measures performance against the JSX
COMPOSITE INDEX which closed at 4843.19 on 01/04/16
On 01/04/16 the spot exchange rate was Rp13155./US$1
Performance over 1M 3M 12M Absolute (%) -0.7 39.6 -2.0 — Relative (%) -0.8 34.2 9.2 —
Financial and valuation metrics
Year 12/14A 12/15E 12/16E 12/17E Revenue (Rp bn) 63,594.5 64,403.2 70,767.8 78,359.5 EBITDA (Rp bn) 9,675.9 9,266.1 10,206.4 10,776.5 EBIT (Rp bn) 7,208.7 7,726.0 8,277.9 8,615.5 Net profit (Rp bn) 3,885.4 3,753.3 3,655.4 3,881.7 EPS (CS adj.) (Rp) 443 427 416 442 Change from previous EPS (%) n.a. 0.0 0.0 0.0 Consensus EPS (Rp) n.a. 293 454 526 EPS growth (%) 55.2 -3.4 -2.6 6.2 P/E (x) 16.3 16.9 17.4 16.3 Dividend yield (%) 2.0 3.1 3.0 3.2 EV/EBITDA (x) 7.4 8.1 7.3 6.6 P/B (x) 2.5 2.3 2.1 2.0 ROE (%) 15.8 14.1 12.8 12.6 Net debt/equity (%) 19.9 26.8 23.9 15.9
Source: Company data, Thomson Reuters, Credit Suisse estimates.
Rating OUTPERFORM Price (01 Apr 16, Rp) 7,225.00 Target price (Rp) 8,700.00¹ Upside/downside (%) 20.4 Mkt cap (Rp bn) 63,438.6 (US$4.8 bn) Enterprise value (Rp bn) 75,026 Number of shares (mn) 8,780.43 Free float (%) 49.9 52-week price range 7,475.0-4,680.0 ADTO - 6M (US$ mn) 4.4
*Stock ratings are relative to the coverage universe in each
analyst's or each team's respective sector.
¹Target price is for 12 months.
Research Analysts
Ella Nusantoro
62 21 255 37917

05 April 2016
Indonesia Consumer Survey 2016 89
Indofood Sukses Makmur INDF.JK / INDF IJ
Price (01 Apr 16): Rp7,225.00, Rating: OUTPERFORM, Target Price: Rp8,700.00, Analyst: Ella Nusantoro
Target price scenario
Scenario TP %Up/Dwn Assumptions Upside 9,180.00 27.06 STDEV+1 - P/E: 19.7x
Central Case 8,700.00 20.42 SOTP-based & Market relative performance, P/E: 18.7x
Downside 8,250.00 14.19 STDEV-1 - P/E: 17.7x
Key earnings drivers 12/14A 12/15E 12/16E 12/17E
GDP growth (%) 5.00 4.60 5.20 5.20 Population (mn) 252.3 255.8 259.4 263.0 Average inflation (%) 8.40 3.20 5.30 5.30 Average exchange rate (IDR/USD)
12,000 13,700 14,450 14,774 — — — —
Income statement (Rp bn) 12/14A 12/15E 12/16E 12/17E
Sales revenue 63,594 64,403 70,768 78,360 Cost of goods sold 46,545 47,182 51,880 57,727 SG&A 10,175 9,856 10,705 12,154 Other operating exp./(inc.) (2,802) (1,901) (2,024) (2,298) EBITDA 9,676 9,266 10,206 10,777 Depreciation & amortisation 2,467 1,540 1,929 2,161 EBIT 7,209 7,726 8,278 8,616 Net interest expense/(inc.) 860.4 784.8 697.8 589.6 Non-operating inc./(exp.) (119.1) (378.3) (378.3) (378.3) Associates/JV — — — — Recurring PBT 6,229 6,563 7,202 7,648 Exceptionals/extraordinaries — — — — Taxes 1,828 1,903 2,088 2,218 Profit after tax 4,401 4,660 5,113 5,430 Other after tax income 745.2 422.1 — — Minority interests 1,261 1,328 1,458 1,548 Preferred dividends — — — — Reported net profit 3,885 3,753 3,655 3,882 Analyst adjustments — — — — Net profit (Credit Suisse) 3,885 3,753 3,655 3,882
Cash flow (Rp bn) 12/14A 12/15E 12/16E 12/17E
EBIT 7,209 7,726 8,278 8,615 Net interest (860.4) (784.8) (697.8) (589.6) Tax paid (1,828) (1,903) (2,088) (2,218) Working capital (6,012) (1,888) (617) (655) Other cash & non-cash items 1,832 255 515 657 Operating cash flow 341 3,405 5,389 5,810 Capex (902) (5,549) (4,791) (2,644) Free cash flow to the firm (561) (2,144) 598 3,166 Disposals of fixed assets — — — — Acquisitions — — — — Divestments — — — — Associate investments — — — — Other investment/(outflows) 393.2 (322.5) (516.6) (546.4) Investing cash flow (509) (5,872) (5,308) (3,191) Equity raised — — — — Dividends paid (1,279) (1,943) (1,877) (2,039) Net borrowings 6 2,254 297 — Other financing cash flow 4,375 2,809 1,111 (3,795) Financing cash flow 3,102 3,120 (469) (5,833) Total cash flow 2,934 654 (387) (3,214) Adjustments — — — — Net change in cash 2,934 654 (387) (3,214)
Balance sheet (Rp bn) 12/14A 12/15E 12/16E 12/17E
Cash & cash equivalents 14,823 13,858 14,209 17,325 Current receivables 4,340 4,615 5,070 5,642 Inventories 8,455 8,635 9,181 9,946 Other current assets 13,378 14,581 14,720 14,868 Current assets 40,996 41,688 43,180 47,782 Property, plant & equip. 22,011 25,489 27,862 27,902 Investments 1,878 1,966 1,966 1,966 Intangibles 6,738 6,738 6,738 6,738 Other non-current assets 14,316 15,082 16,087 17,077 Total assets 85,939 90,963 95,834 101,465
Accounts payable 5,151 4,802 4,991 5,456 Short-term debt 6,173 9,339 9,339 9,339 Current provisions — — — — Other current liabilities 6,453 6,796 7,049 7,328 Current liabilities 17,777 20,936 21,380 22,123 Long-term debt 16,838 16,107 16,107 16,107 Non-current provisions — — — — Other non-current liab. 10,096 10,684 11,356 12,126 Total liabilities 44,711 47,726 48,842 50,355 Shareholders' equity 25,700 27,511 29,712 31,977 Minority interests 15,528 15,726 17,280 19,133 Total liabilities & equity 85,939 90,963 95,834 101,465
Per share data 12/14A 12/15E 12/16E 12/17E
Shares (wtd avg.) (mn) 8,780 8,780 8,780 8,780 EPS (Credit Suisse) (Rp) 443 427 416 442 DPS (Rp) 142 221 214 232 BVPS (Rp) 2,927 3,133 3,384 3,642 Operating CFPS (Rp) 39 388 614 662
Key ratios and valuation 12/14A 12/15E 12/16E 12/17E
Growth(%) Sales revenue 10.2 1.3 9.9 10.7 EBIT 17.9 7.2 7.1 4.1 Net profit 55.2 (3.4) (2.6) 6.2 EPS 55.2 (3.4) (2.6) 6.2 Margins (%) EBITDA 15.2 14.4 14.4 13.8 EBIT 11.3 12.0 11.7 11.0 Pre-tax profit 9.8 10.2 10.2 9.8 Net profit 6.11 5.83 5.17 4.95 Valuation metrics (x) P/E 16.3 16.9 17.4 16.3 P/B 2.47 2.31 2.14 1.98 Dividend yield (%) 1.97 3.06 2.96 3.21 P/CF 186 19 12 11 EV/sales 1.13 1.16 1.06 0.91 EV/EBITDA 7.40 8.10 7.32 6.64 EV/EBIT 9.9 9.7 9.0 8.3 ROE analysis (%) ROE 15.8 14.1 12.8 12.6 ROIC 10.6 10.5 10.4 10.4 Asset turnover (x) 0.74 0.71 0.74 0.77 Interest burden (x) 0.86 0.85 0.87 0.89 Tax burden (x) 0.71 0.71 0.71 0.71 Financial leverage (x) 2.08 2.10 2.04 1.99 Credit ratios Net debt/equity (%) 19.9 26.8 23.9 15.9 Net debt/EBITDA (x) 0.85 1.25 1.10 0.75 Interest cover (x) 8.4 9.8 11.9 14.6
Source: Company data, Thomson Reuters, Credit Suisse estimates.
0
2
4
6
8
10
12
14
16
18
20
2011 2012 2013 2014 2015 2016
12MF P/E multiple
0.0
0.5
1.0
1.5
2.0
2.5
3.0
3.5
2011 2012 2013 2014 2015 2016
12MF P/B multiple
Source: IBES

05 April 2016
Indonesia Consumer Survey 2016 90
Asia Pacific / Indonesia
Department Stores
Matahari Department Store
(LPPF.JK / LPPF IJ) COMPANY UPDATE
Riding the improving consumer trend
■ Exposure to the emerging consumer. Matahari Department Store targets the growing base of the Indonesian middle-class segment, currently about 125 mn people (53% of the population). Matahari sells quality designed fashion products at attractive price points for Indonesian consumers. Thanks to its >90% domestic source and its 'value-for-money' promotions strategy to always sell affordable products to customers, the company delivered better-than-peers same-store sales growth (SSSG) despite last year's Indonesian economic downturn.
■ Improving consumer trend. Recent data points have shown that Indonesia's consumer sentiment and consumption trend have improved since 4Q15. More importantly, recovery has been driven by volumes, and not only price increases. Matahari saw a similar uptick trend in its SSG to 7.6% YoY, largely driven by volume (5.3%). We expect broader macro improvement to continue in 2016, supported by investment and government spending. Being the largest stock in Indonesia’s consumer discretionary space, Matahari is one of the beneficiaries of the improving consumer demand trend.
■ Testing the waters on e-commerce. Matahari has effectively owned a 10% stake in Lippo group's e-commerce venture, MatahariMall. An interesting point to note is that it will book this investment under the cost method as an asset in the balance sheet. Thus, there will be no share of losses in the P/L. This should ease investors' concern that MatahariMall's initial losses will drag LPPF's earnings. The department store will be supplying its private label goods exclusively to MatahariMall, leveraging on e-commerce opportunities, and management has control over the products' pricing.
■ OUTPERFORM rating. We favour Matahari Department Store within
Indonesia's consumer discretionary sector. Our Rp19,400 target price is
based on 26x FY16 P/E, in line with its three-year historical average, and at
a premium to peers due to its higher earnings growth (17% CAGR in the
next two years), and higher ROE.
Share price performance
80
100
120
140
12000
14000
16000
18000
20000
Apr-14 Aug-14 Dec-14 Apr-15 Aug-15 Dec-15
Price (LHS) Rebased Rel (RHS)
The price relative chart measures performance against the JSX
COMPOSITE INDEX which closed at 4843.19 on 01/04/16
On 01/04/16 the spot exchange rate was Rp13155./US$1
Performance over 1M 3M 12M Absolute (%) 3.0 3.3 -5.2 — Relative (%) 2.8 -2.2 6.0 —
Financial and valuation metrics
Year 12/15A 12/16E 12/17E 12/18E Revenue (Rp bn) 9,006.9 10,402.2 11,752.5 13,500.5 EBITDA (Rp bn) 2,563.6 2,964.7 3,343.5 3,912.2 EBIT (Rp bn) 2,329.5 2,714.4 3,078.7 3,631.6 Net profit (Rp bn) 1,780.8 2,172.5 2,514.8 2,981.2 EPS (CS adj.) (Rp) 610 745 862 1,022 Change from previous EPS (%) n.a. 0.0 0.0 0.0 Consensus EPS (Rp) n.a. 739 873 971 EPS growth (%) 25.5 22.0 15.8 18.5 P/E (x) 29.8 24.4 21.1 17.8 Dividend yield (%) 1.6 2.4 2.9 3.3 EV/EBITDA (x) 20.3 17.2 15.0 12.5 P/B (x) 11.3 9.5 8.0 6.8 ROE (%) 42.4 42.3 41.2 41.4 Net debt/equity (%) Net cash Net cash Net cash Net cash
Source: Company data, Thomson Reuters, Credit Suisse estimates.
Rating OUTPERFORM Price (01 Apr 16, Rp) 18,175 Target price (Rp) 19,400¹ Upside/downside (%) 6.7 Mkt cap (Rp bn) 53,033.2 (US$4.0 bn) Enterprise value (Rp bn) 51,137 Number of shares (mn) 2,917.92 Free float (%) 65.3 52-week price range 19,425.0-14,650.0 ADTO - 6M (US$ mn) 5.3
*Stock ratings are relative to the coverage universe in each
analyst's or each team's respective sector.
¹Target price is for 12 months.
Research Analysts
Priscilla Tjitra
62 21 2553 7906
Ella Nusantoro
62 21 255 37917

05 April 2016
Indonesia Consumer Survey 2016 91
Matahari Department Store LPPF.JK / LPPF IJ
Price (01 Apr 16): Rp18,175, Rating: OUTPERFORM, Target Price: Rp19,400, Analyst: Priscilla Tjitra
Target price scenario
Scenario TP %Up/Dwn Assumptions Upside 26,000.00 43.05 assume 12% SSG and 13 new stores p.a Central Case 19,400.00 6.74 assume 10% SSG and 12 new stores p.a Downside 15,000.00 (17.47) assume 7% SSG and 10 new stores p.a
Key earnings drivers 12/15A 12/16E 12/17E 12/18E
GDP growth (%) 4.80 4.80 4.80 4.80 Inflation (%) 6.36 5.00 5.00 5.00 SSG (%) 6.80 7.50 8.80 8.80 No. of new stores 11.0 7.0 8.0 8.0 — — — —
Income statement (Rp bn) 12/15A 12/16E 12/17E 12/18E
Sales revenue 9,007 10,402 11,753 13,501 Cost of goods sold 3,336 3,871 4,375 5,009 SG&A 3,342 3,817 4,299 4,860 Other operating exp./(inc.) (234.1) (250.3) (264.8) (280.6) EBITDA 2,564 2,965 3,344 3,912 Depreciation & amortisation 234.1 250.3 264.8 280.6 EBIT 2,330 2,714 3,079 3,632 Net interest expense/(inc.) 92.8 (35.5) (64.8) (94.9) Non-operating inc./(exp.) 8.1 — — — Associates/JV — — — — Recurring PBT 2,245 2,750 3,144 3,727 Exceptionals/extraordinaries — — — — Taxes 464.0 577.5 628.7 745.3 Profit after tax 1,781 2,172 2,515 2,981 Other after tax income — — — — Minority interests — — — — Preferred dividends — — — — Reported net profit 1,781 2,173 2,515 2,981 Analyst adjustments — — — — Net profit (Credit Suisse) 1,781 2,173 2,515 2,981
Cash flow (Rp bn) 12/15A 12/16E 12/17E 12/18E
EBIT 2,330 2,714 3,079 3,632 Net interest — — — — Tax paid — — — — Working capital 204.8 165.4 174.1 195.6 Other cash & non-cash items (285.3) (291.7) (299.1) (369.8) Operating cash flow 2,249 2,588 2,954 3,457 Capex (384.7) (404.4) (364.2) (393.7) Free cash flow to the firm 1,864 2,184 2,590 3,064 Disposals of fixed assets — — — — Acquisitions — — — — Divestments — — — — Associate investments — — — — Other investment/(outflows) (78.4) (58.5) (95.9) (128.3) Investing cash flow (463.1) (462.9) (460.1) (522.1) Equity raised — — — — Dividends paid (851) (1,247) (1,521) (1,760) Net borrowings (689.2) — — — Other financing cash flow (84.5) 68.8 41.3 45.4 Financing cash flow (1,625) (1,178) (1,479) (1,715) Total cash flow 161 947 1,014 1,220 Adjustments — — — — Net change in cash 161 947 1,014 1,220
Balance sheet (Rp bn) 12/15A 12/16E 12/17E 12/18E
Cash & cash equivalents 947 1,896 2,907 4,123 Current receivables 76.0 113.8 113.8 139.2 Inventories 1,008 1,154 1,305 1,496 Other current assets 242.4 259.4 293.1 336.6 Current assets 2,273 3,423 4,619 6,094 Property, plant & equip. 921 1,075 1,174 1,287 Investments — — — — Intangibles — — — — Other non-current assets 695.5 754.0 849.9 978.3 Total assets 3,889 5,252 6,643 8,360 Accounts payable 1,704 1,973 2,224 2,541 Short-term debt — — — — Current provisions — — — — Other current liabilities 735 832 940 1,078 Current liabilities 2,439 2,805 3,164 3,619 Long-term debt — — — — Non-current provisions — — — — Other non-current liab. 346.1 414.9 456.2 501.6 Total liabilities 2,785 3,220 3,620 4,121 Shareholders' equity 4,678 5,604 6,598 7,819 Minority interests — — — — Total liabilities & equity 3,891 5,252 6,646 8,368
Per share data 12/15A 12/16E 12/17E 12/18E
Shares (wtd avg.) (mn) 2,918 2,918 2,918 2,918 EPS (Credit Suisse) (Rp) 610 745 862 1,022 DPS (Rp) 292 427 521 603 BVPS (Rp) 1,603 1,921 2,261 2,680 Operating CFPS (Rp) 771 887 1,012 1,185
Key ratios and valuation 12/15A 12/16E 12/17E 12/18E
Growth(%) Sales revenue 13.6 15.5 13.0 14.9 EBIT 10.3 16.5 13.4 18.0 Net profit 25.5 22.0 15.8 18.5 EPS 25.5 22.0 15.8 18.5 Margins (%) EBITDA 28.5 28.5 28.4 29.0 EBIT 25.9 26.1 26.2 26.9 Pre-tax profit 24.9 26.4 26.7 27.6 Net profit 19.8 20.9 21.4 22.1 Valuation metrics (x) P/E 29.8 24.4 21.1 17.8 P/B 11.3 9.5 8.0 6.8 Dividend yield (%) 1.61 2.35 2.87 3.32 P/CF 23.6 20.5 18.0 15.3 EV/sales 5.78 4.92 4.27 3.62 EV/EBITDA 20.3 17.2 15.0 12.5 EV/EBIT 22.4 18.8 16.3 13.5 ROE analysis (%) ROE 42.4 42.3 41.2 41.4 ROIC 1,665 1,451 1,930 2,390 Asset turnover (x) 2.32 1.98 1.77 1.61 Interest burden (x) 0.96 1.01 1.02 1.03 Tax burden (x) 0.79 0.79 0.80 0.80 Financial leverage (x) 3.52 2.58 2.20 1.97 Credit ratios Net debt/equity (%) (85.6) (93.3) (96.1) (97.1) Net debt/EBITDA (x) (0.37) (0.64) (0.87) (1.05) Interest cover (x) 25.1 (76.4) (47.5) (38.3)
Source: Company data, Thomson Reuters, Credit Suisse estimates.
0
5
10
15
20
25
30
35
May-13 Nov-13 May-14 Nov-14 May-15 Nov-15
12MF P/E multiple
0
20
40
60
80
100
120
May-13 Nov-13 May-14 Nov-14 May-15 Nov-15
12MF P/B multiple
Source: IBES

05 April 2016
Indonesia Consumer Survey 2016 92
Asia Pacific / Indonesia
Real Estate Management & Development
Summarecon Agung Tbk
(SMRA.JK / SMRA IJ) COMPANY UPDATE
Strategically established
■ Good track record. SMRA has had a good track record in township development in Indonesia and has been successful in strengthening recurring income through rental income from retail space. Around 80% of its operating income is still generated from the property development segment. SMRA has three main prime property development locations, namely: Kelapa Gading (Jakarta), Serpong and Bekasi (Greater Jakarta).
■ Growing property development. SMRA made its name after successfully
transforming 550 ha of a backwater area in North Jakarta into one of the most prestigious landed residential areas. It then repeated its success in the 750 ha Serpong township, located in West Jakarta. SMRA is now expanding east to the Bekasi area with 523 ha of land bank and also to Bandung and Bogor with 314 ha and 390 ha land bank, respectively. As of December 2015, the company has a total of 1,908 ha land bank available for development, with the two largest being 530 ha in Serpong and 523 ha in Bekasi. The company is currently in the process of acquiring additional land in Bandung and Bogor.
■ 2015 full-year result. Summarecon's FY15 revenue was down 2% YoY,
accounting for 99%/94% of our and consensus estimates. Separately, net profit was down 38% YoY, accounting for 68% of our estimates. 4Q15 recorded the lowest net profit in a decade of Rp48 bn (down 83% QoQ and 91% YoY). This was mainly curbed by higher interest expense on its Rp6.2 tn debt at 10.6% blended cost as well as higher overall operating expenses, i.e., marketing expenses which came from the recently launched Bandung township back in November-2015.
■ SMRA as top pick. We continue to believe that Indonesia property sector should benefit from a falling interest rate environment which should lead banks to lower their lending rate, i.e., mortgage rate to trend south. This will boost mortgage affordability hence be positive for the sector. Among the developers, we like those who (1) are less exposed to foreign debt, (2) have good corporate governance and (3) conservative and strategically positioned.
Share price performance
100
120
140
160
180
1000
1500
2000
Apr-14 Aug-14 Dec-14 Apr-15 Aug-15 Dec-15
Price (LHS) Rebased Rel (RHS)
The price relative chart measures performance against the JSX
COMPOSITE INDEX which closed at 4843.19 on 01/04/16
On 01/04/16 the spot exchange rate was Rp13155./US$1
Performance over 1M 3M 12M Absolute (%) -1.5 -1.8 -10.5 Relative (%) -1.7 -7.3 0.7
Financial and valuation metrics
Year 12/14A 12/15E 12/16E 12/17E Revenue (Rp bn) 5,757.7 5,718.7 6,588.9 7,763.7 EBITDA (Rp bn) 2,305.2 2,130.9 2,400.2 2,745.7 EBIT (Rp bn) 2,096.4 1,910.5 2,154.1 2,470.4 Net attributable profit (Rp bn) 1,385.4 1,280.5 1,514.6 1,825.7 EPS (CS adj.) (Rp) 96 89 105 127 Change from previous EPS (%) n.a. 0.0 0.0 0.0 Consensus EPS (Rp) n.a. 59 91 102 EPS growth (%) 27.2 -7.6 18.3 20.5 P/E (x) 16.9 18.3 15.4 12.8 Dividend yield (%) 1.4 1.5 1.5 1.8 EV/EBITDA (x) 11.3 12.9 11.3 9.6 ROE (%) 27.9 21.5 21.6 22.1 Net debt/equity (%) 40.7 56.4 42.6 28.7 NAV per share (Rp) — — — — Disc./(prem.) to NAV (%) — — — —
Source: Company data, Thomson Reuters, Credit Suisse estimates.
Rating OUTPERFORM Price (01 Apr 16, Rp) 1,620.00 Target price (Rp) 1,960.00¹ Upside/downside (%) 21.0 Mkt cap (Rp bn) 23,371.4 (US$1.8 bn) Enterprise value (Rp bn) 27,555 Number of shares (mn) 14,426.78 Free float (%) 67.7 52-week price range 1,995.0-1,035.0 ADTO - 6M (US$ mn) 3.1
*Stock ratings are relative to the coverage universe in each
analyst's or each team's respective sector.
¹Target price is for 12 months.
Research Analysts
Jahanzeb Naseer
62 21 2553 7977
Laurensius Teiseran
62 21 255 37931

05 April 2016
Indonesia Consumer Survey 2016 93
Summarecon Agung Tbk SMRA.JK / SMRA IJ
Price (01 Apr 16): Rp1,620.00, Rating: OUTPERFORM, Target Price: Rp1,960.00, Analyst: Jahanzeb Naseer
Target price scenario
Scenario TP %Up/Dwn Assumptions Upside 2,450.00 51.23 33% Discount (2 STDEV away) Central Case 1,960.00 20.99 45% Discount (1 STDEV away) Downside 1,580.00 (2.47) 57% Discount (long term avg)
Key earnings drivers 12/14A 12/15E 12/16E 12/17E
Real GDP growth (%) 5.02 4.61 5.23 — Inflation rate (%) 6.39 6.47 4.69 — Interest rate (%) 7.75 7.50 6.75 — Marketing sales (Rp bn) 4,601 4,172 4,773 5,583
Income statement (Rp bn) 12/14A 12/15E 12/16E 12/17E
Sales revenue 5,758 5,719 6,589 7,764 Cost of goods sold 2,700 2,842 3,309 3,961 SG&A 961 966 1,126 1,333 Other operating exp./(inc.) (208.8) (220.5) (246.1) (275.3) EBITDA 2,305 2,131 2,400 2,746 Depreciation & amortisation 208.8 220.5 246.1 275.3 EBIT 2,096 1,911 2,154 2,470 Net interest expense/(inc.) 158.9 268.7 260.2 208.9 Non-operating inc./(exp.) (0.89) — — — Associates/JV — — — — Recurring PBT 1,937 1,642 1,894 2,262 Exceptionals/extraordinaries — — — — Taxes 318.8 266.1 335.6 406.5 Profit after tax 1,618 1,376 1,558 1,855 Other after tax income — — — — Revaluations — — — — Minority interests 232.4 95.2 43.6 29.4 Preferred dividends — — — — Reported net profit 1,385 1,281 1,515 1,826 Analyst adjustments — — — — Net profit (Credit Suisse) 1,385 1,281 1,515 1,826
Cash flow (Rp bn) 12/14A 12/15E 12/16E 12/17E
EBIT 2,096 1,910 2,154 2,470 Net interest — — — — Tax paid — — — — Working capital (2,267) (1,018) 96 139 Other cash & non-cash items (502.2) (409.5) (393.3) (369.5) Operating cash flow (673) 483 1,857 2,240 Capex (1,110) (491) (529) (546) Free cash flow to the firm (1,783) (9) 1,328 1,694 Acquisitions — — — — Divestments — — — — Associate investments — — — — Other investment/(outflows) — — — — Investing cash flow (3,385) (2,269) (1,633) (1,749) Equity raised — — — — Dividends paid (331.4) (346.4) (358.5) (424.1) Net borrowings 1,881 1,018 (148) (176) Other financing cash flow 33.4 (273.2) (289.6) (335.7) Financing cash flow 1,583 398 (796) (936) Total cash flow (2,475) (1,388) (573) (445) Adjustments — — — — Net change in cash (2,475) (1,388) (573) (445)
Balance sheet (Rp bn) 12/14A 12/15E 12/16E 12/17E
Cash & cash equivalents 1,771 1,217 1,566 2,164 Current receivables 87.2 108.7 125.2 155.3 Inventories 3,341 3,547 4,087 4,488 Properties under development — — — — Other current assets 656.3 712.3 791.8 821.6 Current assets 5,855 5,584 6,569 7,628 Property, plant & equip. 368.1 371.9 337.0 263.9 Properties under development — — — — Investment properties 4,019 4,286 4,603 4,947 Investment in Associates/JV — — — — Intangibles 7.0 8.0 9.0 9.0 Other non-current assets 9,643 11,512 12,694 14,100 Total assets 15,872 17,476 19,610 22,002 Accounts payable 222.3 244.4 248.2 269.3 Short-term debt 506.0 823.7 713.6 614.3 Current provisions — — — — Other current liabilities 2,966 2,522 3,331 4,065 Current liabilities 3,694 3,591 4,293 4,949 Long-term debt 3,876 4,576 4,538 4,461 Non-current provisions — — — — Other non-current liab. 1,886 1,885 2,129 2,453 Total liabilities 9,456 10,052 10,961 11,863 Shareholders' equity 5,484 6,418 7,575 8,976 Minority interests 993 1,056 1,151 1,246 Total liabilities & equity 15,872 17,476 19,610 22,002
Per share data 12/14A 12/15E 12/16E 12/17E
Shares (wtd avg.) (mn) 14,427 14,427 14,427 14,427 EPS (Credit Suisse) (Rp) 96 89 105 127 DPS (Rp) 23.0 24.0 24.9 29.4 BVPS (Rp) 380 445 525 622 NAV per share (Rp) — — — —
Key ratios and valuation 12/14A 12/15E 12/16E 12/17E
Growth(%) Sales revenue 26.6 (0.7) 15.2 17.8 EBIT 28.6 (8.9) 12.7 14.7 Net profit 27.2 (7.6) 18.3 20.5 EPS 27.2 (7.6) 18.3 20.5 Margins (%) EBITDA 40.0 37.3 36.4 35.4 EBIT 36.4 33.4 32.7 31.8 Pre-tax profit 33.6 28.7 28.7 29.1 Net profit 24.1 22.4 23.0 23.5 Valuation metrics (x) P/E 16.9 18.3 15.4 12.8 P/B 4.26 3.64 3.09 2.60 Dividend yield (%) 1.42 1.48 1.53 1.81 EV/sales 4.51 4.82 4.11 3.39 EV/EBITDA 11.3 12.9 11.3 9.6 EV/EBIT 12.4 14.4 12.6 10.6 ROE analysis (%) ROE 27.9 21.5 21.6 22.1 ROIC 25.6 15.5 14.8 16.0 Asset turnover (x) 0.36 0.33 0.34 0.35 Interest burden (x) 0.92 0.86 0.88 0.92 Tax burden (x) 0.84 0.84 0.82 0.82 Financial leverage (x) 2.47 2.35 2.27 2.17 Credit ratios Net debt/equity (%) 40.7 56.4 42.6 28.7 Net debt/EBITDA (x) 1.13 1.96 1.54 1.06 Interest cover (x) 13.2 7.1 8.3 11.8
Source: Company data, Thomson Reuters, Credit Suisse estimates.
0
5
10
15
20
25
30
2011 2012 2013 2014 2015 2016
12MF P/E multiple
0
1
2
3
4
5
6
2011 2012 2013 2014 2015 2016
12MF P/B multiple
Source: IBES

05 April 2016
Indonesia Consumer Survey 2016 94
Asia Pacific / Indonesia
Regional Banks
Bank Tabungan Pensiunan Nasional Tbk (BTPN.JK / BTPN IJ)
COMPANY UPDATE
Benefitting from falling interest rate
■ Company background. Bank Tabungan Pensiunan Nasional (BTPN) was
established in 1958. Outside the top four banks in Indonesia, BTPN probably
has the best quality of management among the others. On the asset side, it
had the good luck of tying up one of the few banks used by the government
to distribute pension to its retired employees. Indonesia currently has around
3 mn retired government workers, with BTPN providing payment services of
monthly pensions to around 700k, translating into a 23.0% market share.
Aside from distributing, BTPN lends to pensioners who constitute two-third of
its loan book—this book is extremely profitable with virtually zero NPLs. After
TPG bought BTPN in 2008, the bank ventured into micro lending which now
accounts for one-quarter of its loans.
■ Massive underperformance in 2015. The stock price was hammered down
by 39% in 2015. To some extent like Danamon, BTPN’s business model has
been hit on most fronts. The fundamental reason for the derating was the
decline in ROA and earnings. ROA fell from 3.5% levels of 2011-13 to 2.31%
last year. Earnings growth was negative in 2014 and 2015 and ROEs fell
from the 2007-13 average of 27% to 14-15% levels. Loan growth faltered
because of increasing competition in the pension loan segment and as the
bank became cautious on its micro book on account of rising NPLs.
Operating costs have been rising as BTPN expands the physical branch
network as well as invests in digital technology and in an agent network so
as to access new customer segments.
■ Outperformance in 2016? The stock is up 17% YTD mainly driven by the
management buy-back in February. We expect the bank to be a beneficiary
in a falling interest rate environment, as it has the weakest deposit franchise
and consequently highest cost of funding within our coverage. We expect
earnings growth to rebound this year (+19% YoY) after two years of
consecutive decline. The stock seems attractive on valuations (1.0x P/B and
7.6x P/E 2016E) for the given ROAs and mid-teen ROEs.
Share price performance
40
60
80
100
120
2000
3000
4000
5000
6000
Apr-14 Aug-14 Dec-14 Apr-15 Aug-15 Dec-15
Price (LHS) Rebased Rel (RHS)
The price relative chart measures performance against the JSX
COMPOSITE INDEX which closed at 4843.19 on 01/04/16
On 01/04/16 the spot exchange rate was Rp13155./US$1
Performance over 1M 3M 12M Absolute (%) 1.3 16.5 -33.5 Relative (%) 1.1 11.0 -22.2
Financial and valuation metrics
Year 12/15A 12/16E 12/17E 12/18E Pre-prov op profit (Rp bn) 3,121.7 3,484.9 3,936.4 4,339.7 Pre-tax profit (Rp bn) 2,432.6 2,812.8 3,240.7 3,547.9 Net attributable profit (Rp bn) 1,803.4 2,141.7 2,467.6 2,701.5 EPS (CS adj.) (Rp) 308.78 366.72 422.52 462.56 Change from previous EPS (%) n.a. 0.0 0.0 0.0 Consensus EPS (Rp) n.a. 390 435 463 EPS growth (%) -2.4 18.8 15.2 9.5 P/E (x) 9.1 7.6 6.6 6.0 Dividend yield (%) 0.0 0.0 0.0 0.0 CS adj. BVPS (Rp) 2,324.5 2,706.2 3,128.7 3,591.3 P/B (x) 1.20 1.03 0.89 0.78 ROE (%) 14.2 14.6 14.5 13.8 ROA (%) 2.3 2.5 2.5 2.4 Tier 1 ratio (%) 22.9 24.8 24.9 25.2
Source: Company data, Thomson Reuters, Credit Suisse estimates.
Rating OUTPERFORM Price (01 Apr 16, Rp) 2,795.00 Target price (Rp) 3,500.00¹ Upside/downside (%) 25.2 Mkt cap (Rp bn) 16,160.4 (US$1.2 bn) Number of shares (mn) 5,781.88 Free float (%) 34.7 52-week price range 4,300.0-2,035.0 ADTO - 6M (US$ mn) 0.15
*Stock ratings are relative to the coverage universe in each
analyst's or each team's respective sector.
¹Target price is for 12 months.
Research Analysts
Sanjay Jain
65 6306 0668

05 April 2016
Indonesia Consumer Survey 2016 95
Bank Tabungan Pensiunan Nasional Tbk BTPN.JK / BTPN IJ
Price (01 Apr 16): Rp2,795.00, Rating: OUTPERFORM, Target Price: Rp3,500.00, Analyst: Sanjay Jain
Target price scenario
Scenario TP %Up/Dwn Assumptions Upside Central Case 3,500.00 25.22 Downside
Key earnings drivers 12/15A 12/16E 12/17E 12/18E
Loans growth (%) 12.9 13.2 14.0 — Net interest margin (%) 10.5 10.7 10.8 — Fee growth (%) 2.6 18.1 14.2 — Cost to income ratio (%) 62.3 62.8 63.1 — P&L provision (as % of loans) 1.27 1.10 1.00 —
Valuation 12/15A 12/16E 12/17E 12/18E
EPS growth (%) (2.4) 18.8 15.2 9.5 P/E (x) 9.1 7.6 6.6 6.0 P/B (x) 1.20 1.03 0.89 0.78 P/TB (x) 1.20 1.03 0.89 0.78 Dividend yield (%) — — — —
Income statement (Rp bn) 12/15A 12/16E 12/17E 12/18E
Interest income 13,004 13,786 15,372 17,400 Interest expense 5,308 5,109 5,483 6,237 Net interest income 7,696 8,677 9,889 11,163 Fee and commission income 277.8 305.6 351.4 404.2 Trading income — — — — Insurance income (& premiums) — — — — Other income 304.1 381.7 433.6 495.0 Total non-interest income 581.9 687.3 785.1 899.1 Total income 8,278 9,364 10,674 12,062 Personal expense 2,764 3,151 3,592 4,095 Other expenses 2,392 2,728 3,145 3,627 Total expenses 5,156 5,879 6,738 7,722 Pre-provision profit 3,122 3,485 3,936 4,340 Loan loss provisions 662.0 643.4 663.6 755.6 Operating profit 2,460 2,841 3,273 3,584 Associates/JV — — — — Other non-operating inc./(exp.) (27.1) (28.7) (32.0) (36.3) Pre-tax profit 2,433 2,813 3,241 3,548 Taxes 680.0 731.3 842.6 922.5 Net profit before minorities 1,753 2,081 2,398 2,625 Minority interests (50.8) (60.3) (69.5) (76.0) Preferred dividends — — — — Exceptionals/extraordinaries — — — — Reported net profit 1,803 2,142 2,468 2,702 Analyst adjustments — — — — Net profit (Credit Suisse) 1,803 2,142 2,468 2,702
Balance sheet (Rp bn) 12/15A 12/16E 12/17E 12/18E
Assets Gross customer loans 59,207 67,035 76,428 87,216 Risk provisions 543.6 517.4 663.6 755.6 Net customer loans 58,664 66,518 75,765 86,461 Interbank Loans 1,767 1,943 2,138 2,351 Investment & Securities 15,296 16,826 18,508 20,359 Cash & cash equivalents 1,352 2,064 3,284 4,515 Fixed Assets 876.2 876.2 876.2 876.2 Intangibles — — — — Other assets 3,084 3,687 4,204 4,797 Total assets 81,040 91,914 104,775 119,359 Liabilities Interbank deposits — — — — Customer deposits 60,273 68,776 78,690 90,052 Total deposits 60,273 68,776 78,690 90,052 Other liabilities 6,842 6,985 7,464 7,986 Total liabilities 67,116 75,761 86,154 98,038 Shareholders' equity 13,576 15,805 18,273 20,974 Minority interests 347.8 347.8 347.8 347.8 Preferred stock — — — — Total liabilities & equity 81,040 91,914 104,775 119,359
Per share data 12/15A 12/16E 12/17E 12/18E
Shares (wtd avg.) (mn) 5,840 5,840 5,840 5,840 EPS (Credit Suisse) (Rp) 308.78 366.72 422.52 462.56 BVPS (Rp) 2,325 2,706 3,129 3,591 Tangible BVPS (Rp) 2,325 2,706 3,129 3,591 DPS (Rp) — — — —
Key ratios 12/15A 12/16E 12/17E 12/18E
Profitability and margins (%)
ROE stated 14.2 14.6 14.5 13.8 ROE - CS adj. 14.2 14.6 14.5 13.8 ROA - CS adj. 2.31 2.48 2.51 2.41 Gearing (x) 6.15 5.89 5.77 5.71 Asset quality (%) NPL/ gross loans 0.62 0.59 0.62 0.64 B/S loan loss coverage — — — — Loan/ deposit ratio 97.3 96.7 96.3 96.0 Capital ratios (%) Capital adequacy ratio 23.8 25.8 25.9 26.3 Tier 1 ratio 22.9 24.8 24.9 25.2 Equity Tier 1 ratio 22.9 24.8 24.9 25.2 Growth(%) Revenue 8.8 13.1 14.0 13.0 Operating expense 14.5 14.0 14.6 14.6 Pre-provision profit 0.5 11.6 13.0 10.2 Net profit (2.4) 18.8 15.2 9.5 Deposit 13.0 14.1 14.4 14.4
Source: Company data, Thomson Reuters, Credit Suisse estimates.
0
2
4
6
8
10
12
14
16
18
2011 2012 2013 2014 2015 2016
12MF P/E multiple
0.0
0.5
1.0
1.5
2.0
2.5
3.0
3.5
4.0
2011 2012 2013 2014 2015 2016
12MF P/B multiple
Source: IBES

05 April 2016
Indonesia Consumer Survey 2016 96
Asia Pacific / Indonesia
Integrated Telecommunication Services
Link Net Tbk
(LINK.JK / LINK IJ) COMPANY UPDATE
High growth, high return on capital
■ An underpenetrated market. There is plenty of room for growth in the
Indonesian broadband market. Indonesia's total broadband subscriber base
(i.e., including PT Telkom's xDSL customers) reached only 4.5 mn in
December 2015. This represents just 7.3% penetration of Indonesia's 62.3
mn households. Focusing only on the 1.1 mn high-speed (i.e. >3 Mbps)
broadband customers in Indonesia, the penetration rate was just 1.8% of
households. We expect that as the market develops, competitors will learn to
target their rollouts in greenfield areas that are not yet covered by an existing
player (such as Link Net), since this will result in a much higher return on
their investment.
■ Cherry-picking strategy. Furthermore, while total overall subscriber and
revenue shares are crucial in the cellular sector, given the need for basic
nationwide 'coverage' capex, in fixed broadband the critical factor is the
penetration of homes passed due to high rollout costs on a per-home basis.
Given this, Link Net's 'cherry-picking' strategy looks appropriate. Indeed, Link
Net's management has continually stated that 240,000 new homes passed per
annum is a sensible pace of rollout, given scarce engineering resources and
issues procuring local permits. Looking at the MNC Kabel's (Not listed) rollout
experience in 2015, and even that of PT Telkom, this seems to ring true.
■ Buy backs are a sensible use of cash. Link Net has announced that the
board has resolved to launch a share buyback programme. The resolution
allows Link Net to buy back up to 10% of its share capital, or 304.3 mn
shares, and purchases in the open market can commence following the
AGM on 15 April. We note that 304.3 mn shares represents 30.3% of the
free float, and therefore this buyback proposal is very material in size.
■ Valuation. Link Net's FY15 growth rate of 20.1% for top line and 14.7% in
earnings stands out relatively strong given Indonesia's poor macro backdrop
in 2015. Furthermore, that growth, combined with sharp share price declines
over the last 12 months, puts Link Net on very attractive-looking forward
multiples. OUTPERFORM rating maintained. Share price performance
0
100
200
300
400
2000
4000
6000
8000
Jun-14 Oct-14 Feb-15 Jun-15 Oct-15 Feb-16
Price (LHS) Rebased Rel (RHS)
The price relative chart measures performance against the JSX
COMPOSITE INDEX which closed at 4843.19 on 01/04/16
On 01/04/16 the spot exchange rate was Rp13155./US$1
Performance over 1M 3M 12M Absolute (%) 8.2 0.9 -32.2 — Relative (%) 8.0 -4.6 -20.9 —
Financial and valuation metrics
Year 12/15A 12/16E 12/17E 12/18E Revenue (Rp bn) 2,564.0 3,101.7 3,821.6 4,579.7 EBITDA (Rp bn) 1,450.3 1,767.7 2,219.4 2,696.2 EBIT (Rp bn) 935.3 1,117.4 1,461.3 1,829.6 Net profit (Rp bn) 640.1 845.0 1,188.3 1,498.6 EPS (CS adj.) (Rp) 210 278 390 492 Change from previous EPS (%) n.a. 0.0 0.0 0.0 Consensus EPS (Rp) n.a. 257 319 407 EPS growth (%) 14.4 32.0 40.6 26.1 P/E (x) 19.2 14.5 10.3 8.2 Dividend yield (%) 0.0 1.7 2.9 4.9 EV/EBITDA (x) 8.3 6.7 5.1 4.0 P/B (x) 3.4 2.8 2.4 2.0 ROE (%) 19.1 21.1 25.0 26.6 Net debt/equity (%) Net cash Net cash Net cash Net cash
Source: Company data, Thomson Reuters, Credit Suisse estimates.
Rating OUTPERFORM Price (01 Apr 16, Rp) 4,035.00 Target price (Rp) 8,300.00¹ Upside/downside (%) 105.7 Mkt cap (Rp bn) 12,277.09 (US$0.93 bn) Enterprise value (Rp bn) 11,782 Number of shares (mn) 3,042.65 Free float (%) 33.0 52-week price range 6,225.0-2,920.0 ADTO - 6M (US$ mn) 0.33
*Stock ratings are relative to the coverage universe in each
analyst's or each team's respective sector.
¹Target price is for 12 months.
[V] = Stock considered volatile (see Disclosure Appendix).
Research Analysts
Colin McCallum, CA
852 2101 6514

05 April 2016
Indonesia Consumer Survey 2016 97
Link Net Tbk LINK.JK / LINK IJ
Price (01 Apr 16): Rp4,035.00, Rating: OUTPERFORM [V], Target Price: Rp8,300.00, Analyst: Colin McCallum
Target price scenario
Scenario TP %Up/Dwn Assumptions Upside 8,643.00 114.20 FY14 EV/EBITDA +1 Central Case 8,300.00 105.70 FY14 EV/EBITDA 20.9X Downside 7,851.00 94.57 FY14 EV/EBITDA -1
Key earnings drivers 12/15A 12/16E 12/17E 12/18E
Homes Passed (000s) 1,670 1,910 2,170 2,438 Residential ARPU (Rp 000s/month)
221.2 221.2 221.2 221.2 — — — — — — — — — — — —
Income statement (Rp bn) 12/15A 12/16E 12/17E 12/18E
Sales revenue 2,564 3,102 3,822 4,580 Cost of goods sold 569 695 857 1,024 SG&A 544.0 638.6 745.0 859.1 Other operating exp./(inc.) 0.65 — — — EBITDA 1,450 1,768 2,219 2,696 Depreciation & amortisation 515.0 650.3 758.1 866.7 EBIT 935 1,117 1,461 1,830 Net interest expense/(inc.) 57.5 (9.3) (24.1) (43.7) Non-operating inc./(exp.) — — — — Associates/JV (20.9) — — — Recurring PBT 857 1,127 1,485 1,873 Exceptionals/extraordinaries — — — — Taxes 216.7 281.7 297.1 374.7 Profit after tax 640 845 1,188 1,499 Other after tax income — — — — Minority interests 0.15 — — — Preferred dividends — — — — Reported net profit 640 845 1,188 1,499 Analyst adjustments — — — — Net profit (Credit Suisse) 640 845 1,188 1,499
Cash flow (Rp bn) 12/15A 12/16E 12/17E 12/18E
EBIT 935 1,117 1,461 1,830 Net interest 7.0 9.3 24.1 43.7 Tax paid (271.0) (281.7) (297.1) (374.7) Working capital (16.9) (47.2) (63.2) (66.6) Other cash & non-cash items 515.0 650.3 758.1 866.7 Operating cash flow 1,169 1,448 1,883 2,299 Capex (1,108) (1,009) (1,093) (1,189) Free cash flow to the firm (32.4) 270.4 433.7 510.0 Disposals of fixed assets — — — — Acquisitions — — — — Divestments 22.0 — — — Associate investments (19.0) — — — Other investment/(outflows) — — — — Investing cash flow (1,105) (1,009) (1,093) (1,189) Equity raised — — — — Dividends paid — (169.0) (356.5) (599.4) Net borrowings (81.2) — — — Other financing cash flow — — — — Financing cash flow (81.2) (169.0) (356.5) (599.4) Total cash flow (16.9) 270.4 433.7 510.0 Adjustments — — — — Net change in cash (16.9) 270.4 433.7 510.0
Balance sheet (Rp bn) 12/15A 12/16E 12/17E 12/18E
Cash & cash equivalents 326 596 1,030 1,540 Current receivables 279.4 337.9 416.4 499.0 Inventories — — — — Other current assets — — — — Current assets 605 934 1,446 2,039 Property, plant & equip. 3,493 3,851 4,186 4,509 Investments 102.6 102.6 102.6 102.6 Intangibles 66.8 66.8 66.8 66.8 Other non-current assets 171.1 179.0 189.5 200.5 Total assets 4,438 5,134 5,991 6,917 Accounts payable 578.0 578.0 578.0 578.0 Short-term debt 69.8 20.2 20.2 20.2 Current provisions — — — — Other current liabilities — — — — Current liabilities 647.8 598.2 598.2 598.2 Long-term debt 31.4 81.0 81.0 81.0 Non-current provisions — — — — Other non-current liab. 91.6 110.8 136.5 163.6 Total liabilities 770.8 790.0 815.7 842.8 Shareholders' equity 3,668 4,344 5,175 6,075 Minority interests 0.33 0.33 0.33 0.33 Total liabilities & equity 4,439 5,134 5,991 6,918
Per share data 12/15A 12/16E 12/17E 12/18E
Shares (wtd avg.) (mn) 3,043 3,043 3,043 3,043 EPS (Credit Suisse) (Rp) 210 278 390 492 DPS (Rp) — 69 117 197 BVPS (Rp) 1,205 1,427 1,700 1,996 Operating CFPS (Rp) 384 476 619 755
Key ratios and valuation 12/15A 12/16E 12/17E 12/18E
Growth(%) Sales revenue 20.1 21.0 23.2 19.8 EBIT 11.5 19.5 30.8 25.2 Net profit 14.4 32.0 40.6 26.1 EPS 14.4 32.0 40.6 26.1 Margins (%) EBITDA 56.6 57.0 58.1 58.9 EBIT 36.5 36.0 38.2 39.9 Pre-tax profit 33.4 36.3 38.9 40.9 Net profit 25.0 27.2 31.1 32.7 Valuation metrics (x) P/E 19.2 14.5 10.3 8.2 P/B 3.35 2.83 2.37 2.02 Dividend yield (%) — 1.72 2.90 4.88 P/CF 10.5 8.5 6.5 5.3 EV/sales 4.70 3.80 2.97 2.37 EV/EBITDA 8.31 6.67 5.11 4.02 EV/EBIT 12.9 10.5 7.8 5.9 ROE analysis (%) ROE 19.1 21.1 25.0 26.6 ROIC 22.2 23.0 28.9 33.0 Asset turnover (x) 0.58 0.60 0.64 0.66 Interest burden (x) 0.92 1.01 1.02 1.02 Tax burden (x) 0.75 0.75 0.80 0.80 Financial leverage (x) 1.21 1.18 1.16 1.14 Credit ratios Net debt/equity (%) (6.1) (11.4) (17.9) (23.7) Net debt/EBITDA (x) (0.15) (0.28) (0.42) (0.53) Interest cover (x) 16 (120) (61) (42)
Source: Company data, Thomson Reuters, Credit Suisse estimates.
0
5
10
15
20
25
30
Dec-14 Apr-15 Aug-15 Dec-15
12MF P/E multiple
0
1
2
3
4
5
6
Dec-14 Apr-15 Aug-15 Dec-15
12MF P/B multiple
Source: IBES

05 April 2016
Indonesia Consumer Survey 2016 98
Asia Pacific / Indonesia
Healthcare Facilities
Siloam International Hospitals
(SILO.JK / SILO IJ) COMPANY UPDATE
Aggressive expansion plans ahead
■ Indonesia's largest private hospital group. PT Siloam International Hospitals
(Siloam), a subsidiary of PT Lippo Karawaci Tbk, is the largest private hospital
group in Indonesia operating 20 hospitals with a total capacity of more than
4,800 beds across the country. We believe Siloam's competitive positioning as
Indonesia’s premier hospital group is underpinned by its (1) holistic approach
targeting all healthcare segments; (2) state-of-the-art medical systems and the
'hub-and-spoke model' driving better business strategy; and (3) Lippo Group's
parentage helping execution certainty.
■ Ambitious expansion plans to form unrivalled network across
Indonesia. Siloam has two completed hospitals awaiting operational licence
and 44 other sites earmarked for development. By 2017, Siloam targets to
achieve 10,000 beds from the current 4,800 and have over 50 hospitals in
more than 25 cities. While management has been able to deliver strong top-
line growth despite a weak demand environment, margins have disappointed
as a majority of hospitals are still in the ramp-up stage.
■ New format medical centre—Siloam Medika. These outlets will be
strategically placed in high traffic areas such as shopping malls. Offering a
limited variety of surgery options and key equipment with a GP approach,
this targeted format should prove effective with a new level of convenience
for those smaller medical situations and emergencies, and the opportunity
for prompt treatment and immediate referral.
■ Siloam is likely to build significant scale and competitive advantages
over the medium term. We believe that in the medium term, Siloam could
be the best play to leverage on the healthcare under-penetration story in
Indonesia as it builds a hospital network unrivalled in scope and scale across
Indonesia. Margin issues are likely to be shortlived. Siloam's profitability
metrics are likely to play catch-up as more hospitals mature.
Share price performance
60
110
160
6000
11000
16000
Apr-14 Aug-14 Dec-14 Apr-15 Aug-15 Dec-15
Price (LHS) Rebased Rel (RHS)
The price relative chart measures performance against the JSX
COMPOSITE INDEX which closed at 4843.19 on 01/04/16
On 01/04/16 the spot exchange rate was Rp13155./US$1
Performance over 1M 3M 12M Absolute (%) -6.6 -24.0 -44.2 — Relative (%) -6.7 -29.4 -33.0 —
Financial and valuation metrics
Year 12/14A 12/15E 12/16E 12/17E Revenue (Rp bn) 3,340.8 4,215.0 5,747.3 7,846.5 EBITDA (Rp bn) 401.0 555.3 770.6 1,065.3 EBIT (Rp bn) 133.9 195.3 320.6 535.3 Net profit (Rp bn) 62.6 98.6 159.9 279.7 EPS (CS adj.) (Rp) 54 85 138 241 Change from previous EPS (%) n.a. 0.0 0.0 0.0 Consensus EPS (Rp) n.a. 61 101 158 EPS growth (%) 13.6 57.4 61.9 74.9 P/E (x) 137.7 87.5 54.0 30.9 Dividend yield (%) 0.0 0.11 0.19 0.32 EV/EBITDA (x) 21.4 15.1 10.5 7.0 P/B (x) 5.2 5.0 4.6 4.1 ROE (%) 3.8 5.8 8.8 13.9 Net debt/equity (%) Net cash Net cash Net cash Net cash
Source: Company data, Thomson Reuters, Credit Suisse estimates.
Rating OUTPERFORM Price (01 Apr 16, Rp) 7,450.00 Target price (Rp) 13,000¹ Upside/downside (%) 74.5 Mkt cap (Rp bn) 8,612.94 (US$0.65 bn) Enterprise value (Rp bn) 8,412 Number of shares (mn) 1,156.10 Free float (%) 29.0 52-week price range 16,900.0-7,250.0 ADTO - 6M (US$ mn) 2.8
*Stock ratings are relative to the coverage universe in each
analyst's or each team's respective sector.
¹Target price is for 12 months.
Research Analysts
Anand Swaminathan
65 6212 3012
Ella Nusantoro
62 21 255 37917

05 April 2016
Indonesia Consumer Survey 2016 99
Siloam International Hospitals SILO.JK / SILO IJ
Price (01 Apr 16): Rp7,450.00, Rating: OUTPERFORM, Target Price: Rp13,000, Analyst: Anand Swaminathan
Target price scenario
Scenario TP %Up/Dwn Assumptions Upside Central Case 13,000.00 74.50 Downside
Key earnings drivers 12/14A 12/15E 12/16E 12/17E
Number of beds 1,985 2,605 3,165 5,028 Revenue growth (%) 33.4 26.2 36.4 36.5 EBITDA margin (%) 13.8 14.5 14.5 14.6 Net margin (%) 1.87 2.34 2.78 3.56 — — — —
Income statement (Rp bn) 12/14A 12/15E 12/16E 12/17E
Sales revenue 3,341 4,215 5,747 7,847 Cost of goods sold 2,389 3,012 4,093 5,570 SG&A 727 842 1,132 1,447 Other operating exp./(inc.) (175.8) (193.9) (248.8) (236.3) EBITDA 401 555 771 1,065 Depreciation & amortisation 267.1 360.0 450.0 530.0 EBIT 133.9 195.3 320.6 535.3 Net interest expense/(inc.) 22.0 47.6 72.8 101.4 Non-operating inc./(exp.) (18.3) (10.0) (20.0) (30.0) Associates/JV — — — — Recurring PBT 93.5 137.7 227.8 403.9 Exceptionals/extraordinaries — — — — Taxes 33.8 44.1 72.9 129.3 Profit after tax 59.7 93.6 154.9 274.7 Other after tax income — — — — Minority interests (2.9) (5.0) (5.0) (5.0) Preferred dividends — — — — Reported net profit 62.6 98.6 159.9 279.7 Analyst adjustments — — — — Net profit (Credit Suisse) 62.6 98.6 159.9 279.7
Cash flow (Rp bn) 12/14A 12/15E 12/16E 12/17E
EBIT 133.9 195.3 320.6 535.3 Net interest — — — — Tax paid — — — — Working capital 115.6 145.5 189.9 220.9 Other cash & non-cash items — — — — Operating cash flow 249.4 340.8 510.5 756.2 Capex (382.4) (350.0) (360.0) (360.0) Free cash flow to the firm (132.9) (9.2) 150.5 396.2 Disposals of fixed assets — — — — Acquisitions (128.7) — — — Divestments — — — — Associate investments — — — — Other investment/(outflows) 0.52 — — — Investing cash flow (510.6) (350.0) (360.0) (360.0) Equity raised — — — — Dividends paid — (9.9) (16.0) (28.0) Net borrowings — (100.0) 50.0 100.0 Other financing cash flow (7.5) 75.0 150.0 200.0 Financing cash flow (7.5) (34.9) 184.0 272.0 Total cash flow (268.7) (44.1) 334.5 668.2 Adjustments (1.1) — — — Net change in cash (269.7) (44.1) 334.5 668.2
Balance sheet (Rp bn) 12/14A 12/15E 12/16E 12/17E
Cash & cash equivalents 280 271 646 1,377 Current receivables 392.6 490.8 662.6 894.5 Inventories 105.9 165.0 185.0 205.0 Other current assets 9.4 15.0 15.0 15.0 Current assets 788 942 1,509 2,492 Property, plant & equip. 1,518 1,508 1,418 1,248 Investments — — — — Intangibles 292.2 200.0 200.0 70.0 Other non-current assets 247 1,616 1,826 1,845 Total assets 2,844 4,265 4,952 5,655 Accounts payable 192.8 269.9 377.8 528.9 Short-term debt 80.5 20.0 20.0 20.0 Current provisions 33.1 28.0 32.0 32.0 Other current liabilities 159.9 535.0 516.0 516.0 Current liabilities 466 853 946 1,097 Long-term debt 149.4 49.4 99.4 199.4 Non-current provisions 147.0 550.0 800.0 800.0 Other non-current liab. 428 1,041 1,191 1,391 Total liabilities 1,190 2,493 3,036 3,487 Shareholders' equity 1,648 1,737 1,881 2,133 Minority interests 5.5 35.0 35.0 35.0 Total liabilities & equity 2,844 4,265 4,952 5,655
Per share data 12/14A 12/15E 12/16E 12/17E
Shares (wtd avg.) (mn) 1,156 1,158 1,160 1,160 EPS (Credit Suisse) (Rp) 54 85 138 241 DPS (Rp) — 8.5 13.8 24.1 BVPS (Rp) 1,426 1,500 1,621 1,838 Operating CFPS (Rp) 216 294 440 652
Key ratios and valuation 12/14A 12/15E 12/16E 12/17E
Growth(%) Sales revenue 33.4 26.2 36.4 36.5 EBIT 70.1 45.9 64.2 67.0 Net profit 25.4 57.6 62.2 74.9 EPS 13.6 57.4 61.9 74.9 Margins (%) EBITDA 12.0 13.2 13.4 13.6 EBIT 4.01 4.63 5.58 6.82 Pre-tax profit 2.80 3.27 3.96 5.15 Net profit 1.87 2.34 2.78 3.56 Valuation metrics (x) P/E 138 88 54 31 P/B 5.23 4.97 4.59 4.05 Dividend yield (%) — 0.11 0.19 0.32 P/CF 34.5 25.3 16.9 11.4 EV/sales 2.56 2.00 1.41 0.95 EV/EBITDA 21.4 15.1 10.5 7.0 EV/EBIT 64.0 43.1 25.2 13.9 ROE analysis (%) ROE 3.8 5.8 8.8 13.9 ROIC 5.8 8.4 14.7 30.4 Asset turnover (x) 1.17 0.99 1.16 1.39 Interest burden (x) 0.70 0.70 0.71 0.75 Tax burden (x) 0.64 0.68 0.68 0.68 Financial leverage (x) 1.72 2.41 2.58 2.61 Credit ratios Net debt/equity (%) (3.0) (11.4) (27.5) (53.4) Net debt/EBITDA (x) (0.12) (0.36) (0.68) (1.09) Interest cover (x) 6.08 4.10 4.40 5.28
Source: Company data, Thomson Reuters, Credit Suisse estimates.
0
20
40
60
80
100
120
Oct-13 Apr-14 Oct-14 Apr-15 Oct-15 Apr-16
12MF P/E multiple
0
2
4
6
8
10
12
Oct-13 Apr-14 Oct-14 Apr-15 Oct-15 Apr-16
12MF P/B multiple
Source: IBES

05 April 2016
Indonesia Consumer Survey 2016 100
Asia Pacific / Indonesia
Distributors
Tiphone Mobile Indonesia
(TELE.JK / TELE IJ) COMPANY UPDATE
Growing together with Telkomsel
■ Mobile phone vouchers are now staple items. Tiphone Mobile (TELE) is
the largest prepaid mobile phone voucher distributor in Indonesia,
distributing exclusively for Telkomsel (which has 25% stake in the
company). Indonesians' rising internet access translates to higher mobile
phone data service. These growing telecommunication needs benefit TELE
as a distributor.
■ 30% market share, what’s next? Post Telkom's stake acquisition, TELE's
subsidiaries (PT Telesindo, Simpatindo and Tiphone) became the top three
Telkomsel distributors—30% market share. In the traditional channel (85%—
250,000 reseller base), TELE now holds 29 out of 130 Telkomsel clusters.
Telkomsel's goal is to further cut from 130 to 100 clusters, and 60 to 40
distributors. TELE can still grow its cluster base when the re-arrangement
happens. Apart from traditional retail, TELE also distributes through the
modern retail (5%—25,000 Indomaret and Alfamart stores); and bank
channels (10%—all Indonesian private banks). It focuses on these channels
along with the shift of Indonesians' lifestyle towards a modern lifestyle.
■ Possibility of Telkomsel’s stake to rise. Telkomsel's main idea in
acquiring TELE was to secure its distribution network. TELE has been its
biggest and most performing dealer for ten years in a row. According to
TELE, Telkomsel is looking to acquire a controlling stake in the company,
while TELE's founder remains to have at least 20% stake. Both parties are
currently still in the discussion stage.
■ Future strategy to focus on vouchers. Management's long-term strategy
is to grow its vouchers distribution along with Telkomsel, keeping the
handset business as a complimentary only. In FY16, vouchers' contribution
to revenue is targeted to rise to 75% (from 70% in FY15). As the vouchers'
proportion grows, we believe margins and working capital should improve
over the years. Vouchers' net margin is 2.0% as compared to handset of just
1.2%. Vouchers' business in essence requires 25-30 days of WC cycle,
while handset's WC days can be up to twice longer.
Share price performance
80
100
120
140
600
800
1000
1200
Apr-14 Aug-14 Dec-14 Apr-15 Aug-15 Dec-15
Price (LHS) Rebased Rel (RHS)
The price relative chart measures performance against the JSX
COMPOSITE INDEX which closed at 4843.19 on 01/04/16
On 01/04/16 the spot exchange rate was Rp13155./US$1
Performance over 1M 3M 12M Absolute (%) -1.9 0.6 -19.3 — Relative (%) -2.0 -4.8 -8.0 —
Financial and valuation metrics
Year 12/15A 12/16E 12/17E 12/18E Revenue (Rp bn) 22,039.7 27,024.3 29,955.7 33,201.3 EBITDA (Rp bn) 802.8 1,009.3 1,133.3 1,222.6 EBIT (Rp bn) 776.3 980.8 1,102.8 1,190.1 Net profit (Rp bn) 370.9 466.4 545.6 622.4 EPS (CS adj.) (Rp) 51.3 64.5 75.5 86.1 Change from previous EPS (%) n.a. 0.0 0.0 0.0 Consensus EPS (Rp) n.a. 65.2 80.8 86.1 EPS growth (%) 16.6 25.7 17.0 14.1 P/E (x) 15.1 12.0 10.3 9.0 Dividend yield (%) 1.3 1.7 2.1 2.4 EV/EBITDA (x) 9.7 8.4 7.2 6.6 P/B (x) 2.0 1.8 1.6 1.4 ROE (%) 14.0 15.5 16.0 16.1 Net debt/equity (%) 81.1 91.6 74.1 61.9
Source: Company data, Thomson Reuters, Credit Suisse estimates.
Rating OUTPERFORM Price (01 Apr 16, Rp) 775.00 Target price (Rp) 900.00¹ Upside/downside (%) 16.1 Mkt cap (Rp bn) 5,520.47 (US$0.42 bn) Enterprise value (Rp bn) 8,441 Number of shares (mn) 7,123.19 Free float (%) 22.1 52-week price range 1,045.0-630.0 ADTO - 6M (US$ mn) 0.23
*Stock ratings are relative to the coverage universe in each
analyst's or each team's respective sector.
¹Target price is for 12 months.
Research Analysts
Priscilla Tjitra
62 21 2553 7906

05 April 2016
Indonesia Consumer Survey 2016 101
Tiphone Mobile Indonesia TELE.JK / TELE IJ
Price (01 Apr 16): Rp775.00, Rating: OUTPERFORM, Target Price: Rp900.00, Analyst: Priscilla Tjitra
Target price scenario
Scenario TP %Up/Dwn Assumptions
Upside 1,250.00 61.29 Telkomsel market share increases at a faster pace
Central Case 900.00 16.13 Assume Telkomsel market share of 30% in 2016E
Downside 700.00 (9.68) Assume Telkomsel market share stays at 20%
Key earnings drivers 12/15A 12/16E 12/17E 12/18E
Telkomsel distribution market share
21.2 28.0 29.0 30.0 Telkomsel sales growth 14.8 8.0 10.0 10.0 Inflation (%) 6.36 5.00 5.00 5.00 GDP growth (%) 4.80 5.70 6.00 6.00 — — — —
Income statement (Rp bn) 12/15A 12/16E 12/17E 12/18E
Sales revenue 22,040 27,024 29,956 33,201 Cost of goods sold 20,832 25,503 28,246 31,340 SG&A 458.0 561.8 628.1 692.2 Other operating exp./(inc.) (53.3) (49.9) (51.9) (53.9) EBITDA 803 1,009 1,133 1,223 Depreciation & amortisation 26.6 28.5 30.5 32.5 EBIT 776 981 1,103 1,190 Net interest expense/(inc.) 275.5 350.8 365.9 349.5 Non-operating inc./(exp.) — — — — Associates/JV — — — — Recurring PBT 500.7 629.9 736.9 840.7 Exceptionals/extraordinaries — — — — Taxes 130.1 163.8 191.6 218.6 Profit after tax 370.6 466.2 545.3 622.1 Other after tax income — — — — Minority interests (0.30) (0.30) (0.30) (0.30) Preferred dividends — — — — Reported net profit 370.9 466.4 545.6 622.4 Analyst adjustments — — — — Net profit (Credit Suisse) 370.9 466.4 545.6 622.4
Cash flow (Rp bn) 12/15A 12/16E 12/17E 12/18E
EBIT 776 981 1,103 1,190 Net interest (275.5) (350.8) (365.9) (349.5) Tax paid (130.1) (163.8) (191.6) (218.6) Working capital (1,298) (928) (189) (347) Other cash & non-cash items 76.4 28.5 30.5 32.5 Operating cash flow (851.2) (433.8) 387.0 307.5 Capex (18.9) (20.0) (20.0) (20.0) Free cash flow to the firm (870.1) (453.8) 367.0 287.5 Disposals of fixed assets — — — — Acquisitions (400.0) — — — Divestments — — — — Associate investments — — — — Other investment/(outflows) 256.7 (99.1) (16.1) (17.9) Investing cash flow (162.2) (119.1) (36.1) (37.9) Equity raised 24.5 — — — Dividends paid (72.3) (92.6) (116.6) (136.4) Net borrowings 1,210 (24) 183 — Other financing cash flow 386.7 8.6 5.1 5.6 Financing cash flow 1,549 (108) 72 (131) Total cash flow 535.4 (661.1) 422.5 138.9 Adjustments — — — — Net change in cash 535.4 (661.1) 422.5 138.9
Balance sheet (Rp bn) 12/15A 12/16E 12/17E 12/18E
Cash & cash equivalents 1,173 511 934 1,073 Current receivables 2,428 3,206 3,307 3,575 Inventories 1,894 1,956 2,089 2,147 Other current assets 869 1,068 1,035 1,065 Current assets 6,364 6,742 7,366 7,860 Property, plant & equip. 163.6 155.1 144.6 132.1 Investments — — — — Intangibles 551.3 551.3 551.3 551.3 Other non-current assets 49.7 148.8 165.0 182.8 Total assets 7,129 7,597 8,227 8,726 Accounts payable 670.9 768.6 773.9 772.8 Short-term debt 931 907 1,007 1,007 Current provisions 56.9 69.7 77.3 85.7 Other current liabilities 91.5 91.5 91.5 91.5 Current liabilities 1,750 1,836 1,949 1,957 Long-term debt 2,525 2,525 2,608 2,608 Non-current provisions — — — — Other non-current liab. 38.1 46.7 51.8 57.4 Total liabilities 4,313 4,408 4,609 4,622 Shareholders' equity 2,814 3,188 3,617 4,103 Minority interests 1.6 1.6 1.6 1.6 Total liabilities & equity 7,129 7,598 8,228 8,726
Per share data 12/15A 12/16E 12/17E 12/18E
Shares (wtd avg.) (mn) 7,227 7,227 7,227 7,227 EPS (Credit Suisse) (Rp) 51.3 64.5 75.5 86.1 DPS (Rp) 10.0 12.8 16.1 18.9 BVPS (Rp) 389 441 500 568 Operating CFPS (Rp) (118) (60) 54 43
Key ratios and valuation 12/15A 12/16E 12/17E 12/18E
Growth(%) Sales revenue 51.1 22.6 10.8 10.8 EBIT 43.8 26.3 12.4 7.9 Net profit 19.7 25.7 17.0 14.1 EPS 16.6 25.7 17.0 14.1 Margins (%) EBITDA 3.64 3.73 3.78 3.68 EBIT 3.52 3.63 3.68 3.58 Pre-tax profit 2.27 2.33 2.46 2.53 Net profit 1.68 1.73 1.82 1.87 Valuation metrics (x) P/E 15.1 12.0 10.3 9.0 P/B 1.99 1.76 1.55 1.37 Dividend yield (%) 1.29 1.65 2.08 2.44 P/CF (6.6) (12.9) 14.5 18.2 EV/sales 0.35 0.31 0.27 0.24 EV/EBITDA 9.7 8.4 7.2 6.6 EV/EBIT 10.1 8.6 7.4 6.8 ROE analysis (%) ROE 14.0 15.5 16.0 16.1 ROIC 13.2 13.0 13.2 13.6 Asset turnover (x) 3.09 3.56 3.64 3.80 Interest burden (x) 0.65 0.64 0.67 0.71 Tax burden (x) 0.74 0.74 0.74 0.74 Financial leverage (x) 2.53 2.38 2.27 2.13 Credit ratios Net debt/equity (%) 81.1 91.6 74.1 61.9 Net debt/EBITDA (x) 2.84 2.89 2.37 2.08 Interest cover (x) 2.82 2.80 3.01 3.41
Source: Company data, Thomson Reuters, Credit Suisse estimates.
0
2
4
6
8
10
12
14
16
18
20
Sep-12 May-13 Jan-14 Sep-14 May-15 Jan-16
12MF P/E multiple
0.0
0.5
1.0
1.5
2.0
2.5
3.0
3.5
4.0
Sep-12 May-13 Jan-14 Sep-14 May-15 Jan-16
12MF P/B multiple
Source: IBES

05 April 2016
Indonesia Consumer Survey 2016 102
Appendix 1: Respondents' summary Demographics
Figure 145: Could you please tell us your age? Figure 146: What is your total monthly income after tax?
37
39
16
8
5
10
15
20
25
30
35
40
18-29 30-45 46-55 56-65
% o
f res
pond
ents
4
7
19
30
25
9
31
2
0
5
10
15
20
25
30
<Rp1
,000
k
Rp1
,000
k-1,
500k
Rp1
,500
k-2,
000k
Rp2
,000
k-3,
000k
Rp3
,000
k-5,
000k
Rp5
,000
k-7,
500k
Rp7
,500
k-10
,000
k
Rp1
0,00
0k-1
5,00
0k
>Rp1
5,00
0k
% o
f res
pond
ents
Source: Credit Suisse Indonesia Consumer Survey 2016 Source: Credit Suisse Indonesia Consumer Survey 2016
Figure 147: Urban/rural split Figure 148: Male/female split
Urban66%
Rural34%
Male49%Female
51%
Source: Credit Suisse Indonesia Consumer Survey 2016 Source: Credit Suisse Indonesia Consumer Survey 2016
Figure 149: How many people live in your household?
Total < Rp 1,000k Rp 1,000k -
1,500k
Rp 1,500k -
2,000k
Rp 2,000k-
3,000k
Rp
3,000k -
5,000k
Rp
5,000k -
7,500k
Rp
7,500k -
10,000k
Rp 10,000k
- 15,000k
>Rp15,
000k
Would prefer
not to answer
D.K
1 3 4 5 4 3 3 2 0 0 0 0 0
2 7 9 15 7 5 7 7 6 6 8 40 40
3 21 21 27 26 26 15 18 9 12 12 20 40
4 29 28 25 28 30 30 27 32 24 44 40 0
5 or more 39 37 28 34 36 45 46 53 59 36 0 20
Mean 3.94 3.85 3.56 3.81 3.93 4.06 4.07 4.32 4.35 4.08 3 3
Source: Credit Suisse Indonesia Consumer Survey 2016

05 April 2016
Indonesia Consumer Survey 2016 103
Income and others
Figure 150: What is the total after-tax monthly income of your household?
% of respondents Area Region Age
Total Urban Rural Java Ex Java 18-29 30-45 46-55 56-65
2015
Less than Rp1,000k 4 3 7 4 6 5 4 3 5
Rp1,000k-Rp1,500k 7 5 10 6 9 6 5 7 12
Rp1,500k-Rp2,000k 19 16 23 18 21 18 18 22 16
Rp2,000k-Rp3,000k 30 31 29 30 32 29 33 28 25
Rp3,000k-Rp5,000k 25 27 19 25 23 26 24 23 22
Rp5,000-Rp7,500k 9 12 5 11 5 9 9 11 7
Rp7,500k-Rp10,000k 3 4 2 3 2 2 3 4 5
Rp10,000k-Rp15,000k 1 1 1 1 1 1 1 1 2
Above Rp15,000k 2 1 2 2 1 2 2 0 3
2014
Less than Rp1,000k 3 3 5 4 2 3 3 3 4
Rp1,000k-Rp1,500k 6 5 7 6 6 6 4 7 11
Rp1,500k-Rp2,000k 13 10 20 14 14 12 14 14 13
Rp2,000k-Rp3,000k 29 25 38 31 29 28 30 29 30
Rp3,000k-Rp5,000k 24 28 16 26 24 23 24 26 27
Rp5,000-Rp7,500k 10 13 5 12 8 12 10 9 7
Rp7,500k-Rp10,000k 2 3 1 2 4 3 2 0 0
Rp10,000k-Rp15,000k 2 2 0 2 1 1 2 3 0
Above Rp15,000k 5 5 4 2 11 4 5 4 6
2010
Less than Rp1,000k 8 4 15 8 9 7 7 8 14
Rp1,000k-Rp1,500k 16 11 25 17 13 17 14 17 15
Rp1,500k-Rp2,000k 25 23 28 26 25 25 27 21 23
Rp2,000k-Rp3,000k 26 29 20 27 25 27 26 23 23
Rp3,000k-Rp5,000k 19 25 7 19 19 16 20 22 19
Rp5,000-Rp7,500k 3 4 1 3 4 3 3 4 3
Rp7,500k-Rp10,000k 1 1 0 0 2 1 0 1 1
Rp10,000k-Rp15,000k 1 1 0 0 1 0 1 0 2
Above Rp15,000k 1 1 0 0 1 1 0 0 1
Source: Credit Suisse Indonesia Consumer Survey 2016
Figure 151: Do you think the state of your own finances over the next six months will be better, worse, or about same?
2819
2430
3946 49
4148
67
7471
6657
53 4759
52
4 7 4 4 5 1 4
0
10
20
30
40
50
60
70
80
90
100
<Rp1,000k Rp1,000k -Rp1,500k
Rp1,500k -Rp2,000k
Rp2,000k -Rp3,000k
Rp3,000k -Rp5,000k
Rp5,000k -Rp7,500k
Rp7,500k -Rp10,000k
Rp10,000k -Rp15,000k
>Rp15,000k
% o
f res
pond
ents
Better About the same Worse
Source: Credit Suisse Indonesia Consumer Survey 2016

05 April 2016
Indonesia Consumer Survey 2016 104
Figure 152: Do you think the state of your own finances over the next six months will be better, worse, or about same?
Percentage of respondents who are positive minus percentage of respondents who are negative
24
12
20
26
34
45 45
41
48
0
10
20
30
40
50
60
<Rp1,000k Rp1,000k -Rp1,500k
Rp1,500k -Rp2,000k
Rp2,000k -Rp3,000k
Rp3,000k -Rp5,000k
Rp5,000k -Rp7,500k
Rp7,500k -Rp10,000k
Rp10,000k -Rp15,000k
>Rp15,000k
% o
f res
pond
ents
Source: Credit Suisse Indonesia Consumer Survey 2016
Figure 153: In your opinion, is now a good time to make a major purchase? (Area)
2015 2014 2010
Total Urban Rural Java Ex
Java
Total Urban Rural Java Ex
Java
Total Urban Rural Java Ex
Java
Excellent time 5 6 4 5 5 1 1 1 0 3 6 7 5 5 7
Good time 30 31 28 30 29 35 33 38 35 38 50 48 54 54 40
Not such a good time 59 57 61 58 59 59 62 52 59 50 40 40 39 37 48
A bad time 7 6 7 7 6 6 5 8 6 9 4 5 3 5 4
Source: Credit Suisse Indonesia Consumer Survey 2016
Figure 154: In your opinion, is now a good time to make a major purchase? (Age)
2015 2014 2010
Total 18-29 30-45 46-55 56-65 Total 18-29 30-45 46-55 56-65 Total 18-29 30-45 46-55 56-65
Excellent time 5 5 5 6 4 1 1 1 0 0 6 6 6 6 6
Good time 30 28 33 27 25 35 37 34 34 28 50 53 49 50 45
Not such a good time 59 59 56 62 64 59 58 59 58 63 40 38 40 39 45
A bad time 7 7 6 6 8 6 4 6 8 9 4 3 5 4 4
Source: Credit Suisse Indonesia Consumer Survey 2016
Figure 155: In your opinion, is now a good time to make a major purchase? (Income)
2015 2014 2010
Total Low Mid High Total Low Mid High Total Low Mid High
Excellent time 5 1 6 6 1 1 1 0 6 3 7 4
Good time 30 27 30 27 35 24 36 33 50 45 51 68
Not such a good time 58 64 57 66 58 68 58 63 40 46 38 21
A bad time 7 8 7 2 6 7 6 3 4 5 4 7
Source: Credit Suisse Indonesia Consumer Survey 2016

05 April 2016
Indonesia Consumer Survey 2016 105
Figure 156: What savings or investment channels, if any, does your household use to save money?
% of respondents Total Less than
Rp1,000k
Rp
1,000k -
1,500k
Rp
1,500k -
2,000k
Rp
2,000k -
3,000k
Rp
3,000k -
5,000k
Rp
5,000k -
7,500k
Rp
7,500k -
10,000k
Rp
10,000k -
15,000k
Above
Rp15,000k
Would
prefer not
to answer
D.K
Bank account 47 25 16 29 42 64 76 72 47 60 20 0
Life insurance 5 0 1 1 4 8 14 13 18 20 0 0
Stock market 0 0 0 0 0 0 0 0 0 0 0 0
Cash 36 25 28 28 45 41 35 23 18 28 0 40
Mutual Fund 0 0 0 0 0 1 1 0 0 0 0 0
State Treasury bill-bond 0 0 0 0 0 0 0 0 6 0 0 0
Property 5 0 0 2 5 7 6 4 12 16 0 0
Collectables 0 0 0 0 0 0 0 0 0 0 0 0
Gold and Jewellery 0 0 0 0 0 0 0 0 0 0 0 0
No extra money for saving 29 54 58 47 25 16 6 21 41 32 80 60
Base : Unwtd 1530 67 100 287 461 376 140 47 17 25 5 5
Source: Credit Suisse Indonesia Consumer Survey 2016
Figure 157: To what extent has your household income changed in the last 12 months?
% of respondents Total Less than
Rp1,000k
Rp
1,000k -
1,500k
Rp
1,500k -
2,000k
Rp
2,000k -
3,000k
Rp
3,000k -
5,000k
Rp
5,000k -
7,500k
Rp
7,500k -
10,000k
Rp
10,000k -
15,000k
Above
Rp15,000k
Would
prefer not
to answer
D.K
Decline more than 20% 1 3 1 1 1 1 1 2 0 0 0 0
-10% to -20% 2 6 3 2 2 1 1 0 0 0 0 0
-10% to flat 9 10 16 11 8 8 6 6 0 0 20 0
Unchanged 43 54 57 51 48 33 27 36 12 16 60 20
Flat to +10% 28 19 16 24 29 33 34 19 41 44 0 0
10-20% 11 7 5 3 7 16 19 32 29 24 0 20
20-30% 1 0 0 1 1 1 7 2 0 4 0 0
30%+ 0 0 0 0 0 1 1 0 0 4 0 0
No income 12 months ago 5 0 2 6 5 5 4 2 18 8 20 60
Base : Unwtd 1530 67 100 287 461 376 140 47 17 25 5 5
Source: Credit Suisse Indonesia Consumer Survey 2016
Figure 158: In what way do you expect your household income to change in the next 12 months?
% of respondents Total Less than
Rp1,000k
Rp
1,000k -
1,500k
Rp
1,500k -
2,000k
Rp
2,000k -
3,000k
Rp
3,000k -
5,000k
Rp
5,000k -
7,500k
Rp
7,500k -
10,000k
Rp
10,000k -
15,000k
Above
Rp15,000k
Would
prefer not
to answer
D.K
Decline more than 20% 0 0 1 0 0 0 0 0 0 0 0 0
-10% to -20% 0 0 1 1 0 1 0 2 0 0 0 0
-10% to flat 4 4 9 5 4 3 4 0 0 0 0 0
Unchanged 33 48 49 44 36 23 17 21 12 12 60 0
Flat to +10% 33 34 27 29 36 35 29 30 24 52 20 20
10-20% 20 9 11 14 15 25 38 36 47 16 0 20
20-30% 4 3 0 2 3 7 8 6 0 12 0 0
30%+ 1 0 0 0 1 2 3 2 0 0 0 0
No income 12 months ago 4 1 2 4 4 5 2 2 18 8 20 60
Base : Unwtd 1530 67 100 287 461 376 140 47 17 25 5 5
Source: Credit Suisse Indonesia Consumer Survey 2016
Figure 159: How do you think your purchases on credit card are likely to change in the next 12 months?
% of respondents Total Less than
Rp1,000k
Rp
1,000k -
1,500k
Rp
1,500k -
2,000k
Rp
2,000k -
3,000k
Rp
3,000k -
5,000k
Rp
5,000k -
7,500k
Rp
7,500k -
10,000k
Rp
10,000k -
15,000k
Above
Rp15,000k
Would
prefer not
to answer
D.K
Rising 26 100 25 23 19 27 33 38 0 33 0 0
Staying the same 60 0 50 62 66 59 52 50 100 67 0 0
Decreasing 14 0 26 16 15 14 15 13 0 0 0 0
Base: Unwtd 151 1 8 26 41 41 21 8 2 3 0 0
Source: Credit Suisse Indonesia Consumer Survey 2016

05 April 2016
Indonesia Consumer Survey 2016 106
Figure 160: Have you migrated from your hometown to where you are currently living?
% of respondents Age Income*
Total Urban Rural Java Ex Java 18-29 30-45 46-55 56-65 Low Mid High
Yes 19 27 3 14 17 20 19 18 14 18 19 18
No 81 73 97 86 84 80 81 82 86 83 81 82
* Income is on monthly basis—low < Rp1.5mn, mid Rp1.5mn-Rp7.5mn, high > Rp7.5mn.
Source: Credit Suisse Indonesia Consumer Survey 2016
Figure 161: Did you migrate to earn better income?
% of respondents Age Income*
Total Urban Rural Java Ex Java 18-29 30-45 46-55 56-65 Low Mid High
Yes 93 94 75 91 66 90 95 95 94 93 93 96
No 7 6 25 9 34 10 5 5 6 7 7 4
* Income is on monthly basis—low < Rp1.5mn, mid Rp1.5mn-Rp7.5mn, high > Rp7.5mn.
Source: Credit Suisse Indonesia Consumer Survey 2016
Auto
Figure 162: Does your household currently own a car that is driven for personal use?
% of respondents Total Less than
Rp1,000k
Rp
1,000k -
1,500k
Rp
1,500k -
2,000k
Rp
2,000k -
3,000k
Rp
3,000k -
5,000k
Rp
5,000k -
7,500k
Rp
7,500k -
10,000k
Rp
10,000k -
15,000k
Above
Rp15,000k
Would
prefer not
to answer
D.K
Yes 7 6 2 3 5 6 14 25 13 32 20 0
No 93 94 98 97 95 94 86 75 87 68 80 100
Sum 100 100 100 100 100 100 100 100 100 100 100 100
Base : Unwtd 1441 64 99 275 442 342 128 44 15 22 5 5
Source: Credit Suisse Indonesia Consumer Survey 2016
Figure 163: Does your household own a motorcycle/two-wheeler for personal use?
% of respondents Total Less than
Rp1,000k
Rp
1,000k -
1,500k
Rp
1,500k -
2,000k
Rp
2,000k -
3,000k
Rp
3,000k -
5,000k
Rp
5,000k -
7,500k
Rp
7,500k -
10,000k
Rp
10,000k -
15,000k
Above
Rp15,000k
Would
prefer not
to answer
D.K
Yes 84 63 64 80 82 94 97 91 87 95 60 80
No 16 38 36 20 18 6 3 9 13 5 40 20
Sum 100 100 100 100 100 100 100 100 100 100 100 100
Base : Unwtd 1441 64 99 275 442 342 128 44 15 22 5 5
Source: Credit Suisse Indonesia Consumer Survey 2016
Figure 164: Will you or your family purchase or replace a passenger car in the next 12 months?
1 20 1 0
2 1 0
75
7 6 5 5 68
14
20
75
24
20 20
30
26
20 21
30
2018
26
19
22
26 2628
23
18
33
45
38
52
49
3537 37 38
27 27
18
0
10
20
30
40
50
60
Total Less than Rp1,000k
Rp 1,000k -1,500k
Rp 1,500k -2,000k
Rp 2,000k -3,000k
Rp 3,000k -5,000k
Rp 5,000k -7,500k
Rp 7,500k -10,000k
Rp 10,000k -15,000k
Above 15,000k
% o
f res
pond
ents
Definitely will Probably will Not sure Probably won’t Definitely won’t
Source: Credit Suisse Indonesia Consumer Survey 2016

05 April 2016
Indonesia Consumer Survey 2016 107
Figure 165: Will you or your family purchase or replace a motorbike in the next 12 months?
4
0
3 2 3
8
57 7
5
23 23 24 23 22 23
34
27
75
2523
20
31
27
21
13
20
53
32
29
19
28 27
30 30 30 30
33 32
16
33
21
14 15 16 17
11
0
18
0
10
20
30
40
50
60
Total Less than Rp1,000k
Rp 1,000k -1,500k
Rp 1,500k -2,000k
Rp 2,000k -3,000k
Rp 3,000k -5,000k
Rp 5,000k -7,500k
Rp 7,500k -10,000k
Rp 10,000k -15,000k
Above 15,000k
% o
f res
pond
ents
Definitely will Probably will Not sure Probably won’t Definitely won’t
Source: Credit Suisse Indonesia Consumer Survey 2016
Figure 166: How do you plan to finance this motorbike purchase?
% of respondents Total Less than
Rp1,000k
Rp
1,000k -
1,500k
Rp
1,500k -
2,000k
Rp
2,000k -
3,000k
Rp
3,000k -
5,000k
Rp
5,000k -
7,500k
Rp
7,500k -
10,000k
Rp
10,000k -
15,000k
Above
Rp15,000k
Would
prefer not
to answer
D.K
All cash 26 33 22 21 30 26 26 13 0 50 100 0
Cash + credit 58 47 44 57 57 65 56 67 100 50 0 0
All credit 15 20 33 19 14 8 18 20 0 0 0 0
D.K. 1 0 0 3 0 0 0 0 0 0 0 0
Sum 100 100 100 100 100 100 100 100 100 100 100 0
Base: unwtd 399 15 27 70 111 106 50 15 2 2 1 0
Source: Credit Suisse Indonesia Consumer Survey 2016
Food and beverages
Figure 167: Have you purchased any of these products in the last three months?
% of respondents Total Less than
Rp1,000k
Rp
1,000k -
1,500k
Rp
1,500k -
2,000k
Rp
2,000k -
3,000k
Rp
3,000k -
5,000k
Rp
5,000k -
7,500k
Rp
7,500k -
10,000k
Rp
10,000k -
15,000k
Above
Rp15,000k
Would
prefer not
to answer
D.K
Drinks: Yes 66 56 56 64 66 72 75 58 64 64 40 60
Drinks: No 34 44 44 36 34 28 25 42 36 36 60 40
Drinks: Base 1,290 63 96 253 393 303 101 38 11 22 5 5
Bottled Water: Yes 89 81 79 81 93 93 99 97 100 100 80 80
Bottled Water: No 11 19 21 19 7 7 1 3 0 0 20 20
Bottled Water: Base 1,290 63 96 253 393 303 101 38 11 22 5 5
Dairy: Yes 76 73 60 69 76 84 88 68 100 64 40 80
Dairy: No 24 27 40 31 24 16 12 32 0 36 60 20
Dairy: Base 1,290 63 96 253 393 303 101 38 11 22 5 5
Cigarettes: Yes 57 68 54 53 55 59 56 61 27 68 80 40
Cigarettes: No 43 32 46 47 45 41 44 39 73 32 20 60
Cigarettes: Base 1,290 63 96 253 393 303 101 38 11 22 5 5
Noodles: Yes 95 97 95 91 95 97 94 97 100 100 100 100
Noodles: No 5 3 5 9 5 3 6 3 0 0 0 0
Noodles: Base 1,290 63 96 253 393 303 101 38 11 22 5 5
Source: Credit Suisse Indonesia Consumer Survey 2016

05 April 2016
Indonesia Consumer Survey 2016 108
Figure 168: Do you expect to spend more on any of these products in the next 12 months?
% of respondents Total Less than
Rp1,000k
Rp
1,000k -
1,500k
Rp
1,500k -
2,000k
Rp
2,000k -
3,000k
Rp
3,000k -
5,000k
Rp
5,000k -
7,500k
Rp
7,500k -
10,000k
Rp
10,000k -
15,000k
Above
Rp15,000k
Would
prefer not
to answer
D.K
Drinks: Yes 36 11 33 42 33 42 38 32 27 50 40 20
Drinks: No 64 89 67 58 67 58 62 68 73 50 60 80
Drinks: Base 100 100 100 100 100 100 100 100 100 100 100 100
Bottled Water: Yes 1290 63 96 253 393 303 101 38 11 22 5 5
Bottled Water: No 58 22 50 56 57 65 59 76 73 100 80 40
Bottled Water: Base 42 78 50 44 43 35 41 24 27 0 20 60
Dairy: Yes 100 100 100 100 100 100 100 100 100 100 100 100
Dairy: No 1290 63 96 253 393 303 101 38 11 22 5 5
Dairy: Base 49 25 40 46 47 59 57 50 64 64 40 40
Cigarettes: Yes 51 75 60 54 53 41 43 50 36 36 60 60
Cigarettes: No 100 100 100 100 100 100 100 100 100 100 100 100
Cigarettes: Base 1290 63 96 253 393 303 101 38 11 22 5 5
Noodles: Yes 34 17 34 36 31 37 31 37 18 64 80 40
Noodles: No 66 83 66 64 69 63 69 63 82 36 20 60
Noodles: Base 100 100 100 100 100 100 100 100 100 100 100 100
Drinks: Yes 1290 63 96 253 393 303 101 38 11 22 5 5
Drinks: No 58 38 63 59 53 61 54 63 73 100 100 60
Drinks: Base 42 62 38 41 47 39 46 37 27 0 0 40
Bottled Water: Yes 100 100 100 100 100 100 100 100 100 100 100 100
Bottled Water: No 1290 63 96 253 393 303 101 38 11 22 5 5
Source: Credit Suisse Indonesia Consumer Survey 2016
Personal care
Figure 169: Have you purchased any of these products in the last three months?
% of respondents Total Less than
Rp1,000k
Rp
1,000k -
1,500k
Rp
1,500k -
2,000k
Rp
2,000k -
3,000k
Rp
3,000k -
5,000k
Rp
5,000k -
7,500k
Rp
7,500k -
10,000k
Rp
10,000k -
15,000k
Above
Rp15,000k
Would
prefer not
to answer
D.K
Tissue: Yes 57 48 42 48 61 63 73 57 71 39 0 0
Tissue: No 43 52 58 52 39 37 27 43 29 61 100 100
Tissue: Base 1491 67 100 281 448 371 130 44 17 23 5 5
Fem hygiene: Yes 55 49 58 50 58 52 66 55 59 43 0 40
Fem hygiene: No 45 51 42 50 42 48 34 45 41 57 100 60
Fem hygiene: Base 1491 67 100 281 448 371 130 44 17 23 5 5
Cosmetics: Yes 82 83 74 74 82 89 93 74 64 89 0 100
Cosmetics: No 18 17 26 26 18 11 7 26 36 11 100 0
Cosmetics: Base 751 29 57 146 245 175 56 19 11 9 1 3
Source: Credit Suisse Indonesia Consumer Survey 2016
Figure 170: Do you expect to spend more on any of these products in the next 12 months?
% of respondents Total Less than
Rp1,000k
Rp
1,000k -
1,500k
Rp
1,500k -
2,000k
Rp
2,000k -
3,000k
Rp
3,000k -
5,000k
Rp
5,000k -
7,500k
Rp
7,500k -
10,000k
Rp
10,000k -
15,000k
Above
Rp15,000k
Would
prefer not
to answer
D.K
Tissue: Yes 35 15 25 32 35 41 40 41 65 48 0 0
Tissue: No 65 85 75 68 65 59 60 59 35 52 100 100
Tissue: Base 1491 67 100 281 448 371 130 44 17 23 5 5
Fem hygiene: Yes 34 18 30 31 35 34 40 43 47 39 0 0
Fem hygiene: No 66 82 70 69 65 66 60 57 53 61 100 100
Fem hygiene: Base 1491 67 100 281 448 371 130 44 17 23 5 5
Cosmetics: Yes 48 28 44 40 48 54 57 53 55 89 0 33
Cosmetics: No 52 72 56 60 52 46 43 47 45 11 100 67
Cosmetics: Base 751 29 57 146 245 175 56 19 11 9 1 3
Source: Credit Suisse Indonesia Consumer Survey 2016

05 April 2016
Indonesia Consumer Survey 2016 109
Luxury goods
Figure 171: Are you planning to purchase any goods from these categories in the next 12 months?
% of respondents Total Less than
Rp1,000k
Rp
1,000k -
1,500k
Rp
1,500k -
2,000k
Rp
2,000k -
3,000k
Rp
3,000k -
5,000k
Rp
5,000k -
7,500k
Rp
7,500k -
10,000k
Rp
10,000k -
15,000k
Above
Rp15,000k
Would
prefer not
to answer
D.K
Fashion: Yes 56 56 59 50 56 55 64 46 63 72 20 75
Fashion: No 44 44 41 50 44 45 36 54 38 28 80 25
Fashion: Base 1393 61 92 260 429 341 121 39 16 25 5 4
Shoes: Yes 29 23 22 28 27 31 40 31 13 16 40 25
Shoes: No 71 77 78 72 73 69 60 69 88 84 60 75
Shoes: Base 1393 61 92 260 429 341 121 39 16 25 5 4
Watches: Yes 21 11 10 18 24 21 23 26 13 12 20 25
Watches: No 79 89 90 82 76 79 77 74 88 88 80 75
Watches: Base 1393 61 92 260 429 341 121 39 16 25 5 4
Jewellery: Yes 19 7 13 15 22 20 25 18 19 8 0 0
Jewellery: No 81 93 87 85 78 80 75 82 81 92 100 100
Jewellery: Base 1393 61 92 260 429 341 121 39 16 25 5 4
Perfumes: Yes 50 34 35 48 50 59 60 46 38 28 40 25
Perfumes: No 50 66 65 52 50 41 40 54 63 72 60 75
Perfumes: Base 1393 61 92 260 429 341 121 39 16 25 5 4
Source: Credit Suisse Indonesia Consumer Survey 2016
Figure 172: Are you planning to purchase any goods from the fashion category in the next 12 months?
5659
50
56 55
64
46
63
72
0
10
20
30
40
50
60
70
80
Less than Rp1,000k
Rp 1,000k - Rp1,500k
Rp 1,500k - Rp2,000k
Rp 2,000k - Rp3,000k
Rp 3,000k - Rp5,000k
Rp 5,000k - Rp7,500k
Rp 7,500k - Rp10,000k
Rp 10,000k - Rp15,000k
Above Rp15,000k
% o
f res
pond
ents
Source: Credit Suisse Indonesia Consumer Survey 2016
Figure 173: Are you planning to purchase any goods from the shoes category in the next 12 months?
2322
2827
31
40
31
13
16
0
5
10
15
20
25
30
35
40
Less than Rp1,000k
Rp 1,000k - Rp1,500k
Rp 1,500k - Rp2,000k
Rp 2,000k - Rp3,000k
Rp 3,000k - Rp5,000k
Rp 5,000k - Rp7,500k
Rp 7,500k - Rp10,000k
Rp 10,000k - Rp15,000k
Above Rp15,000k
% of
resp
onde
nts
Source: Credit Suisse Indonesia Consumer Survey 2016

05 April 2016
Indonesia Consumer Survey 2016 110
Figure 174: Are you planning to purchase any goods from the watches category in the next 12 months?
1110
18
24
21
23
26
1312
0
5
10
15
20
25
30
Less than Rp1,000k
Rp 1,000k - Rp1,500k
Rp 1,500k - Rp2,000k
Rp 2,000k - Rp3,000k
Rp 3,000k - Rp5,000k
Rp 5,000k - Rp7,500k
Rp 7,500k - Rp10,000k
Rp 10,000k - Rp15,000k
Above Rp15,000k
% o
f res
pond
ents
Source: Credit Suisse Indonesia Consumer Survey 2016
Figure 175: Are you planning to purchase any goods from the jewellery category in the next 12 months?
7
13
15
22
20
25
1819
8
0
5
10
15
20
25
Less than Rp1,000k
Rp 1,000k - Rp1,500k
Rp 1,500k - Rp2,000k
Rp 2,000k - Rp3,000k
Rp 3,000k - Rp5,000k
Rp 5,000k - Rp7,500k
Rp 7,500k - Rp10,000k
Rp 10,000k - Rp15,000k
Above Rp15,000k
% o
f res
pond
ents
Source: Credit Suisse Indonesia Consumer Survey 2016
Figure 176: Are you planning to purchase any goods from the perfumes category in the next 12 months?
34 35
4850
59 60
46
38
28
0
10
20
30
40
50
60
Less than Rp1,000k
Rp 1,000k - Rp1,500k
Rp 1,500k - Rp2,000k
Rp 2,000k - Rp3,000k
Rp 3,000k - Rp5,000k
Rp 5,000k - Rp7,500k
Rp 7,500k - Rp10,000k
Rp 10,000k - Rp15,000k
Above Rp15,000k
% o
f res
pond
ents
Source: Credit Suisse Indonesia Consumer Survey 2016

05 April 2016
Indonesia Consumer Survey 2016 111
Technology and Internet
Figure 177: Which of the following electronic products/services have you purchased in the last 12 months?
% of respondents Total Less than
Rp 1,000k
Rp 1,000k -
1,500k
Rp 1,500k -
2,000k
Rp 2,000k
- 3,000k
Rp 3,000k -
5,000k
Rp 5,000k -
7,500k
Rp 7,500k -
10,000k
Rp 10,000k -
15,000k
Above
15,000k
Blue-Ray DVD Player 0 0 0 0 0 0 1 2 0 0
Camcorder 0 0 0 0 0 0 0 0 0 0
Desktop computer 1 0 0 1 2 2 1 0 4 0
Digital Camera 1 0 1 1 1 1 3 2 9 0
DVD Player 8 0 6 8 11 7 7 3 0 5
E-Reader 0 0 0 0 0 0 0 0 0 0
Gaming facility 1 0 0 0 0 1 1 0 0 2
GPS/Navigation 0 0 0 0 0 0 1 0 0 0
Internet Service
(Broadband / Dial Up)
0 0 0 0 0 0 1 0 0 0
Mobile Phone (Basic) 9 9 13 11 10 7 5 5 13 8
Mobile Phone
(Smartphone)
22 26 11 19 19 25 26 27 29 26
MP3 1 2 1 1 1 2 1 2 4 0
Netbook 1 0 1 1 0 1 1 7 0 0
Notebook PC 3 4 3 1 2 2 4 7 0 8
Stereo HiFi 0 0 1 1 0 0 0 0 0 0
Traditional TV 6 4 11 10 6 4 1 2 0 0
LCD TV 7 0 4 3 8 9 12 5 13 8
Flat screen TV 2 2 0 2 2 3 3 3 4 5
Tablet 3 3 2 3 2 2 7 5 0 8
None of these 37 50 46 39 38 35 25 33 25 29
Sum 100 100 100 100 100 100 100 100 100 100
Source: Credit Suisse Indonesia Consumer Survey 2016
Figure 178: Which of the following electronic products/services are you most likely to purchase in the next 12 months?
% of respondents Total Less than
Rp 1,000k
Rp 1,000k -
1,500k
Rp 1,500k -
2,000k
Rp 2,000k
- 3,000k
Rp 3,000k -
5,000k
Rp 5,000k -
7,500k
Rp 7,500k -
10,000k
Rp 10,000k -
15,000k
Above
15,000k
Blue-Ray DVD Player 0 0 0 0 0 1 0 0 0 0
Camcorder 0 0 1 0 0 0 0 2 0 0
Desktop computer 2 2 2 1 3 2 2 2 0 0
Digital Camera 3 3 3 4 3 4 2 3 0 0
DVD Player 3 3 4 5 4 2 2 2 0 0
E-Reader 0 0 0 0 0 0 0 0 0 0
Gaming facility 1 0 0 0 1 1 1 0 0 0
GPS/Navigation 0 0 0 0 0 0 0 0 0 0
Internet Service
(Broadband / Dial Up)
1 0 0 1 1 0 2 2 0 0
Mobile Phone (Basic) 3 10 7 4 3 2 1 2 0 0
Mobile Phone
(Smartphone)
16 12 14 14 17 19 21 16 6 4
MP3 1 0 2 1 1 0 1 0 0 0
Netbook 1 0 1 1 2 2 2 2 0 0
Notebook PC 5 8 1 3 4 6 12 15 6 4
Stereo HiFi 0 0 0 1 0 1 0 0 0 0
Traditional TV 2 4 2 3 1 2 0 0 0 0
LCD TV 12 4 15 14 12 14 10 11 6 4
Flat screen TV 3 10 1 3 3 2 4 2 6 4
Tablet 3 3 3 4 3 6 2 3 0 0
None of these 42 42 46 40 43 38 40 39 76 84
Sum 100 100 100 100 100 100 100 100 100 100
Source: Credit Suisse Indonesia Consumer Survey 2016

05 April 2016
Indonesia Consumer Survey 2016 112
Telecommunications
Figure 179: Do you currently own and use a handset for personal use?
% of respondents Total Less than
Rp 1,000k
Rp 1,000k
- 1,500k
Rp 1,500k
- 2,000k
Rp 2,000k
- 3,000k
Rp 3,000k
- 5,000k
Rp 5,000k
- 7,500k
Rp 7,500k
- 10,000k
Rp 10,000k
- 15,000k
Above
15,000k
Would
prefer not
to answer
Yes, I own and pay for
my own mobile
phone/handset
80 67 66 77 81 85 88 73 47 84 40
Yes, I own my own
mobile phone/handset
but is paid for by my
employer
1 0 1 1 1 0 0 0 0 0 20
Yes, I own my own
mobile phone/handset
but is paid by
somebody else
6 8 5 6 5 6 7 9 24 0 0
No I do not own my
own mobile
phone/handset
14 26 28 16 13 8 4 18 29 16 40
Sum 100 100 100 100 100 100 100 100 100 100 100
Source: Credit Suisse Indonesia Consumer Survey 2016
Figure 180: Which brand of mobile handset will you buy?
% of respondents Total Less than
Rp 1,000k
Rp 1,000k
- 1,500k
Rp 1,500k
- 2,000k
Rp 2,000k
- 3,000k
Rp 3,000k
- 5,000k
Rp 5,000k
- 7,500k
Rp 7,500k
- 10,000k
Rp 10,000k
- 15,000k
Above
15,000k
Would prefer
not to answer
Foreign 93 88 94 95 91 93 98 100 100 100 93
Nokia 13 21 24 17 13 11 8 8 20 0 13
Blackberry 7 3 0 3 5 11 8 13 20 25 7
Samsung 50 47 47 50 48 47 61 67 60 50 50
Local 4 9 2 2 5 5 1 0 0 0 4
Base 3 3 4 3 4 2 1 0 0 0 3
Source: Credit Suisse Indonesia Consumer Survey 2016
Figure 181: Have you bought a handset in last 12
months?
Figure 182: Is your next handset likely to be a 4G?
43%
44%
40%
42%
44%
38%
39%
40%
41%
42%
43%
44%
45%
Total Urban Rural Java Ex Java
Yes21%
No54%
Don't know25%
Source: Credit Suisse Indonesia Consumer Survey 2016 Source: Credit Suisse Indonesia Consumer Survey 2016

05 April 2016
Indonesia Consumer Survey 2016 113
Figure 183: % of respondents planning to upgrade to a
smartphone in the next 12 months (2015)
Figure 184: % of respondents planning to upgrade to a
smartphone in the next 12 months (2010)
6158
5552
50
36 36 36
29
0
10
20
30
40
50
60
70
Indo
nesi
a
Braz
il
Sout
h Af
rica
Saud
i
Chi
na
Indi
a
Turk
ey
Mex
ico
Rus
sia
57 56
49
37
12
2
0
10
20
30
40
50
60
Indi
a
Saud
i
Chi
na
Indo
nesi
a
Rus
sia
Braz
il
Source: Credit Suisse Indonesia Consumer Survey 2016 Source: Credit Suisse Indonesia Consumer Survey 2016
Figure 185: Samsung is most popular in Indonesia and a
large part of other emerging countries in 2015…
Figure 186: …while Nokia was the dominant leader in
2010
0
10
20
30
40
50
60
70
80
90
100
Indo
nesi
a
Turk
ey
Sau
di
Indi
a
Sou
th A
frica
Bra
zil
Mex
ico
Rus
sia
Chi
na
Samsung Nokia Blackberry Apple Others
0
10
20
30
40
50
60
70
80
90
100
Indo
nesi
a
Chi
na
Sau
di
Rus
sia
Bra
zil
Nokia Samsung Blackberry Apple Others
Source: Credit Suisse Indonesia Consumer Survey 2016 Source: Credit Suisse Indonesia Consumer Survey 2016
Figure 187: Samsung is the most likely purchased personal computer (PC) in 2015, while
ACER was the leader in 2010
0
10
20
30
40
50
60
Samsung Acer Apple Asus Toshiba Sony LG Lenovo Others
2015 2014 2013 2012 2011 2010
Source: Credit Suisse Indonesia Consumer Survey 2016
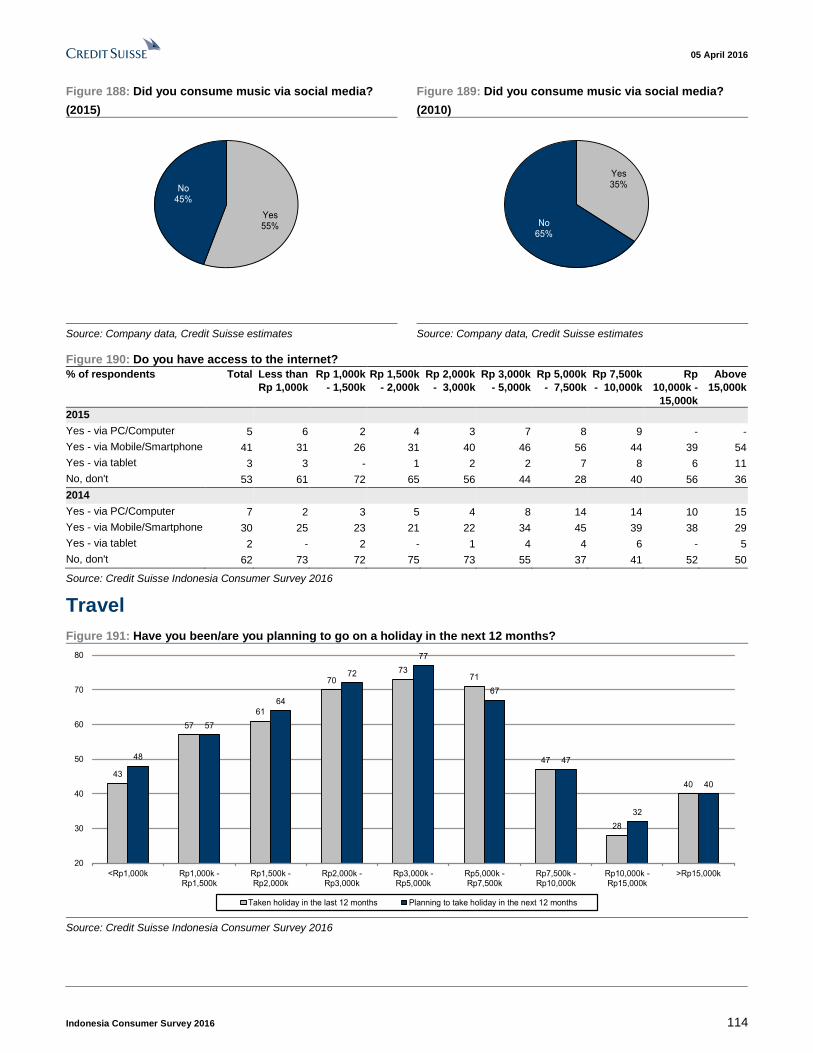
05 April 2016
Indonesia Consumer Survey 2016 114
Figure 188: Did you consume music via social media?
(2015)
Figure 189: Did you consume music via social media?
(2010)
Yes55%
No45%
Yes35%
No65%
Source: Company data, Credit Suisse estimates Source: Company data, Credit Suisse estimates
Figure 190: Do you have access to the internet?
% of respondents Total Less than
Rp 1,000k
Rp 1,000k
- 1,500k
Rp 1,500k
- 2,000k
Rp 2,000k
- 3,000k
Rp 3,000k
- 5,000k
Rp 5,000k
- 7,500k
Rp 7,500k
- 10,000k
Rp
10,000k -
15,000k
Above
15,000k
2015
Yes - via PC/Computer 5 6 2 4 3 7 8 9 - -
Yes - via Mobile/Smartphone 41 31 26 31 40 46 56 44 39 54
Yes - via tablet 3 3 - 1 2 2 7 8 6 11
No, don't 53 61 72 65 56 44 28 40 56 36
2014
Yes - via PC/Computer 7 2 3 5 4 8 14 14 10 15
Yes - via Mobile/Smartphone 30 25 23 21 22 34 45 39 38 29
Yes - via tablet 2 - 2 - 1 4 4 6 - 5
No, don't 62 73 72 75 73 55 37 41 52 50
Source: Credit Suisse Indonesia Consumer Survey 2016
Travel
Figure 191: Have you been/are you planning to go on a holiday in the next 12 months?
43
57
61
70
7371
47
28
40
48
57
64
72
77
67
47
32
40
20
30
40
50
60
70
80
<Rp1,000k Rp1,000k -Rp1,500k
Rp1,500k -Rp2,000k
Rp2,000k -Rp3,000k
Rp3,000k -Rp5,000k
Rp5,000k -Rp7,500k
Rp7,500k -Rp10,000k
Rp10,000k -Rp15,000k
>Rp15,000k
Taken holiday in the last 12 months Planning to take holiday in the next 12 months
Source: Credit Suisse Indonesia Consumer Survey 2016

05 April 2016
Indonesia Consumer Survey 2016 115
Figure 192: Where did you go on your last holiday?
% of respondents Total Less than
Rp 1,000k
Rp 1,000k
- 1,500k
Rp 1,500k
- 2,000k
Rp 2,000k
- 3,000k
Rp 3,000k
- 5,000k
Rp 5,000k
- 7,500k
Rp 7,500k
- 10,000k
Rp 10,000k
- 15,000k
Above
15,000k
Would
prefer
not to
answer
D.K
At home 57 55 79 59 59 55 45 52 50 29 50 67
Elsewhere 43 45 21 39 41 45 55 48 50 71 50 33
Intl destination 0 0 0 1 0 0 0 0 0 0 0 0
Source: Credit Suisse Indonesia Consumer Survey 2016
Figure 193: What was the main form of transport that you used to reach your holiday destination?
% of respondents Total Less than
Rp 1,000k
Rp 1,000k
- 1,500k
Rp 1,500k
- 2,000k
Rp 2,000k
- 3,000k
Rp 3,000k
- 5,000k
Rp 5,000k
- 7,500k
Rp 7,500k
- 10,000k
Rp 10,000k
- 15,000k
Above
15,000k
Would
prefer
not to
answer
D.K
Car 42 44 33 42 42 37 48 56 50 40 100 0
Bus 30 22 44 25 31 35 28 19 0 20 0 0
Train 6 0 0 6 4 10 6 0 25 20 0 0
Ship 1 0 0 4 1 1 0 0 0 0 0 0
Aeroplane 5 0 0 4 3 4 11 13 0 20 0 0
Other 16 33 22 18 18 12 7 13 25 0 0 100
Source: Credit Suisse Indonesia Consumer Survey 2016
Figure 194: Where are you planning to go for your next holiday?
% of respondents Total Less than
Rp 1,000k
Rp 1,000k
- 1,500k
Rp 1,500k
- 2,000k
Rp 2,000k
- 3,000k
Rp 3,000k
- 5,000k
Rp 5,000k
- 7,500k
Rp 7,500k
- 10,000k
Rp 10,000k
- 15,000k
Above
15,000k
Would
prefer
not to
answer
D.K
At home 46 42 60 46 48 44 37 52 25 13 50 67
Elsewhere 54 58 40 54 51 56 62 48 75 75 50 33
Intl destination 0 0 0 0 0 0 1 0 0 13 0 0
Source: Credit Suisse Indonesia Consumer Survey 2016
Education
Figure 195: Do you intend to spend more, or less, on education or training courses in the next 12 months?
35 4
610 9
6
55
7876 76 75
79
74 75
68
42
2220 20 19
11
1719
32
0
10
20
30
40
50
60
70
80
90
Less than Rp1,000k
Rp 1,000k -1,500k Rp 1,500k - 2,000k Rp 2,000k - 3,000k Rp 3,000k - 5,000k Rp 5,000k - 7,500k Rp 7,500k -10,000k
Rp 10,000k -15,000k
Above Rp 15,000k
More About the same Less
Source: Credit Suisse Indonesia Consumer Survey 2016
Figure 196: Do you conduct any education online?
% of
respondents
Total Less than
Rp 1,000k
Rp 1,000k -
1,500k
Rp 1,500k
- 2,000k
Rp 2,000k
- 3,000k
Rp
3,000k -
5,000k
Rp
5,000k -
7,500k
Rp
7,500k -
10,000k
Rp
10,000k -
15,000k
Above Rp
15,000k
Would
prefer not
to answer
D.K
Yes 2 0 1 0 1 2 8 6 0 0 0 0
No 98 100 99 100 99 98 92 94 100 100 100 100
Sum 100 100 100 100 100 100 100 100 100 100 100 100
Base : Unwtd 1511 66 100 286 455 371 135 47 16 25 5 5
Source: Credit Suisse Indonesia Consumer Survey 2016

05 April 2016
Indonesia Consumer Survey 2016 116
Healthcare
Figure 197: Does your household have access to free or partially-free healthcare from the state?
% of
respondents
Total Less than
Rp 1,000k
Rp 1,000k -
1,500k
Rp 1,500k
- 2,000k
Rp 2,000k
- 3,000k
Rp
3,000k -
5,000k
Rp
5,000k -
7,500k
Rp
7,500k -
10,000k
Rp
10,000k -
15,000k
Above Rp
15,000k
Would
prefer not
to answer
D.K
Yes 41 37 46 36 44 44 41 42 24 12 20 60
No 59 63 54 64 56 56 59 58 76 88 80 40
Sum 100 100 100 100 100 100 100 100 100 100 100 100
Base : Unwtd 1499 67 100 285 454 362 134 45 17 25 5 5
Source: Credit Suisse Indonesia Consumer Survey 2016
Figure 198: What services, if any, could you get free from the state?
Sub-SEC Total Less than
Rp 1,000k
Rp 1,000k
-1,500k
Rp
1,500k -
2,000k
Rp 2,000k
- 3,000k
Rp
3,000k -
5,000k
Rp
5,000k -
7,500k
Rp
7,500k -
10,000k
Rp
10,000k -
15,000k
Above Rp
15,000k
Would
prefer not
to answer
D.K
Hospital 92 100 96 89 92 91 91 95 100 100 100 100
Emergency Room 34 28 33 34 26 37 42 58 75 100 100 0
Prescriptions 48 44 35 40 46 51 55 74 100 100 100 33
Vaccinations 12 8 7 9 13 16 11 5 0 0 0 0
Diagnostic tests 15 8 11 14 13 15 20 26 50 33 0 33
Outpatient service 0 0 0 0 0 0 0 0 0 0 0 0
Sum 200 188 180 187 189 209 218 258 325 333 300 167
Base : Unwtd 616 25 46 104 198 158 55 19 4 3 1 3
Source: Credit Suisse Indonesia Consumer Survey 2016
Figure 199: Do you trust local brands as much as international brands on efficacy and safety?
% of respondents Total 2015 Urban Rural Java Ex Java
Yes, I trust local brands on both efficacy and safety 71 70 73 74 62
I trust local brands on efficacy but not on safety 15 13 17 14 17
I trust local brands on safety but not on efficacy 9 12 4 8 13
No, I do not trust local brands neither on efficacy or on safety 2 2 1 1 3
Don't Know 3 2 6 3 5
Source: Credit Suisse Indonesia Consumer Survey 2016
Figure 200: Do you or your family or the company you work for pay for your healthcare?
% of respondents Total Less
than Rp
1,000k
Rp
1,000k -
1,500k
Rp
1,500k -
2,000k
Rp
2,000k -
3,000k
Rp
3,000k -
5,000k
Rp 5,000k
- 7,500k
Rp
7,500k -
10,000k
Rp
10,000k -
15,000k
Above Rp
15,000k
Would
prefer not
to answer
D.K
Yes 33 22 20 21 33 41 51 42 29 24 20 40
No 67 78 80 79 67 59 49 58 71 76 80 60
Sum 100 100 100 100 100 100 100 100 100 100 100 100
Base : Unwtd 1499 67 100 285 454 362 134 45 17 25 5 5
Source: Credit Suisse Indonesia Consumer Survey 2016
Figure 201: And thinking about the person who spends the most on medicine in your household, do they…
Sub-SEC Total Less
than Rp
1,000k
Rp
1,000k -
1,500k
Rp
1,500k -
2,000k
Rp
2,000k -
3,000k
Rp
3,000k -
5,000k
Rp 5,000k
- 7,500k
Rp
7,500k -
10,000k
Rp
10,000k -
15,000k
Above Rp
15,000k
Would
prefer not
to answer
D.K
Pay the full cost of the
medicine
63 82 50 58 56 73 53 100 75 0 0 0
Pay part of the cost 28 18 0 29 28 23 41 0 25 0 0 100
Medication is free 9 0 50 13 16 4 6 0 0 0 0 0
Sum 100 100 100 100 100 100 100 100 100 0 0 100
Base : Unwtd 119 11 2 24 32 26 17 2 4 0 0 1
Source: Credit Suisse Indonesia Consumer Survey 2016

05 April 2016
Indonesia Consumer Survey 2016 117
Appendix 2: Indonesia macro Figure 202: Indonesia selected economic indicators
2008 2009 2010 2011 2012 2013 2014 2015 2016F 2017F
National accounts, population and unemployment
Real GDP growth (%) 6.0 4.7 7.7 6.2 6.0 5.6 5.0 4.8 5.2 5.4
Growth in real private consumption (%) 5.3 4.7 4.8 5.1 5.5 5.5 5.3 4.8 5.2 5.0
Growth in real fixed investment (%) 11.9 3.9 8.5 8.9 9.1 5.0 4.6 5.1 6.4 7.1
Fixed investment (% of GDP) 27.7 31.1 31.0 31.3 32.7 32.0 32.6 33.2 33.5 34.1
Nominal GDP ($bn) 510.6 538.6 756.1 892.7 914.8 903.8 889.0 857.6 886.5 938.9
Population (mn) 225.6 228.5 231.4 237.6 242.0 245.4 248.8 252.2 255.5 259.0
GDP per capita ($) 2262.8 2357.0 3268.0 3756.4 3780.1 3682.4 3573.1 3400.8 3470.2 3625.1
Prices, interest rates and exchange rates
CPI inflation (% YoY change, December over December) 10.2 2.8 7.0 3.8 3.7 8.1 8.4 3.4 4.4 4.6
CPI inflation (% change in average index for the year) 9.8 4.8 5.1 5.3 4.0 6.4 6.4 6.4 4.2 4.7
Exchange rate (IDR per USD, end-year) 10,950 9,400 8,991 9,068 9,670 12,189 12,440 13,795 14,700 14,900
Exchange rate (IDR per USD, average) 9,757 10,354 9,078 8,773 9,419 10,563 11,885 13,458 14,248 14,800
REER (% YoY change, December over December) (1)
-8.6 15.6 6.0 -1.2 -5.4 -11.6 10.0 -1.6 -0.5 -1.0
Nominal wage growth (% YoY change)(2)
7.6 5.3 12.2 3.4 20.4 14.9 13.8 5.0 5.0 5.0
Overnight rate (%, end-year) (3)
9.25 6.50 6.50 6.00 5.75 7.50 7.75 7.50 6.50 6.50
Fiscal data (4)
General government fiscal balance (% of GDP) -0.1 -1.6 -0.7 -1.1 -1.8 -2.2 -2.1 -2.5 -2.7 -2.6
General government primary fiscal balance (% of GDP) 1.7 0.1 0.6 0.1 -0.6 -1.1 -1.0 -1.4 -1.6 -1.5
General government expenditure (% of GDP) 19.9 16.7 15.2 16.5 17.3 17.3 16.8 15.6 15.8 16.0
General government revenue (% of GDP) 19.8 15.1 14.5 15.5 15.5 15.1 14.7 13.0 13.1 13.4
Gross general government debt (% of GDP, end-year) (5)
29.3 31.4 24.7 22.3 22.4 21.6 23.6 26.2 28.9 31.0
Money supply and credit
Broad money supply (M2, % of GDP) 35.0 35.6 36.0 36.7 38.4 39.1 39.5 39.4 40.3 41.4
Broad money supply (M2, % YoY change) 14.9 13.0 15.4 16.4 15.0 12.8 11.9 8.9 12.0 13.0
Domestic credit (% of GDP) 24.1 24.3 23.4 25.1 27.2 28.5 29.0 29.5 30.2 31.2
Domestic credit (% YoY change) 14.3 12.2 9.9 22.4 19.2 16.1 12.8 11.1 12.0 13.5
Domestic credit to the private sector (% of GDP) 24.3 23.4 24.5 27.0 30.0 32.5 33.0 33.1 33.7 34.8
Domestic credit to the private sector (% YoY change) 30.7 6.8 20.0 25.8 21.9 20.0 12.6 9.6 11.5 13.5
Balance of payments (6)
Exports (goods and non-factor services, % of GDP) 30.3 24.7 23.1 23.9 23.1 22.7 22.4 19.9 19.4 18.7
Imports (goods and non-factor services, % of GDP) 28.4 20.7 20.3 21.2 23.3 23.4 22.7 19.3 19.0 18.9
Exports (goods and non-factor services, % YoY change in $ value) 18.7 -14.2 25.5 27.8 -0.9 -2.8 -3.0 -14.4 1.0 2.0
Imports (goods and non-factor services, % YoY change in $ value) 32.3 -23.0 30.3 29.9 12.7 -0.8 -4.5 -18.0 2.0 5.0
Current account balance ($bn) 0.1 10.6 5.1 1.7 -24.4 -29.1 -27.5 -17.8 -19.4 -24.4
Current account balance (% of GDP) 0.0 2.0 0.7 0.2 -2.7 -3.2 -3.1 -2.1 -2.2 -2.6
Net FDI inflows ($bn) 3.4 2.6 11.1 11.5 13.7 13.7 15.9 15.9 16.0 18.0
Scheduled external debt amortization ($bn) 15.5 17.1 18.7 23.0 42.0 38.8 38.8 38.8 45.0 45.0
Foreign debt and reserves
Foreign debt ($bn) 155.1 172.9 202.4 225.4 252.4 266.1 293.8 310.7 300.0 290.0
Public 86.6 99.3 118.6 118.6 126.1 123.5 129.7 143.0 130.0 130.0
Private 68.5 73.6 83.8 106.7 126.2 142.6 164.0 167.7 170.0 160.0
Foreign debt (% of GDP) 30.4 32.1 28.5 26.7 28.8 29.4 33.0 36.2 33.8 30.9
Foreign debt (% of exports of goods and services) 100.1 130.2 123.4 111.7 124.8 129.8 147.8 182.5 174.5 165.4
Central bank gross FX reserves ($bn) 51.6 66.1 96.2 110.1 112.8 99.4 111.9 105.9 102.0 98.0
Central bank net non-gold FX reserves ($bn) 49.6 63.6 92.9 106.5 108.8 96.4 108.8 103.3 99.0 95.0
(1) Real effective exchange rate, increase indicates appreciation. (2) Nominal wage: manufacturing. (3) BI changed its policy target from 1m SBI
rate to overnight rate in 2008. (4) Refers to central government. (5) Excludes SOE and BI debt. (6) BoP number. Source: Bank Indonesia,
Ministry of Finance, Central Bureau Statistics, CEIC, World Bank, Credit Suisse Rating

05 April 2016
Indonesia Consumer Survey 2016 118
Companies Mentioned (Price as of 01-Apr-2016)
Ace Hardware Indonesia (ACES.JK, Rp885) Astra International (ASII.JK, Rp7,325, OUTPERFORM, TP Rp7,600) BMW (BMWG.DE, €78.0) Daihatsu Motor (7262.T, ¥1,525) Erajaya Swasembada (ERAA.JK, Rp695) Gudang Garam (GGRM.JK, Rp65,200) Hanjaya Mandala Sampoerna (HMSP.JK, Rp99,000) Honda Motor (7267.T, ¥2,942) Indofood CBP (ICBP.JK, Rp15,325, OUTPERFORM, TP Rp18,300) Indofood Sukses Makmur (INDF.JK, Rp7,225, OUTPERFORM, TP Rp8,700) Kalbe Farma (KLBF.JK, Rp1,450) Matahari Department Store (LPPF.JK, Rp18,175, OUTPERFORM, TP Rp19,400) Matahari Putra Prima (MPPA.JK, Rp1,700) Media Nusantara Citra (MNCN.JK, Rp2,150) Mitra Adiperkasa (MAPI.JK, Rp4,925) Mitsubishi Motors (7211.T, ¥803) Nissan Motor (7201.T, ¥997) PT Alam Sutera Tbk (ASRI.JK, Rp376) PT Bank Central Asia Tbk (BBCA.JK, Rp13,300) PT Bank Danamon Indonesia Tbk (BDMN.JK, Rp3,795) PT Bank Mandiri (Persero) Tbk (BMRI.JK, Rp10,100) PT Bank Negara Indonesia (Persero) Tbk (BBNI.JK, Rp5,100) PT Bank Pembangunan Daerah Jawa Barat dan Banten T (BJBR.JK, Rp900) PT Bank Rakyat Indonesia (Persero) Tbk (BBRI.JK, Rp11,100) PT Bank Tabungan Negara Persero Tbk (BBTN.JK, Rp1,730) PT Bank Tabungan Pensiunan Nasional Tbk (BTPN.JK, Rp2,795, OUTPERFORM, TP Rp3,500) PT Bumi Serpong Damai Tbk (BSDE.JK, Rp1,815) PT Ciputra Development TBK (CTRA.JK, Rp1,285) PT Indosat Tbk (ISAT.JK, Rp6,125) PT Kino Indonesia (KINO.JK, Rp4,975) PT Mitra Keluarga Karyasehat Tbk (MIKA.JK, Rp2,475) PT Pakuwon Jati Tbk (PWON.JK, Rp492) PT Sarana Menara Nusantara (TOWR.JK, Rp4,295) PT Summarecon Agung Tbk (SMRA.JK, Rp1,620, OUTPERFORM, TP Rp1,960) PT Telkom (Telekomunikasi Indo.) (TLKM.JK, Rp3,350, OUTPERFORM, TP Rp3,800) Pt Link Net Tbk (LINK.JK, Rp4,035, OUTPERFORM[V], TP Rp8,300) Ramayana Lestari Sentosa (RALS.JK, Rp715) Siloam International Hospitals (SILO.JK, Rp7,450, OUTPERFORM, TP Rp13,000) Surya Citra Media (SCMA.JK, Rp3,245) Suzuki Motor (7269.T, ¥2,859) Tiphone Mobile Indonesia (TELE.JK, Rp775, OUTPERFORM, TP Rp900) Tower Bersama (TBIG.JK, Rp5,850) Toyota Motor (7203.T, ¥5,771) Unilever Indonesia (UNVR.JK, Rp43,175) Yamaha Motor (7272.T, ¥1,796)
Disclosure Appendix
Important Global Disclosures
Ella Nusantoro and Priscilla Tjitra each certify, with respect to the companies or securities that the individual analyzes, that (1) the views expressed in this report accurately reflect his or her personal views about all of the subject companies and securities and (2) no part of his or her compensation was, is or will be directly or indirectly related to the specific recommendations or views expressed in this report.
3-Year Price and Rating History for Astra International (ASII.JK)
ASII.JK Closing Price Target Price
Date (Rp) (Rp) Rating
25-Apr-13 7,350 9,000 O
24-Sep-13 6,400 8,370
25-Feb-14 6,700 8,370 *
16-Jun-14 7,250 9,000
30-Oct-14 6,900 8,000
01-Apr-15 8,175 9,800
15-Jul-15 6,825 8,400
21-Aug-15 6,050 7,500
30-Oct-15 5,900 7,600
* Asterisk signifies initiation or assumption of coverage.
O U T PERFO RM

05 April 2016
Indonesia Consumer Survey 2016 119
3-Year Price and Rating History for Indofood CBP (ICBP.JK)
ICBP.JK Closing Price Target Price
Date (Rp) (Rp) Rating
24-Sep-13 10,850 9,300 N
26-Aug-14 10,275 11,800 O
15-May-15 13,600 15,100 N
01-Aug-15 12,300 15,100 O
17-Feb-16 15,525 18,300
* Asterisk signifies initiation or assumption of coverage.
N EU T RA L
O U T PERFO RM
3-Year Price and Rating History for Indofood Sukses Makmur (INDF.JK)
INDF.JK Closing Price Target Price
Date (Rp) (Rp) Rating
24-Sep-13 6,700 8,100 O
18-May-15 7,050 10,600
17-Feb-16 6,525 8,700
* Asterisk signifies initiation or assumption of coverage.
O U T PERFO RM
3-Year Price and Rating History for Matahari Department Store (LPPF.JK)
LPPF.JK Closing Price Target Price
Date (Rp) (Rp) Rating
11-Dec-13 10,850 10,000 N *
17-Feb-14 13,575 16,800 O
04-Aug-14 14,750 17,700
18-Sep-14 16,700 19,900
29-Oct-14 15,150 19,400
30-Jul-15 17,000 19,200
27-Oct-15 18,025 19,700
23-Feb-16 16,250 19,400
* Asterisk signifies initiation or assumption of coverage. N EU T RA L
O U T PERFO RM

05 April 2016
Indonesia Consumer Survey 2016 120
3-Year Price and Rating History for PT Bank Tabungan Pensiunan Nasional Tbk (BTPN.JK)
BTPN.JK Closing Price Target Price
Date (Rp) (Rp) Rating
16-Sep-13 4,050 4,350 N
10-Feb-14 4,500 *
10-Mar-14 4,310 3,800 U
14-Oct-14 4,400 3,850
17-Nov-14 4,150 3,950
09-Apr-15 4,095 5,050 O
24-Jul-15 3,355 4,150
24-Sep-15 2,950 3,700
14-Dec-15 2,500 3,000
29-Mar-16 2,800 3,500
* Asterisk signifies initiation or assumption of coverage.
N EU T RA L
U N D ERPERFO RM
O U T PERFO RM
3-Year Price and Rating History for PT Summarecon Agung Tbk (SMRA.JK)
SMRA.JK Closing Price Target Price
Date (Rp) (Rp) Rating
09-Apr-13 1,112 1,325 N
06-May-13 1,312 1,525
05-Feb-15 1,635 2,020 O *
20-Oct-15 1,395 1,960 *
* Asterisk signifies initiation or assumption of coverage.
N EU T RA L
O U T PERFO RM
3-Year Price and Rating History for PT Telkom (Telekomunikasi Indo.) (TLKM.JK)
TLKM.JK Closing Price Target Price
Date (Rp) (Rp) Rating
12-Apr-13 2,236 2,606 O
30-Jul-13 2,356 R
01-Aug-13 2,406 2,606 O
28-Aug-13 2,150 2,600
24-Sep-13 2,200 2,400
04-Oct-13 2,250 2,400 N
16-Dec-13 2,075 2,550 O
13-Mar-14 2,190 2,500
05-Jun-14 2,520 2,750
25-Aug-14 2,685 2,950
25-Nov-14 2,785 3,100
30-Sep-15 2,645 3,250
09-Dec-15 3,015 3,350
04-Mar-16 3,415 3,800
* Asterisk signifies initiation or assumption of coverage.
O U T PERFO RM
REST RICT ED
N EU T RA L

05 April 2016
Indonesia Consumer Survey 2016 121
3-Year Price and Rating History for Pt Link Net Tbk (LINK.JK)
LINK.JK Closing Price Target Price
Date (Rp) (Rp) Rating
17-Nov-14 5,625 R
03-Dec-14 5,175 8,250 O *
17-Mar-15 6,250 8,450
22-Mar-16 3,945 8,300
* Asterisk signifies initiation or assumption of coverage.
REST RICT ED
O U T PERFO RM
3-Year Price and Rating History for Siloam International Hospitals (SILO.JK)
SILO.JK Closing Price Target Price
Date (Rp) (Rp) Rating
11-Dec-13 9,600 10,500 N *
12-Mar-14 11,275 R
21-Apr-14 10,700 10,500 N
29-Apr-14 10,900 13,000 O
10-Nov-14 14,250 13,000 N
05-Feb-15 13,350 R
17-Feb-15 12,225 13,000 N
08-Apr-15 13,100 13,600
05-Aug-15 16,350 14,250
03-Dec-15 9,700 13,000 O
* Asterisk signifies initiation or assumption of coverage.
N EU T RA L
REST RICT ED
O U T PERFO RM
3-Year Price and Rating History for Tiphone Mobile Indonesia (TELE.JK)
TELE.JK Closing Price Target Price
Date (Rp) (Rp) Rating
27-May-15 1,010 1,250 O *
19-Jan-16 700 880
18-Mar-16 755 900
* Asterisk signifies initiation or assumption of coverage.
O U T PERFO RM
The analyst(s) responsible for preparing this research report received Compensation that is based upon various factors including Credit Suisse's total revenues, a portion of which are generated by Credit Suisse's investment banking activities
As of December 10, 2012 Analysts’ stock rating are defined as follows:
Outperform (O) : The stock’s total return is expected to outperform the relevant benchmark* over the next 12 months.
Neutral (N) : The stock’s total return is expected to be in line with the relevant benchmark* over the next 12 months.
Underperform (U) : The stock’s total return is expected to underperform the relevant benchmark* over the next 12 months.
*Relevant benchmark by region: As of 10th December 2012, Japanese ratings are based on a stock’s total return relative to the analyst's coverage universe which consists of all companies covered by the analyst within the relevant sector, with Outperforms representing the most attractiv e, Neutrals the less attractive, and Underperforms the least attractive investment opportunities. As of 2nd October 2012, U.S. and Canadian as well as European ratings are based on a stock’s total return relative to the analyst's coverage universe which consists of all companies covered by the analyst within the relevant sector, with Outperforms representing the most attractive, Neutrals the less attractive, and Underperforms the least attractive investment opportunities. For Latin American and non -Japan Asia stocks, ratings

05 April 2016
Indonesia Consumer Survey 2016 122
are based on a stock’s total return relative to the average total return of the relevant country or regiona l benchmark; prior to 2nd October 2012 U.S. and Canadian ratings were based on (1) a stock’s absolute total return potential to its current share price and (2) the relative attractiveness of a stock’s total return potential within an analyst’s coverage universe. For Australian and New Zealand stocks, the expected total return (ETR) calculation includes 12 -month rolling dividend yield. An Outperform rating is assigned where an ETR is greater than or equal to 7.5%; Underperform where an ETR less than or equal to 5%. A Neutral may be assigned where the ETR is between -5% and 15%. The overlapping rating range allows analysts to assign a rating that puts ETR in the context of associated risks. Prior to 18 May 2015, ETR ranges for Outperform and Underperform ratings did not overlap with Neutral thresholds between 15% and 7.5%, which was in operation from 7 July 2011.
Restricted (R) : In certain circumstances, Credit Suisse policy and/or applicable law and regulations preclude certain types of communications, including an investment recommendation, during the course of Credit Suisse's engagement in an investment banking transaction and in certain other circumstances.
Volatility Indicator [V] : A stock is defined as volatile if the stock price has moved up or down by 20% or more in a month in at least 8 of the past 24 months or the analyst expects significant volatility going forward.
Analysts’ sector weightings are distinct from analysts’ stock ratings and are based on the analyst’s expectations for the fundamentals and/or valuation of the sector* relative to the group’s historic fundamentals and/or valuation:
Overweight : The analyst’s expectation for the sector’s fundamentals and/or valuation is favorable over the next 12 months.
Market Weight : The analyst’s expectation for the sector’s fundamentals and/or valuation is neutral over the next 12 months.
Underweight : The analyst’s expectation for the sector’s fundamentals and/or valuation is cautious over the next 12 months.
*An analyst’s coverage sector consists of a ll companies covered by the analyst within the relevant sector. An analyst may cover multiple sectors.
Credit Suisse's distribution of stock ratings (and banking clients) is:
Global Ratings Distribution
Rating Versus universe (%) Of which banking clients (%)
Outperform/Buy* 57% (39% banking clients)
Neutral/Hold* 31% (29% banking clients)
Underperform/Sell* 11% (45% banking clients)
Restricted 1%
*For purposes of the NYSE and NASD ratings distribution disclosure requirements, our stock ratings of Outperform, Neutral, and Underperform most closely correspond to Buy, Hold, and Sell, respectively; however, the meanings are not the same, as our stock ratings are determined on a relative basis. (Please refer to definitions above.) An investor's decision to buy or sell a security should be based on investment objectives, current holdings, and other individual factors.
Credit Suisse’s policy is to update research reports as it deems appropriate, based on developments with the subject company, the sector or the market that may have a material impact on the research views or opinions stated herein.
Credit Suisse's policy is only to publish investment research that is impartial, independent, clear, fair and not misleading. For more detail please refer to Credit Suisse's Policies for Managing Conflicts of Interest in connection with Investment Research: http://www.csfb.com/research-and-analytics/disclaimer/managing_conflicts_disclaimer.html
Credit Suisse does not provide any tax advice. Any statement herein regarding any US federal tax is not intended or written to be used, and cannot be used, by any taxpayer for the purposes of avoiding any penalties.
Target Price and Rating Valuation Methodology and Risks: (12 months) for Astra International (ASII.JK)
Method: Our Rp7,600/share target price for Astra International is based on our sum-of-the-parts valuation analysis. Our TP implies 15.5x FY16E PE. Our OUTPERFORM rating is on the back of volume recovery in 4W sales and an improving macro-economic condition.
Risk: Potential risks to our Rp7,600/share target price and OUTPERFORM rating for Astra International include: competition risk, regulatory risk in the form of import duties, plus a significant deterioration in the macro economy, particularly at the consumer confidence level, which has a high correlation with car sales, and liquidity in auto financing, which has a high correlation with motorcycle sales volume.
Target Price and Rating Valuation Methodology and Risks: (12 months) for Indofood CBP (ICBP.JK)
Method: Our target price of Rp18,300 for Indofood CBP is derived using the sum-of-the-parts (SOTP) and market relative performance method. For our SOTP calculation, we are using 12x 2016E EV/EBITDA multiple on each divisions. Thus, we arrive at a total value of Rp80.9 tn which is equal to Rp16,700/share. For the market relative performance, we are using 1.58x relative to market P/E since listing which is equal to Rp19,750/share. With 50:50 proportion of both SOTP and market relative performance, we arrive at our new TP of Rp18,300/share. Our OUTPERFORM rating is on the back of our belief that ICBP will be able to achieve our estimates; thus, we are not revising our estimates since the sell-off on the stock price provides an opportunity to accumulate.
05 April 2016
Indonesia Consumer Survey 2016 123
Risk: Risks that could impede achievement of our Rp18,300 target price and OUTPERFORM rating for Indofood CBP include: (1) competition from both existing and new players, (2) fluctuation of commodity prices, (3) completion of new capacity, (4) Indonesia's macro-economic situation, (5) fluctuation of exchange rates, and (6) regulatory risks.
Target Price and Rating Valuation Methodology and Risks: (12 months) for Indofood Sukses Makmur (INDF.JK)
Method: Indofood Sukses Makmur's target price of Rp8,700 is derived using SOTP and market relative performance. Based on SOTP, we apply the implied valuations on each of the divisions (15.6x EV/EBITDA 2016E for CBP,9x EV/EBITDA 2016E for flour, 7.9x EV/EBITDA 2016E for agribusiness, and 10x EV/EBITDA 2016E for distribution). Based on market relative performance, we are using 1.0x Indofood relative to market P/E in 2016E. As such, using the proportion of 50:50 of both SOTP and market relative performance, we arrive at the new target price of Rp8,700. Our OUTPERFORM rating is on the back of improving low end consumption which is driven by government programmes.
Risk: The risks to our Rp8,700 target price and OUTPERFORM rating for Indofood Sukses Makmur include: (1) competition from both existing and new players, (2) fluctuation of commodity prices, (3) completion of new capacity, (4) Indonesia macro-economic stability, (5) fluctuation of exchange rate, and (6) regulatory risks.
Target Price and Rating Valuation Methodology and Risks: (12 months) for Matahari Department Store (LPPF.JK)
Method: Our target price of Rp19,400 for Matahari Department Store is based on a multiple valuation. The target price is based on 26x FY16E price to earnings ratio (P/E), which is its historical three-year average, a premium to regional peers due to Matahari's higher and more resilient earnings. We have an OUTPERFORM rating on the company on the back of better position from forex pressure, manageable working capital days, healthy balance sheet, and resilient middle-income target market.
Risk: Key risks to our Rp19,400 target price and OUTPERFORM rating for Matahari Department Store include competition from both existing and incoming players, risk of meeting expansion target, regulatory risks and macro risks of Indonesia.
Target Price and Rating Valuation Methodology and Risks: (12 months) for PT Bank Tabungan Pensiunan Nasional Tbk (BTPN.JK)
Method: Our target price of Rp3,500/share for BTPN is derived based on Gordon's growth model, assuming a normalised return of equity (ROE) of 15-16%, beta of 1.2x, risk-free rate of 8% and market risk premium of 5.0%, implying 1.3x 2016E price-to-book ratio (P/B) and 9.5x 2016E price-to-earnings ratio (P/E). The bank should be one of the biggest beneficiaries next year when BI cuts rates. It earns the highest ROA among the small four banks. Hence, we have an OUTPERFORM rating.
Risk: Risks to our target price of Rp3,500/share and OUTPERFORM rating for BTPN include: (1) longer-than-anticipated high interest rates, (2) faster-than-expected recovery of the economy; (3) significant changes in global sentiment; (4) significant changes in the public's confidence in the bank; (5) risks relating to Indonesia, including macroeconomic, political and social risks; (6) currency risks.
Target Price and Rating Valuation Methodology and Risks: (12 months) for PT Summarecon Agung Tbk (SMRA.JK)
Method: Our target price of Rp1,960 for PT Summarecon Agung Tbk is based on the 40% discount to the RNAV of the company (a standard deviation away to its long-term average). The target price implies 22.1x 15E P/E. We have an OUTPERFORM rating on the back of potential policy rate cuts by the Central Bank, as well as improving demand to support pre-sales.
Risk: We recognise the strong track record of PT Summarecon Agung Tbk in property development and we are indeed positive on the long-term outlook of the company. Risks to our target price of Rp1,960 (based on 40% discount to the company's RNAV) for the company include macroeconomic risks such as changes in interest rates, inflation, regulatory risk coming from current government. Risks to our OUTPERFORM rating include further delay in interest rate cut and weak pre-sales progression.
Target Price and Rating Valuation Methodology and Risks: (12 months) for PT Telkom (Telekomunikasi Indo.) (TLKM.JK)
Method: Our target price of Rp3,800 for PT Telkom is based on discounted cash flow (DCF) analysis, based on an estimated 9.9% cost of capital and a 2.5% terminal growth rate for fixed line, 3.9% for cellular. We value Telkom's fixed-line business at Rp828 and its 65% holding in its cellular subsidiary, Telkomsel, at Rp2,899share. At Rp3,800, Telkom would trade at an enterprise value-to-earnings before interest, taxes, depreciation, and amortisation (EV/EBITDA) multiple of 9.5x for FY16E (using proportional consolidation), lower than the regional integrated average and Telkom still enjoys higher growth in a market with lower penetration. We rate the stock OUTPERFORM, due to the valuation.
Risk: Telkom's key asset, Telkomsel, is primarily a cellular operator within an eight-player market. The risks that may impede achievement of our target price of Rp3,800 and OUTPERFORM rating for PT Telkom on the cellular side are: (1) either faster-than-expected, or slower-than-expected growth in the cellular market, from the current level; (2) the prospect that competitors take a larger or smaller proportion of

05 April 2016
Indonesia Consumer Survey 2016 124
the market share of net additions; (3) that capex forecasts prove higher or lower than expected; and (4) that competition leads to higher or lower attrition of revenue per user than expected. Key risks to our target price on the fixed-line side are: (1) faster-or-slower cannibalisation of voice revenue per line by cellular competition; (2) faster-or-slower rollout of broadband lines than expected; (3) better success in reducing employment-related costs; and (4) better success in lowering capex requirements.
Target Price and Rating Valuation Methodology and Risks: (12 months) for Pt Link Net Tbk (LINK.JK)
Method: Our discounted cash flow (DCF) analysis, based on an estimated 10.8% weighted average cost of capital and a 3.0% terminal growth rate, supports our Rp8,300 target price for Link Net. At Rp8,300, Link Net would trade at an FY16 enterprise value-to-earnings before interest, taxes, depreciation, and amortisation (EV/EBITDA) multiple of 14.0x. We rate the stock OUTPERFORM, due to the valuation and on the back of low fixed broadband penetration in Indonesia and benign industry competition. .
Risk: Risks to our Rp8,300 target price and OUTPERFORM rating for Link Net: A well-capitalised new entrant player, rolling out competing cable or iPTV infrastructure in the same areas, is arguably the greatest risk. This would likely result in lower ARPU, lower EBITDA margins and sharply lower ROIC. However, the new entrant would also likely experience very low returns, and so establishing a 'first mover' advantage is critical to Link Net's business model. There are also economic risks, regulatory risks (licences are required for broadband and Pay TV) and risks over network rollout and operations which need to be managed carefully.
Target Price and Rating Valuation Methodology and Risks: (12 months) for Siloam International Hospitals (SILO.JK)
Method: Our target price of Rp13,000 for Siloam International Hospitals is derived using DCF (discounted cash flow) methodology. We assume a weighted average cost of capital (WACC) of 14.6% assuming a risk-free rate of 8.0%, beta of 0.95x, a 12% average cost of debt and a 10% target debt-equity ratio. Looking beyond the near-term growth and margin issues, Siloam is probably one of the best growth stories in the region. Maintain OUTPERFORM
Risk: Risks that could impede achievement of our target price of Rp13,000 and OUTPERFORM rating for Siloam International Hospitals include: (1) execution risk (ability to sustainably operate a big network and deliver on expansion plans), (2) regulation (unforeseen and detrimental changes to the regulatory framework), and (3) competition (from operators both in Indonesia and neighbouring countries).
Target Price and Rating Valuation Methodology and Risks: (12 months) for Tiphone Mobile Indonesia (TELE.JK)
Method: Our target price of Rp900 for Tiphone Mobile Indonesia is based on 14x FY16 P/E (price-to-earnings), a 30% discount to weighted average Indonesia consumer and telco names. We have an OUTPERFORM rating on the company as we like its resilient voucher business which has been showing high sales growth and stable margins. Voucher sales proportion to revenue is expected to rise, leaving the handset business as complimentary only.
Risk: Key risks to our Rp900 target price and OUTPERFORM rating for Tiphone Mobile Indonesia include: (1) growth in the Telkomsel vouchers business, (2) volatility in handset margins, (3) high churn rate of Indonesia mobile subscribers, (4) its reliance on third party principal for products, (5) competition, (6) regulatory risk, and (7) Indonesia macro stability risk
Please refer to the firm's disclosure website at https://rave.credit-suisse.com/disclosures for the definitions of abbreviations typically used in the target price method and risk sections.
See the Companies Mentioned section for full company names
The subject company (ICBP.JK, INDF.JK, LPPF.JK, SMRA.JK, LINK.JK, BTPN.JK, SILO.JK, BMRI.JK, BDMN.JK, BBNI.JK, BBCA.JK, HMSP.JK, KINO.JK, UNVR.JK, BSDE.JK, CTRA.JK, ERAA.JK, ASRI.JK, MAPI.JK, TBIG.JK, ISAT.JK, 7203.T, 7267.T, 7262.T, BMWG.DE) currently is, or was during the 12-month period preceding the date of distribution of this report, a client of Credit Suisse.
Credit Suisse provided investment banking services to the subject company (ICBP.JK, INDF.JK, LINK.JK, BTPN.JK, SILO.JK, BMRI.JK, BDMN.JK, BBNI.JK, HMSP.JK, KINO.JK, UNVR.JK, BSDE.JK, BMWG.DE) within the past 12 months.
Credit Suisse provided non-investment banking services to the subject company (BMWG.DE) within the past 12 months
Credit Suisse has managed or co-managed a public offering of securities for the subject company (BDMN.JK, HMSP.JK, KINO.JK, BMWG.DE) within the past 12 months.
Credit Suisse has received investment banking related compensation from the subject company (ICBP.JK, INDF.JK, LINK.JK, BTPN.JK, SILO.JK, BMRI.JK, BDMN.JK, BBNI.JK, HMSP.JK, KINO.JK, UNVR.JK, BSDE.JK, BMWG.DE) within the past 12 months
Credit Suisse expects to receive or intends to seek investment banking related compensation from the subject company (ICBP.JK, INDF.JK, LPPF.JK, SMRA.JK, LINK.JK, BTPN.JK, TELE.JK, SILO.JK, BMRI.JK, BBRI.JK, BDMN.JK, BBNI.JK, BBCA.JK, HMSP.JK, KINO.JK, GGRM.JK, UNVR.JK, MNCN.JK, PWON.JK, BSDE.JK, CTRA.JK, ERAA.JK, ASRI.JK, MAPI.JK, TBIG.JK, ISAT.JK, 7203.T, 7267.T, 7262.T, 7201.T, 7272.T, BMWG.DE) within the next 3 months.

05 April 2016
Indonesia Consumer Survey 2016 125
Credit Suisse has received compensation for products and services other than investment banking services from the subject company (BMWG.DE) within the past 12 months
As of the date of this report, Credit Suisse makes a market in the following subject companies (7203.T, 7267.T, 7201.T).
Credit Suisse may have interest in (TLKM.JK, ASII.JK, ICBP.JK, INDF.JK, LPPF.JK, SMRA.JK, LINK.JK, BTPN.JK, TELE.JK, SILO.JK, BJBR.JK, BMRI.JK, BBRI.JK, BDMN.JK, BBNI.JK, BBCA.JK, HMSP.JK, KINO.JK, MIKA.JK, GGRM.JK, KLBF.JK, UNVR.JK, MNCN.JK, SCMA.JK, ACES.JK, PWON.JK, BSDE.JK, CTRA.JK, MPPA.JK, ERAA.JK, RALS.JK, ASRI.JK, MAPI.JK, TOWR.JK, TBIG.JK, ISAT.JK, BBTN.JK)
Credit Suisse has a material conflict of interest with the subject company (BDMN.JK) . Credit Suisse is one of the joint financial advisors to DBS Group Holdings Limited in relation to the proposed acquisition of PT Bank Danamon Indonesia Tbk.
Credit Suisse has a material conflict of interest with the subject company (TOWR.JK) . Credit Suisse is financial advisor to iForte Solusi Infotek (private) relating to the acquisition by PT Profesional Telekomunikasi Indonesia, a 99.999% owned subsidiary of PT Sarana Menara Nunsatara Tbk.
For other important disclosures concerning companies featured in this report, including price charts, please visit the website at https://rave.credit-suisse.com/disclosures or call +1 (877) 291-2683.
Important Regional Disclosures
Singapore recipients should contact Credit Suisse AG, Singapore Branch for any matters arising from this research report.
The analyst(s) involved in the preparation of this report may participate in events hosted by the subject company, including site visits. Credit Suisse does not accept or permit analysts to accept payment or reimbursement for travel expenses associated with these events.
Restrictions on certain Canadian securities are indicated by the following abbreviations: NVS--Non-Voting shares; RVS--Restricted Voting Shares; SVS--Subordinate Voting Shares.
Individuals receiving this report from a Canadian investment dealer that is not affiliated with Credit Suisse should be advised that this report may not contain regulatory disclosures the non-affiliated Canadian investment dealer would be required to make if this were its own report.
For Credit Suisse Securities (Canada), Inc.'s policies and procedures regarding the dissemination of equity research, please visit https://www.credit-suisse.com/sites/disclaimers-ib/en/canada-research-policy.html.
The following disclosed European company/ies have estimates that comply with IFRS: (7201.T, BMWG.DE).
Credit Suisse has acted as lead manager or syndicate member in a public offering of securities for the subject company (TLKM.JK, LINK.JK, SILO.JK, BMRI.JK, BDMN.JK, HMSP.JK, KINO.JK, 7267.T, BMWG.DE) within the past 3 years.
As of the date of this report, Credit Suisse acts as a market maker or liquidity provider in the equities securities that are the subject of this report.
Principal is not guaranteed in the case of equities because equity prices are variable.
Commission is the commission rate or the amount agreed with a customer when setting up an account or at any time after that.
To the extent this is a report authored in whole or in part by a non-U.S. analyst and is made available in the U.S., the following are important disclosures regarding any non-U.S. analyst contributors: The non-U.S. research analysts listed below (if any) are not registered/qualified as research analysts with FINRA. The non-U.S. research analysts listed below may not be associated persons of CSSU and therefore may not be subject to the NASD Rule 2711 and NYSE Rule 472 restrictions on communications with a subject company, public appearances and trading securities held by a research analyst account.
PT Credit Suisse Securities Indonesia ...................................................................................................................... Ella Nusantoro ; Priscilla Tjitra
For Credit Suisse disclosure information on other companies mentioned in this report, please visit the website at https://rave.credit-suisse.com/disclosures or call +1 (877) 291-2683.

05 April 2016
Indonesia Consumer Survey 2016 126
References in this report to Credit Suisse include all of the subsidiaries and affiliates of Credit Suisse operating under its investment banking division. For more information on our structure, please use the following link: https://www.credit-suisse.com/who-we-are This report may contain material that is not directed to, or intended for distribution to or use by, any person or entity who is a citizen or resident of or located in any locality, state, country or other jurisdiction where such distribution, publication, availability or use would be contrary to law or regulation or which would subject Credit Suisse AG or its affiliates ("CS") to any registration or licensing requirement within such jurisdiction. All material presented in this report, unless specifically indicated otherwise, is under copyright to CS. None of the material, nor its content, nor any copy of it, may be altered in any way, transmitted to, copied or distributed to any other party, without the prior express written permission of CS. All trademarks, service marks and logos used in this report are trademarks or service marks or registered trademarks or service marks of CS or its affiliates. The information, tools and material presented in this report are provided to you for information purposes only and are not to be used or considered as an offer or the solicitation of an offer to sell or to buy or subscribe for securities or other financial instruments. CS may not have taken any steps to ensure that the securities referred to in this report are suitable for any particular investor. CS will not treat recipients of this report as its customers by virtue of their receiving this report. The investments and services contained or referred to in this report may not be suitable for you and it is recommended that you consult an independent investment advisor if you are in doubt about such investments or investment services. Nothing in this report constitutes investment, legal, accounting or tax advice, or a representation that any investment or strategy is suitable or appropriate to your individual circumstances, or otherwise constitutes a personal recommendation to you. CS does not advise on the tax consequences of investments and you are advised to contact an independent tax adviser. Please note in particular that the bases and levels of taxation may change. Information and opinions presented in this report have been obtained or derived from sources believed by CS to be reliable, but CS makes no representation as to their accuracy or completeness. CS accepts no liability for loss arising from the use of the material presented in this report, except that this exclusion of liability does not apply to the extent that such liability arises under specific statutes or regulations applicable to CS. This report is not to be relied upon in substitution for the exercise of independent judgment. CS may have issued, and may in the future issue, other communications that are inconsistent with, and reach different conclusions from, the information presented in this report. Those communications reflect the different assumptions, views and analytical methods of the analysts who prepared them and CS is under no obligation to ensure that such other communications are brought to the attention of any recipient of this report. Some investments referred to in this report will be offered solely by a single entity and in the case of some investments solely by CS, or an associate of CS or CS may be the only market maker in such investments. Past performance should not be taken as an indication or guarantee of future performance, and no representation or warranty, express or implied, is made regarding future performance. Information, opinions and estimates contained in this report reflect a judgment at its original date of publication by CS and are subject to change without notice. The price, value of and income from any of the securities or financial instruments mentioned in this report can fall as well as rise. The value of securities and financial instruments is subject to exchange rate fluctuation that may have a positive or adverse effect on the price or income of such securities or financial instruments. Investors in securities such as ADR's, the values of which are influenced by currency volatility, effectively assume this risk. Structured securities are complex instruments, typically involve a high degree of risk and are intended for sale only to sophisticated investors who are capable of understanding and assuming the risks involved. The market value of any structured security may be affected by changes in economic, financial and political factors (including, but not limited to, spot and forward interest and exchange rates), time to maturity, market conditions and volatility, and the credit quality of any issuer or reference issuer. Any investor interested in purchasing a structured product should conduct their own investigation and analysis of the product and consult with their own professional advisers as to the risks involved in making such a purchase. Some investments discussed in this report may have a high level of volatility. High volatility investments may experience sudden and large falls in their value causing losses when that investment is realised. Those losses may equal your original investment. Indeed, in the case of some investments the potential losses may exceed the amount of initial investment and, in such circumstances, you may be required to pay more money to support those losses. Income yields from investments may fluctuate and, in consequence, initial capital paid to make the investment may be used as part of that income yield. Some investments may not be readily realisable and it may be difficult to sell or realise those investments, similarly it may prove difficult for you to obtain reliable information about the value, or risks, to which such an investment is exposed. This report may provide the addresses of, or contain hyperlinks to, websites. Except to the extent to which the report refers to website material of CS, CS has not reviewed any such site and takes no responsibility for the content contained therein. Such address or hyperlink (including addresses or hyperlinks to CS's own website material) is provided solely for your convenience and information and the content of any such website does not in any way form part of this document. Accessing such website or following such link through this report or CS's website shall be at your own risk. This report is issued and distributed in Europe (except Switzerland) by Credit Suisse Securities (Europe) Limited, One Cabot Square, London E14 4QJ, England, which is authorised by the Prudential Regulation Authority and regulated by the Financial Conduct Authority and the Prudential Regulation Authority. This report is issued and distributed in Europe (except Switzerland) by Credit Suisse International, One Cabot Square, London E14 4QJ, England, which is authorised by the Prudential Regulation Authority and regulated by the Financial Conduct Authority and the Prudential Regulation Authority. This report is being distributed in Germany by Credit Suisse Securities (Europe) Limited Niederlassung Frankfurt am Main regulated by the Bundesanstalt fuer Finanzdienstleistungsaufsicht ("BaFin"). This report is being distributed in the United States and Canada by Credit Suisse Securities (USA) LLC; in Switzerland by Credit Suisse AG; in Brazil by Banco de Investimentos Credit Suisse (Brasil) S.A or its affiliates; in Mexico by Banco Credit Suisse (México), S.A. (transactions related to the securities mentioned in this report will only be effected in compliance with applicable regulation); in Japan by Credit Suisse Securities (Japan) Limited, Financial Instruments Firm, Director-General of Kanto Local Finance Bureau (Kinsho) No. 66, a member of Japan Securities Dealers Association, The Financial Futures Association of Japan, Japan Investment Advisers Association, Type II Financial Instruments Firms Association; elsewhere in Asia/ Pacific by whichever of the following is the appropriately authorised entity in the relevant jurisdiction: Credit Suisse (Hong Kong) Limited, Credit Suisse Equities (Australia) Limited, Credit Suisse Securities (Thailand) Limited, regulated by the Office of the Securities and Exchange Commission, Thailand, having registered address at 990 Abdulrahim Place, 27th Floor, Unit 2701, Rama IV Road, Silom, Bangrak, Bangkok 10500, Thailand, Tel. +66 2614 6000, Credit Suisse Securities (Malaysia) Sdn Bhd, Credit Suisse AG, Singapore Branch, Credit Suisse Securities (India) Private Limited (CIN no. U67120MH1996PTC104392) regulated by the Securities and Exchange Board of India as Research Analyst (registration no. INH 000001030) and as Stock Broker (registration no. INB230970637; INF230970637; INB010970631; INF010970631), having registered address at 9th Floor, Ceejay House, Dr.A.B. Road, Worli, Mumbai - 18, India, T- +91-22 6777 3777, Credit Suisse Securities (Europe) Limited, Seoul Branch, Credit Suisse AG, Taipei Securities Branch, PT Credit Suisse Securities Indonesia, Credit Suisse Securities (Philippines ) Inc., and elsewhere in the world by the relevant authorised affiliate of the above. Credit Suisse (Hong Kong) Limited ("CSHK") is licensed and regulated by the Securities and Futures Commission of Hong Kong under the laws of Hong Kong, which differ from Australian laws. CSHKL does not hold an Australian financial services licence (AFSL) and is exempt from the requirement to hold an AFSL under the Corporations Act 2001 (the Act) under Class Order 03/1103 published by the ASIC in respect of financial services provided to Australian wholesale clients (within the meaning of section 761G of the Act). Research on Taiwanese securities produced by Credit Suisse AG, Taipei Securities Branch has been prepared by a registered Senior Business Person. Research provided to residents of Malaysia is authorised by the Head of Research for Credit Suisse Securities (Malaysia) Sdn Bhd, to whom they should direct any queries on +603 2723 2020. This report has been prepared and issued for distribution in Singapore to institutional investors, accredited investors and expert investors (each as defined under the Financial Advisers Regulations) only, and is also distributed by Credit Suisse AG, Singapore branch to overseas investors (as defined under the Financial Advisers Regulations). By virtue of your status as an institutional investor, accredited investor, expert investor or overseas investor, Credit Suisse AG, Singapore branch is exempted from complying with certain compliance requirements under the Financial Advisers Act, Chapter 110 of Singapore (the "FAA"), the Financial Advisers Regulations and the relevant Notices and Guidelines issued thereunder, in respect of any financial advisory service which Credit Suisse AG, Singapore branch may provide to you. This information is being distributed by Credit Suisse AG (DIFC Branch), duly licensed and regulated by the Dubai Financial Services Authority (“DFSA”). Related financial services or products are only made available to Professional Clients or Market Counterparties, as defined by the DFSA, and are not intended for any other persons. Credit Suisse AG (DIFC Branch) is located on Level 9 East, The Gate Building, DIFC, Dubai, United Arab Emirates. This research may not conform to Canadian disclosure requirements. In jurisdictions where CS is not already registered or licensed to trade in securities, transactions will only be effected in accordance with applicable securities legislation, which will vary from jurisdiction to jurisdiction and may require that the trade be made in accordance with applicable exemptions from registration or licensing requirements. Non-U.S. customers wishing to effect a transaction should contact a CS entity in their local jurisdiction unless governing law permits otherwise. U.S. customers wishing to effect a transaction should do so only by contacting a representative at Credit Suisse Securities (USA) LLC in the U.S. Please note that this research was originally prepared and issued by CS for distribution to their market professional and institutional investor customers. Recipients who are not market professional or institutional investor customers of CS should seek the advice of their independent financial advisor prior to taking any investment decision based on this report or for any necessary explanation of its contents. This research may relate to investments or services of a person outside of the UK or to other matters which are not authorised by the Prudential Regulation Authority and regulated by the Financial Conduct Authority and the Prudential Regulation Authority or in respect of which the protections of the Prudential Regulation Authority and Financial Conduct Authority for private customers and/or the UK compensation scheme may not be available, and further details as to where this may be the case are available upon request in respect of this report. CS may provide various services to US municipal entities or obligated persons ("municipalities"), including suggesting individual transactions or trades and entering into such transactions. Any services CS provides to municipalities are not viewed as "advice" within the meaning of Section 975 of the Dodd-Frank Wall Street Reform and Consumer Protection Act. CS is providing any such services and related information solely on an arm's length basis and not as an advisor or fiduciary to the municipality. In connection with the provision of the any such services, there is no agreement, direct or indirect, between any municipality (including the officials, management, employees or agents thereof) and CS for CS to provide advice to the municipality. Municipalities should consult with their financial, accounting and legal advisors regarding any such services provided by CS. In addition, CS is not acting for direct or indirect compensation to solicit the municipality on behalf of an unaffiliated broker, dealer, municipal securities dealer, municipal advisor, or investment adviser for the purpose of obtaining or retaining an engagement by the municipality for or in connection with Municipal Financial Products, the issuance of municipal securities, or of an investment adviser to provide investment advisory services to or on behalf of the municipality. If this report is being distributed by a financial institution other than Credit Suisse AG, or its affiliates, that financial institution is solely responsible for distribution. Clients of that institution should contact that institution to effect a transaction in the securities mentioned in this report or require further information. This report does not constitute investment advice by Credit Suisse to the clients of the distributing financial institution, and neither Credit Suisse AG, its affiliates, and their respective officers, directors and employees accept any liability whatsoever for any direct or consequential loss arising from their use of this report or its content. Principal is not guaranteed. Commission is the commission rate or the amount agreed with a customer when setting up an account or at any time after that.
Copyright © 2016 CREDIT SUISSE AG and/or its affiliates. All rights reserved.
Investment principal on bonds can be eroded depending on sale price or market price. In addition, there are bonds on which investment principal can be eroded due to changes in redemption amounts. Care is required when investing in such instruments. When you purchase non-listed Japanese fixed income securities (Japanese government bonds, Japanese municipal bonds, Japanese government guaranteed bonds, Japanese corporate bonds) from CS as a seller, you will be requested to pay the purchase price only.
CS0899_new.doc